
A STOCHASTIC PROCESS IN MODELING AND FORECASTING OF ONION PRODUCTION IN INDIA
1 1
Dr.SameerabanuP,Dr.C.Sekhar1NalandaCollegeofAgriculture,M.R.Palayam,Tiruchirappalli,India.
ABSTRACT
Thisworkfocusesonmodelingandanalysisofcropyieldoverspaceandtime.Specifically,theonion
datasetwasused.Thisstudyonestimatingthefutureyield ofonionsinmajorproducingstatesinIndia.Toachievethis,weappliedtimeseriesononionyielddatarecordedfrom1978to2020,asperavailabilityfromthewebsite ofMinistryofAgriculture,GovernmentofIndia.ByusingSPSSsoftware,Thedataareanalyzedusingtheautoregressiveintegratedmovingaverage(ARIMA)model tobestfitthemodel.Selectedbestmodelswereusedtoestimateonionyield.Theselectionofasuitablemodelrequiresdeterminingtheefficiencyofdifferentmodels inpredictingfutureoutcomesandselectingthemostsuitablemodelforthepredictionwork.TodevelopasuitableforecastARIMAmodelforagriculturaldata.To studythepredictiveabilityoftheunivariateARIMAmodeltosuggestanoptimalmodel,thebestpredictivemodelwasselected.

KEYWORDS:ARIMA,ACF,PACF,Onionforecast.
INTRODUCTION:
Farmingsectorfacesseveralchallengesfromlandpreparationtoharvestingand marketing of farm produce. The consumers of farm output though are healthy andwealthy;theyareabletobargaintothelowestpricefortheoutputrealized. Thetradersarehavingcollusionandtheirassociationisstrongenoughtobargain fromthefarmers.Butthefarmersandthefarmerorganizationsareweakintheir associationandcannotbeunifiedtoestablishanorganizationtothefullestspirit tocommandpricefortheirproduce.Thoughtherewerefewfarmerorganizations inourcountry,theycannotraisetotheexpectedlevelinachievingordistributing the farm produce. During the time of harvest, supply will be excess and the demand will be less and hence proper storage and distribution is a must. State Governments took effort to procure the principal crop outputs particularly in respect of cereals like rice and cannot procure other farm produce timely and hence balancing the area under crop and its output production becomes much moreimportant.Forthat,informationonpriceavailability,demandforthatproduce and expected price for the output by the farmers are to be provided in advancepriortothecropseason.Inthisrespect,forecastingisthetoolthatwill helptopredicttheyieldandpriceinadvance.Forecastingreferstothepracticeof predictingwhatwillhappeninthefuturebytakingintoconsiderationeventsin thepastandpresent.Basically,itisadecision-makingtoolthathelpsbusinesses copewiththeimpactofthefuture’suncertaintybyexamininghistoricaldataand trends.Itisaplanningtoolthatenablesbusinessestocharttheirnextmovesand createbudgetsthatwillhopefullycoverwhateveruncertaintiesmayoccur(CFI, 2022).ThisstudyistheonethataimedatforecastingtheyieldofonioninIndia.
METHODOLOGY:
ThisstudyaimedatforecastingtheyieldofOnioninIndia.Forthatthebasisof forecastingistobediscussedtodevelopanoverallidea.Thefirststepintheprocessisdevelopingthebasisoftheinvestigationandidentifyingwherethebusinessiscurrentlypositionedinthemarket.
ForecastingMethods:
Businesseschoosebetweentwobasicmethodswhentheywanttopredictwhat canpossiblyhappeninthefuture,namely,qualitativeandquantitativemethods.
1. QualitativeMethod: Otherwiseknownasthejudgmentalmethod,qualitative forecasting offers subjective results, as it is comprised of personal judgments by experts or forecasters. Forecasts are often biased because they are based on the expert's knowledge, intuition, and experience, and rarelyondata,makingtheprocessnon-mathematical.
Oneexampleiswhenapersonforecaststheoutcomeofafinalsgameinthe NBA,which,ofcourse,isbasedmoreonpersonalmotivationandinterest. Theweaknessofsuchamethodisthatitcanbeinaccurate.
2. QuantitativeMethod:Thequantitativemethodofforecastingisamathematical process, making it consistent and objective. It steers away from basingtheresultsonopinionandintuition,insteadutilizinglargeamounts ofdataandfiguresthatareinterpreted.
FeaturesofForecasting:
Herearesomeofthefeaturesofmakingaforecast: Ÿ Forecastsarecreatedtopredictthefuture,makingthemimportantforplanning.
Ÿ
Ÿ
Forecastsarebasedonopinions,intuition,guesses,aswellasonfacts,figures,andotherrelevantdata.Allofthefactorsthatgointocreatingaforecastreflecttosomeextentwhathappenedwiththebusinessinthepastand whatisconsideredlikelytooccurinthefuture.
Mostbusinessesusethequantitativemethod,particularlyinplanningand budgetingactivities
CollectionofData:
The secondary data was collected from the website of Ministry ofAgriculture, GovernmentofIndia.Onionproductionoveraperiodoftimewasgatheredfrom the above website and is analyzed usingARIMAmodels. By using SPSS software, the data was analyzed to fit the best model using an autoregressive integratedmovingaverage(ARIMA)model.Theselectedbestmodelswereusedto forecasttheonionyield.
ARIMAModeling:
In general, anARIMAmodel is characterized by the notationARIMA(p,d,q) where,p,dandqdenoteordersofautoregressionintegration(differencing)and movingaveragerespectively Timeseriesisalinearfunctionofpastactualvalues andrandomshocks.Forinstance,givenatimeseriesprocess{Yi},afirstorder auto-regressive process is denoted by ARIMA (1,0,0) or simply AR(1) and is givenby Yi=μ+φ1Yi-1+εt
Stationary:
Astationary time series does not depend on the time when a particular point is observed.Eachpointintimehasavaluethatisnotdependantonanotherpointin time,suchaswhitenoise.Theplotsbelowaresomeexamplesofstationarytime series.Otherexamplesmayincludecyclicdatawithnon-consistentperiods.
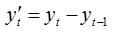
Differencing: Differencing is a time series transformation that attempts to eliminate timedependentfactorsfromthetimeseriessuchastrendandseasonality Therearedifferent orders of differencing; the equation below shows the first-order difference.Itissimplythedifferencebetweenthecurrentandpreviousobservation:
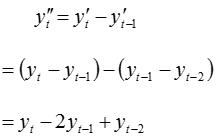
Afterthefirst-orderdifference,ifthetimeseriesisstillnotstationary,differencingoncemorewillgiveyouthesecond-orderdifferencing.
Theorderofthedifferencingcanbedefinedinthedparameterofthemodel.
AutoregressiveModels: Anautoregressive(AR)model,definedasbeingtheregressionofit,issimplya
multiple linear regression having the previous time steps as parameters to the function.Itusuallyperformsbetteronstationarytimeseriesdata.
TheorderoftheARmodel,pdefinesthenumberofprevioustimestepsthatare accountedforinthecurrentobservation.Forexample,AR(1)accountsfortime stept-1forthecurrentobservation,AR(2)accountsfortimestepst-1andt-2.
MovingAverageModels:
UnlikeARmodels,MovingAverage(MA)modelspredictthenextstepbasedon theerrorsoftheprevioussteps.
orcanbewrittenas,
TheorderoftheMAmodel,qissimilartoAR's.Alargerqmeansthatittakesinto account of more number of previous time steps. ARIMA By combining auto regression,differencingandmovingaverage,wegetanARIMA(p,d,q)model. p,d,qarerespectiveparametersforAR,differencingandMA.
Here,Cissomeconstant+linearcombinationofthepreviousp+linearcombinationofthepreviousqerrorterms+theerrorthistime(ɛ). isthedifferenced t y ’ t series.Itneedstobeintegrated(oppositeofdifferencing)togettheactualseries.
RESULTSANDDISCUSSION:
Usingtheabovemodels,thedataoutlinedinTable1wasanalysedandtheresults arepresentedinthesubsequentheadings.
Table1:AreaandProductivityofOnioninIndia
S.No. Year YieldinKgs./Hectare AreainMillionHectares
1. 1978 10403 00.21 2. 1979 10232 00.24 3. 1980 9961 00.25 4. 1981 10562 00.25 5. 1982 10330 00.24 6. 1983 9982 00.27 7. 1984 11139 00.28 8. 1985 10202 00.28 9. 1986 9659 00.26 10. 1987 9857 00.27 11. 1988 10620 00.32 12. 1989 10176 00.30 13. 1990 10686 00.30 14. 1991 11088 00.32 15. 1992 10791 00.32 16. 1993 10902 00.37 17. 1994 10661 00.38 18. 1995 10316 00.40 19. 1996 10348 00.40 20. 1997 9091 00.40 21. 1998 11391 00.47 22. 1999 9932 00.49 23. 2000 10786 00.42 24. 2001 10686 00.45 25. 2002 9912 00.42 26. 2003 11784 00.50 27. 2004 11718 00.55 28. 2005 13118 00.66 29. 2006 12655 00.70 30. 2007 12974 00.70 31. 2008 16260 00.83 32. 2009 16079 00.76 33. 2010 14210 01.06 34. 2011 16109 01.09 35. 2012 15989 01.05 36. 2013 16120 01.20
37. 2014 16111 01.17
38. 2015 15857 01.32 39. 2016 17178 01.31 40. 2017 18103 01.28 41. 2018 18712 01.22 42. 2019 18875 01.43 43. 2020 18563 01.31
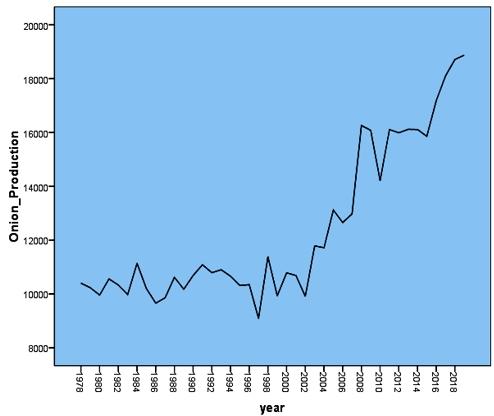
Figure:1.1:TheMagnitudeofYieldofOnionindifferentDecadesof Time
ModelingandForecasting:
Ÿ Toperformanactualforecastandassessqualityofforecasts.
Identification:
Ÿ ThegraphsofACFandPACFaredrawnforalltheobservedvariables,tothe fittedmodels.
SequencePlot:
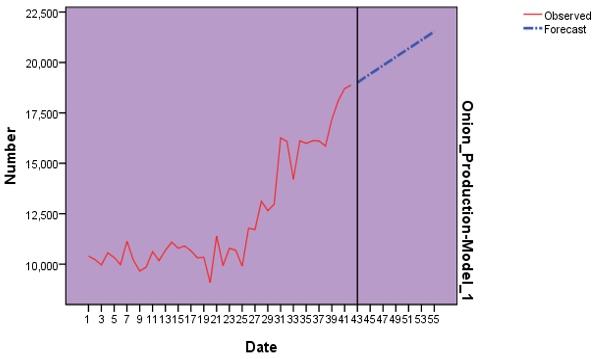
Theplotteddiagramaboveindicatedthatoveraperiodoftime,theyieldofonion perhaisfoundtobemarginallyincreasinguptotheyear2000andlateronthe yield of onion and its magnitude found to be steadily increasing in an upward direction indicating that the onion production technology would have contributedtothehigheryieldoveraperiodoftime.Releaseofnewhybridsinonionand itstechnologymightbethereasonfortheupwardswing.Theinvolvementofhorticulturistindevelopingonionhybridandtheroleofextensionfunctionariesin takingthetechnologytothefarmlevelarethemainreasonsforadoptionoftechnologyandanupwardyieldrealization.
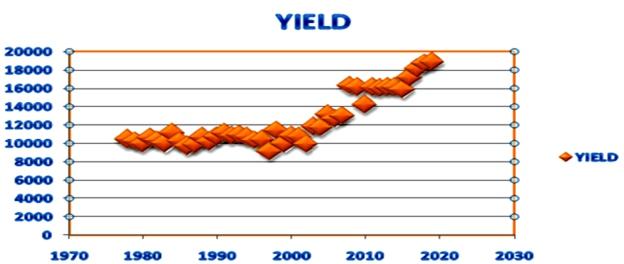
Usingthissequencediagram,theanalysishaspredictedtheyieldfortheremainingyearsandisdiscussedsuitably
Table2:AutocorrelationandPartialAutocorrelationCorrelogramsfor nonstationary
Figure:1.2:GraphdelineatingNonStationaryinOnionYield Log Autocorrelations Std.Error PartialAutocorrelations Std.Error 1 .873 .149 .873 .154 2 .786 .147 .100 .154 3 .713 .145 .035 .154 4 .629 .143 -.067 .154 5 .580 .141 .092 .154
6 .492 .140 -.165 .154
7 .429 .138 .033 .154
8 .362 .136 -.068 .154
9 .268 .134 -.134 .154
10 .223 .132 .078 .154
11 .118 .130 -.246 .154
12 .008 .127 -.162 .154
13 -.023 .125 .220 .154
14 -.066 .123 .016 .154
15 -.121 .121 -.185 .154
16 -.150 .119 .136 .154
CorrelogramPlot:
Figure:2.1:SignificanceofCorrelogramPlots
Sincetheabovecorrelogramindicatesnon-stationary,maximumlagorder16.
CorrelogramPlots:
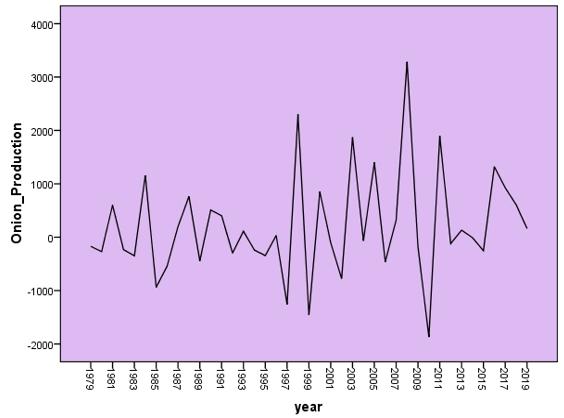
Figure:2.2:TheSequence plotofStationarity
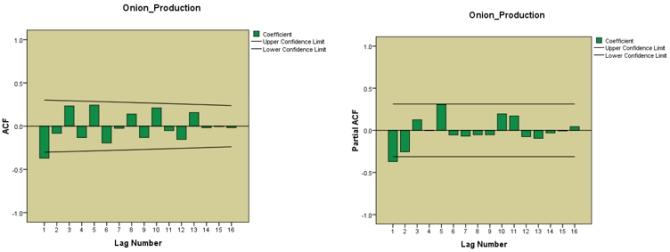
Table:2A:TheResultsofAutocorrelationandPartialAutocorrelations forstationary
Log Autocorrelations Std.Error PartialAutocorrelations Std.Error
1 -.370 .151 -.370 .156
2 -.083 .149 -.254 .156
3 .234 .147 .126 .156
4 -.132 .145 .000 .156
5 .244 .143 .306 .156
6 -.194 .141 -.054 .156
7 -.025 .139 -.068 .156
8 .140 .137 -.052 .156
9 -.131 .135 -.052 .156
10 .211 .133 .196 .156
11 -.051 .130 .171 .156 12 -.154 .128 -.075 .156 13 .158 .126 -.095 .156 14 -.018 .124 -.031 .156 15 -.005 .121 -.007 .156 16 -.018 .119 .044 .156
Figure:2.3:CorrelogramPlotsforOnionYield
Sincetheabove figureCorrelogramindicatesstationary,maximumlagorder16.
Forecast:
Inthissection,alreadydefinedmodelsareusedtoforecasttheOnionYieldfrom 1978-2020. Here also we perform the forecasting accuracy assessment at the endofthissession,comparingforecastwiththeactualdata.
ForecastModelStatistics:
Basedontheforecastingperformance,testingandestimatingresults,ARIMA(1, 1,1).TheresidualACFandPACFofARIMA(1,1,1)providesaslightlybetter result.WecanseethatACFandPACFofARIMA(1,1,1)hasaspikecrossingthe ±0.1boundaryatlag1,whilenothingiscrossingtheboundaryinACFandPACF ofARIMA(1,1,1).ItmeansthatARIMA(1,1,1)isslightlymorestable),which probablyprovidesbetterforecastingresults.
Table:3:ModelstatisticsforOnionYield
ModelStatistics Model Number of Predictors
ModelFit statistics Ljung-BoxQ(18) Number of Outliers StationaryRsquared Statistics DF Sig. OnionYieldModel_1 0 0.167 10.937 16 0.813 0
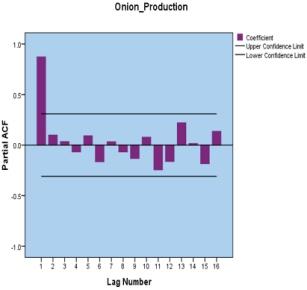
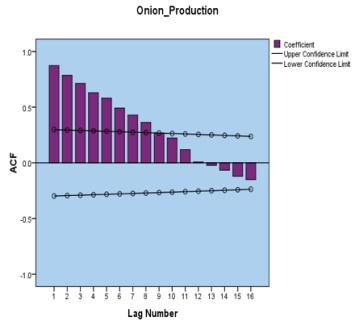
Table:4:ForecastforOnionYieldwithUpperControlandLower ControlLimits
Yearstowhich ForecastwasMade ForecastFigures ofYield/Ha UpperControl Limits LowerControl Limits 2020 19006 20902 17109 2021 19225 21402 17048 2022 19434 21904 16963 2023 19644 22371 16916 2024 19854 22817 16891 2025 20063 23244 16882 2026 20273 23658 16888 2027 20483 24060 16906 2028 20693 24453 16933 2029 20903 24837 16969 2030 21112 25213 17012 2031 21322 25583 17061 2032 21532 25947 17117
Figure:4.1ForecastedYieldofOnionanditsGraphicalSignature
Ÿ
Ÿ
Ÿ
ModelFit
FitStatistic Mean Minimum Maximum
StationaryR-squared 0.167 0.167 0.167 R-squared 0.902 0.902 0.902
RMSE 937.277 937.277 937.277
MAPE 5.665 5.665 5.665 MaxAPE 18.973 18.973 18.973 MAE 688.584 688.584 688.584 MaxAE 3.085E3 3084.933 3084.933
NormalizedBIC 13.958 13.958 13.958
Theasterisksbelowindicatethebest(thatis,minimized)valuesoftherespective informationcriteria,
Ÿ MAPE=MeanAbsolutePercentageError,
Ÿ RMSE=RootMeanSquareErrorandNormalized
Ÿ BIC=NormalizedBayesianInformationcriterion.
TheaboveanalysistellsustoidentifythemodelasARIMA(1,1,1)becauseallcriteriasignificant.OLSestimates,observations1978-2020,Rsquared=90.20% ourpredictionisaccurate.
GoodnessofFit:
Table5outlinedthedetailsofgoodnessoffitstatisticsfortheOnionYielddata. R-squared represents an estimate of the proportion of the total variation in the seriesthatisexplainedbythemodel.HeretheR2foundtobe90.20percentindicatesthatthe90percentofthevariationintheyieldwasexplainedbytheindependent variables included. Largest value (maximum value) indicates a more accuratepredictionanditmeansthatthemodeldoesanexcellentjobofexplaining the observed variations in the series. Mean Absolute Percentage Error (MAPE)forthemodelisameasureofhowmuchadependentseriesvariesfrom its model-predicted level. Root Mean Square Error (RMSE), indicates that the squarerootofmeansquareerrorisameasureofhowmuchadependentseriesvariesfromitsmodel-levelofprediction,expressedinthesameunitsasthedependentseries.Thismeasureisusefulforimaginingaworst-casescenariofortheforecastmodel.
SALIENTFINDINGS:
Ÿ ARIMA(1,1,1)wasfoundtobethebetterapplicablemodelfromwhichthe predictionsaremadefor2020-2032.
Ÿ ARIMAwas used for the reasons of its capabilities of making predictions using a time series data with various kinds of pattern and with autocorrelationsbetweenthesuccessivevaluesinthetimeseries.
The study was also tested statistically and validated the residuals (forecast errors).
ThefittedARIMAtimeseriesandresidualsareseemedtobenormallydistributedwithmean0andconstantvariance.Henceitcanbeconcludedthat the selected seasonal ARIMA (1,1,1) will provide an adequate model for interpretingandforecastinggoldpriceinIndia.
TheARIMA(1,1,1)modelpredictedindicatesanincreaseintheOnionYield fortheyearsselectedfortheforecaststudy
SUMMARYANDCONCLUSIONS:
In this research study, researcher analyzed and obtained the forecast of Onion Yield in India using ARIMA models. The result of the study conclude that ARIMA(1,1,1)modelisthemoreappropriatemodelforforecastingOnionYield inIndia. TheforecastmodelandtheforecastgraphthattheOnionYieldisrapidlyincreasingwiththepassageofyear Overall,wecanseethatARIMA(1,1,1) provideagoodfitforOnionYieldinIndia.Itsgivesafairlyaccuracyforecasting. However,althoughforecastfrom2020-2032arewithinthe95percentinterval, thegraphshowsthatthebluelineofactualdatahasgraduallymovingoutofthe confidenceinterval.
REFERENCES:
I. Box,G.E.P.,Jenkin,G.M.andReinse,G.C.1994.Thetimeseriesanalysis,forecastrding,andcontrol.3 ed,Prentice-Hall,EnglewoodCliffs,N.J.
II. Box,G.E.P andJenkin,G.M.1976.Time-SeriesofAnalysis,Forecasting,andControl.SamFrancisco,Holden-Day,California.theUSA.
III. Darekar,A.S.,Pokharkar,V.G.,Gavali,A.V andYadav,D.B.2015.Forecastingthe pricesofonioninLasalgaonandPimpalgaonmarketofWesternMaharashtra.InternationalJournalofTropicalAgriculture,33(4):3563-3568.
IV Damodar N Gujarati, Dawn C Porter, Sangeetha Gunasekar - Basic Econometricǁ fifthedition2012.
V Chengappa P.G et al., (2012). CompetitiveAssessment of Onion Markets in India. CompetitionCommissionofIndia.
VI. GoI, (2017). Directorate of Economics and Statistics. data base report available at https://eands.dacnet.nic.in/
VII. https://corporatefinanceinstitute com/resources/knowledge/finance/forecasting/ (CFI)