Research Paper
Education
E-ISSN No : 2454-9916 | Volume : 5 | Issue : 12 | Dec 2019
A PROBE INTO THE RIGIDITY OF THE TEACHERS
1
2
Debashish Debnath | Samirranjan Adhikari | Samir Kumar Sen
3
1
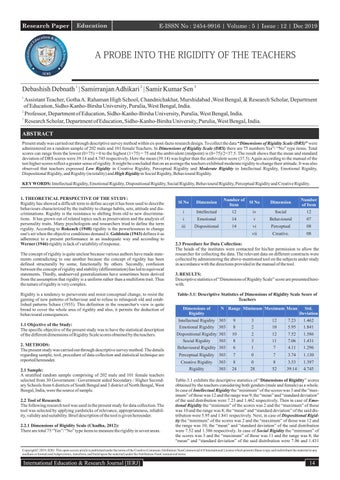
Assistant Teacher, Gotha A. Rahaman High School, Chandnichakhat, Murshidabad ,West Bengal, & Research Scholar, Department of Education, Sidho-Kanho-Birsha University, Purulia, West Bengal, India. 2 Professor, Department of Education, Sidho-Kanho-Birsha University, Purulia, West Bengal, India. 3 Research Scholar, Department of Education, Sidho-Kanho-Birsha University, Purulia, West Bengal, India. ABSTRACT Present study was carried out through descriptive survey method within ex-post-facto research design. To collect the data “Dimensions of Rigidity Scale (DRS)” were administered on a random sample of 202 male and 101 female Teachers. In Dimensions of Rigidity Scale (DRS) there are 75 numbers Yes”/ “No” type items. Total scores can range from the lowest (0×75) = 0 to the highest (1×75) = 75 and the ambivalent (midpoint) is (0+75)/2=37.5. The result shows that the mean and standard deviation of DRS scores were 39.14 and 4.745 respectively. Here the mean (39.14) was higher than the ambivalent score (37.5). Again according to the manual of the test higher scores reflect a greater sense of rigidity. It might be concluded that on an average the teachers exhibited moderate rigidity to change their attitude. It was also observed that teachers expressed Low Rigidity in Creative Rigidity, Perceptual Rigidity and Moderate Rigidity in Intellectual Rigidity, Emotional Rigidity, Dispositional Rigidity, and Rigidity (in totality) and High Rigidity in Social Rigidity, Behavioural Rigidity. KEY WORDS: Intellectual Rigidity, Emotional Rigidity, Dispositional Rigidity, Social Rigidity, Behavioural Rigidity, Perceptual Rigidity and Creative Rigidity. 1. THEORETICAL PERSPECTIVE OF THE STUDY: Rigidity has showed a difficult term to define accept it has been used to describe behaviours characterized by the inability to change habits, sets, attitude and discriminations. Rigidity is the resistance to shifting from old to new discriminations. It has grown out of related topics such as preservation and the analysis of personality traits. Many psychologists and researchers tried to define the term rigidity. According to Rokeach (1948) rigidity is the powerlessness to change one's set when the objective conditions demand it. Goldstein (1943) defines it as adherence to a present performance in an inadequate way and according to Werner (1946) rigidity is lack of variability of response. The concept of rigidity is quite unclear because various authors have made statements contradicting to one another because the concept of rigidity has been defined structurally by some, functionally by others. Secondly, confusion between the concept of rigidity and stability (differentiation) has led to equivocal statements. Thirdly, undeserved generalizations have sometimes been derived from the assumption that rigidity is a uniform rather than a multiform trait. Thus the nature of rigidity is very complex. Rigidity is a tendency to perseverate and resist conceptual change, to resist the gaining of new patterns of behaviour and to refuse to relinquish old and established patterns Schaie (1955). This definition in the researcher's view is quite broad to cover the whole area of rigidity and also, it permits the deduction of behavioural consequences. 1.1 Objective of the Study: The specific objective of the present study was to have the statistical description of the different dimensions of Rigidity Scale scores obtained by the teachers. 2. METHODS: The present study was carried out through descriptive survey method. The details regarding sample, tool, procedure of data collection and statistical technique are reported hereunder. 2.1 Sample: A stratified random sample comprising of 202 male and 101 female teachers selected from 30 Government / Government aided Secondary / Higher Secondary Schools from 6 districts of South Bengal and 3 district of North Bengal, West Bengal, India, were the source of sample. 2.2 Tool of Research: The following research tool was used in the present study for data collection. The tool was selected by applying yardsticks of relevance, appropriateness, reliability, validity and suitability. Brief description of the tool is given hereunder. 2.2.1 Dimensions of Rigidity Scale (Chadha, 2012): There are total 75 “Yes”/ “No” type items to measure the rigidity in seven areas.
Sl No
Dimension
Number of Item
Sl No
Dimension
Number of Item
i
Intellectual
12
i
Emotional
14
iv
Social
12
v
Behavioural
iii
Dispositional
14
07
vi
Perceptual
08
vii
Creative.
08
2.3 Procedure for Data Collection: The heads of the institutes were contacted for his/her permission to allow the researcher for collecting the data. The relevant data on different constructs were collected by administering the above-mentioned tool on the subjects under study in accordance with the directions provided in the manual of the tool. 3. RESULTS: Descriptive statistics of “Dimensions of Rigidity Scale” score are presented herewith. Table-3.1: Descriptive Statistics of Dimensions of Rigidity Scale Score of Teachers Dimensions of Rigidity
N Range Minimum Maximum Mean
Std. Deviation
Intellectual Rigidity 303 Emotional Rigidity 303
9 8
3 2
12 10
7.23 5.95
1.462 1.841
Dispositional Rigidity 303 Social Rigidity 303
10 8
2 3
12 11
7.52 7.06
1.586 1.431
Behavioural Rigidity 303
6
1
7
4.11
1.296
Perceptual Rigidity 303
7
0
7
3.74
1.130
8 24
0 28
8 52
3.53 39.14
1.397 4.745
Creative Rigidity Rigidity
303 303
Table-3.1 exhibits the descriptive statistics of “Dimensions of Rigidity” scores obtained by the teachers considering both genders (male and female) as a whole. In case of Intellectual Rigidity the “minimum” of the scores was 3 and the “maximum” of those was 12 and the range was 9; the “mean” and “standard deviation” of the said distribution were 7.23 and 1.462 respectively. Then in case of Emotional Rigidity the “minimum” of the scores was 2 and the “maximum” of those was 10 and the range was 8; the “mean” and “standard deviation” of the said distribution were 5.95 and 1.841 respectively. Next, in case of Dispositional Rigidity the “minimum” of the scores was 2 and the “maximum” of those was 12 and the range was 10; the “mean” and “standard deviation” of the said distribution were 7.52 and 1.586 respectively. In case of Social Rigidity the “minimum” of the scores was 3 and the “maximum” of those was 11 and the range was 8; the “mean” and “standard deviation” of the said distribution were 7.06 and 1.431
Copyright© 2019, IERJ. This open-access article is published under the terms of the Creative Commons Attribution-NonCommercial 4.0 International License which permits Share (copy and redistribute the material in any medium or format) and Adapt (remix, transform, and build upon the material) under the Attribution-NonCommercial terms.
International Education & Research Journal [IERJ]
14
Research Paper
E-ISSN No : 2454-9916 | Volume : 5 | Issue : 12 | Dec 2019
respectively. Then in case of Behavioural Rigidity the “minimum” of the scores was 1 and the “maximum” of those was 7 and the range was 6; the “mean” and “standard deviation” of the said distribution were 4.11 and 1.296 respectively. Then in case of Perceptual Rigidity the “minimum” of the scores was 0 and the “maximum” of those was 7 and the range was 7; the “mean” and “standard deviation” of the said distribution were 3.74 and 1.130 respectively. In Creative Rigidity the “minimum” of the scores was 0 and the “maximum” of those was 8 and the range was 8; the “mean” and “standard deviation” of the said distribution were 3.53 and 1.397 respectively. Finally, in Rigidity (in totality) the “minimum” of the scores was 28 and the “maximum” of those was 52 and the range was 24; the “mean” and “standard deviation” of the said distribution were 39.14 and 4.745 respectively. Figure-3.1 depicts the bar diagram of different Dimensions of Rigidity Scale scores of teachers considering male and female as a whole.
4.2 Emotional Rigidity: This dimension actually measures the rigidity of – (i) lacking of emotional response when external conditions demands it; (ii) having definite ideas about what type of emotional reaction should be aroused in particular situations; (iii) arousal of similar unchanged emotional response to stimuli; and (iv) exerting strict control over one's emotions. There are 14 “Yes”/ “No” type items. Therefore, maximum score is 14×1=14, minimum score is 0 and the mid value is 7. From table-1 we can see the mean of the scores obtained by the teachers was 5.95 in Emotional Rigidity dimension. This reflects that the teachers were not so emotional rigid. 4.3 Dispositional Rigidity: This is really the disposition with respect to attitudes and habits. This dimension measures the rigidity of – (i) having very definite and rigid habit and /or ideas about the habits of eating, sleeping, reading and dealing with thing etc.; (ii) being inclined to finish works once started; (iii) holding extreme attitudes (positive or negative) regarding persons, things, problems, etc. There are 14 “Yes”/ “No” type items. Therefore, maximum score is 14×1=14, minimum score is 0 and the mid value is 7. From table-3.1 it is exhibited that in case of Dispositional Rigidity the mean was 7.52. The result reflected that the teachers were moderately rigid in this dimension.
Figure-3.1: Bar Diagram Histogram of Different Dimensions of Rigidity Scale Scores of Teachers Considering Male and Female as a Whole. Figure-3.2 depicts the histogram with normal curve of Rigidity Scale Scores of teachers considering male and female as a whole.
4.4 Social Rigidity: This dimension measures the rigidity of – (i) finding it very difficult to feel comfortable in a social gathering or a new situation; (ii) not developing too many new acquaintances; (iii) having very well defined ideas about society and the social responsibilities of its people; and (iv) giving too much importance to friendship. There are 12 “Yes”/ “No” type items. Therefore, maximum score is 12×1=12, minimum score is 0 and the mid value is 6. In case of Social Rigidity the mean was 7.06, which is slightly higher than the mid value. 4.5 Behavioural Rigidity: This rigidity is related to the traditions and customs. This dimension measures the rigidity of – (i) sticking to traditional ways of dressing; and (ii) having strict and definite attitudes towards Indian traditions and customs. There are 7 “Yes”/ “No” type items. Therefore, maximum score is 7×1=7, minimum score is 0 and the mid value is 3.5. In case of Behavioural Rigidity the mean was 4.11. This is also slightly higher than the ambivalent score (mid value). 4.6 Perceptual Rigidity: This dimension measures the rigidity of –(i) not accepting or believing in anything without seeing a proof supporting it; (ii) generally misperceiving something for some other thing; (iii) not being able to perceive abstract relationships among things and a tendency to stick to obvious relationship; and (iv) perceiving one's own knowledge about things to be always correct. There are 8 “Yes”/ “No” type items. Therefore, maximum score is 8×1=8, minimum score is 0 and the mid value is 4. In Perceptual Rigidity the mean was 3.74. This value is slightly lower than the mid value.
Figure-3.2: Histogram with normal curve of Rigidity Scale Scores of teachers considering male and female as a whole. 4. DISCUSSION: From the manual for the “Dimensions of Rigidity Scale” (DRS) we get there are seven dimensions of rigidity. These are Intellectual Rigidity, Emotional Rigidity, Dispositional Rigidity, Social Rigidity, Behavioural Rigidity, Perceptual Rigidity, and Creative Rigidity. 4.1 Intellectual Rigidity: This dimension actually measures the rigidity of – (i) not accepting anything or idea without logical reasoning; (ii) believing in setting high standard for oneself and striving for the best; (iii) having an inclination toward thinking about and discussing intellectual and philosophical matter; and (iv) having definite ideas about things. There are 12 “Yes”/ “No” type items. Therefore, maximum score is 12×1=12, minimum score is 0 and the mid value is 6. From the table-3.1 we get the descriptive statistics of “Dimensions of Rigidity” scores obtained by the teachers considering both genders (male and female) as a whole. In case of Intellectual Rigidity the mean was 7.23. Therefore, on an average the teachers exhibited moderate level of intellectual rigidity.
15
4.7 Creative Rigidity: This dimension measures the rigidity of – (i) being able to think of a few diverse ideas at a time (i.e., Lack of fluency); (ii) not being able to think about a thing or problem from many different angles; and (iii) showing stereotype in ideas. There are 8 “Yes”/ “No” type items. Therefore, maximum score is 8×1=8, minimum score is 0 and the mid value is 4. In Creative Rigidity the mean was 3.53, which is slightly lower than the mid value. 4.8 Rigidity (in Totality): There are total 75 “Yes”/ “No” type items. Therefore, maximum score is 75×1= 75, minimum score is 0 and the mid value is 37.5. From the result of the table-3.1 it is exhibited that the mean was 39.14. This reflects that the on an average teachers had moderate rigidity to change their attitude. 5. CONCLUSION: The present study was designed to realize the statistical description of the different dimensions of Rigidity Scale scores obtained by the teachers. The teachers expressed their – (a) Low Rigidity in the dimensions of Creative Rigidity and Perceptual Rigidity; (b) Moderate Rigidity in the dimensions of Intellectual Rigidity, Emotional Rigidity, Dispositional Rigidity, and Rigidity (in totality);
International Education & Research Journal [IERJ]
Research Paper
E-ISSN No : 2454-9916 | Volume : 5 | Issue : 12 | Dec 2019
(c) High Rigidity in the dimensions of Social Rigidity and Behavioural Rigidity. REFERENCES: 1.
Chadha, N.K. (2012). Manual for dimensions of rigidity scale. National Psychological Corporation, Agra.
2.
Goldstein, H. (1943). Concerning Rigidity. Character and Personality, 11: 209-226.
3.
Rokeach, M. (1948). Generalized mental rigidity as a factor in ethnocentrism. Journal of Abnormal and Social Psychology, 43: 259–278.
4.
Schaie, K.W. (1955). A test of behavioural rigidity. Journal of Abnormal and Social Psychology, 51: 604-10.
5.
Werner, H. (1946). Abnormal and Subnormal Rigidity. Journal of Abnormal Social Psychology, 41:15-24.
International Education & Research Journal [IERJ]
16