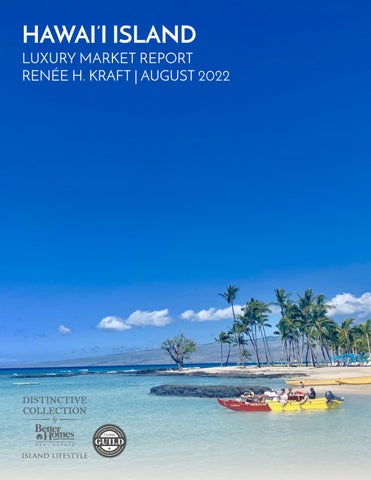
HAWAI’I ISLAND LUXURY MARKET REPORT RENÉE H. KRAFT | AUGUST 2022
RENÉE H. KRAFT
Broker, CLHMS, LUXBHGRE, BA, GRI, RSPS, SRS, ABR HAWAII RB Lic. #23004
808.345.2108
Renee@SearchHawaiiProperty.com www.SearchHawaiiProperty.com As a luxury expert on the Big Island of Hawai’i Renée H. Kraft offers a wealth of knowledge and expertise that is unsurpassed. You can always trust her service, commitment, and confidentiality in all facets of the real estate transaction. Renée H. Kraft acquired her Hawai’i real estate license in 1992 while attending college at the University of Hawaii at Manoa. She started in property management in Honolulu then after graduating moved into the practice of general real estate and relocated to her home in Kailua-Kona in 2003. The luxury benchmark on Hawai’i island typically starts at $1.2M with luxury median residential pricing in the resorts, private estates, villas, and condo markets varying between $2M-$5M. Several high end properties on an annual basis exceed the $5M-$20M benchmarks. She is a Broker representing the Distinctive Collection the luxury branch of Better Homes and Gardens Real Estate Island Lifestyle. Born and raised on Oahu she brings an intimate lifetime of knowledge to the table having lived between Hawai’i Island and Oahu all her life. She enjoys serving her community as a longtime member of the Rotary Club of Kona and the Kona-Kohala Chamber of Commerce. • LUXBHGRE Certified Luxury Property Specialist • Member Institute for Luxury Home Marketing • Bachelor of Arts & Sciences Psychology & Economics • Resort & Second Home Property Specialist • Investment and Vacation Home Specialist • Graduate of the Graduate Realtors Institute • Accredited Buyers Representative • Sellers Representation Specialist
TABLE OF CONTENTS PAGE 4
LUXURY REPORT EXPLAINED
PAGE 5
WELCOME MESSAGE
PAGE 6-9
NORTH AMERICAN LUXURY MARKET REVIEW
PAGE 10
13-MONTH MARKET TRENDS
PAGE 11
SINGLE-FAMILY HOMES MONTHLY OVERVIEW
PAGE 12
ATTACHED HOMES MONTHLY OVERVIEW
PAGE 13-16 MONTHLY STATISTICS BY CITY - Single-Family Homes PAGE 17-20 MONTHLY STATISTICS BY CITY - Attached Homes PAGE 21
LOCAL LUXURY MARKET REVIEW
PAGE 22-23 SINGLE-FAMILY HOMES - Monthly Statistics PAGE 24-25 ATTACHED HOMES - Monthly Statistics PAGE 26
THANK YOU
– LUXURY REPORT EXPLAINED – The Institute for Luxury Home Marketing has analyzed a number of metrics — including sales prices, sales volumes, number of sales, sales-price-to-list-price ratios, days on market and price-per-square-foot – to provide you a comprehensive North American Luxury Market report. Additionally, we have further examined all of the individual luxury markets to provide both an overview and an in-depth analysis - including, where data is sufficient, a breakdown by luxury single-family homes and luxury attached homes. It is our intention to include additional luxury markets on a continual basis. If your market is not featured, please contact us so we can implement the necessary qualification process. More in-depth reports on the luxury communities in your market are available as well. Looking through this report, you will notice three distinct market statuses, Buyer's Market, Seller's Market, and Balanced Market. A Buyer's Market indicates that buyers have greater control over the price point. This market type is demonstrated by a substantial number of homes on the market and few sales, suggesting demand for residential properties is slow for that market and/or price point. By contrast, a Seller's Market gives sellers greater control over the price point. Typically, this means there are few homes on the market and a generous demand, causing competition between buyers who ultimately drive sales prices higher. A Balanced Market indicates that neither the buyers nor the sellers control the price point at which that property will sell and that there is neither a glut nor a lack of inventory. Typically, this type of market sees a stabilization of both the list and sold price, the length of time the property is on the market as well as the expectancy amongst homeowners in their respective communities – so long as their home is priced in accordance with the current market value.
REPORT GLOSSARY REMAINING INVENTORY: The total number of homes available at the close of a month. DAYS ON MARKET: Measures the number of days a home is available on the market before a purchase offer is accepted. LUXURY BENCHMARK PRICE: The price point that marks the transition from traditional homes to luxury homes. NEW LISTINGS: The number of homes that entered the market during the current month. PRICE PER SQUARE FOOT: Measures the dollar amount of the home's price for an individual square foot. SALES RATIO: Sales Ratio defines market speed and determines whether the market currently favors buyers or sellers. Buyer's Market = up to 14%; Balanced Market = 15 to 20%; Seller's Market = 21% plus. If >100%, sales from previous month exceed current inventory. SP/LP RATIO: The Sales Price/List Price Ratio compares the value of the sold price to the value of the list price.
THIS IS YOUR
LUXURY MARKET REPORT
MAP OF LUXURY RESIDENTIAL MARKETS
W
elcome to the Luxury Market Report, your guide to luxury real estate market data and trends for North America. Produced monthly by The Institute for Luxury Home Marketing, this report
provides an in-depth look at the top residential markets across the United States and Canada. Within the individual markets, you will find established luxury benchmark prices and detailed survey of luxury active and sold properties designed to showcase current market status and recent trends. The national report illustrates a compilation of the top North American markets to review overall standards and trends.
Copyright © 2022 Institute for Luxury Home Marketing | www.luxuryhomemarketing.com | 214.485.3000 The Luxury Market Report is a monthly analysis provided by The Institute for Luxury Home Marketing. Luxury benchmark prices are determined by The Institute. This active and sold data has been provided by REAL Marketing, who has compiled the data through various sources, including local MLS boards, local tax records and Realtor.com. Data is deemed reliable to the best of our knowledge, but is not guaranteed.
NORTH AMERICAN LUXURY REVIEW Summer Trends of 2022 This summer several trends are making waves in the luxury real estate market: from staycations and finding new luxury locales to collecting art, implementing high-tech innovations and the eco-friendly refurbishing of homes. Although the market is showing definite signs of slowing down and returning to a more normalized level of inventory and sales, the appetite for luxury has certainly not diminished. The affluent are still buying and selling in the upper tier but they are enjoying the opportunity of time to decide what fulfills their requirements for the long-term. LONGER TERM PLANS One significant trend emerging is just that “the long-term”. The feeling that we will remain in an unsettled economy, real estate market prices have reached their peak, together with a change in attitude towards a property’s value being more intrinsic sees decisions and plans made for the long-term. While statistics show the market has slowed, in terms of the number of sales, many real estate professionals believe given the uptick on real estate websites and requests for virtual tours over the last month that the affluent are taking the summer to formulate their plans. This demand is driven by the pent-up demand from buyers who previously struggled to buy in a market where prices escalated too fast and/or were not interested in getting into a bidding war. The market has swung in their favor, affording them the time and opportunity to find preferred homes to meet their future needs. Despite rates rising, they are still currently at historic lows, although above the rock bottom levels, we saw a year ago, and for those wanting to purchase their forever home or second home, locking into long-term financing is a great option.
DEMAND RISES FOR LUXURY SECOND HOMES We have also seen a rise in the demand for second homes over the last year – according to the Coldwell Banker Global Luxury Report 2022. “Today, the number of affluent individuals with a net worth $5 million+ who own two or more properties is over 70% in the U.S. Second homes in mountain, lake or beach settings were soughtafter as places for leisure, but some savvy investors also chose to ride the price upswing of condos in major cities.” This trend is growing stronger, for several reasons.
Firstly, as many of the affluent are not
committed to one specific location for work anymore, they are often searching for properties that allow them a diametrically opposite lifestyle to the one in their current abode. For those looking for a second property to use as a traditional vacation home, the opportunity to rent these homes has appreciated both in terms of a financial return but also because even the affluent are staying closer to home for their vacations. Travel chaos and taking time to be with family have become a great motivator not to fly abroad. Lastly, there has been an uptick in co-ownership, that affords second homeowners the opportunity to own and enjoy a luxury property without the full responsibility and associated costs. LUXURY AMENITIES IN THIS SUMMER Despite escalating prices, it seems that buying a fixer-upper is still not on the radar of the affluent, they might have the money and the time if they own another property, but they simply do not want the hassle. Properties that come with all the amenities are still checking their boxes and this isn’t only for attributes such as high-end furnishings and fittings, great layouts, extra office space, work out rooms and fabulous outdoor space, the demand is escalating for literally move-in-ready.
In today’s market move-in-ready represents homes that can be purchased fully furnished including all the furniture, curtains, kitchen equipment, the China, silverware and even the artwork on the wall. Homes being prepared for sale with this in mind are attracting a lot of attention. Of course, pools and outdoor play areas are on trend for the summer too, but also the requirement for space to house their collection of toys, from boats to bicycles. Secondary homes on properties have also shown a definite increase in demand. Whether it’s a guest house, suite over the garage or pool house, each of these provides extra space to either house additional family or be repurposed for personal use such as a private office, workout room or quiet refuge. HOME DESIGN While the affluent are not looking to engage in full renovations, they are forever setting new trends in what’s new and in vogue. Even as we learn to live with COVID-19, the days of opulent parties and dinners have still not returned in force. This has led to a demand for less glitter and sparkle and a desire for the home to feel like a place of refuge and comfort. As we move further in 2022, the need for simplicity, clean lines and quality materials is driving design towards a more transitional contemporary palate with softer but luxurious furnishings. Colors focus on bringing in the light, with walls and cabinetry mostly in whites and greys. To offset this, and in acknowledgement of sustainability and eco-friendly trends, greenery, reclaimed and refurbished materials are adding texture and depth. In addition, lots of windows and ideally floor to ceiling windows that open out to large balconies or back yards, screening rooms, fire pits, fire pits or fire features, pools and water features, pizza ovens, outdoor kitchens – modern but flexible for all kinds of lifestyles – have become incredibly popular this summer.
TECHNOLOGY IS KEY Technology within the home is now a standard requirement for affluent homes, but the trend that has become key this summer is the use of technology to search for a home. As the affluent chose to find properties away from their current locale, using the internet to search for homes has become increasingly more important. Searches are not always focused on location first either, there might be several destinations that an affluent buyer may find of interest. Access to technology that provides comparisons by location, amenities, lifestyle, home styles as well as price points has proven instrumental in helping affluent buyers make informed decisions. The affluent often do not need to buy, instead they want to buy, so properties for sale need to have an excellent online presence. High-quality images, video footage, and an attention-grabbing presentation are all musts for sellers looking to attain the maximum exposure for their property. CUSTOM HOMES While renovations are not on the affluent’s radar, they are still buying land to build their dream home. This part of the market has seen its challenges, especially during the height of the pandemic and is still experiencing slow supply chains and labor shortages, but for those who purchased land their goal is often a long-term decision. While prices are likely to fluctuate from initial estimates, the trend for custom homeowners is to pull out the stops and include all the upgrades, amenities and unique features from the start of the project. Custom homes are no longer just a beautiful home, they are being designed to create an experience from the moment you walk through the door. The art of selling and buying in this market needs a critical and analytical approach, understanding the realities and setting expectations accordingly will ensure that goals are achieved. For homeowners looking to buy or sell in today’s market, we recommend working with a realtor who can capitalize on the preferences, trends, and demands in this dynamic and evolving environment.
– 13 - MONTH MARKET TRENDS – FOR THE LUXURY NORTH AMERICAN MARKET
Single-Family Homes
Attached Homes
Single-Family List Price
Attached List Price
All data is based off median values. Median prices represent properties priced above respective city benchmark prices.
20
DAYS ON MARKET
18 16 14
18
17
11
13
16
15
14
16
15
12
18
16
15
15
13
12
10
12 9
11
7
8
8
6
9
9
8
13
9
7
4 2 AUG
SEP
OCT
NOV
DEC
JAN
FEB
MAR
APR
MAY
JUN
JUL
$300
$430
$538
$550 $431
$540 $438
$443
$526
$543 $421
$526 $420
$410
$516
$535
$415
$396
$498
$501 $400
$397
$486
$392
$400
$492
$500
$504
$600
$200
$100
$0
SALES PRICE VS. LIST PRICE
JUL
$376
PRICE PER SQUARE FOOT
0
JUL
AUG
SEP
OCT
NOV
DEC
JAN
FEB
MAR
APR
MAY
JUN
JUL
$2,100,000 $1,900,000 $1,700,000
$1,500,000 $1,300,000 $1,100,000
$900,000 $700,000 $500,000
JUL
AUG
SEP
OCT
NOV
DEC
JAN
FEB
MAR
APR
MAY
JUN
JUL
Discrepancies in previous month statistics between the July 2022 and August 2022 reports are due to the addition of Taos, NM and Montreal, QC.
– LUXURY MONTHLY MARKET REVIEW – A Review of Key Market Differences Year over Year July 2021 | July 2022
SINGLE-FAMILY HOMES July 2021
July 2022
July 2021
July 2022
Median List Price
$1,619,750 $1,599,950
Total Inventory
35,932
53,300
Median Sale Price
$1,307,500
$1,311,000
New Listings
13,591
19,944
Median SP/LP Ratio
80.72%
81.94%
Total Sold
20,102
17,927
Total Sales Ratio
55.94%
33.63%
Median Days on Market
11
12
$376
$430
3,541
3,150
Median Price per Sq. Ft.
Average Home Size
Median prices represent properties priced above respective city benchmark prices.
6,353
2,175
New Listings
Total Sold
1
22.31%
Med. Sale Price
Days on Market
Sales Ratio
3,500
$
SINGLE-FAMILY HOMES MARKET SUMMARY | JULY 2022 •
Official Market Type: Seller's Market with a 33.63% Sales Ratio.1
•
Homes are selling for an average of 81.94% of list price.
•
The median luxury threshold2 price is $912,500, and the median luxury home sales price is $1,311,000.
•
Markets with the Highest Median Sales Price: Aspen ($7,495,000), Naples ($5,700,000), Paradise Valley ($4,347,500), and Marco Island ($4,300,000).
•
Markets with the Highest Sales Ratio: St. Louis (101%), Hamilton County (97%), Frederick County (86%) and Howard County (77%). 1
Sales Ratio defines market speed and market type: Buyer's < 15.5%; Balanced >= 15.5 to < 20.5%; Seller's >= 20.5% plus. If >100%, sales from previous month exceeds current inventory. 2The luxury threshold price is set by The Institute for Luxury Home Marketing.
– LUXURY MONTHLY MARKET REVIEW – A Review of Key Market Differences Year over Year July 2021 | July 2022
ATTACHED HOMES July 2021
July 2022
Median List Price
$995,975
$949,450
Median Sale Price
$871,250
$832,375
Median SP/LP Ratio
87.48%
Total Sales Ratio Median Price per Sq. Ft.
July 2021
Total Inventory
July 2022
12,606
15,303
New Listings
4,412
5,641
87.67%
Total Sold
5,262
4,417
41.74%
28.86%
Median Days on Market
16
13
$492
$538
1,911
1,786
Average Home Size
Median prices represent properties priced above respective city benchmark prices.
1,229
845
New Listings
Total Sold
Med. Sale Price
Days on Market
38,875
$
3
12.88% Sales Ratio
ATTACHED HOMES MARKET SUMMARY | JULY 20 22 •
Official Market Type: Seller's Market with a 28.86% Sales Ratio.1
•
Attached homes are selling for an average of 87.67% of list price.
•
The median luxury threshold2 price is $700,000, and the median attached luxury sale price is $832,375.
•
Markets with the Highest Median Sales Price: Aspen ($5,500,000), Vail ($4,100,000), San Francisco ($2,325,000), and Naples ($2,005,500).
•
Markets with the Highest Sales Ratio: Howard County (139%), Anne Arundel County (106%), Marin County (100%) and Waterloo County (82%). 1
Sales Ratio defines market speed and market type: Buyer's < 15.5%; Balanced >= 15.5 to < 20.5%; Seller's >= 20.5% plus. If >100%, sales from previous month exceeds current inventory. 2The luxury threshold price is set by The Institute for Luxury Home Marketing.
– LUXURY MONTHLY MARKET REVIEW – SINGLE-FAMILY HOMES State Market Name
Median List Price
Median Sold Price
Inventory
New Listings
Sold
Days on Market
Market Status
AB
Calgary
$1,098,000
$936,070
585
264
162
21
Seller's
AZ
Chandler and Gilbert
$999,999
$979,000
277
118
83
30
Seller's
AZ
Flagstaff
$1,493,500
$1,192,500
92
28
24
56
Seller's
AZ
Mesa
$850,000
$837,000
226
104
56
29
Seller's
AZ
Paradise Valley
$4,687,180
$4,347,500
102
24
10
65
Buyer's
AZ
Phoenix
$850,000
$793,750
964
383
260
33
Seller's
AZ
Scottsdale
$1,875,000
$1,615,600
639
191
143
37
Seller's
AZ
Tucson
$724,995
$655,000
715
257
273
7
Seller's
BC
Mid Vancouver Island
$1,599,900
$1,399,000
238
109
26
24
Buyer's
BC
Okanagan Valley
$1,750,000
$1,632,500
971
279
56
43
Buyer's
BC
Vancouver
$4,380,000
$3,400,000
1212
257
57
12
Buyer's
BC
Victoria
$2,499,900
$2,100,000
145
68
19
24
Buyer's
CA
Central Coast
$2,895,000
$2,175,000
243
69
60
14
Seller's
CA
East Bay
$2,089,500
$1,900,000
652
420
436
12
Seller's
CA
Greater Palm Springs
$1,815,000
$1,562,500
239
89
82
29
Seller's
CA
Lake Tahoe
$2,200,000
$1,709,000
219
84
53
17
Seller's
CA
Los Angeles Beach Cities
$5,995,000
$4,200,000
289
72
84
12
Seller's
CA
Los Angeles City
$5,412,500
$3,508,000
660
227
130
19
Balanced
CA
Los Angeles The Valley
$2,495,000
$2,040,000
479
225
183
14
Seller's
CA
Marin County
$3,342,000
$2,850,000
104
24
55
10
Seller's
CA
Napa County
$4,072,500
$2,100,000
108
11
19
29
Balanced
CA
Orange County
$2,699,000
$2,107,500
1095
399
370
13
Seller's
CA
Placer County
$1,199,000
$1,000,000
257
108
100
12
Seller's
CA
Sacramento
$958,000
$898,327
671
296
339
11
Seller's
CA
San Diego
$2,199,900
$1,920,000
1023
448
354
10
Seller's
CA
San Francisco
$4,180,000
$3,287,500
107
38
63
14
Seller's
CA
San Luis Obispo County
$1,792,000
$1,300,000
176
47
70
CA
Santa Barbara
$5,675,000
$2,787,500
140
50
32
17
Seller's
CA
Silicon Valley
$3,799,500
$3,350,000
490
246
253
11
Seller's
CA
Sonoma County
$2,250,000
$1,756,250
199
36
54
36
Seller's
CA
Ventura County
$2,099,500
$1,695,000
272
92
101
20
Seller's
CO
Aspen
$14,925,000
$7,495,000
100
22
7
121
Buyer's
CO
Colorado Springs
$929,000
$900,000
486
188
174
11
Seller's
CO
Denver
$1,499,000
$1,350,000
599
267
316
6
Seller's
CO
Douglas County
$1,349,900
$1,226,500
302
133
136
10
Seller's
Seller's
Median prices represent properties priced above respective city benchmark prices. Prices shown for Canadian cites are shown in Canadian Dollars.
– LUXURY MONTHLY MARKET REVIEW – SINGLE-FAMILY HOMES State Market Name
Median List Price
Median Sold Price
Inventory
New Listings
Sold
Days on Market
Market Status
CO
Durango
$1,699,000
$1,425,000
115
24
23
79
Balanced
CO
Summit County
$3,250,000
$1,772,710
83
28
10
13
Buyer's
CO
Telluride
$5,800,000
$4,100,000
89
20
3
77
Buyer's
CO
Vail
$5,195,000
$4,212,500
95
27
6
20
Buyer's
CT
Central Connecticut
$694,950
$612,500
412
109
246
6
Seller's
CT
Coastal Connecticut
$2,200,000
$1,695,000
596
177
267
21
Seller's
DC
Washington D.C.
$4,495,000
$2,743,750
56
15
18
7
Seller's
DE
Sussex County Coastal
$1,399,900
$1,406,200
149
42
32
17
Seller's
FL
Boca Raton/Delray Beach
$2,795,000
$1,900,000
443
138
85
11
Balanced
FL
Coastal Pinellas County
$2,336,500
$1,850,000
82
24
20
15
Seller's
FL
Greater Fort Lauderdale
$1,350,000
$1,093,138
1337
544
343
13
Seller's
FL
Jacksonville Beaches
$1,375,000
$1,110,000
292
124
103
15
Seller's
FL
Lee County
$1,399,000
$1,300,000
538
134
99
14
Balanced
FL
Marco Island
$2,647,500
$4,300,000
102
17
5
70
Buyer's
FL
Miami
$2,125,000
$1,550,000
866
231
119
23
Buyer's
FL
Naples
$4,995,000
$5,700,000
246
43
33
39
Buyer's
FL
Orlando
$1,225,000
$1,143,898
705
244
210
7
Seller's
FL
Palm Beach Towns
$3,250,000
$2,200,000
220
56
29
23
Buyer's
FL
Sarasota & Beaches
$2,950,000
$2,025,000
291
84
70
11
Seller's
FL
South Pinellas County
$1,597,000
$1,437,500
234
94
58
9
Seller's
FL
South Walton
$2,370,000
$2,050,000
398
91
57
15
Buyer's
FL
Space Coast
$849,450
$737,500
324
135
130
7
Seller's
FL
Tampa
$750,000
$675,000
1160
547
499
6
Seller's
FL
Weston
$1,200,000
$1,052,000
113
58
58
9
Seller's
GA
Atlanta
$1,485,000
$1,200,000
699
275
263
6
Seller's
GA
Duluth
$1,650,000
$1,375,000
22
11
5
10
Seller's
HI
Island of Hawaii
$1,997,500
$1,405,500
122
21
15
15
Buyer's
HI
Kauai
$2,800,000
$2,812,000
47
9
7
5
Buyer's
HI
Maui
$2,947,500
$2,000,000
132
22
27
69
Balanced
HI
Oahu
$3,180,000
$2,287,000
187
53
48
12
Seller's
ID
Ada County
$794,950
$778,000
1002
421
323
11
Seller's
ID
Northern Idaho
$1,600,000
$1,308,000
503
181
53
57
Buyer's
IL
Chicago
$1,499,000
$1,210,423
716
270
346
8
Seller's
IL
DuPage County
$1,189,000
$917,000
335
127
160
8
Seller's
IL
Lake County
$1,150,000
$873,000
292
97
150
8
Seller's
Median prices represent properties priced above respective city benchmark prices. Prices shown for Canadian cites are shown in Canadian Dollars.
– LUXURY MONTHLY MARKET REVIEW – SINGLE-FAMILY HOMES State Market Name
Median List Price
Median Sold Price
Inventory
New Listings
Sold
Days on Market
Market Status
IL
Will County
$700,000
$624,950
225
96
166
10
Seller's
IN
Hamilton County
$849,175
$750,000
144
55
140
4
Seller's
KS
Johnson County
$804,307
$808,718
357
100
177
3
Seller's
MA
Cape Cod
$2,395,000
$1,810,000
132
34
29
20
Seller's
MA
Greater Boston
$3,269,500
$2,700,000
102
25
71
21
Seller's
MA
South Shore
$1,699,950
$1,399,000
74
28
39
15
Seller's
MD
Anne Arundel County
$977,500
$922,500
188
71
129
5
Seller's
MD
Frederick County
$850,000
$830,130
56
27
48
7
Seller's
MD
Howard County
$1,174,236
$1,018,750
94
41
72
6
Seller's
MD
Montgomery County
$1,938,667
$1,545,000
189
64
132
7
Seller's
MD
Talbot County
$2,447,500
$1,722,500
38
2
12
8
Seller's
MD
Worcester County
$934,950
$750,000
56
19
17
9
Seller's
MI
Livingston County
$782,500
$695,000
108
28
35
9
Seller's
MI
Monroe County
$657,900
$592,500
16
5
6
14
Seller's
MI
Oakland County
$729,000
$637,000
943
403
365
8
Seller's
MI
Washtenaw County
$854,950
$740,000
168
54
69
6
Seller's
MI
Wayne County
$695,000
$642,000
231
83
108
9
Seller's
MN
Olmsted County
$849,900
$785,145
74
12
18
19
Seller's
MN
Twin Cities
$1,237,500
$996,683
732
244
280
10
Seller's
MO
Kansas City
$669,900
$675,000
1311
320
527
4
Seller's
MO
St. Louis
$825,000
$718,500
107
51
108
6
Seller's
NC
Asheville
$994,800
$838,193
229
80
64
8
Seller's
NC
Charlotte
$1,124,950
$975,000
602
240
365
4
Seller's
NC
Lake Norman
$1,140,000
$1,050,000
198
71
94
5
Seller's
NC
Raleigh-Durham
$950,000
$905,000
367
164
241
4
Seller's
NJ
Ocean County
$899,950
$808,500
471
159
140
13
Seller's
NM
Taos
$1,195,000
$890,000
83
21
7
102
Buyer's
NV
Lake Tahoe
$3,500,000
$2,628,500
168
36
14
72
Buyer's
NV
Las Vegas
$1,615,000
$1,300,000
821
265
97
21
Buyer's
NV
Reno
$1,950,000
$1,772,500
134
32
20
49
Buyer's
NY
Finger Lakes
$2,099,500
$1,314,000
34
9
7
13
Balanced
NY
Nassau County
$1,880,000
$1,450,000
775
190
181
23
Seller's
NY
Staten Island
$1,250,000
$1,250,000
186
57
38
39
Balanced
NY
Suffolk County
$1,799,000
$1,201,000
928
227
158
21
Balanced
OH
Cincinnati
$849,950
$750,000
184
49
105
2
Seller's
Median prices represent properties priced above respective city benchmark prices. Prices shown for Canadian cites are shown in Canadian Dollars.
– LUXURY MONTHLY MARKET REVIEW – SINGLE-FAMILY HOMES State Market Name
Median List Price
Median Sold Price
New Inventory Listings
Sold
Days on Market
Market Status
ON
GTA - Durham
$1,749,000
$1,555,000
211
136
46
14
Seller's
ON
GTA - York
$2,375,000
$1,880,000
563
327
137
13
Seller's
ON
Hamilton
$1,839,500
$1,510,000
254
121
27
23
Buyer's
ON
Mississauga
$2,950,000
$2,310,000
137
64
26
18
Balanced
ON
Oakville
$2,514,900
$2,400,000
132
82
33
17
Seller's
ON
Toronto
$3,799,444
$3,100,000
420
178
54
20
Buyer's
ON
Waterloo Region
$1,474,000
$1,300,000
166
103
49
12
Seller's
OR
Portland
$1,350,000
$1,075,000
615
248
283
6
Seller's
QC
Montreal
$1,999,000
$1,600,000
363
87
16
39
Buyer's
SC
Hilton Head
$2,095,000
$1,349,000
243
58
55
12
Seller's
TN
Greater Chattanooga
$965,000
$824,000
180
49
43
4
Seller's
TN
Nashville
$1,699,900
$1,355,500
653
246
220
4
Seller's
TX
Austin
$1,098,222
$995,000
1242
586
354
9
Seller's
TX
Collin County
$749,000
$717,786
1445
681
627
11
Seller's
TX
Dallas
$1,300,000
$1,004,001
450
209
186
11
Seller's
TX
Denton County
$775,786
$750,000
1101
508
425
9
Seller's
TX
El Paso
$610,800
$583,000
154
53
29
15
Balanced
TX
Fort Worth
$825,000
$800,000
970
393
465
8
Seller's
TX
Greater Tyler
$737,500
$611,500
148
77
48
9
Seller's
TX
Houston
$979,000
$880,000
1149
439
333
9
Seller's
TX
Lubbock
$652,500
$599,950
88
34
28
50
Seller's
TX
San Angelo
$650,000
$594,950
51
27
16
68
Seller's
TX
San Antonio
$799,070
$717,515
636
262
191
16
Seller's
TX
The Woodlands & Spring
$809,000
$741,000
213
119
162
7
Seller's
UT
Park City
$4,250,000
$3,075,000
202
57
16
7
Buyer's
UT
Salt Lake City
$1,132,096
$979,000
469
210
157
21
Seller's
VA
Arlington & Alexandria
$2,250,000
$1,850,000
77
32
49
6
Seller's
VA
Charlottesville
$1,300,000
$1,019,000
144
22
44
6
Seller's
VA
Fairfax County
$1,999,900
$1,500,000
346
113
152
7
Seller's
VA
McLean & Vienna
$2,750,000
$1,850,000
147
31
61
6
Seller's
VA
Richmond
$799,900
$790,153
291
110
197
6
Seller's
VA
Smith Mountain Lake
$1,750,000
$1,325,000
33
9
8
4
Seller's
WA
King County - Greater Seattle
$1,970,000
$1,695,000
1014
543
538
6
Seller's
WA
Seattle
$1,893,217
$1,715,000
254
140
167
6
Seller's
WA
Spokane
$1,150,000
$987,500
135
62
46
9
Seller's
Median prices represent properties priced above respective city benchmark prices. Prices shown for Canadian cites are shown in Canadian Dollars.
– LUXURY MONTHLY MARKET REVIEW – ATTACHED HOMES State Market Name
Median List Price
Median Sold Price
Inventory
New Listings
Sold
Days on Market
Market Status
AB
Calgary
$775,000
$685,000
173
65
23
32
Buyer's
AZ
Chandler and Gilbert
-
-
-
-
-
-
-
AZ
Flagstaff
-
-
-
-
-
-
-
AZ
Mesa
-
-
-
-
-
-
-
AZ
Paradise Valley
-
-
-
-
-
-
-
AZ
Phoenix
-
-
-
-
-
-
-
AZ
Scottsdale
$827,000
$799,500
202
66
44
28
Seller's
AZ
Tucson
-
-
-
-
-
-
-
BC
Mid Vancouver Island
$842,000
$757,000
76
35
8
35
Buyer's
BC
Okanagan Valley
-
-
-
-
-
-
-
BC
Vancouver
$1,989,800
$1,685,450
999
271
70
15
Buyer's
BC
Victoria
$997,500
$950,000
132
77
33
16
Seller's
CA
Central Coast
$1,275,000
$1,041,944
29
17
16
7
Seller's
CA
East Bay
$1,070,000
$1,040,000
184
114
123
12
Seller's
CA
Greater Palm Springs
-
-
-
-
-
-
-
CA
Lake Tahoe
$1,850,000
$1,712,500
25
9
6
24
Seller's
CA
Los Angeles Beach Cities
$1,875,000
$1,600,000
167
71
74
11
Seller's
CA
Los Angeles City
$1,650,000
$1,343,500
339
138
103
12
Seller's
CA
Los Angeles The Valley
$792,450
$814,750
142
85
96
16
Seller's
CA
Marin County
$1,300,000
$1,237,000
25
7
25
23
Seller's
CA
Napa County
-
-
-
-
-
-
-
CA
Orange County
$1,180,000
$1,132,500
421
187
190
12
Seller's
CA
Placer County
-
-
-
-
-
-
-
CA
Sacramento
-
-
-
-
-
-
-
CA
San Diego
$1,100,000
$1,044,750
366
203
190
10
Seller's
CA
San Francisco
$2,837,500
$2,325,000
108
25
30
21
Seller's
CA
San Luis Obispo County
-
-
-
-
-
-
-
CA
Santa Barbara
$1,590,000
$1,525,000
11
9
9
10
Seller's
CA
Silicon Valley
$1,649,980
$1,600,000
131
68
83
10
Seller's
CA
Sonoma County
$1,100,000
$687,500
15
4
6
31
Seller's
CA
Ventura County
$750,000
$799,998
109
47
77
18
Seller's
CO
Aspen
$4,495,000
$5,500,000
35
10
1
58
Buyer's
CO
Colorado Springs
-
-
-
-
-
-
-
CO
Denver
$965,000
$828,750
151
56
54
13
Seller's
CO
Douglas County
$560,000
$544,995
23
14
10
5
Seller's
Markets with dashes do not have a significant luxury market for this report. Median prices represent properties priced above respective city benchmark prices. Prices shown for Canadian cites are shown in Canadian Dollars.
– LUXURY MONTHLY MARKET REVIEW – ATTACHED HOMES State Market Name
Median List Price
Median Sold Price
Inventory
New Listings
Sold
Days on Market
Market Status
CO
Durango
$793,905
$757,500
20
3
12
61
Seller's
CO
Summit County
$1,159,500
$1,718,000
34
11
5
9
Buyer's
CO
Telluride
-
-
-
-
-
-
-
CO
Vail
$3,997,000
$4,100,000
70
15
5
7
Buyer's
CT
Central Connecticut
-
-
-
-
-
-
-
CT
Coastal Connecticut
$1,450,000
$769,694
186
50
59
23
Seller's
DC
Washington D.C.
$1,995,000
$1,625,000
166
49
59
9
Seller's
DE
Sussex County Coastal
$1,050,000
$896,000
15
10
7
20
Seller's
FL
Boca Raton/Delray Beach
$935,000
$762,500
241
87
60
13
Seller's
FL
Coastal Pinellas County
$1,443,950
$1,290,000
98
41
35
10
Seller's
FL
Greater Fort Lauderdale
$849,950
$775,000
810
231
168
27
Balanced
FL
Jacksonville Beaches
$949,900
$1,275,000
31
12
9
9
Seller's
FL
Lee County
$825,000
$769,500
216
54
63
9
Seller's
FL
Marco Island
$1,699,500
$1,350,000
36
7
5
8
Buyer's
FL
Miami
$1,480,000
$1,275,000
1255
285
97
50
Buyer's
FL
Naples
$2,300,000
$2,005,500
140
28
22
16
Balanced
FL
Orlando
$565,000
$565,000
203
74
45
8
Seller's
FL
Palm Beach Towns
$1,975,000
$1,775,000
181
44
21
38
Buyer's
FL
Sarasota & Beaches
$1,821,100
$1,220,000
126
30
42
6
Seller's
FL
South Pinellas County
$1,175,000
$1,104,500
173
58
40
11
Seller's
FL
South Walton
$1,579,800
$1,150,000
202
44
33
17
Balanced
FL
Space Coast
$759,900
$669,500
151
51
34
22
Seller's
FL
Tampa
$750,000
$700,000
165
72
60
8
Seller's
FL
Weston
-
-
-
-
-
-
-
GA
Atlanta
$743,545
$656,000
465
204
159
8
Seller's
GA
Duluth
-
-
-
-
-
-
-
HI
Island of Hawaii
$1,530,000
$1,550,000
55
21
19
12
Seller's
HI
Kauai
$1,592,500
$1,322,500
40
12
14
7
Seller's
HI
Maui
$1,999,000
$1,600,000
83
17
21
74
Seller's
HI
Oahu
$1,150,000
$924,500
405
101
108
15
Seller's
ID
Ada County
$634,894
$625,000
60
23
21
23
Seller's
ID
Northern Idaho
-
-
-
-
-
-
-
IL
Chicago
$1,226,000
$930,000
803
275
177
16
Seller's
IL
DuPage County
$799,000
$689,000
25
8
18
11
Seller's
IL
Lake County
-
-
-
-
-
-
-
Markets with dashes do not have a significant luxury market for this report. Median prices represent properties priced above respective city benchmark prices. Prices shown for Canadian cites are shown in Canadian Dollars.
– LUXURY MONTHLY MARKET REVIEW – ATTACHED HOMES State Market Name
Median List Price
Median Sold Price
Inventory
New Listings
Sold
Days on Market
Market Status
IL
Will County
-
-
-
-
-
-
-
IN
Hamilton County
-
-
-
-
-
-
-
KS
Johnson County
$596,475
$725,000
102
24
27
2
Seller's
MA
Cape Cod
$790,000
$815,000
28
8
9
19
Seller's
MA
Greater Boston
$2,399,500
$1,875,000
296
63
77
20
Seller's
MA
South Shore
$849,900
$800,000
17
13
13
37
Seller's
MD
Anne Arundel County
$564,990
$579,250
62
34
66
6
Seller's
MD
Frederick County
-
-
-
-
-
-
-
MD
Howard County
$589,945
$560,640
28
20
39
5
Seller's
MD
Montgomery County
$755,000
$749,900
115
53
71
6
Seller's
MD
Talbot County
-
-
-
-
-
-
-
MD
Worcester County
$635,000
$680,000
49
18
23
9
Seller's
MI
Livingston County
-
-
-
-
-
-
-
MI
Monroe County
-
-
-
-
-
-
-
MI
Oakland County
$749,000
$585,000
69
28
30
7
Seller's
MI
Washtenaw County
$584,950
$774,000
54
23
24
12
Seller's
MI
Wayne County
$628,400
$609,697
98
17
11
19
Buyer's
MN
Olmsted County
-
-
-
-
-
-
-
MN
Twin Cities
-
-
-
-
-
-
-
MO
Kansas City
-
-
-
-
-
-
-
MO
St. Louis
-
-
-
-
-
-
-
NC
Asheville
$804,250
$807,500
30
7
14
19
Seller's
NC
Charlotte
$665,718
$624,950
177
42
78
7
Seller's
NC
Lake Norman
$639,000
$555,000
17
4
7
4
Seller's
NC
Raleigh-Durham
-
-
-
-
-
-
-
NJ
Ocean County
$849,000
$836,000
45
19
14
22
Seller's
NM
Taos
-
-
-
-
-
-
-
NV
Lake Tahoe
$1,409,500
$1,237,500
30
12
3
44
Buyer's
NV
Las Vegas
-
-
-
-
-
-
-
NV
Reno
-
-
-
-
-
-
-
NY
Finger Lakes
-
-
-
-
-
-
-
NY
Nassau County
$1,375,000
$1,640,000
95
15
19
39
Balanced
NY
Staten Island
$639,000
$625,000
91
20
38
31
Seller's
NY
Suffolk County
$759,450
$669,500
176
56
53
25
Seller's
OH
Cincinnati
$699,000
$665,000
17
6
10
22
Seller's
Markets with dashes do not have a significant luxury market for this report. Median prices represent properties priced above respective city benchmark prices. Prices shown for Canadian cites are shown in Canadian Dollars.
– LUXURY MONTHLY MARKET REVIEW – ATTACHED HOMES State Market Name
Median List Price
Median Sold Price
New Inventory Listings
Sold
Days on Market
Market Status
ON
GTA - Durham
$847,900
$820,000
39
25
5
14
Buyer's
ON
GTA - York
$799,000
$760,000
330
217
63
19
Balanced
ON
Hamilton
$884,450
$845,000
16
19
11
9
Seller's
ON
Mississauga
$949,000
$893,000
140
96
33
22
Seller's
ON
Oakville
$1,344,000
$1,347,500
25
19
8
6
Seller's
ON
Toronto
$1,250,000
$1,075,000
777
419
190
17
Seller's
ON
Waterloo Region
$775,000
$750,000
50
40
41
14
Seller's
OR
Portland
$735,000
$625,000
235
94
75
12
Seller's
QC
Montreal
$1,325,000
$1,257,500
13
3
10
20
Seller's
SC
Hilton Head
$999,000
$927,500
49
9
8
12
Balanced
TN
Greater Chattanooga
-
-
-
-
-
-
-
TN
Nashville
$754,950
$631,000
128
73
58
3
Seller's
TX
Austin
$849,999
$770,000
260
112
78
11
Seller's
TX
Collin County
-
-
-
-
-
-
-
TX
Dallas
$749,000
$635,000
117
53
44
10
Seller's
TX
Denton County
-
-
-
-
-
-
-
TX
El Paso
-
-
-
-
-
-
-
TX
Fort Worth
-
-
-
-
-
-
-
TX
Greater Tyler
-
-
-
-
-
-
-
TX
Houston
$625,000
$616,000
137
63
32
17
Seller's
TX
Lubbock
-
-
-
-
-
-
-
TX
San Angelo
-
-
-
-
-
-
-
TX
San Antonio
$625,000
$564,500
32
3
4
21
Buyer's
TX
The Woodlands & Spring
-
-
-
-
-
-
-
UT
Park City
$1,850,000
$1,725,000
102
24
19
2
Balanced
UT
Salt Lake City
$620,000
$525,000
147
62
60
21
Seller's
VA
Arlington & Alexandria
$1,059,000
$965,000
87
43
48
9
Seller's
VA
Charlottesville
$634,450
$550,000
28
5
9
21
Seller's
VA
Fairfax County
$757,550
$710,000
234
131
162
7
Seller's
VA
McLean & Vienna
$1,139,999
$1,001,700
37
13
20
5
Seller's
VA
Richmond
-
-
-
-
-
-
-
VA
Smith Mountain Lake
-
-
-
-
-
-
-
WA
King County - Greater Seattle
$1,150,000
$950,000
275
100
100
6
Seller's
WA
Seattle
$1,425,000
$1,025,000
131
41
24
7
Balanced
WA
Spokane
-
-
-
-
-
-
-
Markets with dashes do not have a significant luxury market for this report. Median prices represent properties priced above respective city benchmark prices. Prices shown for Canadian cites are shown in Canadian Dollars.
AUGUST
2022
ISLAND OF HAWAII HAWAI I
ISLAND OF HAWAII
SINGLE - FAMILY HOMES
LUXURY INVENTORY VS. SALES | JULY 2022 Inventory
Sales
Luxury Benchmark Price 1: $1,100,000 $9,000,000+ $7,800,000 - $8,999,999 $6,800,000 - $7,799,999 $5,800,000 - $6,799,999
$5,000,000 - $5,799,999 $4,200,000 - $4,999,999
$2,400,000 - $2,799,999
3
0
Total Sales: 15
Total Sales Ratio2: 12%
2
0
3
0
11
1
11
0 8
0
10
2
$1,700,000 - $1,999,999
14
2
$1,400,000 - $1,699,999
1
19
3 5
1
$1,200,000 - $1,299,999 $1,100,000 - $1,199,999
Buyer's Market
3
0
$2,000,000 - $2,399,999
$1,300,000 - $1,399,999
Total Inventory: 122
2
0
$3,400,000 - $4,199,999 $2,800,000 - $3,399,999
8
0
17
4
6
2
Square Feet3
Price
Beds
Baths
Sold
Inventory
Sales Ratio
-Range-
-Median Sold-
-Median Sold-
-Median Sold-
-Total-
-Total-
-Sold/Inventory-
0 - 2,999
$1,275,000
3
2
7
65
11%
3,000 - 3,999
$2,662,500
4
3
2
11
18%
4,000 - 4,999
NA
NA
NA
0
6
0%
5,000 - 5,999
NA
NA
NA
0
2
0%
6,000 - 6,999
NA
NA
NA
0
1
0%
7,000+
NA
NA
NA
0
2
0%
The luxury threshold price is set by The Institute for Luxury Home Marketing. 2Sales Ratio defines market speed and market type: Buyer's < 14.5%; Balanced >= 14.5 to < 20.5%; Seller's >= 20.5% plus. If >100% MLS® data reported previous month’s sales exceeded current inventory.
ISLAND OF HAWAII
SINGLE - FAMILY HOMES
13 - MONTH LUXURY MARKET TREND 4 Median Sales Price
Inventory
Solds
$2,225,000
$1,990,000 $1,775,000
$2,100,000
$1,987,500
$1,630,000
$1,502,500
$1,650,000
$1,750,000 $1,485,000
$1,600,000
$1,497,000
$1,405,500 122
121 57 24 Jul-21
64
60
53
27
28
Aug-21
Sep-21
64 24
Oct-21
59 24
Nov-21
41
Dec-21
63
31
33
40
Feb-22
Mar-22
Apr-22
27
Jan-22
76
65
60
92 32
May-22
28
15
Jun-22
Jul-22
MEDIAN DATA REVIEW | JULY TOTAL INVENTORY Jul. 2021
Jul. 2022
57
TOTAL SOLDS Jul. 2021
Jul. 2022
122 VARIANCE: 114 %
15 VARIANCE: -38 %
SALE PRICE PER SQFT.
SALE TO LIST PRICE RATIO
Jul. 2021
Jul. 2022
616
$
659 VARIANCE: 7 % $
24
Jul. 2021
SALES PRICE
Jul. 2022
100.00% 100.00% VARIANCE: 0 %
Jul. 2021
1.78m
$
Jul. 2022
1.41m VARIANCE: -21 % $
DAYS ON MARKET Jul. 2021
Jul. 2022
26
15 VARIANCE: -42 %
ISLAND OF HAWAII MARKET SUMMARY | JULY 2022 • The Island of Hawaii single-family luxury market is a Buyer's Market with a 12% Sales Ratio. • Homes sold for a median of 100.00% of list price in July 2022. • The most active price band is $1,100,000-$1,199,999, where the sales ratio is 33%. • The median luxury sales price for single-family homes is $1,405,500. • The median days on market for July 2022 was 15 days, down from 26 in July 2021.
Square foot table does not account for listings and solds where square foot data is not disclosed. 4 Data reported includes Active and Sold properties and does not include Pending properties.
3
ISLAND OF HAWAII
ATTACHED HOMES
LUXURY INVENTORY VS. SALES | JULY 2022 Inventory
Sales
Luxury Benchmark Price 1: $950,000 2
$4,500,000+ $4,000,000 - $4,499,999
0 0
$3,500,000 - $3,999,999 $3,100,000 - $3,499,999
Total Inventory: 55
Total Sales Ratio2: 35%
4 5
1
1 1
$1,800,000 - $2,099,999
10
1 0
1
$1,400,000 - $1,599,999
5
2
1
$1,300,000 - $1,399,999
3 9
0
$1,100,000 - $1,199,999
6
2 1
$950,000 - $999,999
1
Seller's Market
1
$2,100,000 - $2,399,999
$1,000,000 - $1,099,999
Total Sales: 19
2
0
$2,400,000 - $2,699,999
$1,200,000 - $1,299,999
3
1
$2,700,000 - $3,099,999
$1,600,000 - $1,799,999
3
2
5
2
Square Feet3
Price
Beds
Baths
Sold
Inventory
Sales Ratio
-Range-
-Median Sold-
-Median Sold-
-Median Sold-
-Total-
-Total-
-Sold/Inventory-
0 - 999
NA
NA
NA
0
5
0%
1,000 - 1,499
$1,450,000
2
2
4
11
36%
1,500 - 1,999
$1,421,750
3
2
6
9
67%
2,000 - 2,499
$3,763,150
3
3
2
14
14%
2,500 - 2,999
$2,380,000
4
3
2
6
33%
3,000+
$5,250,000
4
4
2
2
100%
The luxury threshold price is set by The Institute for Luxury Home Marketing. 2Sales Ratio defines market speed and market type: Buyer's < 14.5%; Balanced >= 14.5 to < 20.5%; Seller's >= 20.5% plus. If >100% MLS® data reported previous month’s sales exceeded current inventory.
ISLAND OF HAWAII
ATTACHED HOMES
13 - MONTH LUXURY MARKET TREND 4 Sale Price
Inventory
Solds
$1,852,000 $1,625,000
$1,595,000
$1,461,560
$1,340,000
$1,300,000
$1,407,500
$1,555,000
$1,640,000
$1,550,000
$1,400,000
$1,225,000
$1,180,000
55
50 28
35 23
Jul-21
34
32
16
18
Aug-21
Sep-21
29
Oct-21
32
29 17
20
Nov-21
Dec-21
25
24
Jan-22
26
24
Feb-22
24
34
26
Mar-22
38
35
36
30 19
Apr-22
May-22
Jun-22
Jul-22
MEDIAN DATA REVIEW | JULY TOTAL INVENTORY Jul. 2021
Jul. 2022
28
TOTAL SOLDS Jul. 2021
Jul. 2022
55 VARIANCE: 96 %
19 VARIANCE: -17 %
SALE PRICE PER SQFT.
SALE TO LIST PRICE RATIO
Jul. 2021
$
Jul. 2022
911
956 VARIANCE: 5 % $
23
Jul. 2021
SALES PRICE
Jul. 2022
100.00% 97.95% VARIANCE: -2 %
Jul. 2021
$
1.60m
Jul. 2022
1.55m VARIANCE: -3 % $
DAYS ON MARKET Jul. 2021
Jul. 2022
7
12 VARIANCE: 71 %
ISLAND OF HAWAII MARKET SUMMARY | JULY 2022 • The Island of Hawaii attached luxury market is a Seller's Market with a 35% Sales Ratio. • Homes sold for a median of 97.95% of list price in July 2022. • The most active price band is $1,300,000-$1,399,999, where the sales ratio is 300%. • The median luxury sales price for attached homes is $1,550,000. • The median days on market for July 2022 was 12 days, up from 7 in July 2021.
Square foot table does not account for listings and solds where square foot data is not disclosed. 4 Data reported includes Active and Sold properties and does not include Pending properties.
3
Thank you for taking time to view this report. For more information about this report and the services I can offer you and your luxury property, please give me a call at 808.345.2108.
- Renée H, Kraft
RENÉE H. KRAFT
808.345.2108 | Renee@SearchHawaiiProperty.com | www.SearchHawaiiProperty.com