




REALTOR®, CLHMS
Managing Partner
Point Break Properties

843.801.4888
parker@pbp-re.com www.pointbreakpropertiesre.com
Sharpened by over 30 years of savvy expertise, insight, and experience, Point Break Properties is an elite group of top-producing luxury real estate professionals in Charleston. Our agents are relentless advocates for our clients and are passionate about delivering singular, bespoke, and exceptional experiences. The access our advisors have to the most relevant, reliable, & up-to-date industry information and education is paramount. The removal of uncertainty allows our team to expertly advise at every stage of a real estate transaction which enables our clients to make powerful and confident decisions.
Point Break Properties advisors boast backgrounds in Real Estate Appraisal & Property Valuation, Marketing, Commodity Markets, and New Home Construction, to name a few. “Often the real estate process is quite emotional for first-time and primary home buyers and sellers, while what developers and investors are most focused on are the analytics and bottom-line dollars.” Point Break’s diverse experience affords keen insight into residential investments, executive and corporate relocation services, resort/vacation rentals, and allows
PAGE 4-7
PAGE 8
PAGE 9
PAGE 10
PAGE 11-14
PAGE 15
PAGE 16
PAGE 17-21
PAGE 22
NORTH AMERICAN LUXURY MARKET REVIEW
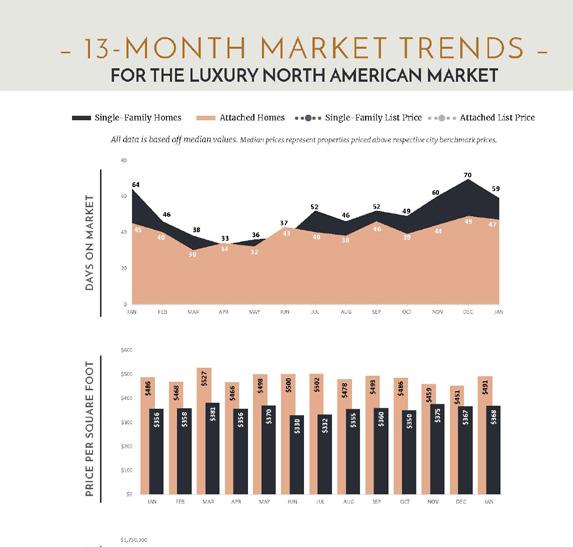
13-MONTH MARKET TRENDS
SINGLE-FAMILY HOMES MONTHLY OVERVIEW
ATTACHED HOMES MONTHLY OVERVIEW
MONTHLY STATISTICS BY CITY
LUXURY REPORT EXPLAINED
WELCOME MESSAGE
LOCAL LUXURY MARKET REVIEW
THANK YOU

The North American luxury real estate market is continuing to demonstrate a resilience that increasingly sets it apart from the broader housing sector. While conventional market expectations would suggest that declining inventory and fewer new listings should lead to slower activity, the luxury segment is telling a very different story in 2026.
Traditionally, the spring market brings a significant increase in inventory as sellers look to capitalize on heightened seasonal demand. This year, however, a subtle but important shift has emerged. Over the past two months, the number of luxury properties entering the market has declined compared to the same period in 2025, yet sales activity has continued to strengthen, not only month-over-month, but year-over-year as well.
This divergence between supply and demand is revealing a luxury market that is being driven less by broader economic pressures and more by affluent buyer behavior, inventory scarcity, and long-term wealth positioning.
The first two months of 2026 began much as expected. Both inventory and sales activity gradually increased for single-family and attached luxury properties as the market moved toward the spring season.
However, March marked the beginning of a notable shift. While overall inventory levels remained relatively consistent with 2025 figures, the number of new listings entering the market began to slow.
Compared to March 2025 new listings for single-family luxury homes fell by 3.1% and attached luxury properties declined by 7.2%
At the time, this appeared to be a potential anomaly. But April’s numbers suggest otherwise.
Although inventory levels continued to climb modestly from March into April, year-over-year inventory levels declined by 4.4% for single-family homes and 8.5% for attached properties.
More significantly, the number of new listings entering the market remained substantially below normal spring market expectations. Compared to April 2025 new listings for single-family properties fell 2.5% and attached properties declined by 9.8%.
This is not to say that inventory and new listings numbers are not increasing month-over-month in 2026, they are, but just at a much slower rate than typically expected.
Taken independently, declining inventory increases and reduced new listing activity would typically suggest a cooling market environment and softer buyer demand. However, the continued rise in both month-over-month and year-over-year sales activity points to a very different reality in the luxury sector: one driven by constrained supply, resilient affluent buyers, and increased competition for quality properties.
Sales of single-family luxury homes increased by 6.8% year-over-year compared to April 2025 and by 14.9% month-over-month compared to March 2026. Attached luxury properties also posted gains of 0.6% year-over-year and 4.3% month-over-month.
At the same time, market balance indicators continue to support seller strength. The median sold price for single-family luxury homes dipped slightly by 2.2%, while attached luxury properties posted a 1.0% increase. Average sold-to-list price ratios remained close to parity, and days on market held relatively stable across both segments.
Collectively, these metrics support that the single-family luxury market remains firmly in seller’s market territory, while the attached luxury segment is steadily trending back toward similar conditions.
Several broader economic and behavioral trends are helping explain why luxury real estate is continuing to outperform expectations despite declining inventory level increases.
One of the clearest distinctions between the luxury market and the broader residential sector is the financial profile of its buyers.
According to recent report from Realtor.com1, affluent buyers remain far less impacted by elevated borrowing costs because many are purchasing through cash reserves, portfolio-backed lending, or private banking relationships rather than relying on conventional financing.
This has created a situation where the luxury market is operating on a somewhat different thought
1 https://www.realtor.com/research/luxury-2026-outlook
process than buyers of traditional housing. While many midmarket buyers remain constrained by affordability pressures and mortgage rate volatility, high-net-worth individuals continue to transact based on lifestyle decisions, long-term investment strategies, and wealth preservation goals.
As a result, demand at the upper end of the market has remained surprisingly stable despite broader economic uncertainty.
At the same time, luxury sellers appear increasingly cautious about listing their properties.
Recent housing commentary reported by New York Post2 highlighted that many homeowners across North America are adopting a “wait-and-see” approach amid economic uncertainty and fluctuating interest rates. This trend appears even more pronounced in the luxury sector.
Unlike traditional homeowners who may need to move for financial or employment reasons, affluent sellers often have the flexibility to delay selling until market conditions align with their expectations. Many luxury homeowners are also reluctant to relinquish historically low mortgage rates or highly desirable properties unless there is a compelling reason to do so.
The result is a market where buyers remain active, but the flow of new inventory has become increasingly constrained.
When inventory contracts while demand remains stable, competition naturally intensifies - particularly for high-quality properties in desirable locations. This appears to be exactly what is unfolding in the luxury segment.
Stable days on market and sold-to-list price ratios near parity indicate that well-positioned luxury properties are continuing to attract motivated buyers relatively quickly. Rather than waiting for additional inventory to arrive, many buyers are acting decisively when suitable properties become available.
In many markets, truly exceptional luxury inventory remains limited. Buyers understand that replacement opportunities may be scarce, particularly for turnkey homes, architecturally distinctive properties, or residences in highly sought-after neighborhoods.
This scarcity dynamic is increasingly shaping buyer behavior across North America’s luxury markets.
Another major factor supporting luxury housing demand is the continued expansion of wealth among affluent households.
2 https://nypost.com/2026/05/08/real-estate/homebuyers-sellers-growing-cautious-over-increasing-mortage-rates
Recent analysis from HousingWire3 notes that luxury real estate is increasingly moving independently from broader housing trends due to factors such as stock market performance, technology-sector wealth creation, intergenerational wealth transfers, and real estate’s growing role as a long-term wealth preservation strategy.
Even amid broader economic volatility, many affluent households continue to maintain strong balance sheets and substantial liquidity. This financial resilience is helping sustain demand for luxury real estate despite uncertainty in other sectors of the economy.
Importantly, the current market conditions do not necessarily point toward overheating. Instead, they suggest that the luxury market continues in its more normalized state, characterized by selective buyer competition and measured price growth, despite slowing inventory growth.
That distinction matters. The luxury market today is not being driven by speculative buying or unsustainable pricing surges. Instead, it is being supported by financially capable buyers competing for a relatively limited supply of desirable properties.
This is especially evident in the single-family luxury segment, where inventory shortages continue to place sellers in a position of strength. Meanwhile, the attached luxury market appears to be steadily regaining momentum after experiencing softer conditions over the past several quarters.
As the market moves further into 2026, one of the most important indicators to watch will be whether inventory levels begin to recover during the traditionally active summer and early fall periods.
If new listing activity continues to remain below historical norms while buyer demand stays stable, luxury markets across North America could face even tighter conditions later this year.
For now, the data suggests that the luxury sector continues to demonstrate resilience that exceeds broader market expectations. Declining inventory would typically signal slowing momentum, yet rising sales activity tells a very different story: one defined by affluent buyer confidence, inventory scarcity, and the enduring appeal of luxury real estate as both a lifestyle and long-term asset.
3 https://www.housingwire.com/articles/luxury-housings-resilience-why-the-top-of-the-market-is-moving-on-a-different-cycle
Single-Family Homes
Attached Homes Single-Family List Price Attached List Price
All data is based off median values. Median prices represent properties priced above respective city benchmark prices.
$1,700,000
$1,500,000
$1,300,000
$1,100,000
$900,000
$700,000
$500,000
• Official Market Type: Seller's Market with a 26.02% Sales Ratio.1
• Homes are selling for an average of 98.52% of list price.
• The median luxury threshold2 price is $900,000, and the median luxury home sales price is $1,303,250.
• Markets with the Highest Median Sales Price: Whistler ($9,700,000), Silicon Valley ($5,900,000), Los Angeles Beach Cities ($4,170,000), and Naples ($4,125,000).
• Markets with the Highest Sales Ratio: San Francisco (154.2%), Cleveland Suburbs (92.3%), Marin County (86.0%), and Hamilton County (84.4%). 1
• Official Market Type: Balanced Market with a 19.81% Sales Ratio.1
• Attached homes are selling for an average of 98.88% of list price.
• The median luxury threshold2 price is $700,000, and the median attached luxury sale price is $878,352.
• Markets with the Highest Median Sales Price: San Francisco ($2,687,000), Ft. Lauderdale ($2,250,000), Greater Boston ($2,175,000), and Park City ($2,175,000).
• Markets with the Highest Sales Ratio: Arlington & Alexandria (102.1%), Fairfax County (91.2%), San Francisco (91.0%), and Howard County (85.1%).
The Institute for Luxury Home Marketing has analyzed a number of metrics — including sales prices, sales volumes, number of sales, sales-price-to-list-price ratios, days on market and price-per-squarefoot – to provide you a comprehensive North American Luxury Market report.
Additionally, we have further examined all of the individual luxury markets to provide both an overview and an in-depth analysis - including, where data is sufficient, a breakdown by luxury singlefamily homes and luxury attached homes.
It is our intention to include additional luxury markets on a continual basis. If your market is not featured, please contact us so we can implement the necessary qualification process. More in-depth reports on the luxury communities in your market are available as well.
Looking through this report, you will notice three distinct market statuses, Buyer's Market, Seller's Market, and Balanced Market. A Buyer's Market indicates that buyers have greater control over the price point. This market type is demonstrated by a substantial number of homes on the market and few sales, suggesting demand for residential properties is slow for that market and/or price point.
By contrast, a Seller's Market gives sellers greater control over the price point. Typically, this means there are few homes on the market and a generous demand, causing competition between buyers who ultimately drive sales prices higher.
A Balanced Market indicates that neither the buyers nor the sellers control the price point at which that property will sell and that there is neither a glut nor a lack of inventory. Typically, this type of market sees a stabilization of both the list and sold price, the length of time the property is on the market as well as the expectancy amongst homeowners in their respective communities – so long as their home is priced in accordance with the current market value.
DAYS ON MARKET: Measures the number of days a home is available on the market before a purchase offer is accepted.
LUXURY BENCHMARK PRICE: The price point that marks the transition from traditional homes to luxury homes.
NEW LISTINGS: The number of homes that entered the market during the current month.
PRICE PER SQUARE FOOT: Measures the dollar amount of the home's price for an individual square foot.
SALES RATIO: Sales Ratio defines market speed and determines whether the market currently favors buyers or sellers. A Buyer's Market has a Sales Ratio of less than 12%; a Balanced Market has a ratio of 12% up to 21%; a Seller's Market has a ratio of 21% or higher. A Sales Ratio greater than 100% indicates the number of sold listings exceeds the number of listings available at the end of the month.
SP/LP RATIO: The Sales Price/List Price Ratio compares the value of the sold price to the value of the list price.
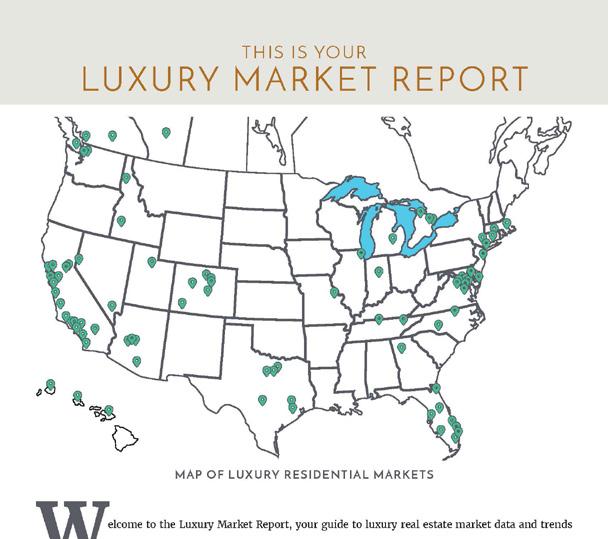
The Luxury Market Report is your guide to luxury real estate market data and trends for North America.
Produced monthly by The Institute for Luxury Home Marketing, this report provides an in-depth look at the top residential markets across the United States and Canada. Within the individual markets, you will find established luxury benchmark prices and detailed survey of luxury active and sold properties designed to showcase current market status and recent trends. The national report illustrates a compilation of the top North American markets to review overall standards and trends.
Copyright © 2026 Institute for Luxury Home Marketing | www.luxuryhomemarketing.com | 214.485.3000
The Luxury Market Report is a monthly analysis provided by The Institute for Luxury Home Marketing. Luxury benchmark prices are determined by The Institute. This active and sold data has been provided by REAL Marketing, who has compiled the data through various sources, including local MLS boards, local tax records and Realtor.com. Data is deemed reliable to the best of our knowledge, but is not guaranteed.


$5,000,000+
$4,500,000
$4,000,000 - $4,499,999
$3,500,000 - $3,999,999
$3,000,000 - $3,499,999
$2,500,000 - $2,999,999
$2,000,000 - $2,499,999
$1,750,000 - $1,999,999
$1,500,000 - $1,749,999
$1,400,000
$1,000,000 - $1,099,999
$950,000 - $999,999
$2,500,000+
$2,000,000 - $2,499,999
$1,500,000 - $1,999,999
$1,400,000
$950,000 - $999,999
$900,000 - $949,999
$850,000 - $899,999
$800,000 - $849,999
$775,000 - $799,999
$750,000 - $774,999
$725,000 - $749,999
Solds
• The median days on market for April 2026 was 33 days, up from 14 in April 2025.