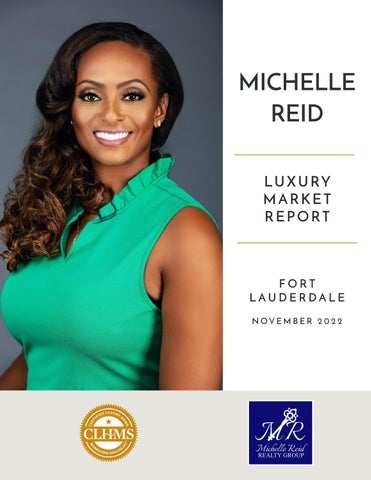
MICHELLE REID L U X U RY MARKET REPORT
FORT LAUDERDALE NOVEMBER 2022
MICHELLE REID
Broker Associate /Team Leader Luxury Home Specialist, SRS, GRI, CIPS, PSA Keller Williams Realty 2000 NW 150 Avenue, Ste 1100 | Pembroke Pines, FL 33028
954.529.7422
michellereidrealty@gmail.com www.MichelleSellsFloridaHomes.com I have a focused approach to analysis, communication, perseverance, and patience when listening to clients. My extensive knowledge of inventory, financing, and contracts, empower clients to make informed, win-win decisions. I am committed to listening carefully to the needs of clients and will set an individualized and unique plan into action to help them achieve their real estate objectives. I pledge the highest level of service possible while maintaining honesty and integrity in all that I do. Above all, I am committed to always placing the client’s goals first.
TABLE OF CONTENTS PAGE 4
LUXURY REPORT EXPLAINED
PAGE 5
WELCOME MESSAGE
PAGE 6-9
NORTH AMERICAN LUXURY MARKET REVIEW
PAGE 10
13-MONTH MARKET TRENDS
PAGE 11
SINGLE-FAMILY HOMES MONTHLY OVERVIEW
PAGE 12
ATTACHED HOMES MONTHLY OVERVIEW
PAGE 13-16 MONTHLY STATISTICS BY CITY - Single-Family Homes PAGE 17-20 MONTHLY STATISTICS BY CITY - Attached Homes PAGE 21
LOCAL LUXURY MARKET REVIEW
PAGE 22-23 SINGLE-FAMILY HOMES - Monthly Statistics PAGE 24-25 ATTACHED HOMES - Monthly Statistics PAGE 26
THANK YOU
THIS IS YOUR
LUXURY MARKET REPORT
MAP OF LUXURY RESIDENTIAL MARKETS
W
elcome to the Luxury Market Report, your guide to luxury real estate market data and trends for North America. Produced monthly by The Institute for Luxury Home Marketing, this report
provides an in-depth look at the top residential markets across the United States and Canada. Within the individual markets, you will find established luxury benchmark prices and detailed survey of luxury active and sold properties designed to showcase current market status and recent trends. The national report illustrates a compilation of the top North American markets to review overall standards and trends.
Copyright © 2022 Institute for Luxury Home Marketing | www.luxuryhomemarketing.com | 214.485.3000 The Luxury Market Report is a monthly analysis provided by The Institute for Luxury Home Marketing. Luxury benchmark prices are determined by The Institute. This active and sold data has been provided by REAL Marketing, who has compiled the data through various sources, including local MLS boards, local tax records and Realtor.com. Data is deemed reliable to the best of our knowledge, but is not guaranteed.
– LUXURY REPORT EXPLAINED – The Institute for Luxury Home Marketing has analyzed a number of metrics — including sales prices, sales volumes, number of sales, sales-price-to-list-price ratios, days on market and price-per-square-foot – to provide you a comprehensive North American Luxury Market report. Additionally, we have further examined all of the individual luxury markets to provide both an overview and an in-depth analysis - including, where data is sufficient, a breakdown by luxury single-family homes and luxury attached homes. It is our intention to include additional luxury markets on a continual basis. If your market is not featured, please contact us so we can implement the necessary qualification process. More in-depth reports on the luxury communities in your market are available as well. Looking through this report, you will notice three distinct market statuses, Buyer's Market, Seller's Market, and Balanced Market. A Buyer's Market indicates that buyers have greater control over the price point. This market type is demonstrated by a substantial number of homes on the market and few sales, suggesting demand for residential properties is slow for that market and/or price point. By contrast, a Seller's Market gives sellers greater control over the price point. Typically, this means there are few homes on the market and a generous demand, causing competition between buyers who ultimately drive sales prices higher. A Balanced Market indicates that neither the buyers nor the sellers control the price point at which that property will sell and that there is neither a glut nor a lack of inventory. Typically, this type of market sees a stabilization of both the list and sold price, the length of time the property is on the market as well as the expectancy amongst homeowners in their respective communities – so long as their home is priced in accordance with the current market value.
REPORT GLOSSARY REMAINING INVENTORY: The total number of homes available at the close of a month. DAYS ON MARKET: Measures the number of days a home is available on the market before a purchase offer is accepted. LUXURY BENCHMARK PRICE: The price point that marks the transition from traditional homes to luxury homes. NEW LISTINGS: The number of homes that entered the market during the current month. PRICE PER SQUARE FOOT: Measures the dollar amount of the home's price for an individual square foot. SALES RATIO: Sales Ratio defines market speed and determines whether the market currently favors buyers or sellers. Buyer's Market = up to 14%; Balanced Market = 15 to 20%; Seller's Market = 21% plus. If >100%, sales from previous month exceed current inventory. SP/LP RATIO: The Sales Price/List Price Ratio compares the value of the sold price to the value of the list price.
NORTH AMERICAN LUXURY REVIEW Challenging Times in a Market Full of Contradictions There is little doubt the luxury real estate market is facing some interesting challenges that even have experts contradicting each other in their predictions and assumptions. Statistics in many luxury markets still show that they are favorable to sellers – so why are homeowners remaining hesitant to list their homes? For the fourth straight month, the number of new listings entering the market has fallen, with increases in inventory levels mainly attributable to stale listings lingering on. Both sellers and buyers are sitting on the fence, with neither side wanting to jump into this unconventional market unless presented with the right opportunity. The average days on market have increased compared to last year, but relative to pre-pandemic averages, homes that have sold recently are still selling twice as fast. Outside influences, some of which are not typically identified as being impactful on affluent buyers and sellers, are also causing disruptions to their spending habits: such as concerns over a potential recession, interest rate increases, and a volatile stock market. Mortgage companies are offering creative alternatives, but even a slight dip in recent rates isn’t driving buyers to purchase despite statistics from the National Association of Realtors (NAR), the National Association of Home Builders (NAHB), and Realtor.com, showing demand still outweighs supply in many price points, property types, and locations. All indications are that those who need to buy and/or sell are continuing to do so, but for those whose criteria are more based on ‘wanting to buy,’ there is hesitancy as they hope inventory choice will improve and/or prices will become more favorable.
Will Prices Fall? This is a big question, and yet the jury remains cautious as to what extent prices will fall and which locations, property types, and sizes will be most affected. Since July 2022, there has been a slight, but continued decline in the median sold price for single family homes dropping from $1,311,000 in July to $1,275,000 in September; however, in October, the median price climbed back up to $1,313,525. In contrast, in the attached luxury property market, the median sold price increased from $832,375 in July 2022 to $890,500 in September, only to drop to $878,500 in October. These are not dramatic swings, but they show there is some volatility in the luxury market. Interestingly, a recent article by Nasdaq1 speaks to an increase in the ultra-wealthy currently investing in luxury real estate. “As the value of the dollar remains volatile, we’ve seen more new clients looking to park their money in a low-risk, luxury asset whose likelihood of appreciation is higher, forged by historically beautiful surrounding neighborhoods, sprawling acreage and square footage, and newly renovated constructions.” According to their article and The Trend Report 20222 by Coldwell Banker Global Luxury, they foresee the value of luxury properties will continue to appreciate. Both site the historic gains in this segment of the real estate market and explain that prices will oscillate by month or quarter, but how the appreciation is clearly recognized by investors and homeowners as being a long-term decision. “Prone to behaving cautiously, the affluent have begun to signal that they are looking for more stable long-term investments to protect their wealth and give them peace of mind.”
Shift in Mindset The Trend Report also sheds light on why affluent homeowners have shifted from their fearless and ‘FOMO’ buying of last year to taking a more considered approach. “Between rising economic uncertainty, stock and crypto market volatility, climate change, and two years of living through an unprecedented health crisis, wealthy buyers have begun turning toward opportunities that give them long-term financial security and quality of life. Real estate generally offers reliability and stability for those investors who are able to play the long game: hold onto their asset when the market trends down and wait until prices start to rise again.” Equally, with interest rates more than double compared to 2020, 2021, and the first quarter of 2022, many homeowners recognize that selling their home to purchase another would be an expensive replacement unless they need to sell. This has led to many sellers deciding not to put their homes on the market, which, when combined with buyers taking more time to make their decisions, has ultimately resulted in the slowing down of the market.
Demand vs. Supply It is supply rather than demand that is creating the bigger conundrum in the market today. Buyers are still eager to buy, albeit at a slower pace, but there is simply a lack of new inventory entering the market. Inventory levels may have increased compared to last year, but without new inventory, the return to pre-pandemic levels is unlikely, adding a further complication for buyers as current levels are unlikely to create the downward pressure on home prices they anticipate. According to Nasdaq, there has never been more liquidity on the buyers’ side for quality homes, but until sellers’ price expectations start to align with buyers’ perception of value, we will continue to see this contradiction in the market.
Not All Markets Are Equal After two years of affluent buyers heading away from urban centers, there has been a significant return to traditional centers of luxury in 2022, and old favorites across North America, such as New York, Boston, Chicago, Toronto, and Vancouver, are seeing the benefits of this demand. While prices decreased during the pandemic for the smaller city footprints, they subsequently became comparatively more affordable against the escalating values seen in rural destinations, emerging markets, and resort markets. Much like the ownership of luxury real estate, these metropolises have once again been recognized by the affluent as locations that will hold their value over the long term – seen equally by domestic and returning foreign investors as safe investment havens. In contrast, markets that benefited from the demand frenzy of 2020 and 2021 and the subsequent influx of buyers may see the greatest cooling off during the last part of 2022. Indeed, compared to 2021, the velocity of sales has already dropped significantly in many, and expectations are that demand and prices will settle into a more mature rhythm in 2023.
Luxury Market Still Offers Opportunity While there is much debate about how things will play out over the next six months, like all markets, there is always an opportunity for those who are ready. There are niches in every market: whether moving to a location that affords a better cost of living, recognizing luxury pockets or property types that are next in the demand cycle, or simply biding one’s time in anticipation of finding a property that is below market value. But more importantly, according to a survey conducted by Coldwell Banker Global Luxury for their Trend Report, it seems that luxury real estate remains an important asset for the affluent. “Regardless of an affluent buyer’s financial profile, there is still significant confidence in the luxury real estate market. According to our survey, nearly 90% of respondents believe in the stability of owning property. Even if some buyers have dropped out of the real estate game due to fatigue, frustration, or even hesitation this year, they may be primed to return as inventory levels improve.”
– 13 - MONTH MARKET TRENDS – FOR THE LUXURY NORTH AMERICAN MARKET
Single-Family Homes
Attached Homes
Single-Family List Price
Attached List Price
All data is based off median values. Median prices represent properties priced above respective city benchmark prices.
22 20
16
14
15
12
10
12
11
9
9
8
5
OCT
NOV
DEC
23
18
18
16
JAN
FEB
MAR
8
8
8
9
APR
MAY
21
18
13
10
JUN
JUL
AUG
SEP
OCT
$300
$429
$521
$525 $429
$417
$430
$521
$538
$546 $426
$540 $437
$441
$524
$536
$421
$525 $412
$509 $407
$390
$415
$400
$496
$500
$534
$600
$396
PRICE PER SQUARE FOOT
19
18
15
15
0
$200
$100
$0
SALES PRICE VS. LIST PRICE
24
25
$495
DAYS ON MARKET
30
OCT
NOV
DEC
JAN
FEB
MAR
APR
MAY
JUN
JUL
AUG
SEP
OCT
$1,900,000 $1,700,000 $1,500,000 $1,300,000 $1,100,000 $900,000 $700,000
$500,000
OCT
NOV
DEC
JAN
FEB
MAR
APR
MAY
JUN
JUL
AUG
SEP
OCT
Discrepancies in previous month statistics between the October 2022 and November 2022 reports are due to the addition of Bergen County, NJ, Hudson County, NJ, and The Grand Strand, SC.
– LUXURY MONTHLY MARKET REVIEW – A Review of Key Market Differences Year over Year October 2021 | October 2022
SINGLE-FAMILY HOMES October 2021
October 2022
October 2021
October 2022
Median List Price
$1,749,000
$1,618,750
Total Inventory
31,739
54,593
Median Sale Price
$1,368,250
$1,313,525
New Listings
10,415
16,346
99.74%
98.10%
Total Sold
16,983
13,532
53.51%
24.79%
Median Days on Market
16
24
$396
$429
3,428
3,204
Median SP/LP Ratio Total Sales Ratio Median Price per Sq. Ft.
Average Home Size
Median prices represent properties priced above respective city benchmark prices.
5,391
3,451
New Listings
Total Sold
9
28.72%
Med. Sale Price
Days on Market
Sales Ratio
54,725
$
SINGLE-FAMILY HOMES MARKET SUMMARY | OCTOBER 2022 •
Official Market Type: Seller's Market with a 24.79% Sales Ratio.1
•
Homes are selling for an average of 98.10% of list price.
•
The median luxury threshold2 price is $937,500, and the median luxury home sales price is $1,313,525.
•
Markets with the Highest Median Sales Price: Aspen ($15,750,000), Whistler ($6,000,000), Vail ($4,995,000), and Los Angeles Beach Cities ($4,550,000).
•
Markets with the Highest Sales Ratio: Cleveland Suburbs (100%), Hamilton County (73%) East Bay (69%), and Smith Mountain Lake (64%). 1
Sales Ratio defines market speed and market type: Buyer's < 15.5%; Balanced >= 15.5 to < 20.5%; Seller's >= 20.5% plus. If >100%, sales from previous month exceeds current inventory. 2The luxury threshold price is set by The Institute for Luxury Home Marketing.
– LUXURY MONTHLY MARKET REVIEW – A Review of Key Market Differences Year over Year October 2021 | October 2022
ATTACHED HOMES October 2021
October 2022
October 2021
Median List Price
$1,075,000
$962,500
Total Inventory
Median Sale Price
$860,450
$878,500
100.00%
Median SP/LP Ratio Total Sales Ratio Median Price per Sq. Ft.
October 2022
12,005
16,675
New Listings
4,241
5,427
98.57%
Total Sold
5,315
3,781
44.27%
22.67%
Median Days on Market
12
23
$495
$515
1,907
1,844
Average Home Size
Median prices represent properties priced above respective city benchmark prices.
1,186
1,534
New Listings
Total Sold
Med. Sale Price
Days on Market
18,050
$
11
21.60% Sales Ratio
ATTACHED HOMES MARKET SUMMARY | OCTOBER 20 22 •
Official Market Type: Seller's Market with a 22.67% Sales Ratio.1
•
Attached homes are selling for an average of 98.57% of list price.
•
The median luxury threshold2 price is $700,000, and the median attached luxury sale price is $878,500.
•
Markets with the Highest Median Sales Price: Aspen ($3,687,500), Whistler ($2,719,000), Vail ($2,650,000), and San Francisco ($2,400,000).
•
Markets with the Highest Sales Ratio: South Shore (100%), Howard County (89%), East Bay (74%), and Douglas County (72%). 1
Sales Ratio defines market speed and market type: Buyer's < 15.5%; Balanced >= 15.5 to < 20.5%; Seller's >= 20.5% plus. If >100%, sales from previous month exceeds current inventory. 2The luxury threshold price is set by The Institute for Luxury Home Marketing.
– LUXURY MONTHLY MARKET REVIEW – SINGLE-FAMILY HOMES State Market Name
Median List Price
Median Sold Price
Inventory
New Listings
Sold
Days on Market
Market Status
AB
Calgary
$1,100,000
$985,000
499
218
161
24
Seller's
AZ
Chandler and Gilbert
$1,099,000
$950,000
259
72
63
47
Seller's
AZ
Flagstaff
$1,549,000
$1,500,000
73
15
13
85
Balanced
AZ
Mesa
$857,450
$860,000
246
80
63
49
Seller's
AZ
Paradise Valley
$5,200,000
$3,225,000
164
38
13
97
Buyer's
AZ
Phoenix
$849,900
$805,260
916
273
248
50
Seller's
AZ
Scottsdale
$1,950,000
$1,500,000
763
189
134
54
Balanced
AZ
Tucson
$695,000
$650,000
921
284
201
14
Seller's
BC
Mid Vancouver Island
$1,675,000
$1,530,000
185
65
23
29
Buyer's
BC
Okanagan Valley
$1,788,000
$1,550,000
847
221
45
40
Buyer's
BC
Vancouver
$4,480,000
$3,300,000
1118
251
57
24
Buyer's
BC
Victoria
$2,395,000
$2,038,750
133
55
28
16
Seller's
BC
Whistler
$4,899,000
$6,000,000
57
14
1
71
Buyer's
CA
Central Coast
$2,750,000
$2,400,000
249
65
55
27
Seller's
CA
East Bay
$2,198,800
$1,930,000
550
253
379
14
Seller's
CA
Greater Palm Springs
$1,842,500
$1,600,000
364
142
63
27
Balanced
CA
Lake Tahoe
$2,495,000
$1,712,500
168
40
42
52
Seller's
CA
Los Angeles Beach Cities
$6,342,500
$4,550,000
326
110
55
31
Balanced
CA
Los Angeles City
$4,999,950
$3,380,000
687
199
99
25
Buyer's
CA
Los Angeles The Valley
$2,497,000
$2,090,000
514
201
126
17
Seller's
CA
Marin County
$4,495,000
$2,650,000
124
21
49
13
Seller's
CA
Napa County
$3,995,000
$1,942,500
125
17
10
55
Buyer's
CA
Orange County
$2,600,000
$2,100,000
1006
270
269
24
Seller's
CA
Placer County
$1,158,000
$1,036,520
295
98
73
16
Seller's
CA
Sacramento
$964,990
$913,750
647
224
232
18
Seller's
CA
San Diego
$2,199,000
$1,900,000
949
356
253
20
Seller's
CA
San Francisco
$4,598,000
$3,350,000
173
44
51
12
Seller's
CA
San Luis Obispo County
$1,800,000
$1,350,000
188
51
49
42
Seller's
CA
Santa Barbara
$4,995,000
$3,000,000
107
28
38
33
Seller's
CA
Silicon Valley
$3,988,000
$3,250,000
541
225
229
12
Seller's
CA
Sonoma County
$2,495,000
$1,725,000
217
33
44
46
Balanced
CA
Ventura County
$2,024,500
$1,717,756
250
78
73
34
Seller's
CO
Aspen
$14,250,000
$15,750,000
89
6
8
96
Buyer's
CO
Boulder
$2,250,000
$1,473,306
230
80
59
42
Seller's
CO
Colorado Springs
$899,900
$887,778
416
103
120
32
Seller's
CO
Denver
$1,597,000
$1,425,000
600
187
208
12
Seller's
CO
Douglas County
$1,380,000
$1,227,500
297
90
80
20
Seller's
Median prices represent properties priced above respective city benchmark prices. Prices shown for Canadian cites are shown in Canadian Dollars.
– LUXURY MONTHLY MARKET REVIEW – SINGLE-FAMILY HOMES State Market Name
Median List Price
Median Sold Price
Inventory
New Listings
Sold
Days on Market
Market Status
CO
Durango
$1,600,000
$1,252,000
115
20
18
59
Balanced
CO
Summit County
$3,345,000
$2,700,000
75
6
11
58
Buyer's
CO
Telluride
$5,995,000
$3,200,000
74
9
13
89
Balanced
CO
Vail
$4,500,000
$4,995,000
79
7
17
77
Seller's
CT
Central Connecticut
$699,999
$615,000
382
91
147
19
Seller's
CT
Coastal Connecticut
$2,395,000
$1,500,000
573
141
127
32
Seller's
DC
Washington D.C.
$3,700,000
$2,410,000
43
11
14
11
Seller's
DE
Sussex County Coastal
$1,474,990
$1,320,000
153
29
27
11
Balanced
FL
Boca Raton/Delray Beach
$2,499,000
$1,778,700
483
113
67
25
Buyer's
FL
Coastal Pinellas County
$2,425,000
$1,900,000
106
32
17
30
Balanced
FL
Greater Fort Lauderdale
$1,350,000
$1,050,000
1614
455
205
33
Buyer's
FL
Jacksonville Beaches
$1,375,000
$1,226,184
315
80
88
38
Seller's
FL
Lee County
$1,379,900
$1,222,500
449
100
62
31
Buyer's
FL
Marco Island
$2,790,000
$2,250,000
99
18
11
69
Buyer's
FL
Miami
$2,000,000
$1,450,000
959
239
109
52
Buyer's
FL
Naples
$4,950,000
$3,500,000
301
85
39
47
Buyer's
FL
Orlando
$1,250,000
$1,122,500
678
168
186
15
Seller's
FL
Palm Beach Towns
$3,050,000
$1,725,000
271
58
19
20
Buyer's
FL
Sarasota & Beaches
$2,900,000
$1,676,000
278
78
53
26
Balanced
FL
South Pinellas County
$1,600,000
$1,220,000
294
97
62
31
Seller's
FL
South Walton
$2,340,000
$1,900,000
417
68
47
26
Buyer's
FL
Space Coast
$839,900
$750,000
351
109
86
21
Seller's
FL
Tampa
$744,995
$700,000
1304
348
357
18
Seller's
FL
Weston
$1,199,500
$985,000
139
46
26
35
Balanced
GA
Atlanta
$1,595,000
$1,180,821
652
224
210
12
Seller's
GA
Duluth
$1,637,500
$1,270,000
22
10
2
65
Buyer's
HI
Island of Hawaii
$1,960,000
$1,525,000
120
24
21
50
Balanced
HI
Kauai
$3,790,000
$1,800,000
25
4
5
76
Balanced
HI
Maui
$2,950,000
$2,550,000
139
24
21
108
Balanced
HI
Oahu
$2,900,000
$2,362,500
207
43
24
21
Buyer's
ID
Ada County
$789,900
$754,000
836
241
295
21
Seller's
ID
Northern Idaho
$1,599,000
$1,350,000
401
86
59
92
Buyer's
IL
Chicago
$1,579,000
$1,250,000
655
196
188
26
Seller's
IL
DuPage County
$1,148,000
$912,000
307
88
71
29
Seller's
IL
Lake County
$1,185,000
$877,500
257
72
67
14
Seller's
IL
Will County
$650,000
$597,000
231
74
91
21
Seller's
IN
Hamilton County
$849,950
$750,000
173
55
126
4
Seller's
Median prices represent properties priced above respective city benchmark prices. Prices shown for Canadian cites are shown in Canadian Dollars.
– LUXURY MONTHLY MARKET REVIEW – SINGLE-FAMILY HOMES State Market Name
Median List Price
Median Sold Price
New Inventory Listings
Sold
Days on Market
Market Status
KS ON
Johnson County GTA - Durham
$825,000 $1,749,000
$867,502 $1,555,000
429 211
80 136
129 46
5 14
Seller's
MA ON
Cape GTA -Cod York
$2,495,000 $2,375,000
$1,789,500 $1,880,000
135 563
40 327
38 137
22 13
Seller's
MA ON
Greater Boston Hamilton
$2,950,000 $1,839,500
$3,250,000 $1,510,000
133 254
49 121
17 27
15 23
Buyer's
MA ON
South Shore Mississauga
$1,875,000 $2,950,000
$1,350,000 $2,310,000
72 137
23 64
27 26
24 18
Seller's Balanced
MD ON
Anne Arundel County Oakville
$999,999 $2,514,900
$954,950 $2,400,000
190 132
57 82
74 33
9 17
Seller's Seller's
MD ON
Frederick County Toronto
$875,000 $3,799,444
$847,353 $3,100,000
62 420
20 178
22 54
11 20
Seller's Buyer's
MD ON
Howard County Waterloo Region
$1,129,990 $1,474,000
$1,085,000 $1,300,000
111 166
24 103
32 49
19 12
Seller's Seller's
MD OR
Montgomery County Portland
$1,892,000 $1,350,000
$1,556,000 $1,075,000
186 615
66 248
75 283
7 6
Seller's Seller's
MD QC MD SC MI TN MI TN MI TX MI TX MI TX MN TX MN TX MO TX MO TX NC TX NC TX NC TX NC TX NJ TX NJ UT NJ
Talbot County Montreal Worcester County Hilton Head Livingston County Greater Chattanooga Monroe County Nashville Oakland County Austin Washtenaw County Collin County Wayne County Dallas Olmsted County Denton County Twin Cities El Paso Kansas City Fort Worth St. Louis Greater Tyler Asheville Houston Charlotte Lubbock Lake Norman San Angelo Raleigh-Durham San Antonio Bergen County The Woodlands & Spring Hudson County Park City Ocean County
$1,995,000 $1,999,000 $1,000,000 $2,095,000 $765,000 $965,000 $624,500 $1,699,900 $750,000 $1,098,222 $885,000 $749,000 $699,900 $1,300,000 $799,000 $775,786 $1,180,000 $610,800 $675,000 $825,000 $825,000 $737,500 $1,100,000 $979,000 $1,099,000 $652,500 $1,192,500 $650,000 $1,100,000 $799,070 $2,299,995 $809,000 $1,699,500 $4,250,000 $899,900
$1,800,000 $1,600,000 $855,000 $1,349,000 $695,000 $824,000 $567,500 $1,355,500 $650,000 $995,000 $770,000 $717,786 $615,200 $1,004,001 $750,000 $750,000 $985,000 $583,000 $662,431 $800,000 $675,000 $611,500 $892,500 $880,000 $935,000 $599,950 $1,110,750 $594,950 $947,500 $717,515 $1,672,000 $741,000 $1,587,500 $3,075,000 $850,000
39 363 53 243 87 180 16 653 905 1242 167 1445 221 450 81 1101 681 154 1402 970 121 148 255 1149 645 88 198 51 550 636 271 213 20 202 494
7 87 9 58 22 49 3 246 316 586 35 681 84 209 22 508 196 53 256 393 51 77 90 439 229 34 48 27 161 262 51 119 2 57 135
13 16 10 55 28 43 4 220 246 354 44 627 85 186 23 425 197 29 384 465 66 48 68 333 295 28 80 16 174 191 100 162 8 16 132
10 39 22 12 33 4 40 4 20 9 24 11 11 11 10 9 22 15 10 8 19 9 14 9 8 50 14 68 4 16 21 7 29 7 19
Seller's Buyer's Balanced Seller's Seller's Seller's Seller's Seller's Seller's Seller's Seller's Seller's Seller's Seller's Seller's Seller's Seller's Balanced Seller's Seller's Seller's Seller's Seller's Seller's Seller's Seller's Seller's Seller's Seller's Seller's Seller's Seller's Seller's Buyer's Seller's
UT NM
Salt Lake City Taos
$1,132,096 $1,195,000
$979,000 $1,057,025
469 69
210 7
157 18
21 52
Seller's Seller's
VA NV
Arlington & Alexandria Lake Tahoe
$2,250,000 $3,495,000
$1,850,000 $2,397,500
77 138
32 18
49 26
6 133
Seller's Balanced
VA NV
Charlottesville Las Vegas
$1,300,000 $1,699,000
$1,019,000 $1,537,906
144 724
22 188
44 91
6 36
Seller's Buyer's
VA NV
Fairfax County Reno
$1,999,900 $1,950,000
$1,500,000 $1,725,000
346 142
113 25
152 17
7 84
Seller's Buyer's
VA NY
McLeanLakes & Vienna Finger
$2,750,000 $1,999,000
$1,850,000 $1,269,000
147 39
31 10
61 12
6 10
Seller's Seller's
VA NY
Richmond Nassau County
$799,900 $1,800,000
$790,153 $1,549,500
291 749
110 157
197 130
6 34
Seller's Balanced
VA NY
Smith Mountain Lake Staten Island
$1,750,000 $1,275,000
$1,325,000 $1,251,250
33 175
9 40
8 30
4 50
Seller's Balanced
WA NY
King County - Greater Seattle Suffolk County
$1,970,000 $1,850,000
$1,695,000 $1,250,000
1014 906
543 180
538 150
6 44
Seller's Balanced
WA OH
Seattle Cincinnati
$1,893,217 $849,900
$1,715,000 $700,000
254 225
140 54
167 73
6 2
Seller's
OH WA
Cleveland Suburbs Spokane
$789,500 $1,150,000
$667,700 $987,500
30 135
7 62
30 46
20 9
Seller's
NY
Suffolk County
$1,900,000
$1,185,000
845
189
168
35
Balanced
Median prices represent properties priced above respective city benchmark prices. Prices shown for Canadian cites are shown in Canadian Dollars.
– LUXURY MONTHLY MARKET REVIEW – SINGLE-FAMILY HOMES State Market Name
Median List Price
Median Sold Price
New Inventory Listings
Sold
Days on Market
Market Status
ON
GTA - Durham
$1,882,500 $1,749,000
$1,525,000 $1,555,000
192 211
125 136
33 46
13 14
Balanced Seller's
ON
GTA - York
$2,539,000 $2,375,000
$1,847,500 $1,880,000
476 563
264 327
114 137
18 13
Seller's
ON
Hamilton
$1,893,500 $1,839,500
$1,550,000 $1,510,000
216 254
88 121
25 27
34 23
Buyer's
ON ON
Mississauga Mississauga
$2,899,999 $2,950,000
$2,488,000 $2,310,000
121 137
65 64
9 26
22 18
Buyer's Balanced
ON ON
Oakville Oakville
$2,424,950 $2,514,900
$2,300,000 $2,400,000
118 132
78 82
25 33
19 17
Seller's Seller's
ON ON
Toronto Toronto
$3,799,888 $3,799,444
$3,200,000 $3,100,000
403 420
240 178
85 54
13 20
Seller's Buyer's
ON ON
Waterloo Region Region Waterloo
$1,449,000 $1,474,000
$1,350,000 $1,300,000
121 166
65 103
4 49
35 12
Buyer's Seller's
OR OR
Portland Portland
$1,361,450 $1,350,000
$1,112,998 $1,075,000
636 615
167 248
166 283
16 6
Seller's Seller's
QC QC SC SC SC TN TN TN TN TX TX TX TX TX TX TX TX TX TX TX TX TX TX TX TX TX TX TX TX TX TX TX TX UT UT
Montreal Montreal Hilton Head Hilton Head The Grand Strand Greater Chattanooga Greater Chattanooga Nashville Nashville Austin Austin Collin County Collin County Dallas Dallas Denton County Denton County El Paso El Paso Fort Worth Fort Worth Greater Tyler Greater Tyler Houston Houston Lubbock Lubbock San Angelo San Angelo San Antonio San Antonio The Woodlands & Spring The Woodlands & Spring Park City Park City
$1,899,000 $1,999,000 $2,025,000 $2,095,000 $1,100,999 $965,000 $992,500 $1,699,900 $1,736,000 $1,098,222 $1,100,000 $749,000 $749,900 $1,300,000 $1,300,000 $775,786 $759,347 $610,800 $610,800 $825,000 $849,987 $737,500 $799,000 $979,000 $972,450 $652,500 $640,000 $650,000 $643,944 $799,070 $799,000 $809,000 $831,250 $4,250,000 $4,925,000
$1,785,000 $1,600,000 $1,392,500 $1,349,000 $785,000 $824,000 $804,750 $1,355,500 $1,220,000 $995,000 $942,500 $717,786 $695,000 $1,004,001 $1,157,375 $750,000 $733,135 $583,000 $585,000 $800,000 $799,950 $611,500 $621,900 $880,000 $872,000 $599,950 $599,500 $594,950 $571,750 $717,515 $731,250 $741,000 $740,000 $3,075,000 $3,438,850
349 363 248 243 365 180 216 653 705 1242 1165 1445 1417 450 459 1101 1100 154 175 970 963 148 197 1149 1158 88 114 51 50 636 670 213 212 202 168
69 87 52 58 363 49 58 246 229 586 360 681 463 209 177 508 325 53 38 393 311 77 65 439 397 34 41 27 15 262 198 119 89 57 27
17 16 46 55 92 43 38 220 207 354 246 627 405 186 162 425 298 29 25 465 268 48 37 333 242 28 30 16 12 191 124 162 83 16 24
73 39 14 12 83 4 8 4 9 9 30 11 26 11 21 9 26 15 29 8 21 9 18 9 20 50 76 68 55 16 43 7 16 7 38
Buyer's Buyer's Balanced Seller's Seller's Seller's Balanced Seller's Seller's Seller's Seller's Seller's Seller's Seller's Seller's Seller's Seller's Balanced Buyer's Seller's Seller's Seller's Balanced Seller's Balanced Seller's Seller's Seller's Seller's Seller's Balanced Seller's Seller's Buyer's Buyer's
UT UT
Salt Salt Lake Lake City City
$1,132,096 $1,150,000
$979,000 $1,001,850
469 467
210 116
157 120
21 41
Seller's Seller's
VA VA
Arlington Arlington & & Alexandria Alexandria
$2,250,000 $2,179,000
$1,850,000 $1,835,000
77 99
32 33
49 29
6 11
Seller's Seller's
VA VA
Charlottesville Charlottesville
$1,300,000 $1,399,000
$1,019,000 $992,495
144 137
22 31
44 32
6 5
Seller's Seller's
VA VA
Fairfax Fairfax County County
$1,999,900 $2,095,000
$1,500,000 $1,475,000
346 335
113 110
152 99
7 13
Seller's Seller's
VA VA
McLean McLean & & Vienna Vienna
$2,750,000 $2,695,000
$1,850,000 $1,897,500
147 164
31 46
61 34
6 14
Seller's Balanced
VA
Richmond
$799,900 $799,950
$790,153 $799,950
291 325
110 81
197 151
6 8
Seller's
VA
Smith Mountain Lake
$1,750,000 $1,662,500
$1,325,000 $1,307,050
33 22
9 6
8 14
4 18
Seller's
WA
King County - Greater Seattle
$1,970,000 $1,899,000
$1,695,000 $1,625,000
1014 1079
543 410
538 439
6 12
Seller's
WA
Seattle
$1,893,217 $1,850,000
$1,715,000 $1,675,000
254 257
140 104
167 111
6 8
Seller's
WA
Spokane
$1,200,000 $1,150,000
$1,100,000 $987,500
103 135
33 62
36 46
11 9
Seller's
NY
Suffolk County
$1,900,000
$1,185,000
845
189
168
35
Balanced
Median prices represent properties priced above respective city benchmark prices. Prices shown for Canadian cites are shown in Canadian Dollars.
– LUXURY MONTHLY MARKET REVIEW – ATTACHED HOMES State Market Name
Median List Price
Median Sold Price
Inventory
New Listings
Sold
Days on Market
Market Status
AB
Calgary
$799,900
$761,000
129
44
34
64
Seller's
AZ
Chandler and Gilbert
-
-
-
-
-
-
-
AZ
Flagstaff
-
-
-
-
-
-
-
AZ
Mesa
-
-
-
-
-
-
-
AZ
Paradise Valley
-
-
-
-
-
-
-
AZ
Phoenix
-
-
-
-
-
-
-
AZ
Scottsdale
$867,450
$760,000
228
78
42
48
Balanced
AZ
Tucson
-
-
-
-
-
-
-
BC
Mid Vancouver Island
$877,000
$799,000
60
16
6
21
Buyer's
BC
Okanagan Valley
-
-
-
-
-
-
-
BC
Vancouver
$1,980,000
$1,677,500
1077
372
66
11
Buyer's
BC
Victoria
$989,450
$932,500
118
50
36
26
Seller's
BC
Whistler
$2,499,000
$2,719,000
39
13
9
11
Seller's
CA
Central Coast
$1,185,000
$1,257,500
32
15
16
11
Seller's
CA
East Bay
$1,190,000
$1,100,000
169
101
125
16
Seller's
CA
Greater Palm Springs
-
-
-
-
-
-
-
CA
Lake Tahoe
$1,495,000
$1,160,000
63
20
16
90
Seller's
CA
Los Angeles Beach Cities
$1,895,000
$1,750,000
168
72
51
17
Seller's
CA
Los Angeles City
$1,695,000
$1,400,000
377
116
55
20
Buyer's
CA
Los Angeles The Valley
$799,000
$787,000
139
53
56
26
Seller's
CA
Marin County
$1,195,000
$1,260,000
33
8
13
14
Seller's
CA
Napa County
-
-
-
-
-
-
-
CA
Orange County
$1,200,000
$1,024,998
405
160
166
24
Seller's
CA
Placer County
-
-
-
-
-
-
-
CA
Sacramento
-
-
-
-
-
-
-
CA
San Diego
$1,185,000
$1,051,600
329
144
126
18
Seller's
CA
San Francisco
$2,695,000
$2,400,000
143
29
27
27
Balanced
CA
San Luis Obispo County
-
-
-
-
-
-
-
CA
Santa Barbara
$1,615,000
$1,477,500
15
8
8
11
Seller's
CA
Silicon Valley
$1,750,000
$1,570,000
125
61
59
14
Seller's
CA
Sonoma County
$985,000
$712,800
20
3
3
41
Balanced
CA
Ventura County
$750,000
$742,500
111
37
40
35
Seller's
CO
Aspen
$3,699,000
$3,687,500
35
3
6
81
Balanced
CO
Boulder
$900,615
$838,877
71
19
22
49
Seller's
CO
Colorado Springs
$598,290
$587,000
48
8
7
29
Buyer's
CO
Denver
$975,000
$779,500
159
49
34
12
Seller's
CO
Douglas County
$559,495
$632,851
18
2
13
17
Seller's
Markets with dashes do not have a significant luxury market for this report. Median prices represent properties priced above respective city benchmark prices. Prices shown for Canadian cites are shown in Canadian Dollars.
– LUXURY MONTHLY MARKET REVIEW – ATTACHED HOMES State Market Name
Median List Price
Median Sold Price
Inventory
New Listings
Sold
Days on Market
Market Status
CO
Durango
$793,905
$886,000
26
9
11
100
Seller's
CO
Summit County
$1,650,000
$1,022,000
31
6
8
64
Seller's
CO
Telluride
-
-
-
-
-
-
-
CO
Vail
$3,900,000
$2,650,000
69
15
14
36
Balanced
CT
Central Connecticut
-
-
-
-
-
-
-
CT
Coastal Connecticut
$1,402,000
$777,500
186
34
40
25
Seller's
DC
Washington D.C.
$1,895,000
$1,595,000
253
90
51
6
Balanced
DE
Sussex County Coastal
$950,000
$975,000
27
7
11
5
Seller's
FL
Boca Raton/Delray Beach
$932,000
$830,000
300
87
59
20
Balanced
FL
Coastal Pinellas County
$1,299,500
$1,175,000
108
31
28
22
Seller's
FL
Greater Fort Lauderdale
$844,500
$727,500
990
246
116
46
Buyer's
FL
Jacksonville Beaches
$1,199,000
$887,500
43
15
18
31
Seller's
FL
Lee County
$835,500
$870,000
194
39
39
34
Balanced
FL
Marco Island
$1,669,900
$1,625,000
33
6
7
95
Seller's
FL
Miami
$1,399,700
$1,350,000
1332
274
114
57
Buyer's
FL
Naples
$2,296,250
$2,100,000
142
32
29
21
Balanced
FL
Orlando
$567,000
$553,000
218
58
62
39
Seller's
FL
Palm Beach Towns
$1,700,000
$1,950,000
241
58
13
58
Buyer's
FL
Sarasota & Beaches
$1,695,000
$1,385,000
127
31
36
22
Seller's
FL
South Pinellas County
$1,050,000
$995,000
189
50
40
23
Seller's
FL
South Walton
$1,573,400
$1,450,000
236
37
19
44
Buyer's
FL
Space Coast
$738,000
$734,000
145
40
27
17
Balanced
FL
Tampa
$849,995
$870,000
200
74
71
3
Seller's
FL
Weston
-
-
-
-
-
-
-
GA
Atlanta
$720,290
$665,000
488
162
128
17
Seller's
GA
Duluth
-
-
-
-
-
-
-
HI
Island of Hawaii
$1,795,000
$1,535,000
51
10
7
30
Buyer's
HI
Kauai
$1,574,500
$1,240,000
20
4
4
8
Balanced
HI
Maui
$2,295,000
$1,487,500
61
16
20
70
Seller's
HI
Oahu
$1,195,000
$990,000
421
114
119
34
Seller's
ID
Ada County
$649,888
$580,000
63
22
11
60
Balanced
ID
Northern Idaho
-
-
-
-
-
-
-
IL
Chicago
$1,199,500
$958,304
851
251
110
35
Buyer's
IL
DuPage County
$925,000
$775,000
19
8
13
14
Seller's
IL
Lake County
-
-
-
-
-
-
-
IL
Will County
-
-
-
-
-
-
-
IN
Hamilton County
-
-
-
-
-
-
-
Markets with dashes do not have a significant luxury market for this report. Median prices represent properties priced above respective city benchmark prices. Prices shown for Canadian cites are shown in Canadian Dollars.
– LUXURY MONTHLY MARKET REVIEW – ATTACHED HOMES State Market Name
Median List Price
Median Sold Price
New Inventory Listings
Sold
Days on Market
Market Status
KS ON
Johnson County GTA - Durham
$590,950 $1,749,000
$596,808 $1,555,000
115 211
9 136
34 46
15 14
Seller's
MA ON
Cape GTA -Cod York
$850,000 $2,375,000
$736,000 $1,880,000
25 563
7 327
10 137
67 13
Seller's
MA ON
Greater Boston Hamilton
$2,299,000 $1,839,500
$1,900,000 $1,510,000
377 254
112 121
55 27
24 23
Buyer's
MA ON
South Shore Mississauga
$899,000 $2,950,000
$999,995 $2,310,000
15 137
4 64
15 26
64 18
Seller's Balanced
MD ON
Anne Arundel County Oakville
$569,990 $2,514,900
$551,000 $2,400,000
59 132
26 82
24 33
13 17
Seller's Seller's
MD ON
Frederick Toronto County
$3,799,444
$3,100,000
420
178
54
20
Buyer's
MD ON
Howard County Waterloo Region
$584,990 $1,474,000
$585,000 $1,300,000
27 166
13 103
24 49
6 12
Seller's Seller's
MD OR
Montgomery County Portland
$795,000 $1,350,000
$760,000 $1,075,000
96 615
40 248
67 283
10 6
Seller's Seller's
MD QC MD SC MI TN MI TN MI TX MI TX MI TX MN TX MN TX MO TX MO TX NC TX NC TX NC TX NC TX NJ TX NJ UT NJ
Talbot County Montreal Worcester County Hilton Head Livingston County Greater Chattanooga Monroe County Nashville Oakland County Austin Washtenaw County Collin County Wayne County Dallas Olmsted County Denton County Twin Cities El Paso Kansas City Fort Worth St. Louis Greater Tyler Asheville Houston Charlotte Lubbock Lake Norman San Angelo Raleigh-Durham San Antonio Bergen County The Woodlands & Spring Hudson County Park City Ocean County
$1,999,000 $725,000 $2,095,000 $965,000 $1,699,900 $645,467 $1,098,222 $630,000 $749,000 $665,186 $1,300,000 $775,786 $610,800 $825,000 $737,500 $710,000 $979,000 $657,436 $652,500 $585,754 $650,000 $799,070 $1,234,684 $809,000 $1,487,500 $4,250,000 $849,000
$1,600,000 $602,450 $1,349,000 $824,000 $1,355,500 $624,103 $995,000 $622,290 $717,786 $607,500 $1,004,001 $750,000 $583,000 $800,000 $611,500 $660,000 $880,000 $618,082 $599,950 $570,000 $594,950 $717,515 $1,026,652 $741,000 $1,287,500 $3,075,000 $717,000
363 66 243 180 653 68 1242 56 1445 80 450 1101 154 970 148 40 1149 197 88 33 51 636 136 213 104 202 29
87 27 58 49 246 21 586 11 681 15 209 508 53 393 77 15 439 44 34 6 27 262 27 119 23 57 13
16 26 55 43 220 18 354 9 627 8 186 425 29 465 48 10 333 74 28 5 16 191 42 162 32 16 8
39 11 12 4 4 32 9 100 11 47 11 9 15 8 9 21 9 15 50 8 68 16 24 7 40 7 21
Buyer's Seller's Seller's Seller's Seller's Seller's Seller's Balanced Seller's Buyer's Seller's Seller's Balanced Seller's Seller's Seller's Seller's Seller's Seller's Balanced Seller's Seller's Seller's Seller's Seller's Buyer's Seller's
UT NM
Salt TaosLake City
$1,132,096 -
$979,000 -
469 -
210 -
157 -
21 -
Seller's -
VA NV
Arlington & Alexandria Lake Tahoe
$2,250,000 $1,250,000
$1,850,000 $1,250,000
77 30
32 6
49 3
6 119
Seller's Buyer's
VA NV
Charlottesville Las Vegas
$1,300,000 -
$1,019,000 -
144 -
22 -
44 -
6 -
Seller's -
VA NV
Fairfax Reno County
$1,999,900 -
$1,500,000 -
346 -
113 -
152 -
7 -
Seller's -
VA NY
McLean & Vienna Finger Lakes
$2,750,000 -
$1,850,000 -
147 -
31 -
61 -
6 -
Seller's -
VA NY
Richmond Nassau County
$799,900 $1,568,888
$790,153 $1,070,000
291 81
110 19
197 19
6 23
Seller's
VA NY
Smith Lake Staten Mountain Island
$1,750,000 $619,950
$1,325,000 $640,000
33 118
9 35
8 25
4 38
Seller's
WA NY
King County - Greater Seattle Suffolk County
$1,970,000 $750,000
$1,695,000 $635,000
1014 151
543 43
538 57
6 29
Seller's
WA OH
Seattle Cincinnati
$1,893,217 $669,950
$1,715,000 $695,000
254 12
140 2
167 6
6 22
Seller's
OH WA
Cleveland Suburbs Spokane
$1,150,000
$987,500
135
62
46
9
Seller's
NY
Suffolk County
$1,900,000
$1,185,000
845
189
168
35
Balanced
Markets with dashes do not have a significant luxury market for this report. Median prices represent properties priced above respective city benchmark prices. Prices shown for Canadian cites are shown in Canadian Dollars.
– LUXURY MONTHLY MARKET REVIEW – ATTACHED HOMES State Market Name
Median List Price
Median Sold Price
New Inventory Listings
Sold
Days on Market
Market Status
ON
GTA - Durham
$862,375 $1,749,000
$828,500 $1,555,000
22 211
14 136
8 46
15 14
Seller's
ON
GTA - York
$799,000 $2,375,000
$777,000 $1,880,000
258 563
164 327
79 137
19 13
Seller's
ON
Hamilton
$853,900 $1,839,500
$871,000 $1,510,000
31 254
17 121
4 27
4 23
Buyer's
ON ON
Mississauga Mississauga
$999,000 $2,950,000
$905,000 $2,310,000
98 137
63 64
35 26
17 18
Seller's Balanced
ON ON
Oakville Oakville
$1,229,450 $2,514,900
$1,210,000 $2,400,000
44 132
29 82
10 33
41 17
Seller's Seller's
ON ON
Toronto Toronto
$1,249,900 $3,799,444
$1,100,000 $3,100,000
775 420
468 178
166 54
17 20
Seller's Buyer's
ON ON
Waterloo Region Region Waterloo
$789,900 $1,474,000
$750,000 $1,300,000
48 166
33 103
1 49
6 12
Buyer's Seller's
OR OR
Portland Portland
$749,900 $1,350,000
$619,014 $1,075,000
257 615
77 248
56 283
19 6
Seller's Seller's
QC QC SC SC SC TN TN TN TN TX TX TX TX TX TX TX TX TX TX TX TX TX TX TX TX TX TX TX TX TX TX TX TX UT UT
Montreal Montreal Hilton Head Hilton Head The Grand Strand Greater Chattanooga Greater Chattanooga Nashville Nashville Austin Austin Collin County Collin County Dallas Dallas Denton County Denton County El Paso El Paso Fort Worth Fort Worth Greater Tyler Greater Tyler Houston Houston Lubbock Lubbock San Angelo San Angelo San Antonio San Antonio The Woodlands & Spring The Woodlands & Spring Park City Park City
$1,161,149 $1,999,000 $1,045,000 $2,095,000 $549,900 $965,000 $1,699,900 $709,950 $1,098,222 $839,500 $749,000 $1,300,000 $799,000 $775,786 $610,800 $825,000 $737,500 $979,000 $622,500 $652,500 $650,000 $799,070 $800,000 $809,000 $4,250,000 $2,150,000
$1,230,500 $1,600,000 $935,000 $1,349,000 $482,475 $824,000 $1,355,500 $727,000 $995,000 $762,500 $717,786 $1,004,001 $629,000 $750,000 $583,000 $800,000 $611,500 $880,000 $597,000 $599,950 $594,950 $717,515 $560,000 $741,000 $3,075,000 $1,650,000
92 363 43 243 157 180 653 130 1242 272 1445 450 147 1101 154 970 148 1149 128 88 51 636 33 213 202 81
21 87 11 58 157 49 246 37 586 82 681 209 48 508 53 393 77 439 43 34 27 262 9 119 57 17
8 16 9 55 54 43 220 47 354 44 627 186 35 425 29 465 48 333 35 28 16 191 7 162 16 19
49 39 69 12 58 4 4 3 9 28 11 11 16 9 15 8 9 9 24 50 68 16 79 7 7 62
Buyer's Buyer's Balanced Seller's Seller's Seller's Seller's Seller's Seller's Balanced Seller's Seller's Seller's Seller's Balanced Seller's Seller's Seller's Seller's Seller's Seller's Seller's Seller's Seller's Buyer's Seller's
UT UT
Salt Salt Lake Lake City City
$1,132,096 $569,950
$979,000 $575,650
469 166
210 45
157 41
21 44
Seller's Seller's
VA VA
Arlington Arlington & & Alexandria Alexandria
$2,250,000 $982,450
$1,850,000 $1,080,000
77 122
32 52
49 54
6 15
Seller's Seller's
VA VA
Charlottesville Charlottesville
$1,300,000 $774,900
$1,019,000 $533,704
144 29
22 7
44 13
6 0
Seller's Seller's
VA VA
Fairfax Fairfax County County
$1,999,900 $769,900
$1,500,000 $700,000
346 207
113 85
152 105
7 15
Seller's Seller's
VA VA
McLean McLean & & Vienna Vienna
$2,750,000 $1,250,000
$1,850,000 $1,105,000
147 37
31 14
61 12
6 23
Seller's Seller's
VA
Richmond
$799,900 -
$790,153 -
291 -
110 -
197 -
6 -
Seller's -
VA
Smith Mountain Lake
$1,750,000 -
$1,325,000 -
33 -
9 -
8 -
4 -
Seller's -
WA
King County - Greater Seattle
$1,970,000 $1,100,000
$1,695,000 $980,000
1014 266
543 75
538 85
6 11
Seller's
WA
Seattle
$1,893,217 $1,296,500
$1,715,000 $1,324,000
254 142
140 34
167 22
6 21
Seller's Balanced
WA
Spokane
$1,150,000
$987,500
135
62
46
9
Seller's
NY
Suffolk County
$1,900,000
$1,185,000
845
189
168
35
Balanced
Markets with dashes do not have a significant luxury market for this report. Median prices represent properties priced above respective city benchmark prices. Prices shown for Canadian cites are shown in Canadian Dollars.
NOVEMBER Home of the CLHMS
TM
GREATER FORT LAUDERDALE FLO R IDA www.LuxuryHomeMarketing.com
2022
GREATER FORT LAUDERDALE
SINGLE - FAMILY HOMES
LUXURY INVENTORY VS. SALES | OCTOBER 2022 Inventory
Sales
Luxury Benchmark Price 1: $775,000 $10,000,000+ $8,600,000 - $9,999,999 $7,200,000 - $8,599,999 $6,000,000 - $7,199,999
$4,800,000 - $5,999,999 $3,800,000 - $4,799,999 $3,000,000 - $3,799,999 $2,400,000 - $2,999,999
$2,000,000 - $2,399,999
50
2 27
0
32
0
$1,200,000 - $1,399,999
$1,050,000 - $1,199,999 $900,000 - $1,049,999 $775,000 - $899,999
1
Total Sales: 205 Buyer's Market
28
1
Total Sales Ratio2: 13%
55
2
58
1
69
4
107
4 73
9
$1,600,000 - $1,999,999 $1,400,000 - $1,599,999
Total Inventory: 1,614
153
23
110
9
181
22 129
30
189
47
353
51
Square Feet3
Price
Beds
Baths
Sold
Inventory
Sales Ratio
-Range-
-Median Sold-
-Median Sold-
-Median Sold-
-Total-
-Total-
-Sold/Inventory-
0 - 2,999
$930,000
4
3
116
821
14%
3,000 - 3,999
$1,137,500
5
4
50
343
15%
4,000 - 4,999
$1,639,000
5
5
17
172
10%
5,000 - 5,999
$3,452,500
6
7
4
88
5%
6,000 - 6,999
$2,150,000
6
8
3
47
6%
7,000+
$8,746,250
7
10
4
70
6%
The luxury threshold price is set by The Institute for Luxury Home Marketing. 2Sales Ratio defines market speed and market type: Buyer's < 14.5%; Balanced >= 14.5 to < 20.5%; Seller's >= 20.5% plus. If >100% MLS® data reported previous month’s sales exceeded current inventory.
GREATER FORT LAUDERDALE
SINGLE - FAMILY HOMES
13 - MONTH LUXURY MARKET TREND 4 Median Sales Price
$1,150,000 $1,050,000
671
246 Oct-21
$1,050,000
541
475
267
Nov-21
299
Dec-21
$1,136,250
414
232
Jan-22
$1,150,000
432
270
Feb-22
$1,150,000
474 407
Mar-22
Inventory
$1,179,500
624
$1,100,000
$1,100,000
415
406
May-22
$1,093,138
1,337
1,154
918
Apr-22
Solds
414
Jun-22
$1,055,000
$1,050,000
1,423
1,460
343
297
Jul-22
Aug-22
$1,050,000
1,614
270
205
Sep-22
Oct-22
MEDIAN DATA REVIEW | OCTOBER TOTAL INVENTORY Oct. 2021
Oct. 2022
671
1,614 VARIANCE: 141 % SALE PRICE PER SQFT. Oct. 2021
Oct. 2022
356
$
390 VARIANCE: 10 % $
TOTAL SOLDS Oct. 2021
Oct. 2022
246
205 VARIANCE: -17 %
SALE TO LIST PRICE RATIO Oct. 2021
Oct. 2022
97.50% 96.25% VARIANCE: -1 %
SALES PRICE Oct. 2021
1.05m
$
Oct. 2022
1.05m VARIANCE: 0 % $
DAYS ON MARKET Oct. 2021
Oct. 2022
22
33 VARIANCE: 50 %
GREATER FORT LAUDERDALE MARKET SUMMARY | OCTOBER 2022 • The Greater Fort Lauderdale single-family luxury market is a Buyer's Market with a 13% Sales Ratio. • Homes sold for a median of 96.25% of list price in October 2022. • The most active price band is $900,000-$1,049,999, where the sales ratio is 25%. • The median luxury sales price for single-family homes is $1,050,000. • The median days on market for October 2022 was 33 days, up from 22 in October 2021.
Square foot table does not account for listings and solds where square foot data is not disclosed. 4 Data reported includes Active and Sold properties and does not include Pending properties.
3
GREATER FORT LAUDERDALE
ATTACHED HOMES
LUXURY INVENTORY VS. SALES | OCTOBER 2022 Inventory
Sales
Luxury Benchmark Price 1: $545,000 $3,500,000+ $3,000,000 - $3,499,999 $2,700,000 - $2,999,999
$1,900,000 - $2,149,999 $1,700,000 - $1,899,999 $1,500,000 - $1,699,999
$1,300,000 - $1,499,999 $1,100,000 - $1,299,999 $900,000 - $1,099,999
14
1
Total Sales: 116 Buyer's Market
20
4 1
22
2
30
2
44
1
42
7
65
7
104
8 83
16
117
11
$600,000 - $699,999 $545,000 - $599,999
1
Total Sales Ratio2: 12%
23
$800,000 - $899,999
$700,000 - $799,999
Total Inventory: 990
12
1
$2,400,000 - $2,699,999
$2,150,000 - $2,399,999
71
2
178
28
165
25
Square Feet3
Price
Beds
Baths
Sold
Inventory
Sales Ratio
-Range-
-Median Sold-
-Median Sold-
-Median Sold-
-Total-
-Total-
-Sold/Inventory-
0 - 999
$630,000
1
1
9
97
9%
1,000 - 1,499
$655,000
2
2
36
325
11%
1,500 - 1,999
$675,000
3
3
34
245
14%
2,000 - 2,499
$985,000
3
3
17
142
12%
2,500 - 2,999
$1,400,000
3
4
9
53
17%
3,000+
$2,200,000
3
4
9
83
11%
The luxury threshold price is set by The Institute for Luxury Home Marketing. 2Sales Ratio defines market speed and market type: Buyer's < 14.5%; Balanced >= 14.5 to < 20.5%; Seller's >= 20.5% plus. If >100% MLS® data reported previous month’s sales exceeded current inventory.
GREATER FORT LAUDERDALE
ATTACHED HOMES
13 - MONTH LUXURY MARKET TREND 4 Sale Price
$795,000
685
$771,600
$760,000
596 120
Oct-21
537 151
Nov-21
$830,000
505 173
Dec-21
$852,500
494 143
Jan-22
$900,000
$775,000
465 178
Feb-22
Inventory
643
526
293
Mar-22
$830,000
$750,000
$775,000
$735,000
751
810
860
240
233
219
Apr-22
Solds
May-22
Jun-22
168
$780,000
990
888
167
Jul-22
$727,500
Aug-22
152
116
Sep-22
Oct-22
MEDIAN DATA REVIEW | OCTOBER TOTAL INVENTORY Oct. 2021
Oct. 2022
685
990 VARIANCE: 45 %
SALE PRICE PER SQFT. Oct. 2021
Oct. 2022
484
$
506 VARIANCE: 5 % $
TOTAL SOLDS Oct. 2021
Oct. 2022
120
116 VARIANCE: -3 %
SALE TO LIST PRICE RATIO Oct. 2021
Oct. 2022
97.41% 96.90% VARIANCE: -1 %
SALES PRICE Oct. 2021
$
795k
Oct. 2022
728k VARIANCE: -8 % $
DAYS ON MARKET Oct. 2021
Oct. 2022
30
46 VARIANCE: 53 %
GREATER FORT LAUDERDALE MARKET SUMMARY | OCTOBER 2022 • The Greater Fort Lauderdale attached luxury market is a Buyer's Market with a 12% Sales Ratio. • Homes sold for a median of 96.90% of list price in October 2022. • The most active price band is $2,400,000-$2,699,999, where the sales ratio is 20%. • The median luxury sales price for attached homes is $727,500. • The median days on market for October 2022 was 46 days, up from 30 in October 2021.
Square foot table does not account for listings and solds where square foot data is not disclosed. 4 Data reported includes Active and Sold properties and does not include Pending properties.
3
Thank you for taking time to view this report. For more information about this report and the services I can offer you and your luxury property, please give me a call at 954.529.7422.
- Michelle Reid
MICHELLE REID
954.529.7422 | michellereidrealty@gmail.com | www.MichelleSellsFloridaHomes.com