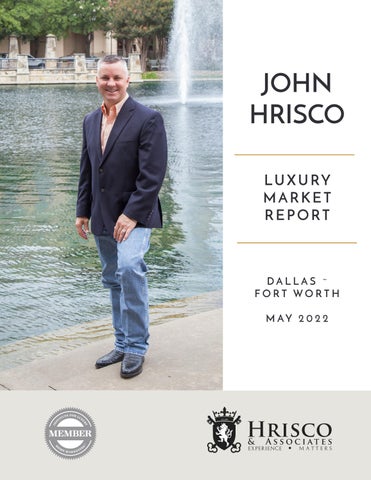
JOHN HRISCO L U X U RY MARKET REPORT
DALLAS ~ FORT WORTH M AY 2 0 2 2
JOHN HRISCO
Broker-Associate, REALTOR® ABR,BPOR,CDPE,CNE,CNHS,CRS, GMA,IMSD,LLS,MiLRES, MRP,NAEA,PSA,RCC,SFR,VLB
817.328.1400 john@johnhrisco.com www.DFWLuxuryMarketReport.com As a luxury expert in the Dallas/Fort Worth Metroplex, John Hrisco offers a wealth of knowledge and expertise that is unsurpassed; you can always trust his service and commitment. John Hrisco has served clientele in Dallas/Fort Worth for over 20 years. He offers keen insight into executive and corporate relocation services, and understands and adapts to constant changes in the luxury market. His expertise is why his clients are excited to refer his services to their family, friends, and colleagues. He is an Associate Broker, a member of the Real Estate Negotiation Institute, a LUXE Luxury Listing Specialist, and a member of the Institute for Luxury Home Marketing. *CNE – Certified Negotiation Expert *CRS – Certified Residential Specialist *GMA – Certified Global Elite Marketing Agent *IMSD – Internet Marketing Specialist Designation *LUXE – Luxury Listing Specialist *NAEA – National Association of Expert Advisors *PSA – Pricing Strategy Advisor *RCC – Residential Construction Certified
TABLE OF CONTENTS PAGE 4
LUXURY REPORT EXPLAINED
PAGE 5
WELCOME MESSAGE
PAGE 6-8
NORTH AMERICAN LUXURY MARKET REVIEW
PAGE 9
13-MONTH MARKET TRENDS
PAGE 10
SINGLE-FAMILY HOMES MONTHLY OVERVIEW
PAGE 11
ATTACHED HOMES MONTHLY OVERVIEW
PAGE 21
DALLAS MARKET REVIEW
PAGE 26
FORT WORTH MARKET REVIEW
PAGE 29
DENTON COUNTY MARKET REVIEW
PAGE 32
THANK YOU
– LUXURY REPORT EXPLAINED – The Institute for Luxury Home Marketing has analyzed a number of metrics — including sales prices, sales volumes, number of sales, sales-price-to-list-price ratios, days on market and price-per-square-foot – to provide you a comprehensive North American Luxury Market report. Additionally, we have further examined all of the individual luxury markets to provide both an overview and an in-depth analysis - including, where data is sufficient, a breakdown by luxury single-family homes and luxury attached homes. It is our intention to include additional luxury markets on a continual basis. If your market is not featured, please contact us so we can implement the necessary qualification process. More in-depth reports on the luxury communities in your market are available as well. Looking through this report, you will notice three distinct market statuses, Buyer's Market, Seller's Market, and Balanced Market. A Buyer's Market indicates that buyers have greater control over the price point. This market type is demonstrated by a substantial number of homes on the market and few sales, suggesting demand for residential properties is slow for that market and/or price point. By contrast, a Seller's Market gives sellers greater control over the price point. Typically, this means there are few homes on the market and a generous demand, causing competition between buyers who ultimately drive sales prices higher. A Balanced Market indicates that neither the buyers nor the sellers control the price point at which that property will sell and that there is neither a glut nor a lack of inventory. Typically, this type of market sees a stabilization of both the list and sold price, the length of time the property is on the market as well as the expectancy amongst homeowners in their respective communities – so long as their home is priced in accordance with the current market value.
REPORT GLOSSARY REMAINING INVENTORY: The total number of homes available at the close of a month. DAYS ON MARKET: Measures the number of days a home is available on the market before a purchase offer is accepted. LUXURY BENCHMARK PRICE: The price point that marks the transition from traditional homes to luxury homes. NEW LISTINGS: The number of homes that entered the market during the current month. PRICE PER SQUARE FOOT: Measures the dollar amount of the home's price for an individual square foot. SALES RATIO: Sales Ratio defines market speed and determines whether the market currently favors buyers or sellers. Buyer's Market = up to 14%; Balanced Market = 15 to 20%; Seller's Market = 21% plus. If >100%, sales from previous month exceed current inventory. SP/LP RATIO: The Sales Price/List Price Ratio compares the value of the sold price to the value of the list price.
THIS IS YOUR
LUXURY MARKET REPORT
MAP OF LUXURY RESIDENTIAL MARKETS
W
elcome to the Luxury Market Report, your guide to luxury real estate market data and trends for North America. Produced monthly by The Institute for Luxury Home Marketing, this report
provides an in-depth look at the top residential markets across the United States and Canada. Within the individual markets, you will find established luxury benchmark prices and detailed survey of luxury active and sold properties designed to showcase current market status and recent trends. The national report illustrates a compilation of the top North American markets to review overall standards and trends.
Copyright © 2022 Institute for Luxury Home Marketing | www.luxuryhomemarketing.com | 214.485.3000 The Luxury Market Report is a monthly analysis provided by The Institute for Luxury Home Marketing. Luxury benchmark prices are determined by The Institute. This active and sold data has been provided by REAL Marketing, who has compiled the data through various sources, including local MLS boards, local tax records and Realtor.com. Data is deemed reliable to the best of our knowledge, but is not guaranteed.
NORTH AMERICAN LUXURY REVIEW The Global Demand for Luxury Real Estate The ebbs and flows of the luxury real estate market continue to be fascinating while still providing some unexpected twists and turns. At the beginning of 2022, experts had predicted a more traditional year, but reality tells a different story. Much like actors, the players in the luxury real estate market need to have the ability to adapt to meet new expectations, as well as the demands of the audience – but equally, they must recognize that longevity and ongoing success commands a hefty price tag. That success has now gone global – if not viral! While the ownership of luxury properties throughout the world has always been part of the affluent's portfolio, prior to the pandemic, the pace of decisionmaking and purchasing was so much slower, with the level of inventory far exceeding the demand. From London to Miami, Los Angeles to Sydney, the increasing demand for luxury properties continues to be at unexpected levels while inventory availability decreases and prices increase – further compounded as more countries open up and return to some semblance of normalcy, with the return of the international buyer. Looking back over the last two years, it has been interesting to watch how the global demand has developed and determined the impacts on the world's luxury real estate market as we move into the rest of 2022. While it cannot be declared that the U.S. and Canada were the trendsetters in the meteoric increase in purchasing luxury properties over the last two years, the comparative statistics indicate that North America recorded the fastest growth of demand during the first year of the pandemic. Also,
demand has not only not abated, but it consistently increased, and even in April 2022, we saw a higher volume of sales compared to 2021. At the start of the pandemic in 2020, the demand for luxury real estate took much longer to appear in other parts of the world. In Asia and Australasia, most countries initially handled the onset of the pandemic effectively, so there was little need to rush out of the city or change their current abode. Whereas in Europe, whole cities and countries were in lockdown, so the process of buying 'escape' properties was slowed by the initial difficulty of not being able to travel. South America saw an equally slow start in the purchase of luxury properties, as the pandemic took much longer to take hold – waiting for the cooler months of the summer in many of these subequator countries. Despite the slower start outside North America, after reviewing the overall global trend during the last two years, we can see that several factors were key determinants in the growth of demand for luxury properties in 2021. Rising global wealth, increasing numbers of affluent individuals, investment return opportunities, and the growing importance of intrinsic value that a luxury property offers have all been instrumental. We can see this global change more emphatically by looking at the numbers provided by Wealth- X for individuals with a net worth of over $5 million through a comparison of growth from 2020 to the end of 2021. In 2020, their global wealth grew by 2.1%, from $61 trillion to $62 trillion, but in 2021 it exploded with a 20.4% increase of $12.8 trillion, equaling a growth of wealth to over $75 trillion. However, it is more likely that the population growth of these individuals with a net worth of over $5 million could be the most important factor in the dramatic decrease in inventory levels. In 2020, we saw a 2.2% growth in the number of individuals with wealth of over $5 million in net value, but in 2021 that number grew by an outstanding 19.8%.
This total increase has resulted in the introduction of over 660,000 new individuals into the high net-worth bracket, which, combined with the existing affluent looking to both diversify and add new properties to their portfolio, provides a true insight into why the demand for luxury properties skyrocketed during 2021 and into 2022. While this growth of wealth and the individuals with this wealth undoubtedly created one of the most significant impacts on the demand for luxury real estate, what is truly fascinating is some of the unexpected diversification of where the wealthy are buying and why. Since reopening its borders, Australia has seen a marked interest in Sydney and Melbourne's luxury real estate markets, and despite their tight foreign ownership rules, demand has been extremely high. In the past, distance and remoteness were a hindrance, but in today's world, these factors are now considered a benefit. Throw in additional tax incentives for relocating a business, and the elite start to look at the viability of moving here. Looking to India, we see predictions for a continuation of a strong luxury real estate market. Already Delhi, Mumbai, and Goa have seen the ultra-rich invest heavily in high-end property. The widely traveled affluent are leading the charge as they have experienced living in more luxurious accommodations and are ready to spend their wealth on luxury real estate to upgrade their lifestyle in a city of their choice. While the affluent are attracted to Mumbai due to it being the commercial capital, especially for investment with well-established luxury property developers, areas such as Lutyens' Zone, Vasant Vihar, and South Delhi remain hot real estate destinations in Delhi. Dubai has seen a resurgence in its market in the last six months. Despite all the negative press about Russian Oligarchs using it as a hiding place, Dubai recorded its best quarter since 2010, with top investors coming from the UK, France, and Italy. Europeans have dominated investment, but increasing numbers of individuals from Canada, India, and Pakistan are taking significant interest as visa reforms and economic stability have proven to be successful draws.
The great exodus from London in 2021 saw British locals moving out to the countryside and foreign investors either returning home or choosing to invest closer to home. However, the first quarter of 2022 marked a significant return of both types of affluent property buyers. One of the unexpected twists is the increased demand for properties at the very high end of the market, driven by very wealthy buyers from the U.S. and citizens of Hong Kong concerned about the long-term impacts of their city's transition to Chinese rule. Moving away from the big city lights to the coastal and mountain retreats, such as Monaco in France, St. Moritz in Switzerland, and other similar locales that have always attracted the megawealthy, inventory levels for some of the most expensive properties in the world have not only been depleted but have seen unimaginable price increases. Innovative developers may ease the burden slightly in Monaco with the building of an eco-development reclaiming land from the sea and luxury development in the heart of Larvotto, offering 56 apartments with wrap-around balconies and five villas, each with a rooftop terrace, private pool, and all having Mediterranean views. As global demand for luxury homes continues to increase, the opportunity for developers and builders holds a world of opportunity, innovation, and, of course, financial gain. In North America, cities were high on the list for the wealthy, especially Washington D.C., New York, Los Angeles, Miami, and Honolulu, with individuals desiring a return to downtown lifestyles. And more than 10% of luxury searches were conducted by foreign buyers, according to data collected for Mansion Global by Realtor.com. One trend this analysis of the global market for real estate demonstrates is that the affluent are on the move again, and North America will probably be one of the largest beneficiaries. The strength and stability of the luxury markets in Canada and the U.S. over the last two years, not to mention investment opportunities in the growth of new real estate markets and luxury developments, will drive the incentive from international buyers.
– 13 - MONTH MARKET TRENDS – FOR THE LUXURY NORTH AMERICAN MARKET
Single-Family Homes
Attached Homes
Single-Family List Price
Attached List Price
All data is based off median values. Median prices represent properties priced above respective city benchmark prices.
20
DAYS ON MARKET
18 16 14
12
12 15
11
11
12
12
10
16
13
14
15
16
18
17 15
15
17
16
12
14
12
12
11
9
8
7
8
8
6 4 2 MAY
JUN
JUL
AUG
SEP
OCT
NOV
DEC
JAN
FEB
MAR
APR
$443
$529
$547 $423
$530 $420
$412
$523
$535 $415
$396
$400
$499
$501
$523
$397
$482 $392
$521
$481 $376
$300
$388
$495
$400
$376
$500
$511
$600
$200
$100
$0
SALES PRICE VS. LIST PRICE
APR
$384
PRICE PER SQUARE FOOT
0
APR
MAY
JUN
JUL
AUG
SEP
OCT
NOV
DEC
JAN
FEB
MAR
APR
$2,100,000 $1,900,000 $1,700,000
$1,500,000 $1,300,000 $1,100,000
$900,000 $700,000 $500,000
APR
MAY
JUN
JUL
AUG
SEP
OCT
NOV
DEC
JAN
FEB
MAR
APR
– LUXURY MONTHLY MARKET REVIEW – A Review of Key Market Differences Year over Year April 2021 | April 2022
SINGLE-FAMILY HOMES April 2021
April 2022
April 2021
April 2022
Median List Price
$1,699,000
$1,795,972
Total Inventory
29,458
28,919
Median Sale Price
$1,385,000
$1,335,075
New Listings
12,922
15,623
100.00%
100.83%
Total Sold
18,568
21,675
63.03%
74.95%
12
7
$384
$443
3,673
3,133
Median SP/LP Ratio Total Sales Ratio Median Price per Sq. Ft.
Median Days on Market Average Home Size
Median prices represent properties priced above respective city benchmark prices.
2,701
3,107
New Listings
Total Sold
5
11.92%
Med. Sale Price
Days on Market
Sales Ratio
49,925
$
SINGLE-FAMILY HOMES MARKET SUMMARY | APRIL 2022 •
Official Market Type: Seller's Market with a 74.95% Sales Ratio.1
•
Homes are selling for an average of 100.83% of list price.
•
The median luxury threshold2 price is $950,000, and the median luxury home sales price is $1,335,075.
•
Markets with the Highest Median Sales Price: Aspen ($9,975,000), Vail ($5,772,500), Telluride ($5,350,029), and Los Angeles Beach Cities ($4,000,000).
•
Markets with the Highest Sales Ratio: Waterloo Region (258%), East Bay (211%), Seattle (206%) and Hamilton Country (175%). Sales Ratio defines market speed and market type: Buyer's < 15.5%; Balanced >= 15.5 to < 20.5%; Seller's >= 20.5% plus. If >100%, sales from
1
previous month exceeds current inventory. 2The luxury threshold price is set by The Institute for Luxury Home Marketing.
– LUXURY MONTHLY MARKET REVIEW – A Review of Key Market Differences Year over Year April 2021 | April 2022
ATTACHED HOMES April 2021
Median List Price Median Sale Price Median SP/LP Ratio Total Sales Ratio Median Price per Sq. Ft.
April 2022
$1,037,500 $1,068,000 $865,000
$884,500
100.00%
100.00%
47.53%
64.95%
$511
$529
April 2021
April 2022
12,273
10,186
New Listings
4,593
5,285
Total Sold
5,833
6,616
15
8
1,948
1,779
Total Inventory
Median Days on Market Average Home Size
Median prices represent properties priced above respective city benchmark prices.
692
New Listings
783
Total Sold
19,500
$
Med. Sale Price
7
17.42%
Days on Market
Sales Ratio
ATTACHED HOMES MARKET SUMMARY | APRIL 20 22 •
Official Market Type: Seller's Market with a 64.95% Sales Ratio.1
•
Attached homes are selling for an average of 100.00% of list price.
•
The median luxury threshold2 price is $700,000, and the median attached luxury sale price is $884,500.
•
Markets with the Highest Median Sales Price: Aspen ($3,125,000), Vail ($2,650,000), San Francisco ($2,300,000), and Greater Boston ($2,075,000).
•
Markets with the Highest Sales Ratio: Silicon Valley (360%), Howard County (300%), Central Coast (283%) and Waterloo Region (263%). Sales Ratio defines market speed and market type: Buyer's < 15.5%; Balanced >= 15.5 to < 20.5%; Seller's >= 20.5% plus. If >100%, sales from
1
previous month exceeds current inventory. 2The luxury threshold price is set by The Institute for Luxury Home Marketing.
– LUXURY MONTHLY MARKET REVIEW – SINGLE-FAMILY HOMES State Market Name
Median List Price
Median Sold Price
Inventory
New Listings
Sold
Days on Market
Market Status
AB
Calgary
$1,149,900
$980,000
503
368
342
14
Seller's
AZ
Chandler and Gilbert
$1,149,500
$945,000
88
64
126
19
Seller's
AZ
Flagstaff
$1,594,859
$1,225,000
46
28
19
37
Seller's
AZ
Mesa
$880,680
$839,900
60
37
97
13
Seller's
AZ
Paradise Valley
$6,799,000
$3,625,000
91
31
41
17
Seller's
AZ
Phoenix
$925,000
$800,000
314
213
513
17
Seller's
AZ
Scottsdale
$2,495,000
$1,600,000
323
194
295
19
Seller's
AZ
Tucson
$792,938
$650,000
434
200
346
5
Seller's
BC
Mid Vancouver Island
$1,600,000
$1,410,000
147
109
73
10
Seller's
BC
Okanagan Valley
$1,848,900
$1,592,000
608
350
149
22
Seller's
BC
Vancouver
$4,480,000
$3,350,000
1173
499
171
9
Buyer's
BC
Victoria
$2,599,500
$1,925,500
87
93
62
7
Seller's
CA
Central Coast
$3,474,500
$2,287,500
126
67
104
8
Seller's
CA
East Bay
$2,148,800
$2,075,000
355
311
748
7
Seller's
CA
Greater Palm Springs
$2,375,000
$1,765,000
201
115
158
20
Seller's
CA
Lake Tahoe
$2,797,000
$1,715,000
88
48
51
7
Seller's
CA
Los Angeles Beach Cities
$6,697,500
$4,000,000
218
93
103
11
Seller's
CA
Los Angeles City
$5,995,000
$3,500,000
514
214
220
12
Seller's
CA
Los Angeles The Valley
$2,499,000
$2,070,000
289
179
277
10
Seller's
CA
Marin County
$3,561,500
$3,050,000
56
23
96
8
Seller's
CA
Napa County
$3,995,000
$2,000,000
98
26
35
25
Seller's
CA
Orange County
$2,800,000
$2,200,000
685
383
585
7
Seller's
CA
Placer County
$1,225,000
$1,109,000
229
81
97
7
Seller's
CA
Sacramento
$949,995
$875,000
504
204
285
7
Seller's
CA
San Diego
$2,399,000
$1,875,000
578
374
568
6
Seller's
CA
San Francisco
$4,435,000
$3,500,000
99
21
73
11
Seller's
CA
San Luis Obispo County
$1,925,000
$1,440,000
114
47
90
0
Seller's
CA
Santa Barbara
$6,372,500
$3,525,000
82
47
66
8
Seller's
CA
Silicon Valley
$4,350,000
$3,302,000
309
225
511
7
Seller's
CA
Sonoma County
$2,395,000
$1,750,000
193
32
63
23
Seller's
CA
Ventura County
$2,489,000
$1,650,000
171
102
153
12
Seller's
CO
Aspen
$15,075,000
$9,975,000
50
8
15
88
Seller's
CO
Boulder
$2,315,000
$1,555,000
106
66
141
28
Seller's
CO
Colorado Springs
$995,000
$884,950
221
143
182
4
Seller's
Median prices represent properties priced above respective city benchmark prices. Prices shown for Canadian cites are shown in Canadian Dollars.
– LUXURY MONTHLY MARKET REVIEW – SINGLE-FAMILY HOMES State Market Name
Median List Price
Median Sold Price
Inventory
New Listings
Sold
Days on Market
Market Status
CO
Denver
$1,795,000
$1,418,000
286
209
443
4
Seller's
CO
Douglas County
$1,699,999
$1,228,000
153
112
181
4
Seller's
CO
Durango
$2,072,500
$1,136,500
46
17
22
56
Seller's
CO
Summit County
$3,495,000
$2,475,000
29
10
7
3
Seller's
CO
Telluride
$9,600,000
$5,350,029
37
4
4
150
Buyer's
CO
Vail
$6,232,500
$5,772,500
44
9
10
15
Seller's
CT
Central Connecticut
$720,350
$611,195
266
87
134
5
Seller's
CT
Coastal Connecticut
$2,300,000
$1,700,000
409
165
178
23
Seller's
DC
Washington D.C.
$4,995,000
$2,700,000
47
16
27
6
Seller's
DE
Sussex County Coastal
$1,397,250
$1,257,500
114
39
40
8
Seller's
FL
Boca Raton/Delray Beach
$3,500,000
$1,958,000
227
105
99
7
Seller's
FL
Coastal Pinellas County
$2,500,000
$1,700,000
61
32
32
10
Seller's
FL
Greater Fort Lauderdale
$1,796,944
$1,179,500
624
308
406
12
Seller's
FL
Jacksonville Beaches
$1,424,900
$1,200,000
165
105
133
14
Seller's
FL
Lee County
$1,440,000
$1,275,000
351
180
203
9
Seller's
FL
Marco Island
$2,799,000
$2,650,000
79
30
35
7
Seller's
FL
Miami
$2,390,000
$1,467,500
593
223
154
17
Seller's
FL
Naples
$5,149,500
$3,820,000
196
76
79
8
Seller's
FL
Orlando
$1,375,000
$1,155,000
355
157
231
7
Seller's
FL
Palm Beach Towns
$4,700,000
$2,700,000
151
61
41
26
Seller's
FL
Sarasota & Beaches
$3,165,000
$2,125,000
199
90
88
5
Seller's
FL
South Pinellas County
$2,300,000
$1,357,650
110
64
96
5
Seller's
FL
South Walton
$2,995,000
$2,312,500
199
87
86
7
Seller's
FL
Tampa
$900,000
$703,500
411
246
460
4
Seller's
FL
Weston
$1,380,000
$990,000
38
27
50
13
Seller's
GA
Atlanta
$1,675,000
$1,200,000
426
212
306
4
Seller's
GA
Duluth
$1,850,000
$1,280,000
11
7
11
4
Seller's
HI
Island of Hawaii
$2,224,500
$1,987,500
76
21
40
16
Seller's
HI
Kauai
$3,650,000
$1,995,000
37
13
19
10
Seller's
HI
Maui
$3,275,000
$2,402,500
97
25
38
76
Seller's
HI
Oahu
$3,210,000
$2,500,000
151
50
64
14
Seller's
ID
Ada County
$849,900
$753,700
414
281
400
4
Seller's
ID
Northern Idaho
$1,798,000
$1,400,000
209
100
69
56
Seller's
IL
Chicago
$1,595,000
$1,265,000
524
263
400
7
Seller's
Median prices represent properties priced above respective city benchmark prices. Prices shown for Canadian cites are shown in Canadian Dollars.
– LUXURY MONTHLY MARKET REVIEW – SINGLE-FAMILY HOMES State Market Name
Median List Price
Median Sold Price
Inventory
New Listings
Sold
Days on Market
Market Status
IL
DuPage County
$1,206,200
$902,000
230
87
166
6
Seller's
IL
Lake County
$1,199,950
$900,000
222
89
175
8
Seller's
IL
Will County
$749,000
$625,000
135
56
125
7
Seller's
IN
Hamilton County
$997,475
$800,000
60
33
105
3
Seller's
KS
Johnson County
$816,960
$783,049
200
76
140
2
Seller's
MA
Cape Cod
$2,800,000
$2,162,500
83
31
36
19
Seller's
MA
Greater Boston
$3,799,000
$2,675,000
107
53
40
13
Seller's
MA
South Shore
$1,980,000
$1,580,000
34
19
27
18
Seller's
MD
Anne Arundel County
$996,500
$890,000
124
53
123
5
Seller's
MD
Frederick County
$851,310
$887,500
34
14
32
5
Seller's
MD
Howard County
$1,189,990
$1,023,000
57
33
60
5
Seller's
MD
Montgomery County
$1,944,334
$1,569,000
128
82
156
6
Seller's
MD
Talbot County
$1,960,000
$2,010,000
29
18
14
9
Seller's
MD
Worcester County
$1,100,000
$857,950
35
15
8
27
Seller's
MI
Livingston County
$749,900
$674,000
57
21
22
9
Seller's
MI
Monroe County
$627,450
$537,500
10
3
4
9
Seller's
MI
Oakland County
$787,787
$641,194
537
267
292
7
Seller's
MI
Washtenaw County
$1,170,000
$730,000
88
34
67
5
Seller's
MI
Wayne County
$777,000
$620,000
128
65
109
7
Seller's
MN
Olmsted County
$812,450
$787,500
54
20
24
14
Seller's
MN
Twin Cities
$1,249,000
$1,052,500
446
188
236
7
Seller's
MO
Kansas City
$679,000
$653,000
687
246
415
2
Seller's
MO
St. Louis
$895,000
$703,750
71
46
92
7
Seller's
NC
Asheville
$1,087,500
$860,000
144
52
73
6
Seller's
NC
Charlotte
$1,299,000
$932,053
292
156
370
3
Seller's
NC
Lake Norman
$1,200,000
$965,000
107
57
79
4
Seller's
NC
Raleigh-Durham
$1,109,500
$942,500
184
112
278
1
Seller's
NJ
Ocean County
$925,000
$875,000
293
124
145
14
Seller's
NV
Lake Tahoe
$3,750,000
$2,850,000
63
16
13
43
Balanced
NV
Las Vegas
$1,895,000
$1,400,000
443
211
193
10
Seller's
NV
Reno
$2,347,500
$1,525,000
60
30
28
52
Seller's
NY
Brooklyn
$1,800,000
$1,635,000
216
46
25
143
Buyer's
NY
Staten Island
$1,294,000
$1,041,000
134
51
34
34
Seller's
OH
Cincinnati
$814,269
$714,900
162
39
69
2
Seller's
Median prices represent properties priced above respective city benchmark prices. Prices shown for Canadian cites are shown in Canadian Dollars.
– LUXURY MONTHLY MARKET REVIEW – SINGLE-FAMILY HOMES State Market Name
Median List Price
Median Sold Price
Inventory
New Listings
Sold
Days on Market
Market Status
ON
GTA - Durham
$1,688,500
$1,600,000
188
212
189
6
Seller's
ON
GTA - York
$2,299,000
$2,000,800
501
465
257
8
Seller's
ON
Mississauga
$3,324,500
$2,475,000
92
77
52
7
Seller's
ON
Oakville
$2,399,000
$2,250,000
91
112
80
7
Seller's
ON
Toronto
$3,965,000
$3,300,000
324
270
194
7
Seller's
ON
Waterloo Region
$1,399,900
$1,312,500
69
118
178
7
Seller's
OR
Portland
$1,575,000
$950,000
279
156
97
4
Seller's
SC
Hilton Head
$1,950,000
$1,637,500
146
62
76
14
Seller's
TN
Greater Chattanooga
$998,900
$820,000
121
65
53
2
Seller's
TN
Nashville
$2,196,500
$1,380,050
216
128
294
3
Seller's
TX
Austin
$1,200,000
$998,750
393
302
485
5
Seller's
TX
Collin County
$824,950
$726,000
410
329
648
5
Seller's
TX
Dallas
$1,549,000
$1,100,000
203
142
220
5
Seller's
TX
Denton County
$791,000
$751,000
303
242
419
5
Seller's
TX
El Paso
$649,000
$609,000
89
34
38
10
Seller's
TX
Fort Worth
$925,000
$761,565
411
250
432
5
Seller's
TX
Greater Tyler
$755,000
$627,500
72
54
36
12
Seller's
TX
Houston
$979,900
$875,000
887
402
438
7
Seller's
TX
Lubbock
$775,000
$605,000
63
35
27
66
Seller's
TX
San Angelo
$708,140
$589,000
44
16
11
58
Seller's
TX
San Antonio
$925,000
$750,000
263
130
173
16
Seller's
TX
The Woodlands & Spring
$925,000
$742,500
135
91
148
5
Seller's
UT
Park City
$3,875,000
$3,500,000
73
28
30
11
Seller's
UT
Salt Lake City
$1,199,500
$950,000
205
134
205
6
Seller's
VA
Arlington & Alexandria
$2,049,500
$1,767,500
52
27
49
6
Seller's
VA
Charlottesville
$1,399,900
$1,080,000
93
32
43
5
Seller's
VA
Fairfax County
$2,300,000
$1,502,064
240
135
191
5
Seller's
VA
McLean & Vienna
$3,100,000
$1,750,000
111
49
61
5
Seller's
VA
Richmond
$797,000
$800,000
168
61
166
6
Seller's
WA
Greater Seattle
$1,980,000
$1,744,200
555
472
906
5
Seller's
WA
Seattle
$1,895,000
$1,626,000
109
85
225
5
Seller's
WA
Spokane
$1,255,000
$989,500
64
39
38
5
Seller's
Median prices represent properties priced above respective city benchmark prices. Prices shown for Canadian cites are shown in Canadian Dollars.
– LUXURY MONTHLY MARKET REVIEW – ATTACHED HOMES State Market Name
Median List Price
Median Sold Price
Inventory
New Listings
Sold
Days on Market
Market Status
AB
Calgary
$809,500
$715,000
136
61
38
27
Seller's
AZ
Chandler and Gilbert
-
-
-
-
-
-
-
AZ
Flagstaff
-
-
-
-
-
-
-
AZ
Mesa
-
-
-
-
-
-
-
AZ
Paradise Valley
-
-
-
-
-
-
-
AZ
Phoenix
-
-
-
-
-
-
-
AZ
Scottsdale
$875,000
$830,000
113
74
107
22
Seller's
AZ
Tucson
-
-
-
-
-
-
-
BC
Mid Vancouver Island
$839,000
$817,500
43
44
32
14
Seller's
BC
Okanagan Valley
-
-
-
-
-
-
-
BC
Vancouver
$1,998,000
$1,750,000
850
428
191
11
Seller's
BC
Victoria
$998,750
$955,250
104
110
82
7
Seller's
CA
Central Coast
$1,087,000
$1,222,500
12
10
34
8
Seller's
CA
East Bay
$1,099,000
$1,150,000
105
85
251
7
Seller's
CA
Greater Palm Springs
-
-
-
-
-
-
-
CA
Lake Tahoe
$1,350,000
$997,500
21
11
12
8
Seller's
CA
Los Angeles Beach Cities
$2,122,000
$1,648,000
92
51
94
9
Seller's
CA
Los Angeles City
$1,800,000
$1,464,250
270
118
150
12
Seller's
CA
Los Angeles The Valley
$793,500
$820,000
70
45
107
8
Seller's
CA
Marin County
$1,099,000
$1,192,500
15
7
18
13
Seller's
CA
Napa County
-
-
-
-
-
-
-
CA
Orange County
$1,150,000
$1,100,000
243
195
329
6
Seller's
CA
Placer County
-
-
-
-
-
-
-
CA
Sacramento
-
-
-
-
-
-
-
CA
San Diego
$1,425,000
$1,000,000
185
134
296
6
Seller's
CA
San Francisco
$2,750,000
$2,300,000
122
34
62
12
Seller's
CA
San Luis Obispo County
-
-
-
-
-
-
-
CA
Santa Barbara
$1,595,000
$1,735,000
8
7
9
10
Seller's
CA
Silicon Valley
$1,698,000
$1,630,000
57
53
205
7
Seller's
CA
Sonoma County
$850,000
$683,250
11
2
6
24
Seller's
CA
Ventura County
$750,000
$743,500
59
35
62
12
Seller's
CO
Aspen
$5,847,500
$3,125,000
14
1
5
46
Seller's
CO
Boulder
$1,025,000
$850,000
24
15
28
33
Seller's
CO
Colorado Springs
-
-
-
-
-
-
-
Markets with dashes do not have a significant luxury market for this report. Median prices represent properties priced above respective city benchmark prices. Prices shown for Canadian cites are shown in Canadian Dollars.
– LUXURY MONTHLY MARKET REVIEW – ATTACHED HOMES State Market Name
Median List Price
Median Sold Price
Inventory
New Listings
Sold
Days on Market
Market Status
CO
Denver
$1,049,000
$797,500
109
37
84
5
Seller's
CO
Douglas County
$608,995
$580,000
6
4
15
9
Seller's
CO
Durango
$692,500
$915,000
6
3
12
37
Seller's
CO
Summit County
$1,100,000
$1,637,000
8
8
6
5
Seller's
CO
Telluride
-
-
-
-
-
-
-
CO
Vail
$3,675,000
$2,650,000
55
4
17
9
Seller's
CT
Central Connecticut
-
-
-
-
-
-
-
CT
Coastal Connecticut
$1,530,000
$709,500
152
72
40
17
Seller's
DC
Washington D.C.
$2,100,000
$1,661,250
139
52
115
7
Seller's
DE
Sussex County Coastal
$937,000
$782,500
13
7
13
6
Seller's
FL
Boca Raton/Delray Beach
$1,395,000
$857,500
121
75
106
9
Seller's
FL
Coastal Pinellas County
$1,385,150
$1,260,500
53
47
44
5
Seller's
FL
Greater Fort Lauderdale
$890,000
$775,000
526
189
219
22
Seller's
FL
Jacksonville Beaches
$1,095,000
$975,000
11
8
17
13
Seller's
FL
Lee County
$822,500
$848,000
146
97
117
3
Seller's
FL
Marco Island
$1,697,000
$1,322,500
24
16
12
4
Seller's
FL
Miami
$1,560,000
$1,300,000
950
242
258
57
Seller's
FL
Naples
$2,325,000
$1,962,500
106
54
88
5
Seller's
FL
Orlando
$615,998
$539,500
100
48
75
4
Seller's
FL
Palm Beach Towns
$1,995,000
$1,500,000
119
62
80
12
Seller's
FL
Sarasota & Beaches
$2,159,000
$1,497,500
91
41
62
4
Seller's
FL
South Pinellas County
$1,278,220
$922,000
105
75
61
5
Seller's
FL
South Walton
$1,662,800
$1,260,000
127
33
47
6
Seller's
FL
Tampa
$922,495
$695,000
58
38
67
FL
Weston
-
-
-
-
-
-
-
GA
Atlanta
$797,600
$619,900
296
133
197
6
Seller's
GA
Duluth
-
-
-
-
-
-
-
HI
Island of Hawaii
$2,237,500
$1,400,000
26
13
35
12
Seller's
HI
Kauai
$1,662,500
$1,277,500
28
8
16
12
Seller's
HI
Maui
$2,199,000
$1,650,000
59
30
55
59
Seller's
HI
Oahu
$1,250,000
$900,000
331
102
153
12
Seller's
ID
Ada County
$686,400
$606,500
37
32
37
5
Seller's
ID
Northern Idaho
-
-
-
-
-
-
-
IL
Chicago
$1,272,500
$933,500
506
179
270
10
Seller's
Seller's
Markets with dashes do not have a significant luxury market for this report. Median prices represent properties priced above respective city benchmark prices. Prices shown for Canadian cites are shown in Canadian Dollars.
– LUXURY MONTHLY MARKET REVIEW – ATTACHED HOMES State Market Name
Median List Price
Median Sold Price
Inventory
New Listings
Sold
Days on Market
Market Status
IL
DuPage County
$784,400
$607,250
14
5
14
7
Seller's
IL
Lake County
-
-
-
-
-
-
-
IL
Will County
-
-
-
-
-
-
-
IN
Hamilton County
-
-
-
-
-
-
-
KS
Johnson County
$614,750
$644,647
64
20
26
2
Seller's
MA
Cape Cod
$849,000
$849,000
21
3
7
20
Seller's
MA
Greater Boston
$2,499,500
$2,075,000
292
123
83
20
Seller's
MA
South Shore
$1,188,995
$869,000
7
2
8
40
Seller's
MD
Anne Arundel County
$579,900
$549,790
47
27
60
5
Seller's
MD
Frederick County
-
-
-
-
-
-
-
MD
Howard County
$580,553
$580,000
10
14
30
5
Seller's
MD
Montgomery County
$749,999
$755,000
67
61
103
6
Seller's
MD
Talbot County
-
-
-
-
-
-
-
MD
Worcester County
$769,000
$630,000
31
18
43
9
Seller's
MI
Livingston County
-
-
-
-
-
-
-
MI
Monroe County
-
-
-
-
-
-
-
MI
Oakland County
$698,250
$634,355
60
28
22
7
Seller's
MI
Washtenaw County
$625,000
$600,000
37
18
17
16
Seller's
MI
Wayne County
$660,000
$536,850
70
22
13
7
Balanced
MN
Olmsted County
-
-
-
-
-
-
-
MN
Twin Cities
-
-
-
-
-
-
-
MO
Kansas City
-
-
-
-
-
-
-
MO
St. Louis
-
-
-
-
-
-
-
NC
Asheville
$895,000
$941,083
27
8
13
55
Seller's
NC
Charlotte
$768,000
$645,000
106
58
77
6
Seller's
NC
Lake Norman
$548,457
$656,200
20
17
7
9
Seller's
NC
Raleigh-Durham
-
-
-
-
-
-
-
NJ
Ocean County
$969,000
$650,000
19
10
21
24
Seller's
NV
Lake Tahoe
$1,485,000
$1,250,000
16
10
8
45
Seller's
NV
Las Vegas
-
-
-
-
-
-
-
NV
Reno
-
-
-
-
-
-
-
NY
Brooklyn
$1,450,617
$1,267,500
418
115
72
64
Balanced
NY
Staten Island
$654,950
$588,888
60
29
23
20
Seller's
OH
Cincinnati
$715,000
-
23
7
0
-
Buyer's
Markets with dashes do not have a significant luxury market for this report. Median prices represent properties priced above respective city benchmark prices. Prices shown for Canadian cites are shown in Canadian Dollars.
– LUXURY MONTHLY MARKET REVIEW – ATTACHED HOMES State Market Name
Median List Price
Median Sold Price
Inventory
New Listings
Sold
Days on Market
Market Status
ON
GTA - Durham
$819,900
$850,000
26
44
62
7
Seller's
ON
GTA - York
$799,400
$780,000
200
222
153
9
Seller's
ON
Mississauga
$950,000
$950,000
127
158
130
7
Seller's
ON
Oakville
$1,299,000
$1,222,500
53
73
42
7
Seller's
ON
Toronto
$1,349,995
-
472
293
0
-
Buyer's
ON
Waterloo Region
$820,000
$815,000
48
67
126
7
Seller's
OR
Portland
-
-
-
-
-
-
-
SC
Hilton Head
$1,097,500
$1,058,500
26
17
16
5
Seller's
TN
Greater Chattanooga
-
-
-
-
-
-
-
TN
Nashville
$849,900
$600,000
40
29
75
3
Seller's
TX
Austin
$1,200,000
$748,000
67
47
103
5
Seller's
TX
Collin County
-
-
-
-
-
-
-
TX
Dallas
$945,000
$685,000
68
36
63
7
Seller's
TX
Denton County
-
-
-
-
-
-
-
TX
El Paso
-
-
-
-
-
-
-
TX
Fort Worth
-
-
-
-
-
-
-
TX
Greater Tyler
-
-
-
-
-
-
-
TX
Houston
$650,000
$605,000
113
60
59
16
Seller's
TX
Lubbock
-
-
-
-
-
-
-
TX
San Angelo
-
-
-
-
-
-
-
TX
San Antonio
$573,566
$548,250
16
5
6
15
Seller's
TX
The Woodlands & Spring
-
-
-
-
-
-
-
UT
Park City
$1,785,000
$1,675,000
57
31
46
6
Seller's
UT
Salt Lake City
$585,000
$557,275
61
60
120
5
Seller's
VA
Arlington & Alexandria
$1,099,000
$989,000
73
58
89
4
Seller's
VA
Charlottesville
$959,900
$540,000
24
15
11
3
Seller's
VA
Fairfax County
$787,965
$703,500
144
116
230
5
Seller's
VA
McLean & Vienna
$1,275,000
$918,750
27
13
22
5
Seller's
VA
Richmond
-
-
-
-
-
-
-
WA
Greater Seattle
$1,250,000
$1,072,500
179
88
140
5
Seller's
WA
Seattle
$1,553,500
$1,225,000
94
29
40
5
Seller's
WA
Spokane
-
-
-
-
-
-
-
Markets with dashes do not have a significant luxury market for this report. Median prices represent properties priced above respective city benchmark prices. Prices shown for Canadian cites are shown in Canadian Dollars.
MAY
2022
DALLAS TEX AS
DALLAS
SINGLE - FAMILY HOMES
LUXURY INVENTORY VS. SALES | APRIL 2022 Inventory
Sales
Luxury Benchmark Price 1: $750,000 $7,600,000+ $6,600,000 - $7,599,999
$4,000,000 - $4,799,999
4
1
$5,600,000 - $6,599,999
$4,800,000 - $5,599,999
13
0
6
1 0
Total Sales: 220 Seller's Market
3
3
Total Sales Ratio2: 108%
4
$3,400,000 - $3,999,999 $2,800,000 - $3,399,999
Total Inventory: 203
5
6
13
4
$2,200,000 - $2,799,999
16
11
$1,800,000 - $2,199,999
18
19 27
$1,400,000 - $1,799,999 21
$1,200,000 - $1,399,999
26 16
$900,000 - $999,999
23 23
$800,000 - $899,999 19
$750,000 - $799,999
1
25
13
$1,000,000 - $1,199,999
29
47 27
Square Feet3
Price
Beds
Baths
Sold
Inventory
Sales Ratio
-Range-
-Median Sold-
-Median Sold-
-Median Sold-
-Total-
-Total-
-Sold/Inventory-
0 - 1,999
$825,000
3
2
15
12
125%
2,000 - 2,999
$875,000
3
3
63
34
185%
3,000 - 3,999
$1,095,000
4
4
71
61
116%
4,000 - 4,999
$1,430,000
4
5
36
26
138%
5,000 - 5,999
$2,075,000
5
6
18
24
75%
6,000+
$3,435,000
5
7
17
46
37%
The luxury threshold price is set by The Institute for Luxury Home Marketing. 2Sales Ratio defines market speed and market type: Buyer's < 14.5%; Balanced >= 14.5 to < 20.5%; Seller's >= 20.5% plus. If >100% MLS® data reported previous month’s sales exceeded current inventory.
DALLAS
SINGLE - FAMILY HOMES
13 - MONTH LUXURY MARKET TREND 4 Median Sales Price
$1,100,000
214
182
Apr-21
$1,045,000
265
214 218
May-21
$1,067,500
$1,015,630
285 216
248 178
Jun-21
$947,500
Jul-21
$1,062,150
247 146
Aug-21
Inventory
$1,018,500
$1,135,000
Solds
$1,150,000
$1,060,000
$990,000
$1,040,000
230 136
Sep-21
143
Oct-21
175
127
120
Nov-21
151
Dec-21
98
110 125
89
Jan-22
153
Feb-22
$1,100,000
203 220
195
Mar-22
Apr-22
MEDIAN DATA REVIEW | APRIL TOTAL INVENTORY Apr. 2021
Apr. 2022
214
203 VARIANCE: -5 %
SALE PRICE PER SQFT. Apr. 2021
Apr. 2022
308
$
365 VARIANCE: 19 % $
TOTAL SOLDS Apr. 2021
SALES PRICE
Apr. 2022
182
220 VARIANCE: 21 %
Apr. 2021
SALE TO LIST PRICE RATIO Apr. 2021
1.10m
$
Apr. 2022
99.33% 106.22% VARIANCE: 7 %
Apr. 2022
1.10m VARIANCE: 0 % $
DAYS ON MARKET Apr. 2021
Apr. 2022
11
5 VARIANCE: -55 %
DALLAS MARKET SUMMARY | APRIL 2022 • The Dallas single-family luxury market is a Seller's Market with a 108% Sales Ratio. • Homes sold for a median of 106.22% of list price in April 2022. • The most active price band is $800,000-$899,999, where the sales ratio is 204%. • The median luxury sales price for single-family homes is $1,100,000. • The median days on market for April 2022 was 5 days, down from 11 in April 2021.
Square foot table does not account for listings and solds where square foot data is not disclosed. 4 Data reported includes Active and Sold properties and does not include Pending properties.
3
DALLAS
ATTACHED HOMES
LUXURY INVENTORY VS. SALES | APRIL 2022 Inventory
Sales
Luxury Benchmark Price 1: $530,000 $1,500,000+ $1,400,000 - $1,499,999
$1,100,000 - $1,199,999 $1,000,000 - $1,099,999
5
0
$1,300,000 - $1,399,999
$1,200,000 - $1,299,999
0
Total Sales: 63
1
Seller's Market
1
1
$900,000 - $949,999
1
2
2
$850,000 - $899,999
$750,000 - $799,999
Total Sales Ratio2: 93%
3
0 0
4 2
5
4
2
$700,000 - $749,999
5
7
4 5
$650,000 - $699,999 4
$600,000 - $649,999
9 6 6
$530,000 - $599,999
1
Total Inventory: 68
1 1
$950,000 - $999,999
$800,000 - $849,999
22
8
20
Square Feet3
Price
Beds
Baths
Sold
Inventory
Sales Ratio
-Range-
-Median Sold-
-Median Sold-
-Median Sold-
-Total-
-Total-
-Sold/Inventory-
0 - 1,999
$590,000
2
3
30
20
150%
2,000 - 2,499
$688,000
2
3
18
17
106%
2,500 - 2,999
$860,000
3
4
5
10
50%
3,000 - 3,499
$855,000
3
4
5
5
100%
3,500 - 3,999
$1,379,000
3
4
1
2
50%
4,000+
$4,527,500
3
5
4
14
29%
The luxury threshold price is set by The Institute for Luxury Home Marketing. 2Sales Ratio defines market speed and market type: Buyer's < 14.5%; Balanced >= 14.5 to < 20.5%; Seller's >= 20.5% plus. If >100% MLS® data reported previous month’s sales exceeded current inventory.
DALLAS
ATTACHED HOMES
13 - MONTH LUXURY MARKET TREND 4 Sale Price
$660,000
$695,000
$627,500
147
138
128
$602,300
126
Inventory
$651,700
$655,000
$665,000
$641,900
145
143
140
133
Solds
$718,000
94
59
Apr-21
57
56
44
May-21
Jun-21
Jul-21
39
37
Aug-21
Sep-21
44
Oct-21
55
31 Nov-21
Dec-21
$635,000
$662,500
$682,500
$685,000
76
71
72
68
39
Jan-22
56
Feb-22
65
Mar-22
63
Apr-22
MEDIAN DATA REVIEW | APRIL TOTAL INVENTORY Apr. 2021
Apr. 2022
128
68 VARIANCE: -47 % SALE PRICE PER SQFT. Apr. 2021
Apr. 2022
281
337 VARIANCE: 20 %
$
$
TOTAL SOLDS Apr. 2021
Apr. 2022
59
63 VARIANCE: 7 %
SALE TO LIST PRICE RATIO Apr. 2021
Apr. 2022
98.45% 102.29% VARIANCE: 4 %
SALES PRICE Apr. 2021
660k
$
685k VARIANCE: 4 % $
DAYS ON MARKET Apr. 2021
18
Apr. 2022
7 VARIANCE: -61 %
DALLAS MARKET SUMMARY | APRIL 2022 • The Dallas attached luxury market is a Seller's Market with a 93% Sales Ratio. • Homes sold for a median of 102.29% of list price in April 2022. • The most active price band is $530,000-$599,999, where the sales ratio is 333%. • The median luxury sales price for attached homes is $685,000. • The median days on market for April 2022 was 7 days, down from 18 in April 2021.
Square foot table does not account for listings and solds where square foot data is not disclosed. 4 Data reported includes Active and Sold properties and does not include Pending properties.
3
Apr. 2022
MAY
2022
FORT WORTH TEX AS
FORT WORTH
SINGLE - FAMILY HOMES
LUXURY INVENTORY VS. SALES | APRIL 2022 Inventory
Sales
Luxury Benchmark Price 1: $600,000 $4,000,000+ $3,500,000 - $3,999,999
$1,800,000 - $2,099,999
Total Inventory: 411
5
1
$2,700,000 - $3,099,999
$2,100,000 - $2,399,999
11
0
$3,100,000 - $3,499,999
$2,400,000 - $2,699,999
22
6
Total Sales: 432 Seller's Market
17
3
Total Sales Ratio2: 105%
10
0
15
8 10
16
$1,500,000 - $1,799,999
34
18 21 21
$1,300,000 - $1,499,999
23
$1,100,000 - $1,299,999
31
23 24
$950,000 - $1,099,999
41
$850,000 - $949,999
51
42
$750,000 - $849,999
62 78
$650,000 - $749,999 53
$600,000 - $649,999
1
110 87
Square Feet3
Price
Beds
Baths
Sold
Inventory
Sales Ratio
-Range-
-Median Sold-
-Median Sold-
-Median Sold-
-Total-
-Total-
-Sold/Inventory-
0 - 2,999
$675,000
4
3
123
105
117%
3,000 - 3,999
$760,000
4
4
195
137
142%
4,000 - 4,999
$933,500
5
4
74
76
97%
5,000 - 5,999
$1,700,000
5
6
25
43
58%
6,000 - 6,999
$2,195,000
5
6
5
23
22%
7,000+
$3,076,750
5
7
10
26
38%
The luxury threshold price is set by The Institute for Luxury Home Marketing. 2Sales Ratio defines market speed and market type: Buyer's < 14.5%; Balanced >= 14.5 to < 20.5%; Seller's >= 20.5% plus. If >100% MLS® data reported previous month’s sales exceeded current inventory.
FORT WORTH
SINGLE - FAMILY HOMES
13 - MONTH LUXURY MARKET TREND 4 Median Sales Price
$840,000
$815,000
$787,500
347
304
257
215
Apr-21
May-21
307
$784,950
414 388
380
Jun-21
Jul-21
$835,000
413
334
Aug-21
$836,000
373
318
Sep-21
Inventory
$781,000
352 263
Oct-21
$777,304
322
275
Solds
$785,000
287 277
Nov-21
Dec-21
$775,000
$750,000
247
246 221
191
Jan-22
$805,000
$761,565
411 432
317 343
Feb-22
Mar-22
Apr-22
MEDIAN DATA REVIEW | APRIL TOTAL INVENTORY Apr. 2021
Apr. 2022
215
411 VARIANCE: 91 %
SALE PRICE PER SQFT. Apr. 2021
Apr. 2022
209
$
244 VARIANCE: 17 % $
TOTAL SOLDS Apr. 2021
Apr. 2022
304
432 VARIANCE: 42 %
SALE TO LIST PRICE RATIO Apr. 2021
Apr. 2022
101.02% 105.41% VARIANCE: 4 %
SALES PRICE Apr. 2021
788k
$
Apr. 2022
762k VARIANCE: -3 % $
DAYS ON MARKET Apr. 2021
Apr. 2022
4
5 VARIANCE: 25 %
FORT WORTH MARKET SUMMARY | APRIL 2022 • The Fort Worth single-family luxury market is a Seller's Market with a 105% Sales Ratio. • Homes sold for a median of 105.41% of list price in April 2022. • The most active price band is $600,000-$649,999, where the sales ratio is 164%. • The median luxury sales price for single-family homes is $761,565. • The median days on market for April 2022 was 5 days, up from 4 in April 2021.
Square foot table does not account for listings and solds where square foot data is not disclosed. 4 Data reported includes Active and Sold properties and does not include Pending properties.
3
MAY
2022
DENTON COUNTY TEX AS
DENTON COUNTY
SINGLE - FAMILY HOMES
LUXURY INVENTORY VS. SALES | APRIL 2022 Inventory
Sales
Luxury Benchmark Price 1: $575,000 $2,700,000+ $2,250,000 - $2,699,999 $1,850,000 - $2,249,999
17
5 8
2
Total Inventory: 303 11
4
$1,450,000 - $1,849,999
Seller's Market
24
12 19
$1,250,000 - $1,449,999
Total Sales Ratio2: 138% 22
11 10
$1,150,000 - $1,249,999 $1,050,000 - $1,149,999
Total Sales: 419
6
8 10
$950,000 - $1,049,999
32 29
$850,000 - $949,999 12
$800,000 - $849,999
58
21 19
$750,000 - $799,999
46
32
$700,000 - $749,999
57 49 48
$650,000 - $699,999 31
$600,000 - $649,999 25
$575,000 - $599,999
1
60 34
Square Feet3
Price
Beds
Baths
Sold
Inventory
Sales Ratio
-Range-
-Median Sold-
-Median Sold-
-Median Sold-
-Total-
-Total-
-Sold/Inventory-
0 - 2,999
$657,750
4
3
142
89
160%
3,000 - 3,999
$772,500
4
4
192
125
154%
4,000 - 4,999
$999,950
5
4
68
49
139%
5,000 - 5,999
$1,750,000
5
5
9
21
43%
6,000 - 6,999
$2,985,812
6
7
4
14
29%
7,000+
$2,800,000
6
7
4
5
80%
The luxury threshold price is set by The Institute for Luxury Home Marketing. 2Sales Ratio defines market speed and market type: Buyer's < 14.5%; Balanced >= 14.5 to < 20.5%; Seller's >= 20.5% plus. If >100% MLS® data reported previous month’s sales exceeded current inventory.
DENTON COUNTY
SINGLE - FAMILY HOMES
13 - MONTH LUXURY MARKET TREND 4 Median Sales Price
$725,000
$695,000
284
270 145
Apr-21
$720,500
$710,000
351
333 331
$740,000
323 333
224
175
May-21
Jun-21
Jul-21
Aug-21
$715,756
257
318
Sep-21
Inventory
Solds
$750,000 $701,000
$700,000
$700,000
283
271
277
238
Oct-21
$725,000
$751,000
$750,000
419
362 222
162
Nov-21
Dec-21
114
233
177
117
Jan-22
303
182
Feb-22
Mar-22
Apr-22
MEDIAN DATA REVIEW | APRIL TOTAL INVENTORY Apr. 2021
Apr. 2022
145
303 VARIANCE: 109 % SALE PRICE PER SQFT. Apr. 2021
Apr. 2022
196
242 VARIANCE: 23 %
$
$
TOTAL SOLDS Apr. 2021
Apr. 2022
270
419 VARIANCE: 55 %
SALE TO LIST PRICE RATIO Apr. 2021
Apr. 2022
101.77% 107.83% VARIANCE: 6 %
SALES PRICE Apr. 2021
725k
$
Apr. 2022
751k VARIANCE: 4 % $
DAYS ON MARKET Apr. 2021
Apr. 2022
4
5 VARIANCE: 25 %
DENTON COUNTY MARKET SUMMARY | APRIL 2022 • The Denton County single-family luxury market is a Seller's Market with a 138% Sales Ratio. • Homes sold for a median of 107.83% of list price in April 2022. • The most active price band is $950,000-$1,049,999, where the sales ratio is 320%. • The median luxury sales price for single-family homes is $751,000. • The median days on market for April 2022 was 5 days, up from 4 in April 2021. Square foot table does not account for listings and solds where square foot data is not disclosed. 4 Data reported includes Active and Sold properties and does not include Pending properties.
3
YOUR TRUSTED RESOURCE DURING A CHANGING MARKET In today’s real estate market, you need to work with a real estate professional you can trust. At Hrisco & Associates, we are dedicated to providing the absolute finest service and expertise possible for our clients. Whether you are buying or selling your primary residence, a second home, or relocating to a new neighborhood, we can help make your home ownership dreams come true. I value my long-standing relationships with my clients and am always available should you have any questions or concerns. These statistics represent the current market trends both nationally and locally. For an in-depth analysis on how these trends affect your home’s value, contact me today.
~ John Hrisco
JOHN HRISCO
817.328.1400 | john@johnhrisco.com | www.DFWLuxuryMarketReport.com