HUSH GROUP LUXURYMARKETREPORT
SAN DIEGO | JUNE 2026
Our Mission: Provide clients with the information and neighborhood expertise they need to make smart real estate decisions.
FREE
Buyer Consultations Include:
• Taking time to understand your real estate goals and tailor a plan to achieve them.
• Introductions to trusted local mortgage providers and discussion of loan types
• Review of down payment assistance and interest rate buy-down programs.
• Access to full MLS data with customized property searches
• Review of “above and beyond” property search methods
• Customized costs worksheet detailing anticipated closing costs and cash needed to complete your property purchase
• Detailed review of CA Residential Purchase Agreement (offer and purchase document/contract)
• Step by step review of the home buying process and Q&A
NO OBLIGATION
Seller Consultations Include:
• Taking time to understand your real estate goals and tailor a plan to achieve them.
• Initial walk-through of your property (in-person or virtual)
• Analysis of Relevant Properties (Comparative Market Analysis)
• Discussion and review of current market conditions
• Property Profile and Preliminary Title Report Review
• Impactful and cost effective suggestions to prepare your property for the market
• Recommendations for home staging and introductions to local experts
• Review of our 360° Marketing Plan designed to achieve the highest possible net proceeds from your property
• Step by step review of the home selling process and Q&A
Ready to take the next step? Contact the Hush Group today!
PAGE 4-7
PAGE 8
PAGE 9
PAGE 10
PAGE 11-14
PAGE 15
PAGE 16
PAGE 17-21
PAGE 22
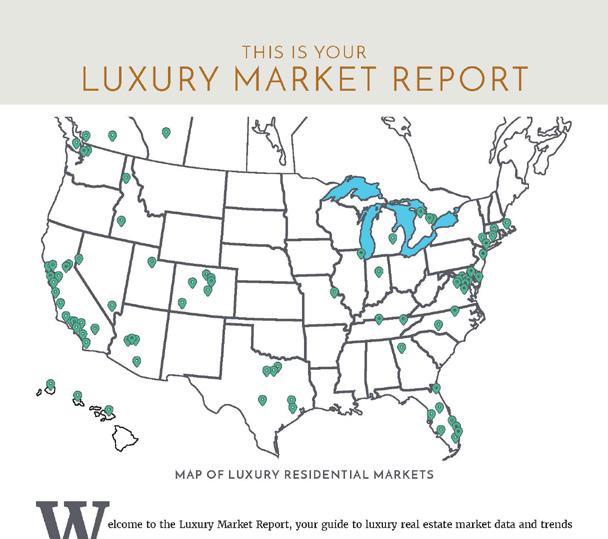
NORTH AMERICAN LUXURY MARKET REVIEW
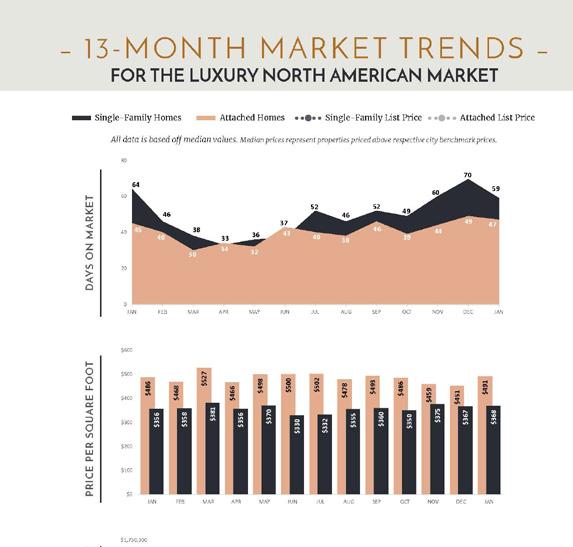
13-MONTH MARKET TRENDS
SINGLE-FAMILY HOMES MONTHLY OVERVIEW
ATTACHED HOMES MONTHLY OVERVIEW
MONTHLY STATISTICS BY CITY
LUXURY REPORT EXPLAINED
WELCOME MESSAGE
LOCAL LUXURY MARKET REVIEW
THANK YOU
LUXURY REAL ESTATE DEFIES EXPECTATIONS AS DEMAND OUTPACES SUPPLY
May’s luxury real estate data reveals a market that continues to challenge conventional wisdom.
At first glance, the numbers appear contradictory. Inventory levels remain below last year’s levels, new listings entering the market have declined, and economic uncertainty still dominates headlines. Yet despite these conditions, luxury home sales have continued to increase both month-over-month and year-over-year.
For affluent buyers, the desire to own luxury real estate remains remarkably resilient.
Traditionally, declining inventory levels would be expected to restrict transaction activity. Fewer properties available for purchase typically result in fewer sales. However, the luxury market is behaving differently in 2026.
The evidence points to a luxury market operating on an entirely different cycle, one driven less by mortgage rates and economic uncertainty and more by wealth preservation, lifestyle priorities, inventory scarcity, and long-term financial planning.
A MARKET OF CONTRADICTIONS
While spring markets typically generate increased activity, the pace of sales growth in 2026 has been unusually strong, especially considering the simultaneous decline in available inventory.
Luxury single-family homes have demonstrated particularly impressive momentum. Year-over-year sales growth accelerated throughout the spring, increasing 5.8% in March, 6.8% in April, and 10.3% in May compared to the same months in 2025. Since January, luxury single-family sales have risen 6.1% compared to the first five months of last year.
Luxury attached properties have followed a similar, albeit more moderate, pattern. Sales increased 6.3% year-over-year in March, slowed to 0.6% in April amid heightened economic uncertainty, and rebounded
to 2.7% growth in May. Overall, sales have increased 1.9% compared to the same period in 2025.
Yet inventory trends tell a very different story.
Monthly inventory levels throughout 2026 have remained below their corresponding levels in 2025. By May, luxury single-family inventory was 5.8% lower year-over-year, while attached luxury inventory had declined by 6.5%.
More notable is that new listing activity has also lagged behind last year’s pace for the last several months, with new listings in May falling 10.0% for single-family homes and 8.8% for attached properties compared to May 2025.
Perhaps most unusual is that new inventory entering the market declined month-over-month in May, a trend that historically does not emerge until the start of the summer vacation season.
Under normal market conditions, declining inventory and reduced listing activity would suggest weakening demand and slowing sales. Instead, luxury sales have continued to increase, indicating that available inventory is being absorbed faster than it is being replenished.
WHY ARE LUXURY BUYERS STILL BUYING?
Several factors help explain why affluent buyers continue to enter the market despite ongoing economic and geopolitical uncertainty.
First, affluent buyers often view real estate differently than the traditional consumer. They view luxury real estate as a long-term wealth-preservation asset rather than a short-term investment. Despite market volatility and geopolitical uncertainty, premium real estate continues to be viewed as a tangible store of value and a means of preserving wealth across generations.
At the same time, strong gains in equity markets, business ownership, and alternative investments have expanded purchasing power among high-net-worth individuals. Combined with the prevalence of cash and large down-payment purchases, luxury buyers are often less sensitive to economic fluctuations and mortgage-rate movements than the broader market.
The second factor is pricing. Unlike the frenzied conditions experienced during the pandemic years, today’s market offers buyers greater negotiating power. While luxury properties have generally maintained their value, many sellers have become more realistic in their pricing strategies, creating opportunities for well-positioned buyers.
This does not necessarily mean luxury properties are becoming inexpensive. Rather, buyers perceive that they can acquire premium assets under more favorable conditions than they could several years ago.
The combination of greater choice, more balanced negotiations, and reduced competition compared to the peak pandemic years has encouraged many affluent buyers to move forward with purchasing decisions.
Lastly, and ironically, declining inventory may itself be contributing to demand. Buyers who perceive that quality inventory is becoming increasingly scarce may be accelerating purchasing decisions rather than waiting for conditions to improve.
WHY ARE SELLERS HOLDING BACK?
If demand remains strong, why are fewer luxury properties entering the market? The answer appears to be rooted in seller psychology and financing considerations.
Many luxury homeowners are not under pressure to sell. Unlike broader housing segments, affluent sellers often have the financial flexibility to delay a transaction if market conditions are not ideal.
This is particularly true among entry-level luxury homeowners who may still require financing on their next purchase. Many remain reluctant to relinquish historically low mortgage rates secured in previous years. For these owners, moving today could mean exchanging a low-interest mortgage for a significantly higher borrowing cost. Unless a life event necessitates a move, many are choosing to wait.
Economic uncertainty is creating a similar effect. Sellers who do not need to transact immediately are often choosing patience over urgency, postponing major financial decisions until economic conditions become more predictable.
As a result, inventory remains constrained despite healthy buyer demand.
THE “RIGHT PROPERTY” GAP WIDENS
One of the most important trends emerging in 2026 is the widening gap between average luxury inventory and exceptional luxury inventory.
Today’s affluent buyers have become highly selective. Properties that offer distinctive architecture, privacy, acreage, waterfront access, wellness amenities, turnkey renovations, or unique lifestyle experiences continue to attract strong interest. In contrast, homes that are perceived as overpriced, dated, or lacking differentiation are taking longer to sell and often require pricing adjustments.
This bifurcation helps explain why market statistics can sometimes appear contradictory. While overall inventory may fluctuate modestly from month to month, the supply of truly desirable luxury inventory remains limited.
For buyers seeking a specific lifestyle, location, or property type, available options remain scarce. When the right property becomes available, hesitation often disappears. This is evident in the days on market for sold luxury properties, which has averaged around 30 days in 2026.
PRICE AND DEMAND GROWTH CONFIRM MARKET STRENGTH
Perhaps the strongest evidence supporting ongoing demand can be found in pricing trends. Despite a more negotiable
environment, median sold prices continue to rise.
To date in 2026, median sold prices continue to trend upward, with luxury single-family homes increasing 1.8% and luxury attached properties rising 2.5%. While buyers may be benefiting from improved negotiating conditions, these gains indicate that demand remains resilient and that affluent purchasers continue to place a premium on highly desirable properties.
The overall sales ratio, which measures supply against demand, further indicates that both market segments have shifted toward more balanced-to-seller-favored conditions.
However, importantly, these indicators do not suggest a return to the unprecedented demand surge experienced during the pandemic. Instead, they appear to be the result of constrained inventory meeting steady and resilient demand.
LOOKING AHEAD
As the market moves into the second half of 2026, inventory trends will likely become the most important indicator to watch.
Should new listing activity remain below historical norms, luxury markets may face even tighter supply conditions by late summer and early fall. Conversely, a meaningful increase in inventory could restore greater balance between buyers and sellers.
For now, however, the evidence suggests that luxury real estate remains remarkably resilient.
Rather than slowing, the market appears to be normalizing into a highly selective environment characterized by affluent buyer confidence, constrained inventory, moderate price appreciation, and strong demand for exceptional properties.
The apparent contradiction of rising sales amid declining inventory may ultimately reveal the defining characteristic of today’s luxury market: affluent buyers will continue to pursue lifestyle, legacy, and wealth-preservation opportunities even when the broader market remains cautious.
In 2026, luxury real estate is demonstrating that demand is not solely driven by economic conditions or financing costs. Instead, scarcity, wealth dynamics, lifestyle priorities, and long-term value continue to motivate affluent buyers, allowing demand to remain strong even as available inventory contracts.