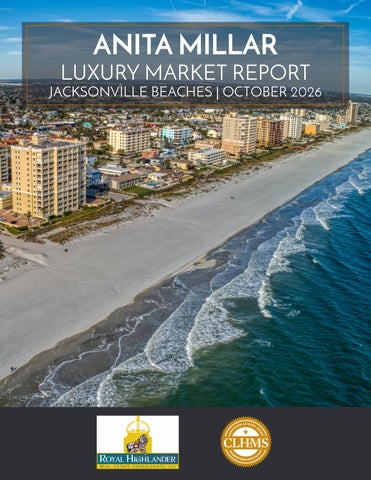
ANITA MILLAR
LUXURY MARKET REPORT JACKSONVILLE BEACHES | OCTOBER 2026
ANITA MILLAR
REALTOR®, Broker-Owner, LCAM, CLHMS, RSPS, CRS, SRES, GRI Royal Highlander Real Estate Consultants 626 Willow Lake Dr , Saint Augustine, FL 32092
office/cell 904.509.8622
anita@royalhighlanderrealestate.com www.homesnap.com/Anita-Millar-2 “My goal is to make you so delighted with my service that you will gladly introduce me to 3 family members or friends prior to the closing of your property.” Sales Performance & Experience – I am a Broker (not an agent) therefore, my level of education, experience and continuing education is higher than 95% of all other agents. My performance for the past 18 years is over $150 million dollars in closed sales. My CLOSED customer satisfaction rate is extremely high because in at least 10% of my closings I was able to negotiate a selling price over and above appraised value due to my Negotiations Certification. I also have a reputation as being very detail-oriented on contracts and closing statements which means that my customers know that I am committed to achieving the best possible outcome for them. I have found mistakes on closing statements that result in more money in my seller’s pocket on multiple occasions. I am a Certified Luxury Home Marketing Specialist which means that I have voluntarily taken extensive courses in marketing, pricing & staging luxury homes and subsequently sold more than enough to earn this certification and to maintain it. (A property must sell for greater than $500,000 to qualify as a luxury home.) I am also a certified Senior Real Estate Specialist who works with seniors to “right size” their living arrangements and to relocate to locations where they want to spend the next phase of their lives. I am also Resort & Second Home Specialist Certified which means I understand the opportunities that exist with unique recreational opportunities in our area and how to attract buyers who are looking for those opportunities. It also means that I am knowledgeable about the investment implications of buying a second home, vacation home or rental property. I am exceptionally trained in all types of financing -VA, FHA, FHA 203-B, 1031 Exchanges, FIRPTA, Conventional, Jumbo, IRA Investments in Real Estate and Trusts. My company motto is: “We don’t just take you for a ride…We deliver results”
TABLE OF CONTENTS PAGE 4-7
NORTH AMERICAN LUXURY MARKET REVIEW
PAGE 8
13-MONTH MARKET TRENDS
PAGE 9
SINGLE-FAMILY HOMES MONTHLY OVERVIEW
PAGE 10
ATTACHED HOMES MONTHLY OVERVIEW
PAGE 11-14
MONTHLY STATISTICS BY CITY
PAGE 15
LUXURY REPORT EXPLAINED
PAGE 16
WELCOME MESSAGE
PAGE 17-21 LOCAL LUXURY MARKET REVIEW PAGE 22
THANK YOU
NORTH AMERICAN LUXURY REVIEW A MARKET IN TRANSITION AS SELLERS CONTINUE TO RESPOND September’s figures point to a gradual but meaningful shift in the North American luxury real estate market. The disparity between sales growth and declining inventory that characterised the first half of 2026 is narrowing, suggesting that sellers are beginning to respond to sustained demand. However, the pace of this adjustment remains measured, and the differences between single-family homes and attached properties reveal a market in which buyer preferences, property fundamentals and broader economic pressures are increasingly influencing outcomes.
SINGLE-FAMILY HOMES: SUPPLY BEGINS TO CATCH UP WITH DEMAND The single-family segment continues to demonstrate the stronger underlying performance, but September’s figures suggest that the supply-demand imbalance is easing. Year-over-year sales only increased by 3.5% in September, compared with 9.8% in July. Meanwhile, inventory recorded a marginal increase of 0.2% year-over-year, the first comparative increase seen in 2026. New listings rose by 2.0%, extending the gradual improvement recorded in July and August. The quarterly figures reinforce this direction of travel. Between July and September, sales increased by 5.2% year-over-year, while inventory was just 1.4% below the equivalent quarter in 2025. This represents a considerable shift from the second quarter, when sales growth reached 11.2% against an inventory decline of 4.9%. The implication is that sellers are beginning to recognise that demand remains present and that market conditions may favour bringing suitable properties to market. This incremental response is allowing sales activity and available inventory to move closer together. Several factors may explain the continued strength of single-family properties. For affluent households, a detached residence offers a combination of privacy, space, security and lifestyle flexibility that is difficult
to replicate in an attached property. Land, outdoor amenities, additional bedrooms and adaptable living spaces can also support multigenerational living, working from home and long-term ownership. For buyers prioritising wealth preservation, a welllocated, high-quality home may also represent a longer-term asset rather than simply a discretionary purchase. This does not make every luxury property immune to economic pressures, but it can help explain why demand for desirable detached homes remains comparatively resilient.
ATTACHED PROPERTIES: A MORE UNEVEN RECOVERY The attached segment presents a different picture. Condominiums and townhomes tend to experience greater fluctuations in activity, partly because they appeal to a more varied buyer base and are exposed to a broader range of financing, ownership-cost and investment considerations. In September, sales declined by 7.6% year-over-year, reversing July’s 15.1% increase. Inventory was down by just 3.1% compared with September 2025, a smaller decline than July’s 4.8%. Across the third quarter, sales increased by only 0.9% year-over-year, while inventory was 4.2% lower. This contrasts with the second quarter, when sales grew by 4.1% and inventory declined by 7.3%. The reduction in the gap between sales and inventory suggests that the segment is losing some of the momentum evident earlier in the year. New listings also weakened in September, falling by 3.9% yearover-year after increasing by 1.9% in August. This reluctance to list may reflect uncertainty over achievable selling prices, the cost of ownership and the future direction of demand. Unlike detached properties, condominiums and townhomes can be particularly sensitive to monthly association fees, special assessments, building maintenance, insurance costs and the financial health of the wider development. In some markets, concerns about oversupply, investor demand or competing new construction may add to that uncertainty. These factors do not affect every building or market equally. A well-managed condominium in a prime urban location, with strong amenities and limited competing supply, can remain highly desirable. Conversely, a property facing rising fees, substantial maintenance requirements or competition from newer developments may struggle to justify its price.
The attached market should therefore not be viewed as uniformly weak. Its performance is more dependent on the specific characteristics of the property, its ownership structure and the needs of its target buyer.
THE ECONOMIC BACKDROP: WEALTH DOES NOT ELIMINATE UNCERTAINTY The wider economic environment provides important context for these trends. Although luxury buyers often have greater financial flexibility than mainstream purchasers, affluent households are not entirely insulated from borrowing costs, market volatility or uncertainty about future economic conditions. For financed luxury purchases, higher rates can materially change the cost of ownership, even when buyers have substantial assets. Some affluent purchasers may choose to pay cash, use existing equity or arrange alternative financing, but the opportunity cost of capital remains relevant. Money allocated to a property is money that cannot be deployed elsewhere, and buyers may weigh real estate against other investments when financial markets are unsettled. Carrying costs also extend beyond mortgage payments. Property taxes, insurance premiums, utilities, maintenance, staffing and the expense of managing multiple residences can influence the overall appeal of a purchase. In areas exposed to severe weather or other climate-related risks, insurance availability and future premiums can be particularly important considerations. These influences may not necessarily prevent a purchase. Instead, they can change the timing, terms and level of scrutiny applied to it. Buyers may negotiate more firmly, seek repairs or concessions, or decide that a property requiring substantial additional expenditure no longer represents the right investment. For sellers, this means that strong demand at the upper end of the market should not be confused with unlimited pricing power.
WHAT THE NUMBERS MEAN FOR SELLERS AND BUYERS The emerging balance between sales and inventory has implications for both sides of the transaction. For sellers, the gradual return of competing listings makes accurate pricing and effective presentation increasingly important. The limited supply of genuinely desirable properties may continue to support values, but scarcity alone does not guarantee a successful sale. Buyers must still see a compelling reason to choose one property over another, particularly when ownership costs and alternative options are receiving closer attention.
For buyers, a more measured market may offer opportunities to negotiate, conduct thorough due diligence and assess long-term suitability without the urgency that can accompany severe supply shortages. Yet opportunities will not be uniform. Exceptional properties in sought-after locations may remain difficult to secure, especially where new supply is constrained. Agents, meanwhile, need to look beyond headline sales figures. The changing relationship between inventory, new listings and completed transactions offers a more nuanced view of market momentum. In the attached segment, understanding building-level costs and financial health may be just as important as analysing comparable sales. For detached homes, condition, location, privacy, land and the cost of future improvements may increasingly determine how buyers perceive value.
THIRD QUARTER CONCLUSION September’s data reinforces a trend that began in July: the North American luxury market is gradually moving away from the pronounced supply-demand imbalance seen earlier in 2026. Single-family homes continue to show comparatively resilient activity, while attached properties are experiencing a more uneven adjustment. The modest increase in new listings suggests that sellers are beginning to respond to demand, although the pace remains cautious. At the same time, the wider economic environment is encouraging buyers to examine the total cost of ownership and the long-term merits of individual properties more carefully. The next phase of the market is therefore likely to be defined less by broad-based momentum and more by selectivity. Demand may remain healthy for properties that combine location, quality, functionality and enduring appeal, while others face greater pressure to demonstrate value.
– 13 - MONTH MARKET TRENDS – FOR THE LUXURY NORTH AMERICAN MARKET
Single-Family Homes
Attached Homes
Single-Family List Price
Attached List Price
All data is based off median values. Median prices represent properties priced above respective city benchmark prices. 50
DAYS ON MARKET
45 40 35 30 25 20 15 10 5 0
SEP
OCT
NOV
DEC
JAN
FEB
MAR
APR
MAY
JUN
JUL
AUG
SEP
45% 40%
SALES RATIO
35% 30%
Seller's
25%
21%
20%
Balanced
15%
12%
10%
Buyer's
5% 0%
SEP
OCT
NOV
DEC
JAN
FEB
MAR
APR
MAY
JUN
JUL
AUG
SEP
JUN
JUL
AUG
SEP
SALES PRICE VS. LIST PRICE
$1,700,000
$1,500,000
$1,300,000
$1,100,000
$900,000
$700,000
$500,000
SEP
OCT
NOV
DEC
JAN
FEB
MAR
APR
MAY
– LUXURY MONTHLY MARKET REVIEW – A Review of Key Market Differences Year over Year September 2025 | September 2026
SINGLE-FAMILY HOMES September 2025
September 2026
Median List Price
$1,497,000
$1,502,450
Total Inventory
76,855
76,995
Median Sale Price
$1,303,875
$1,310,000
New Listings
23,506
23,984
Median SP/LP Ratio
98.04%
98.02%
Total Sold
16,290
16,850
Total Sales Ratio
21.20%
21.88%
Median Days on Market
35
32
$390
$394
3,235
3,349
Median Price per Sq. Ft.
September 2025 September 2026
Average Home Size
Median prices represent properties priced above respective city benchmark prices.
3
.68%
Days on Market
Sales Ratio
478
560
$
6,125
New Listings
Total Sold
Med. Sale Price
SINGLE-FAMILY HOMES MARKET SUMMARY | SEPTEMBER 2026 •
Official Market Type: Seller's Market with a 21.88% Sales Ratio.1
•
Homes are selling for an average of 98.02% of list price.
•
The median luxury threshold2 price is $912,500, and the median luxury home sales price is $1,502,450.
•
Markets with the Highest Median Sales Price: Whistler ($6,800,000), Telluride ($6,197,500), Silicon Valley ($5,775,000), and Eagle County ($4,650,000).
•
Markets with the Highest Sales Ratio: San Francisco (91.1%), Central Connecticut (60.6%), Chicago (58.7%), and Marin County (57.7%). Sales Ratio defines market speed and market type: Buyer's < 12%; Balanced >= 12 to < 21%; Seller's >= 21%. If >100%, sales from previous month
1
exceeds current inventory. 2The luxury threshold price is set by The Institute for Luxury Home Marketing.
– LUXURY MONTHLY MARKET REVIEW – A Review of Key Market Differences Year over Year September 2025 | September 2026
ATTACHED HOMES September 2025
September 2026
Median List Price
$902,495
$900,000
Total Inventory
26,326
25,507
Median Sale Price
$870,000
$911,476
New Listings
8,201
7,879
Median SP/LP Ratio
98.21%
98.22%
Total Sold
4,465
4,128
Total Sales Ratio
16.96%
16.18%
Median Days on Market
32
32
$488
$475
1,941
1,966
Median Price per Sq. Ft.
September 2025 September 2026
Average Home Size
Median prices represent properties priced above respective city benchmark prices.
0
.78%
Days on Market
Sales Ratio
322
337
$
41,476
New Listings
Total Sold
Med. Sale Price
ATTACHED HOMES MARKET SUMMARY | SEPTEMBER 2026 •
Official Market Type: Balanced Market with a 16.18% Sales Ratio.1
•
Attached homes are selling for an average of 98.22% of list price.
•
The median luxury threshold2 price is $700,000, and the median attached luxury sale price is $900,000.
•
Markets with the Highest Median Sales Price: Telluride ($4,050,000), San Francisco ($2,575,000), Eagle County ($2,412,500), and Whistler ($2,397,500).
•
Markets with the Highest Sales Ratio: San Francisco (76.3%), Lake Tahoe (53.8%), Marin County (50.0%), and Howard County (48.6%). Sales Ratio defines market speed and market type: Buyer's < 12%; Balanced >= 12 to < 21%; Seller's >= 21%. If >100%, sales from previous month
1
exceeds current inventory. 2The luxury threshold price is set by The Institute for Luxury Home Marketing.
– LUXURY MONTHLY MARKET REVIEW – SINGLE FAMILY HOMES
ATTACHED HOMES
State Market Name
List Price
Sold Price
DOM
Ratio
Market
List Price
Sold Price
DOM
Ratio
Market
AB
Calgary
$1,549,900
$1,510,000
17
29.3%
Seller's
$899,900
$865,000
56
17.4%
Balanced
AZ
Chandler and Gilbert
$1,100,000
$1,095,000
50
23.3%
Seller's
-
-
-
-
-
AZ
Flagstaff
$1,690,000
$1,453,750
103
21.2%
Seller's
-
-
-
-
-
AZ
Fountain Hills
$2,742,000
$2,500,000
36
6.5%
Buyer's
$675,000
$690,000
97
9.1%
Buyer's
AZ
Mesa
$864,500
$849,750
63
28.6%
Seller's
-
-
-
-
-
AZ
Paradise Valley
$6,422,500
$4,292,500
17
11.1%
Buyer's
-
-
-
-
-
AZ
Phoenix
$899,000
$815,000
50
22.5%
Seller's
-
-
-
-
-
AZ
Scottsdale
$2,299,955
$1,699,000
66
24.0%
Seller's
$920,500
$825,000
88
15.4%
Balanced
AZ
Tucson
$695,755
$650,000
45
18.1%
Balanced
-
-
-
-
-
BC
Vancouver
$3,880,000
$3,092,500
30
7.8%
Buyer's
$1,849,000
$1,688,000
28
10.1%
Buyer's
BC
Whistler
$6,645,000
$6,800,000
236
2.9%
Buyer's
$2,222,000
$2,397,500
91
11.1%
Buyer's
CA
Central Coast
$2,700,000
$2,198,500
36
18.1%
Balanced
$1,083,500
$1,102,500
33
14.3%
Balanced
CA
East Bay
$2,000,000
$1,940,000
13
54.0%
Seller's
$1,098,400
$1,094,500
28
28.9%
Seller's
CA
El Dorado County
$1,749,000
$1,562,500
16
16.3%
Balanced
-
-
-
-
-
CA
Greater Palm Springs
$1,795,000
$1,645,000
89
13.9%
Balanced
-
-
-
-
-
CA
Lake Tahoe
$2,595,000
$2,027,000
27
42.0%
Seller's
$1,650,000
$1,400,000
32
26.5%
Seller's
CA
Los Angeles Beach Cities
$6,499,500
$3,910,000
29
13.9%
Balanced
$1,794,500
$1,780,000
27
15.9%
Balanced
CA
Los Angeles City
$4,895,000
$3,800,000
39
12.3%
Balanced
$1,595,000
$1,456,500
35
13.2%
Balanced
CA
Los Angeles The Valley
$2,499,000
$2,089,000
33
16.4%
Balanced
$804,500
$825,000
40
22.1%
Seller's
CA
Marin County
$3,895,000
$3,270,000
9
57.7%
Seller's
$1,295,000
$1,305,000
15
50.0%
Seller's
CA
Napa County
$3,100,000
$2,740,000
84
5.9%
Buyer's
-
-
-
-
-
CA
Orange County
$2,800,000
$2,384,000
28
32.3%
Seller's
$1,199,000
$1,117,500
30
27.2%
Seller's
CA
Placer County
$1,300,000
$1,220,000
38
23.6%
Seller's
-
-
-
-
-
CA
Sacramento
$950,000
$910,000
25
33.7%
Seller's
-
-
-
-
-
CA
San Diego
$2,424,900
$1,919,352
14
29.8%
Seller's
$1,169,500
$1,122,500
26
24.0%
Seller's
CA
San Francisco
$3,995,000
$3,750,000
11
91.1%
Seller's
$2,795,000
$2,575,000
9
76.3%
Seller's
CA
San Luis Obispo County
$1,795,000
$1,475,000
36
28.2%
Seller's
-
-
-
-
-
CA
Silicon Valley
$6,500,000
$5,775,000
8
44.4%
Seller's
$1,750,000
$1,650,000
14
29.9%
Seller's
CA
Sonoma County
$2,295,000
$1,832,655
48
19.3%
Balanced
$782,990
$760,000
35
33.3%
Seller's
CA
Ventura County
$2,177,500
$1,750,000
46
23.8%
Seller's
$775,000
$757,250
61
19.9%
Balanced
CO
Boulder
$2,099,000
$1,575,000
53
18.3%
Balanced
$849,000
$878,000
55
10.5%
Buyer's
CO
Colorado Springs
$925,000
$879,500
34
15.4%
Balanced
$566,944
$680,000
35
9.4%
Buyer's
CO
Denver
$1,495,000
$1,400,000
23
20.3%
Balanced
$847,000
$790,000
41
12.3%
Balanced
CO
Douglas County
$1,324,990
$1,185,000
33
17.9%
Balanced
$560,875
$575,000
32
26.3%
Seller's
CO
Eagle County
$4,999,000
$4,650,000
77
10.8%
Buyer's
$2,475,000
$2,412,500
36
12.4%
Balanced
CO
Summit County
$2,774,000
$1,915,500
27
13.2%
Balanced
$1,217,000
$1,287,500
49
15.0%
Balanced
CO
Telluride
$5,172,500
$6,197,500
232
7.3%
Buyer's
$2,722,500
$4,050,000
225
15.3%
Balanced
CT
Central Connecticut
$695,000
$625,000
8
60.6%
Seller's
-
-
-
-
-
Median prices represent properties priced above respective city benchmark prices. Prices shown for Canadian cites are shown in Canadian Dollars.
– LUXURY MONTHLY MARKET REVIEW – SINGLE FAMILY HOMES
ATTACHED HOMES
State Market Name
List Price
Sold Price
DOM
Ratio
Market
List Price
Sold Price
DOM
Ratio
Market
CT
Coastal Connecticut
$2,190,000
$1,705,000
23
30.4%
Seller's
$759,000
$691,750
29
36.2%
Seller's
DC
Washington D.C.
$3,499,900
$2,732,500
27
14.7%
Balanced
$1,849,500
$1,550,000
10
19.9%
Balanced
DE
Sussex County
$1,600,000
$1,700,000
14
23.1%
Seller's
$949,450
$1,000,000
25
34.0%
Seller's
FL
Bay County
-
-
-
-
-
-
-
-
-
-
FL
Boca Raton/Delray Beach
$2,999,500
$2,200,000
56
21.9%
Seller's
$1,049,000
$730,000
23
20.4%
Balanced
FL
Brevard County
$883,000
$820,000
40
26.7%
Seller's
$797,000
$677,500
105
10.0%
Buyer's
FL
Broward County
$1,825,000
$1,501,000
40
16.9%
Balanced
$690,000
$620,000
64
8.2%
Buyer's
FL
Charlotte County
$1,044,000
$925,000
93
10.7%
Buyer's
-
-
-
-
-
FL
Coastal Pinellas County
$2,475,000
$1,900,000
61
16.4%
Balanced
$1,275,000
$1,159,500
90
8.1%
Buyer's
FL
Ft. Lauderdale
$4,990,000
$3,424,250
70
6.5%
Buyer's
$2,795,000
$2,300,000
135
3.9%
Buyer's
FL
Jacksonville
$845,000
$832,500
24
25.6%
Seller's
$625,000
$547,410
47
25.4%
Seller's
FL
Jacksonville Beaches
$1,399,500
$1,298,906
33
23.6%
Seller's
$1,000,000
$1,387,500
35
10.5%
Buyer's
FL
Lee County
$1,495,000
$1,280,000
63
10.3%
Buyer's
$870,000
$797,500
78
7.0%
Buyer's
FL
Marco Island
$3,100,000
$2,600,000
47
11.5%
Buyer's
$1,650,000
$1,325,000
52
17.5%
Balanced
FL
Miami
$1,900,000
$1,682,500
57
15.0%
Balanced
$1,499,000
$1,494,500
91
7.4%
Buyer's
FL
Naples
$4,900,000
$4,097,500
80
9.4%
Buyer's
$2,400,000
$1,800,000
83
10.8%
Buyer's
FL
Orlando
$1,299,000
$1,170,000
45
14.7%
Balanced
$589,900
$560,000
22
10.8%
Buyer's
FL
Palm Beach Towns
$5,875,000
$3,375,000
54
16.1%
Balanced
$2,350,000
$1,955,000
128
7.6%
Buyer's
FL
Sarasota & Beaches
$2,824,750
$2,350,000
141
14.1%
Balanced
$1,850,000
$2,300,000
90
16.7%
Balanced
FL
South Pinellas County
$1,450,000
$1,379,000
69
16.0%
Balanced
$1,195,000
$1,050,000
106
11.6%
Buyer's
FL
South Walton
-
-
-
-
-
-
-
-
-
-
FL
Tampa
$795,000
$725,000
44
21.4%
Seller's
$839,500
$692,500
67
16.0%
Balanced
GA
Atlanta
$1,505,000
$1,280,000
18
20.2%
Balanced
$697,711
$629,000
32
12.0%
Balanced
GA
Duluth
$1,249,000
$1,330,000
43
13.5%
Balanced
-
-
-
-
-
HI
Island of Hawaii
$1,899,000
$1,547,500
27
10.2%
Buyer's
$1,425,000
$1,200,000
80
9.4%
Buyer's
HI
Kauai
$2,972,500
$1,915,000
77
7.2%
Buyer's
$1,377,000
$1,450,000
52
1.3%
Buyer's
HI
Maui
$2,900,000
$2,950,000
112
6.9%
Buyer's
$1,897,000
$1,960,000
188
6.7%
Buyer's
HI
Oahu
$2,900,000
$2,199,000
21
15.8%
Balanced
$1,170,000
$980,000
43
11.2%
Buyer's
IA
Greater Des Moines
$662,675
$626,250
33
19.8%
Balanced
-
-
-
-
-
ID
Ada County
$824,880
$785,000
12
35.9%
Seller's
$625,000
$649,500
9
22.2%
Seller's
ID
Northern Idaho
$1,299,000
$1,037,500
74
15.5%
Balanced
-
-
-
-
-
IL
Chicago
$1,775,000
$1,351,750
12
58.7%
Seller's
$1,169,000
$992,500
12
45.5%
Seller's
IL
DuPage County
$1,199,000
$969,500
18
41.3%
Seller's
$749,990
$795,056
13
44.4%
Seller's
IL
Lake County
$1,250,000
$947,495
11
42.5%
Seller's
-
-
-
-
-
IL
Will County
$675,000
$625,000
16
36.8%
Seller's
-
-
-
-
-
IN
Boone County
$1,499,900
$910,000
7
35.4%
Seller's
-
-
-
-
-
IN
Hamilton County
$824,825
$835,500
7
49.5%
Seller's
-
-
-
-
-
KY
Lexington
$1,050,000
$962,500
32
29.4%
Seller's
-
-
-
-
-
Median prices represent properties priced above respective city benchmark prices. Prices shown for Canadian cites are shown in Canadian Dollars.
– LUXURY MONTHLY MARKET REVIEW – SINGLE FAMILY HOMES
ATTACHED HOMES
State Market Name
List Price
Sold Price
DOM
Ratio
Market
List Price
Sold Price
DOM
Ratio
Market
LA
Baton Rouge
$979,000
$847,500
42
11.0%
Buyer's
-
-
-
-
-
LA
Lafayette County
$799,950
$615,000
67
13.8%
Balanced
-
-
-
-
-
LA
New Orleans
$1,050,000
$1,000,000
54
16.4%
Balanced
$715,000
$732,500
85
8.6%
Buyer's
MA
Cape Cod
$2,300,000
$1,889,500
43
25.9%
Seller's
$1,150,000
$1,550,000
22
27.3%
Seller's
MA
Greater Boston
$3,472,500
$2,975,000
51
15.9%
Balanced
$2,395,000
$2,305,000
47
11.6%
Buyer's
MA
South Shore
$1,650,000
$1,365,000
26
40.1%
Seller's
$900,000
$964,906
35
46.5%
Seller's
MD
Anne Arundel County
$1,195,000
$932,500
13
38.3%
Seller's
$596,000
$555,000
10
43.0%
Seller's
MD
Baltimore City
$799,000
$695,000
20
41.7%
Seller's
$645,000
$560,000
18
19.4%
Balanced
MD
Baltimore County
$974,247
$885,000
8
28.5%
Seller's
$614,950
$587,500
23
30.3%
Seller's
MD
Frederick County
$925,000
$937,500
22
27.4%
Seller's
-
-
-
-
-
MD
Howard County
$1,259,999
$1,100,000
13
54.1%
Seller's
$625,000
$615,000
11
48.6%
Seller's
MD
Montgomery County
$1,850,000
$1,610,000
9
21.4%
Seller's
$817,250
$784,000
14
23.4%
Seller's
MD
Prince George's County
$900,000
$850,410
30
14.7%
Balanced
$569,990
$569,965
4
23.4%
Seller's
MD
Talbot County
$2,475,000
$1,672,500
63
28.2%
Seller's
-
-
-
-
-
MD
Worcester County
$967,400
$1,050,000
22
13.2%
Balanced
$699,900
$639,000
26
21.0%
Balanced
MI
Grand Traverse County
$1,597,500
$1,025,000
87
15.5%
Balanced
-
-
-
-
-
MI
Livingston County
$720,000
$695,000
9
40.5%
Seller's
-
-
-
-
-
MI
Monroe County
$665,000
$585,000
31
31.9%
Seller's
-
-
-
-
-
MI
Oakland County
$799,000
$672,500
13
31.5%
Seller's
$625,000
$631,000
12
18.3%
Balanced
MI
Washtenaw County
$854,900
$700,000
36
23.7%
Seller's
$710,670
$670,000
85
12.3%
Balanced
MI
Wayne County
$670,150
$663,750
12
41.3%
Seller's
$649,000
$600,000
30
29.3%
Seller's
MN
Olmsted County
$877,900
$790,000
27
16.6%
Balanced
-
-
-
-
-
MN
Twin Cities
$1,250,000
$1,096,000
20
21.1%
Seller's
-
-
-
-
-
NC
Asheville
$1,000,000
$932,750
45
11.4%
Buyer's
$775,000
$637,500
37
12.6%
Balanced
NC
Charlotte
$1,125,000
$1,021,000
23
28.8%
Seller's
$650,000
$675,000
26
18.1%
Balanced
NC
Lake Norman
$1,189,950
$1,071,305
42
23.4%
Seller's
$599,450
$676,500
10
28.6%
Seller's
NC
New Hanover County
$1,522,500
$1,847,000
32
14.7%
Balanced
$1,075,000
$1,114,500
40
15.4%
Balanced
NC
Pitt County
$614,900
$616,525
13
28.6%
Seller's
-
-
-
-
-
NC
Raleigh-Durham
$1,175,000
$956,500
7
23.1%
Seller's
-
-
-
-
-
NH
Rockingham County
$1,570,000
$1,275,000
10
27.7%
Seller's
$925,000
$960,000
13
28.4%
Seller's
NJ
Bergen County
$2,396,975
$1,850,000
19
29.6%
Seller's
$1,299,999
$1,100,000
21
31.4%
Seller's
NJ
Morris County
$1,649,500
$1,372,500
20
38.5%
Seller's
$955,300
$982,000
14
37.5%
Seller's
NJ
Ocean County
$949,000
$882,500
22
26.3%
Seller's
$839,448
$722,500
29
16.4%
Balanced
NJ
Somerset County
$1,599,999
$1,310,000
23
30.1%
Seller's
$849,900
$785,000
24
20.0%
Balanced
NV
Henderson
$2,299,000
$1,235,000
54
14.2%
Balanced
-
-
-
-
-
NV
Lake Tahoe
$3,995,000
$2,862,500
56
23.2%
Seller's
$1,099,500
$1,275,000
94
53.8%
Seller's
NV
Las Vegas
$1,750,000
$1,387,500
38
10.6%
Buyer's
-
-
-
-
-
NV
Reno
$1,800,000
$1,725,000
32
23.8%
Seller's
-
-
-
-
-
Median prices represent properties priced above respective city benchmark prices. Prices shown for Canadian cites are shown in Canadian Dollars.
– LUXURY MONTHLY MARKET REVIEW – SINGLE FAMILY HOMES
ATTACHED HOMES
State Market Name
List Price
Sold Price
DOM
Ratio
Market
List Price
Sold Price
DOM
Ratio
Market
OH
Cincinnati
$796,673
$747,750
6
31.8%
Seller's
-
-
-
-
-
OH
Cleveland Suburbs
$800,000
$765,000
12
53.2%
Seller's
-
-
-
-
-
OH
Columbus
$799,900
$750,000
12
30.4%
Seller's
$661,221
$694,950
14
27.7%
Seller's
ON
GTA - Durham
$1,799,000
$1,600,000
15
6.5%
Buyer's
$829,900
-
-
0.0%
Buyer's
ON
GTA - York
$2,349,450
$1,790,000
28
10.4%
Buyer's
$779,950
$740,000
48
12.7%
Balanced
ON
Mississauga
$2,899,860
$2,700,000
21
4.1%
Buyer's
$999,000
$1,065,000
51
11.3%
Buyer's
ON
Toronto
$3,880,000
$3,195,000
14
10.3%
Buyer's
$1,249,000
$1,177,500
24
10.9%
Buyer's
ON
Waterloo Region
$1,499,000
$1,310,000
19
14.7%
Balanced
$784,000
$762,500
24
14.3%
Balanced
OR
Portland
$1,295,000
$1,150,000
30
19.8%
Balanced
$679,000
$680,000
52
11.8%
Buyer's
PA
Philadelphia
$849,000
$782,500
12
14.5%
Balanced
$752,500
$710,000
28
17.9%
Balanced
PA
Pittsburgh
$1,100,000
$957,500
28
26.9%
Seller's
$762,500
$687,500
26
16.4%
Balanced
SC
Charleston
$1,750,000
$1,460,000
53
29.0%
Seller's
$1,395,000
$1,208,500
57
22.4%
Seller's
TN
Greater Chattanooga
$974,950
$945,250
32
16.1%
Balanced
-
-
-
-
-
TN
Nashville
$1,799,999
$1,500,000
22
19.2%
Balanced
$735,000
$672,735
44
7.7%
Buyer's
TX
Austin
$2,280,000
$1,865,000
49
17.7%
Balanced
$1,222,000
$1,218,000
42
9.1%
Buyer's
TX
Collin County
$749,000
$715,000
50
15.1%
Balanced
-
-
-
-
-
TX
Dallas
$1,475,000
$1,190,000
24
21.0%
Balanced
$747,450
$778,500
27
11.4%
Buyer's
TX
Denton County
$799,900
$775,000
46
15.8%
Balanced
-
-
-
-
-
TX
El Paso
$639,500
$734,000
37
16.2%
Balanced
-
-
-
-
-
TX
Fort Worth
$899,900
$849,000
45
21.7%
Seller's
-
-
-
-
-
TX
Greater Tyler
$684,500
$645,900
51
15.7%
Balanced
-
-
-
-
-
TX
Houston
$975,000
$905,900
33
17.8%
Balanced
$645,000
$730,000
35
13.7%
Balanced
TX
Lubbock
$700,000
$615,750
57
23.1%
Seller's
-
-
-
-
-
TX
San Antonio
$810,000
$755,500
63
11.9%
Buyer's
$788,950
$950,000
223
5.1%
Buyer's
TX
Tarrant County
$894,500
$847,000
46
23.8%
Seller's
-
-
-
-
-
TX
The Woodlands & Spring
$807,500
$775,000
49
17.8%
Balanced
-
-
-
-
-
UT
Park City
$4,975,000
$4,300,000
48
21.9%
Seller's
$2,825,000
$1,562,500
27
7.8%
Buyer's
UT
Washington County
-
-
-
-
-
-
-
-
-
-
VA
Arlington & Alexandria
$2,252,450
$1,900,000
6
24.2%
Seller's
$999,999
$944,952
10
32.7%
Seller's
VA
Fairfax County
$2,137,000
$1,554,360
9
39.4%
Seller's
$739,000
$710,000
14
43.2%
Seller's
VA
McLean & Vienna
$2,999,999
$2,162,500
7
37.4%
Seller's
$1,170,000
$1,085,000
6
28.6%
Seller's
VA
Richmond
$839,000
$814,839
12
29.2%
Seller's
$589,900
$614,750
16
21.1%
Seller's
VA
Smith Mountain Lake
$1,392,500
$1,544,783
45
15.0%
Balanced
-
-
-
-
-
VA
Virginia Beach
-
-
-
-
-
-
-
-
-
-
WA
King County
$1,899,894
$1,700,000
14
23.7%
Seller's
$1,192,300
$1,180,000
21
14.5%
Balanced
WA
Seattle
$1,995,000
$1,700,000
6
26.5%
Seller's
$1,339,500
$1,225,000
25
13.4%
Balanced
WA
Spokane
$1,100,000
$995,000
50
12.8%
Balanced
-
-
-
-
-
WA
Vancouver
$1,399,000
$1,245,000
44
11.4%
Buyer's
$805,995
$770,500
9
24.5%
Seller's
Median prices represent properties priced above respective city benchmark prices. Prices shown for Canadian cites are shown in Canadian Dollars.
– LUXURY REPORT EXPLAINED – The Institute for Luxury Home Marketing has analyzed a number of metrics — including sales prices, sales volumes, number of sales, sales-price-to-list-price ratios, days on market and price-per-squarefoot – to provide you a comprehensive North American Luxury Market report. Additionally, we have further examined all of the individual luxury markets to provide both an overview and an in-depth analysis - including, where data is sufficient, a breakdown by luxury singlefamily homes and luxury attached homes. It is our intention to include additional luxury markets on a continual basis. If your market is not featured, please contact us so we can implement the necessary qualification process. More in-depth reports on the luxury communities in your market are available as well. Looking through this report, you will notice three distinct market statuses, Buyer's Market, Seller's Market, and Balanced Market. A Buyer's Market indicates that buyers have greater control over the price point. This market type is demonstrated by a substantial number of homes on the market and few sales, suggesting demand for residential properties is slow for that market and/or price point. By contrast, a Seller's Market gives sellers greater control over the price point. Typically, this means there are few homes on the market and a generous demand, causing competition between buyers who ultimately drive sales prices higher. A Balanced Market indicates that neither the buyers nor the sellers control the price point at which that property will sell and that there is neither a glut nor a lack of inventory. Typically, this type of market sees a stabilization of both the list and sold price, the length of time the property is on the market as well as the expectancy amongst homeowners in their respective communities – so long as their home is priced in accordance with the current market value.
REPORT GLOSSARY REMAINING INVENTORY: The total number of homes available at the close of a month. DAYS ON MARKET: Measures the number of days a home is available on the market before a purchase offer is accepted. LUXURY BENCHMARK PRICE: The price point that marks the transition from traditional homes to luxury homes. NEW LISTINGS: The number of homes that entered the market during the current month. PRICE PER SQUARE FOOT: Measures the dollar amount of the home's price for an individual square foot. SALES RATIO: Sales Ratio defines market speed and determines whether the market currently favors buyers or sellers. A Buyer's Market has a Sales Ratio of less than 12%; a Balanced Market has a ratio of 12% up to 21%; a Seller's Market has a ratio of 21% or higher. A Sales Ratio greater than 100% indicates the number of sold listings exceeds the number of listings available at the end of the month. SP/LP RATIO: The Sales Price/List Price Ratio compares the value of the sold price to the value of the list price.
LUXURY RESIDENTIAL MARKETS
T
he Luxury Market Report is your guide to luxury real estate market data and trends for North America. Produced monthly by The Institute for Luxury Home Marketing, this report provides an in-depth look at the
top residential markets across the United States and Canada. Within the individual markets, you will find established luxury benchmark prices and detailed survey of luxury active and sold properties designed to showcase current market status and recent trends. The national report illustrates a compilation of the top North American markets to review overall standards and trends.
Copyright © 2026 Institute for Luxury Home Marketing | www.luxuryhomemarketing.com | 214.485.3000 The Luxury Market Report is a monthly analysis provided by The Institute for Luxury Home Marketing. Luxury benchmark prices are determined by The Institute. This active and sold data has been provided by REAL Marketing, who has compiled the data through various sources, including local MLS boards, local tax records and Realtor.com. Data is deemed reliable to the best of our knowledge, but is not guaranteed.
OCTOBER
2026
JACKSONVILLE BEACHES FLORI D A FERNANDINA BEACH TO ST AUGUSTINE BEACH
JACKSONVILLE BEACHES
SINGLE - FAMILY HOMES Luxury Benchmark Price 1: $845,000
LUXURY INVENTORY VS. SALES | SEPTEMBER 2026 Total Inventory: 398
Total Sales: 94
Total Sales Ratio2 : 24%
Inventory $4,300,000+
$2,800,000 - $3,299,999
6
3
$3,300,000 - $3,799,999
13
1
21
0
$2,400,000 - $2,799,999
24
4
$2,100,000 - $2,399,999
30
3 22
11
$1,300,000 - $1,399,999
$1,100,000 - $1,199,999
29
7
$1,400,000 - $1,599,999
$1,200,000 - $1,299,999
23
6
$1,800,000 - $2,099,999 $1,600,000 - $1,799,999
14
5
27
4
39
5
$1,000,000 - $1,099,999
13
$900,000 - $999,999 $845,000 - $899,999
1
Sales 30
7
$3,800,000 - $4,299,999
Seller's Market
15 40
14
65
11
Square Feet3
Price
Beds
Baths
Sold
Inventory
Sales Ratio
-Range-
-Median Sold-
-Median Sold-
-Median Sold-
-Total-
-Total-
-Sold/Inventory-
0 - 1,999
$925,000
3
3
7
36
19%
2,000 - 2,999
$1,000,000
4
3
34
122
28%
3,000 - 3,999
$1,365,000
4
4
36
134
27%
4,000 - 4,999
$2,202,209
5
5
10
70
14%
5,000 - 5,999
$3,347,500
6
6
4
23
17%
6,000+
$11,681,053
6
7
3
12
25%
The luxury threshold price is set by The Institute for Luxury Home Marketing. 2Sales Ratio defines market speed and market type: Buyer's < 12%; Balanced >= 12 to < 21%; Seller's >= 21%. If >100% MLS® data reported previous month’s sales exceeded current inventory.
JACKSONVILLE BEACHES
SINGLE - FAMILY HOMES Luxury Benchmark Price 1: $845,000
13 - MONTH LUXURY MARKET TREND 4 Median Sales Price
$1,208,675
482
$1,340,000
$1,190,000
459
427
$1,225,000
88
60
Sep-25
Oct-25
Nov-25
115
Dec-25
$1,350,000
$1,350,000
421
384
362
347
100
$1,350,000
Inventory
Solds
$1,275,000
$1,228,557
$1,291,000
436
462
457
$1,416,500
418
63
76
99
102
114
131
Jan-26
Feb-26
Mar-26
Apr-26
May-26
Jun-26
$1,298,906
$1,150,000
409
107
Jul-26
398
99
94
Aug-26
Sep-26
MEDIAN DATA REVIEW | SEPTEMBER TOTAL INVENTORY
TOTAL SOLDS
Sept. 2025
Sept. 2026
Sept. 2025
Sept. 2026
482
398
100
94
VARIANCE: -
17%
SALE PRICE PER SQFT. Sept. 2025
SALES PRICE Sept. 2025
Sept. 2026
1.21m
$
$
6
VARIANCE: - %
1.30m
VARIANCE:
SALE TO LIST PRICE RATIO
7%
DAYS ON MARKET
Sept. 2026
Sept. 2025
Sept. 2026
Sept. 2025
Sept. 2026
426
96.40%
97.38%
44
33
406
$
$
VARIANCE:
5%
VARIANCE:
1%
VARIANCE: -
25%
JACKSONVILLE BEACHES MARKET SUMMARY | SEPTEMBER 2026 • The single-family luxury market is a Seller's Market with a 24% Sales Ratio. • Homes sold for a median of 97.38% of list price in September 2026. • The most active price band is $1,000,000-$1,099,999, where the sales ratio is 87%. • The median luxury sales price for single-family homes is $1,298,906. • The median days on market for September 2026 was 33 days, down from 44 in September 2025.
Square foot table does not account for listings and solds where square foot data is not disclosed. 4 Data reported includes Active and Sold properties and does not include Pending properties.
3
JACKSONVILLE BEACHES
ATTACHED HOMES Luxury Benchmark Price 1: $742,500
LUXURY INVENTORY VS. SALES | SEPTEMBER 2026 Total Inventory: 57
Total Sales: 6
Total Sales Ratio2 : 11%
Inventory $1,840,000+
$1,540,000 - $1,639,999
$1,440,000 - $1,539,999 $1,360,000 - $1,439,999 $1,280,000 - $1,359,999 $1,220,000 - $1,279,999 $1,160,000 - $1,219,999
$980,000 - $1,039,999 $920,000 - $979,999 $860,000 - $919,999
$800,000 - $859,999 $742,500 - $799,999
1
3
1
3
0
3
0 0 0
4
0
0 0 0
$1,100,000 - $1,159,999 $1,040,000 - $1,099,999
Sales 6
2
$1,640,000 - $1,839,999
Buyer's Market
1 4
1
4
0 3
0
3
0
6
0 4
1
13
1
Square Feet3
Price
Beds
Baths
Sold
Inventory
Sales Ratio
-Range-
-Median Sold-
-Median Sold-
-Median Sold-
-Total-
-Total-
-Sold/Inventory-
0 - 1,499
NA
NA
NA
0
17
0%
1,500 - 1,999
$1,100,000
3
3
3
21
14%
2,000 - 2,499
$1,242,500
3
3
2
10
20%
2,500 - 2,999
$1,900,000
4
4
1
7
14%
3,000 - 3,499
NA
NA
NA
0
1
0%
3,500+
NA
NA
NA
0
0
NA
The luxury threshold price is set by The Institute for Luxury Home Marketing. 2Sales Ratio defines market speed and market type: Buyer's < 12%; Balanced >= 12 to < 21%; Seller's >= 21%. If >100% MLS® data reported previous month’s sales exceeded current inventory.
JACKSONVILLE BEACHES
ATTACHED HOMES Luxury Benchmark Price 1: $742,500
13 - MONTH LUXURY MARKET TREND 4 Median Sales Price
Inventory
Solds $1,760,000
$1,275,000
$908,201 73
$1,145,000
$1,071,250
67
65
61
59
8
7
10
9
10
Sep-25
Oct-25
Nov-25
Dec-25
Jan-26
Feb-26
64
63
58
8
$1,485,000
$1,430,000
$1,387,500
56
52
57
$1,010,000
$875,000 66
$1,450,000
$1,437,500 $1,250,000
10
7
9
7
5
6
Apr-26
May-26
Jun-26
Jul-26
Aug-26
Sep-26
4 Mar-26
51
MEDIAN DATA REVIEW | SEPTEMBER TOTAL INVENTORY
TOTAL SOLDS
Sept. 2025
Sept. 2026
Sept. 2025
Sept. 2026
73
57
8
6
VARIANCE: -
22%
SALE PRICE PER SQFT. Sept. 2025
VARIANCE: -
25%
SALE TO LIST PRICE RATIO
SALES PRICE Sept. 2025
908k
$
Sept. 2026
1.39m
$
VARIANCE:
53%
DAYS ON MARKET
Sept. 2026
Sept. 2025
Sept. 2026
Sept. 2025
Sept. 2026
672
96.11%
96.61%
79
35
565
$
VARIANCE:
19%
$
VARIANCE:
1%
VARIANCE: -
56%
JACKSONVILLE BEACHES MARKET SUMMARY | SEPTEMBER 2026 • The attached luxury market is a Buyer's Market with a 11% Sales Ratio. • Homes sold for a median of 96.61% of list price in September 2026. • The most active price band is $1,840,000+, where the sales ratio is 33%. • The median luxury sales price for attached homes is $1,387,500. • The median days on market for September 2026 was 35 days, down from 79 in September 2025.
Square foot table does not account for listings and solds where square foot data is not disclosed. 4 Data reported includes Active and Sold properties and does not include Pending properties.
3
Thank you for taking time to view this report. For more information about this report and the services I can offer you and your luxury property, please give me a call at 904.509.8622.
- Anita Millar
ANITA MILLAR
904.509.8622 | anita@royalhighlanderrealestate.com | www.homesnap.com/AnitaMillar-2