The Community Strategic Plan can only be achieved with sufficient resources. Council’s Resourcing Strategy supports the Community Strategic Plan, Delivery Program and Operational Plan by detailing how Council can help achieve the
community’s goals in terms of time, money, assets, and people over the long term. The Resourcing Strategy is reviewed every 4 years. It incorporates long term financial planning, workforce management planning and asset management planning.
Overview of the sub-strategies
The Resourcing Strategy contains 3 sub-strategies.
10 year Long Term Financial Plan
Provides a decision-making tool that allows various assumptions and sensitivity analysis to be carried out, which will indicate the ability of Council to deliver cost-effective services to our community into the future, within a framework of financial sustainability.
4 year Workforce Strategy
Provides a strategic and integrated approach to enable Council to better plan for and develop the workforce capabilities needed for the future and to achieve the medium to long term strategies outlined in the CSP.
This strategy sets out the level of resources, capabilities and skills required by Council’s workforce needed to achieve Council’s actions.
10 year Asset Management Plan
Defines the requirements for our assets to achieve the objectives of our Asset Management Policy and Asset Management Strategy. It contains information regarding the state of our current assets, how assets align to the services Council provides, life cycle management principles and how they are applied, outcomes of life cycle modelling and required forward funding allocations, asset category risk analysis outcomes.
These documents are based on our current levels of service
At The Hills Shire Council, we’re dedicated to best practice financial management and long-term financial sustainability to achieve intergenerational equity.
Council has developed this plan on behalf of the Hills Shire community and would like to express gratitude to the residents, community groups, businesses, and government representatives who contributed their insights. This Resourcing Strategy has been prepared in accordance with Section 403 of the Local Government Act 1993.
Integrated planning and reporting framework
The Resourcing Strategy outlines the resource considerations for the activities and actions specified in the Delivery Program and Operations Plan. Financial planning supports the delivery and realisation of Council’s vision, as set out in the Community Strategic Plan, while ensuring Council’s continued financial sustainability.
The diagram below shows the relationship between Council’s plans and resourcing strategies.
TOWARDS HILLS
LONG TERM FINANCIAL PLAN 2050
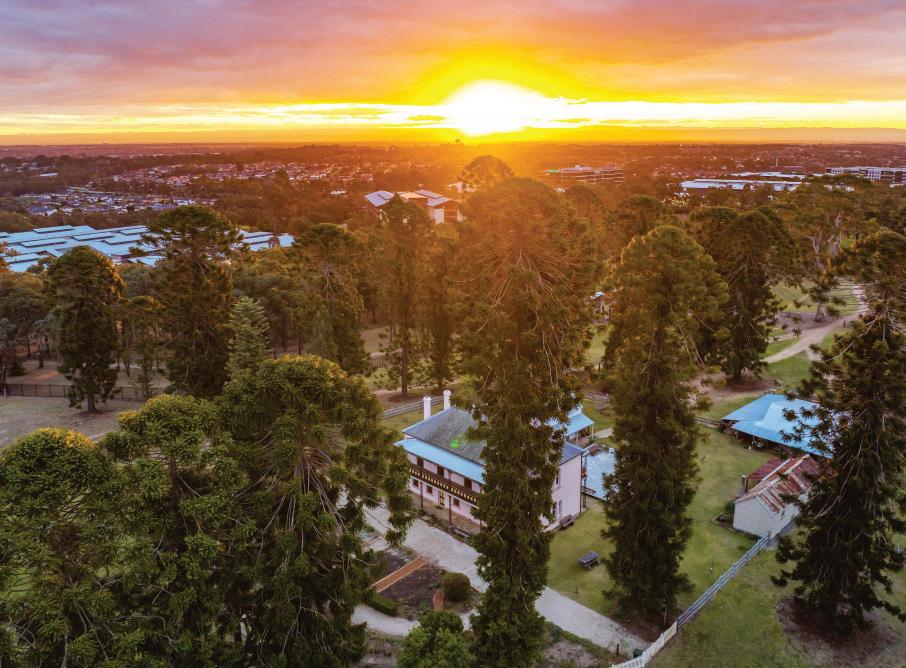
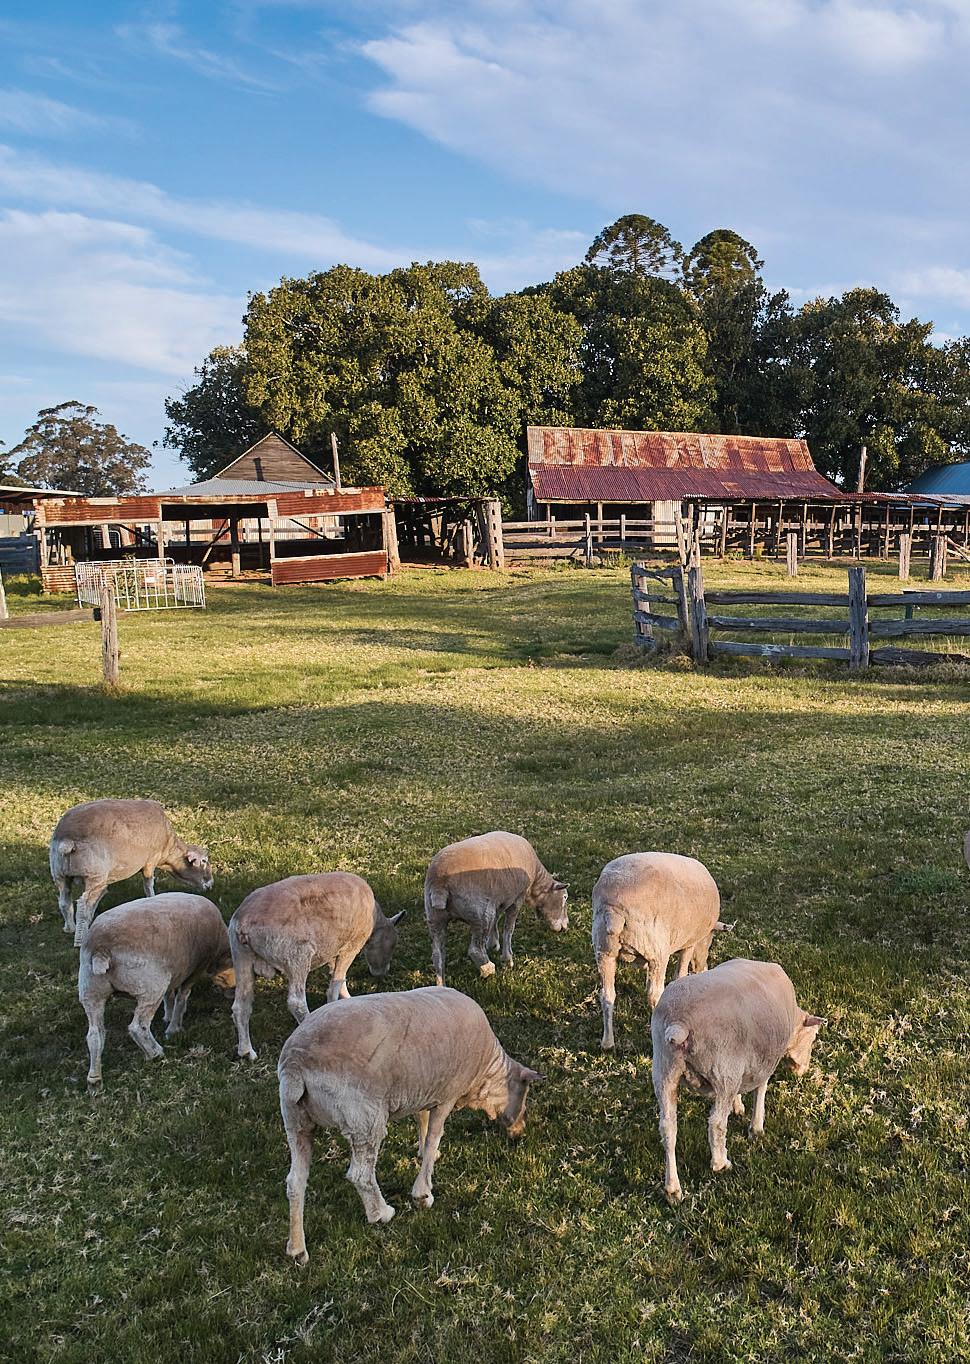
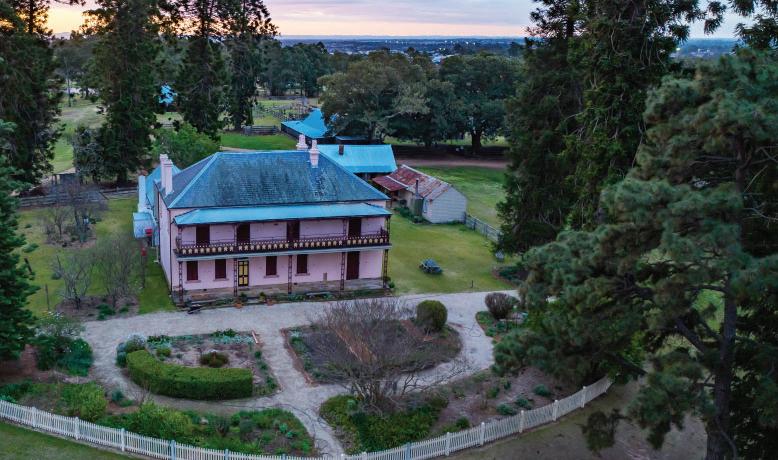
Bella Vista Farm Park
Introduction
Most communities share similar aspirations: to be a great place to live, work and play, with the provision of essential infrastructure and services and job opportunities.
Purpose of the Long Term Financial Plan
The Integrated Planning and Reporting (IP&R) framework recognises that most communities share similar aspirations: to be a great place to live, work and play, with the provision of essential infrastructure and services and job opportunities. This IP&R framework allows Council to draw their various plans together, understand how they interact and maximise their efforts by planning holistically for the future.
The Long Term Financial Plan (LTFP) is an integral part of Council’s Resourcing Strategy. It supports the achievement of Council’s goals as identified in the Community Strategic Plan, Delivery Program and Operational Plan. This plan sets out what resources will be needed, ie time, people, assets and money to deliver essential services and infrastructure to the community.
This LTFP works with the Workforce Management Strategy and Asset Management Strategy. Together these plans represent Council’s resource response to the Community Strategic Plan, Towards Hills 2050.
What is the Long Term Financial Plan?
Every Council in NSW must prepare and adopt a 10 year Long Term Financial Plan. This plan serves as a tool for informing decision making and forecasting Council’s future financial position. It is not intended to be rigid; instead, it acts as a guide for future actions. The modelling involved in this plan aims to help Council to mitigate any future financial risks and ensure prudent long term financial planning. It also allows Council to identify financial issues at an early stage and assess their long term impacts.
The key elements of an LTFP include:
• projected income and expenditure, balance sheet and cash flow statement
• the planning assumptions used to develop the plan
• sensitivity analysis highlighting factors/ assumptions most likely to affect the plan
• financial modelling for different scenarios
• methods of monitoring financial performance.
The LTFP is continually monitored and updated annually as part of Council’s commitment to delivering the aspirations outlined in the Towards Hills 2050 Community Strategic Plan. This plan is publicly exhibited for at least 28 days and any submissions received are considered before it is adopted by Council.
Principles of sound financial management
Under the Local Government Act 1993 Section 8B, councils must apply the following principles of sound financial management:
Responsible and sustainable spending
Councils should ensure their spending is responsible and sustainable, aligning general revenue and expenses.
Investment in infrastructure
Councils should invest in infrastructure that is responsible and sustainable, benefiting the local community.
Effective financial and asset management
Councils must have effective financial and asset management practices. This includes sound policies and processes for performance management and reporting, asset maintenance and enhancement, funding decisions and risk management.
Intergenerational equity
Councils should consider intergenerational equity in their policy decisions. This involves evaluating the financial impact of decisions on future generations and ensuring the current generation bears the costs of services.
Financial charter policy
To support sound financial management principles, this Council has adopted a Financial Charter Policy. The purpose of this charter is to outline the key financial objectives that align with the legislative requirements prescribed in Section 8B of the Local Government Act 1993. These objectives will ensure best-practice financial management, promote long-term financial sustainability and guide the development of Council’s Budget and Long Term Financial Plan.
1. Operational surplus
It is a high priority to budget for an operational surplus before capital grants and contributions. This ensures that total operating revenue for each year is sufficient to cover:
• total operating expenses (including depreciation)
• the provision in that year for repayment of principal on loans
• the proposed provisions in that year for transfers to reserves for future expenditure.
Council will maintain a level of available equity to manage unexpected contingencies, such as natural disasters and unanticipated legal challenges.
2. Capital expenditure
• priority will be given to capital expenditure on asset renewal over new capital projects to maintain existing infrastructure at expected service levels
• capital expenditure project proposals must include lifecycle cost evaluations that encompass construction, maintenance, operations, and transfers to reserves for replacement
• any new capital expenditure projects should identify the source of funding and align project delivery with the timing of fund receipts
• borrowing for new capital projects will only be considered if a continuous income source can be identified to service the debt.
3. New or increased services
When new or increased service levels are required, Council will seek new and additional revenue sources beyond the current revenue structures. If no new revenue sources are available, reductions or cuts to existing programs and services will be necessary.
4. Cost recovery
Council aims to recover the costs of providing its services whenever possible to ensure continued service provision to the community while maintaining financial sustainability.
• for services with a clear private benefit (private goods), full cost recovery will be pursued. If the activity is commercial, the goal will be greater than full cost recovery
• for services that are public goods providing broad community benefits, zero cost recovery will be pursued
• for services that offer both private and broad community benefits (shared goods), the percentage of cost recovery will take community service obligations into account.
5. Property development
When income is generated from property development activities, 50% of that income will be set aside in the land development reserve for future development activities.
Who are we?
The Hills has a population of around 223,000 and 78,894 rateable properties. Council is responsible for providing a range of services, both regulated and discretionary to meet the community’s expectations and responsibly manage more than $6.2 billion worth of community assets (including investment properties).
When preparing the Long-Term Financial Plan, many factors are taken into consideration and a vast array of research and statistics are analysed to forecast the likely revenue that will be available to meet the community’s long-term objectives.
Suburbs
386KM2 Area 27
5.58 Persons per hectare - average density (2024)
data source: forecast.id
78,894 Rateable properties
76,966 Dwellings 2026
223,903 Population 2026
50.7% females 49.3% males (2021)
326,725 Population by 2046
$6.2 billion in community assets (including investment properties)
Economic profile
Level of local economic growth
The estimated gross regional product (GRP) of The Hills Shire for 2023-2024 is $15.99 billion, accounting for 2.03% of New South Wales’ gross state product (GSP).
This economic profile of The Hills Shire provides insights into the area’s role in the broader economy, identifies opportunities for economic development, and highlights the region’s strengths. The information presented is sourced from the Australian Bureau of Statistics and leading economic modellers in Australia (NEIR). The most recent data from each series can be found at Economy.id.
Population growth
The Hills Shire LGA population growth is detailed right. Should the population grow faster than this rate, both service levels and rating income will be impacted.
These increases have been taken into consideration when forecasting developer contribution income and expenditure, and any change in population growth will affect the planned capital expenditure provisions.
122,531 people living in The Hills Shire in 2024 were employed
Forecast population year ending 30 June
45.92% change 2026-46
Source: Population and household forecasts, 2021 to 2046, prepared by .id (informed decisions), November 2024
$millions year ending 30 June
Resident workers individual income, 2021 all industries - resident
The socio-economic indexes for areas
The Index of Relative Socio-Economic Disadvantage, produced by the Australian Bureau of Statistics (ABS), is designed so that relatively disadvantaged areas (such as those with many lowincome earners) have lower index values. This index is derived from various attributes, including low income, low educational attainment, high unemployment, and jobs in relatively unskilled occupations. It reflects overall disadvantage rather than measuring specific aspects, such as Indigenous status or marital separation/divorce.
A higher index value on the IRSED indicates that an area is less disadvantaged compared to other regions. For instance, an area with an index value of 1200 is considered less disadvantaged than one with an index of 900 (Australian Bureau of Statistics, 2006, Socio-Economic Indexes for Areas (SEIFA 2006), cat. no. 2033.0.55.001).
The chart on the following page illustrates the distribution of the SEIFA in The Hills Shire Council areas. In 2021, the average index for all areas in The Hills was 1,098. This compares to 967.3 for the Greater Western Sydney Region, 991 for the Penrith City Council area, 1,029.5 for the City of Parramatta, 987.3 for Blacktown City Council and 1,082.2 for Hornsby Shire.
Source: Australian Bureau of Statistics, Census of Population and Housing 2021
Challenges
Council’s Community Strategic Plan, Towards Hills 2050, highlights the challenges and opportunities facing our local government area. Some of the significant challenges are listed below.
Population growth
One of the key challenges is population growth. This growth will significantly impact Council’s future finances. The Hills is set to experience a period of unprecedented growth, which will lead to a rising demand for infrastructure and services while putting a strain on our existing resources. This situation also presents an opportunity for Council. To effectively accommodate this growth, we must plan for future local transport, services and places, as well as shape development that is sustainable, and aligns with the interests of the community. Council will continue to collaborate with the NSW government to ensure that investments in new schools, upgrades to major roads, and improvements to public transport infrastructure benefit our local area.
Over the coming decades, the overall composition of our community will also change. This shift in demographics will require adjustments in the types of services to be provided by Council. A balanced approach will be essential in managing these evolving priorities. Additionally, we will need to manage community expectations, particularly for residents living in established areas compared to those in new development zones.
Developer contributions funding
The Environmental Planning & Assessment Act allows councils to prepare Developer Contribution Plans to levy developers to provide public amenities such as open space, roads, bridges, footpaths, stormwater and more. Council currently has 13 contribution plans in place. When developer contributions are received, they must be recorded as revenue and held until the funds are used.
The NSW Government placed a ‘cap’ on developer contributions until 2020, which meant that councils
could only charge developers a fixed rate per lot or dwelling within specific precincts. In 2013, the government also introduced the Local Infrastructure Growth Scheme (LIGS) to cover the gap between these capped contribution rates and the actual costs of delivering infrastructure in the precincts. This cap was lifted on 1 January 2021.
While Council received all gap funding from LIGS relating to Contributions Plan No.12 – Balmoral Road Release Area (CP12) and Contributions Plan No.13 – North Kellyville Precinct (CP13), it only received partial funding relating to Contributions Plan No.15 – Box Hill Precinct (CP15). Council did not receive gap funding for all capped consents issued before October 2019 under the CP15 plan.
Council revised CP15 which was submitted to IPART for review in April 2023. This review was finalised in April 2024. In July 2024, the Minister for Planning and Public Places provided advice indicating that, although IPART recommended allocating 29% of the funding gap to the remaining 29% of the development, the Minister’s Delegate concluded that none of the gap could be allocated to remaining development. This decision was based on the assessment that the remaining development does not generate demand sufficient to cover more than 29% of the total infrastructure costs.
As a result, there is a shortfall of approximately $182 million (in present value terms as of June 30, 2023) in CP15. Accordingly, Council has no choice but to consider delaying certain infrastructure in Box Hill or seek funding from other sources such as general rates revenue or grants.
Council initiated an immediate review to update CP15 to include indexation for FY2023-24 and to account for changes in circumstances such as the need for additional land, actual increases in
construction costs, and revised yield outcomes. This review significantly increased the funding gap to more than $207 million.
Furthermore, the approved dwellings are only subject to the old contribution rate that was in effect at the time of their approval (with some rates capped at $30,000), rather than the current rate. More dwellings than initially forecast in the CP 15 have already been approved at these outdated rates, due to delays in the assessment process. This situation further exacerbates the funding gap.
Rising costs
Given the current and anticipated inflationary market conditions, it is challenging for Council to achieve significant efficiencies. Various costs that impact Council are largely beyond its control. These costs include, but are not limited to, the Emergency Services Levy, street lighting, planning and regulatory fees, election expenses, Valuer General fees, the Sydney Regional Development Levy, utility costs, and partially subsidised pensioner rebates. Additionally, Council faces audit fees payable to the NSW Auditor General, insurance premiums, cyber security expenses, and more.
Challenges such as supply chain issues, shortages of contractors, and global economic factors also significantly affect councils. The impact of natural disasters, including floods and heavy rainfall as well as bushfires, compounds these challenges.
‘Rate peg’
Council operates under a model where IPART sets a ‘rate peg’ which dictates the maximum percentage by which a council can increase its rates income for that year. As Council’s rate income is capped, Council must ensure best-practice financial management to control operating expenditures and continuously seek efficiencies. This disciplined approach enables Council to allocate sufficient funds for renewing its existing assets and planning for future commitments.
Some fees are set by statute which is outside of Council’s control. These fees have never been reviewed with the increases in costs. They have either not been indexed or changed for long periods. In addition, the stormwater management charge which was introduced in FY2006-07 has not been indexed at all. These costs have become substantial and have escalated significantly over time.
Some other challenges include:
• managing land acquisition liabilities created by the contribution plans in the new release areas. Under the current legislation, councils are required to acquire land listed under the contribution plans even though no contributions have been received from the developers
• adverse weather conditions can lead to the deterioration of assets, resulting in infrastructure backlogs
• ability to find skilled workers, particularly planners, engineers, civil and parks maintenance staff as well as learn-to-swim instructors and lifeguards
• the NSW Government has recently more than doubled Council’s housing completion target over the next 5 years.
Current financial position
Under the Local Government Act 1993 and Local Government (General ) regulation 2021, Council is required to establish and maintain a system of budgetary control and Council’s income and expenditure needs to be monitored each month.
During the year, as required by the Local Government (General) Regulation 2021, the adopted income and expenditure are reviewed against the actual income and expenditure. Any variations are reported to Council every quarter. However this Council, unlike many others, reports variations every month.
Monthly budget reviews and reports provide valuable insights into Council’s progress and performance. This valuable up-to-date information can identify and address potential problems, risks or gaps, allowing for informed decision making. It also ensures that the plan is realistic, timely, accurate and aligned with Council’s goals and priorities.
The Hills Shire Council continues to maintain a strong, stable financial position and is debt-free. It is regarded as a top-tier council and is one of the most well-managed local government areas in Australia. This reputation is primarily due to the application of sound financial management principles by both past and present councils and adherence to the financial charter. Council ensures that spending is responsible and sustainable, implements strict budgetary control at all operational levels, and invests in infrastructure for the benefit of the local community.
In the most recent audited financial statements as of 30 June 2025, Council achieved an operating surplus of $196.4 million which includes capital grants and contributions. Of this, capital grants and contributions accounted for $167.2 million. These are mainly related to Section 7.11 and 7.12 developer contributions, subdivider dedications, non-cash contributions and other grants related to the delivery of capital expenditure such as Accelerated Infrastructure Funding (AIF), the West Sydney Infrastructure Grants (WSIG), Special Infrastructure Contributions (SIC) and State Voluntary Planning Agreement Program. When capital income amounts are excluded, the operating surplus is $29.2 million. This is an increase of $21.9 million from the previous financial year. This is mainly due to a greater decrement in
the fair value of investment properties in FY2023-24 compared to the decrement in FY2024-25. These valuations vary from year to year and accounting standards require these non-cash accounting entries to be recognised in the income statement as income or expense depending on the revaluation movement from the prior year.
The financial statements include performance ratios within the statement of performance measurement (financial performance) and the report on infrastructure assets (asset performance). The ratios include performance measures and benchmarks mandated by the Office of Local Government (OLG).
In FY2024-25, the following financial and asset performance ratios exceeded industry standards, with the exception of own source operating revenue and rates and annual charges outstanding:
1. Operating performance ratio
2. Unrestricted current ratio
3. Debt service cover ratio
4. Cash expense cover ratio
5. Buildings and infrastructure renewals ratio
6. Infrastructure backlog ratio
7. Asset maintenance ratio
8. Costs to bring assets to agreed service level
The own-source operating revenue ratio measures how much a Council relies on external funding sources like grants and contributions. Given the rapid growth that this Council is experiencing and will continue to see in the future, this ratio is not meaningful. This is because the amount of income received from local infrastructure developer contributions, and voluntary planning agreements in addition to the non-cash subdivider dedications will continue to be significant over the next 10 to 20 years. Consequently, Council is unlikely to meet the 60% benchmark set by the Office of Local Government (OLG). If these amounts were excluded, the ratio would exceed this benchmark, reaching 82.55%.
The rates and annual charges outstanding percentage assesses the impact of uncollected
rates and annual charges on liquidity as well as the adequacy of recovery efforts. The outstanding percentage has improved from 6.41% in FY202324 to 5.88% in FY2024-25, although still above the maximum benchmark of 5%. Council staff have been working towards the recovery of these outstanding amounts such as contacting customers,
setting up payment plans and sending reminder notices. This trend highlights the cost-of-living pressures facing both residents and business owners. Council staff will continue their recovery efforts and it is expected that this situation will improve over the next financial year.
The data below is as per our previous Financial Statements:
Valuing our surroundings
Shaping growth
Delivering and maintaining infrastructure
Proactive leadership
Budget FY 2026-27 and future forward estimates
In planning for the FY2026-27, and beyond, we have applied the principles of sound financial management including the financial objectives contained in the financial charter. We’ve also considered the various plans and policies that impact Council’s finances. The long-term financial plan continues Council’s commitment to maintaining strict control over its financial position and performance. This achievement has been continually demonstrated through strong operating results for more than 24 years.
A detailed breakdown of Council’s FY2026-27 Budget is provided in Council’s Operational Plan. This plan forms the basis of the future financial projections in the Long Term Financial Plan (LTFP). The underlying financial summaries in this LTFP are designed to represent the most likely scenario, that is ‘business as usual’, and is known as the draft model. A separate sensitivity analysis has also been included to demonstrate the changes that could affect future projections.
We have made assumptions on factors that are beyond our control, such as consumer price index/ inflation, local government award salary and wage increases, as well as other relevant indices gathered from Deloitte’s Access Economics. This has assisted us in the preparation of the LTFP.
Rates income
Rates income is the main source of revenue for Council for the FY2026-27, contributing to 44% of the total recurrent income (based on the management format of the budget).
Each year, Councils’ ordinary rates income is increased by a ‘rate peg’ set by the Independent Pricing and Assessment Tribunal (IPART), as delegated by the Minister for Local Government and following the Local Government Act 1993, and the Local Government (General) Regulations 2021. This rate peg represents the maximum amount by which a council can raise income from rates.
For FY2026-27, the rate peg has been determined to be 4.7%. The rate peg is comprised of a base cost change of 3.0%, and a population factor of 1.7%. For future years, the rate peg will be estimated by considering, at a minimum, wage
increases along with factors such as inflation and anticipated population growth.
Council must levy rates on all rateable land within its local government area, based on independent valuations provided by Property NSW on behalf of the NSW Valuer General. These land valuations reflect the unimproved value of the property i.e. excluding the value of any house or buildings or improvements.
Further details on Council’s rating categorisation, rating structure, pensioner concessions, and war widow rebates can be found in the statement of revenue policy included in the operational plan.
Domestic waste management charge
The Local Government Act 1993, requires domestic waste to be a full cost recovery service. This means that all costs associated with the administration, collection, recycling, disposal, treatment and community education can be recovered from residential ratepayers. Section 504 (3) of the Local Government Act 1993 states that income generated from charges for domestic waste management must not exceed the reasonable cost of providing these services.
For the FY2026-27, the total costs are estimated to be $49.3 million, and it is proposed that the Waste Management Charge will be set at $610 for a standard service. Projections for future financial years are based on estimated population growth and increases in costs primarily in line with inflation. Adjustments have also been made for known contract variables and expected changes to the Waste Tipping Charge. This tipping charge, mandated by Section 88 of the Protection of the Environment Operations (POEO) Act 1997, requires licensed waste facilities to pay a levy to the government for all waste received at their facilities.
Stormwater management service
charge
The stormwater management service charge is levied under Section 496A of the Local Government Act 1993.
The charges remain at $25 per residential property, $12.50 per residential strata unit, and a pro-rata rate of $25 for every 350m2 or part there of for business properties.
The annual stormwater management charge provides funds to manage the quantity and quality of the stormwater network. Council collects approximately $2.0 million each year to improve its stormwater networks. For FY2026-27 and beyond, income is based on the number of assessments with projected population growth.
User charges and fees
Non-statutory user charges and fees are determined by applying Council’s adopted pricing principles outlined in the Financial Charter Policy and based on applying user-pays principles. These charges are determined annually, published in the fees and charges section and incorporated into the annual operating budget.
When setting the fees, Council assesses the cost of providing the service, whether the goods or service are offered on a commercial basis, takes into account the usage of facilities and applies principles of competitive neutrality.
Statutory fees and charges are driven and set by legislation which limits Council’s ability to recover the full cost of its services.
For FY2026-27, fees have generally been increased in line with the Rate Peg from IPART. For future years, it is assumed that fees will rise, with CPI projections.
Interest and investment revenue
Interest earned from investments will depend on the total amount of cash held by Council, interest rates and the timing of cash receipts and expenditures. Council invests funds according to the most recent Ministerial Order issued by the NSW Minister for Local Government. As per Council’s adopted Investment Policy, investments must be made in a way that protects the investment portfolio. This includes managing credit risk and interest rate exposure within identified thresholds and parameters to ensure the best financial outcome for ratepayers and the community.
This plan utilises information such as the current portfolio rate as well as information from Deloitte Access Economics to determine future projections for interest on investments based on forecast cash balances over the life of the plan.
Other revenue
Other revenue mainly comprises income from regulatory functions, and bus shelter advertising, which is driven by activity and determined by
fixed contracts. It also includes property leases which have fixed increases based on the lease agreements. Future projections for other revenue are based on anticipated increases in the Consumer Price Index (CPI).
Grants and contributions - operating and capital
Council received grant funding for recurrent operations and capital expenditure from federal and state government agencies. Most of the operating and capital grants are received to fund specific programs, services or projects. This plan incorporates known committed grants and a conservative allowance for capital grants and contributions is assumed for future years. Future operating grants are based on current levels being maintained with CPI increases.
One of the significant operating grants received is the Financial Assistance Grant (FAG) from the federal government. This general purpose grant is paid to councils under the Commonwealth Local (Financial Assistance) Act 1995. The allocation of funds to councils is based on a formula that considers factors such as population size, the amount of infrastructure being maintained, and the relative disadvantages faced by different councils. For FY2026-27, FAG is estimated at $8.9 million.
Contributions from developers are collected under Sections 7.11 and 7.12 of the Environmental Planning and Assessment Act to support the provision of essential public infrastructure. These contributions are levied according to the contribution plans adopted by Council. The level and timing of contributions may vary, as they are largely influenced by market conditions and the timing of development activities.
It is important to manage the cashflow of these funds to ensure that associated expenditure is contained within the amount of funding held. As highlighted on page 14 of this LTFP, Council faces specific challenges in relation to the funding gap identified for CP15 Box Hill Release Area. It is important to note that funds collected by Council under these contributions plans are placed in an externally restricted reserve and can only be used for the purposes for which they were received. Any additional amounts earned from their investment such as interest on these funds must also be restricted.
Employment costs
Employment costs predominantly consist of salaries and wages, employee leave entitlements, superannuation and workers compensation. This accounts for 40% of our total operating costs.
The forecasts for employment costs reflect the assumptions and strategies contained within the Workforce Strategy. The financial impacts of issues such as an ageing workforce identified in the Workforce Strategy have been addressed in the LTFP by managing the employee leave entitlements reserve.
Salaries and wages are based on the Local Government State Award. The budgeted employment cost for FY2026-27 is $96.2 million. At the time of preparing this plan the Local Government State Award had not been ratified, therefore the following increases have been assumed. 4.5% in FY2026-27, 4% in FY2027-28, 3.5% in FY2028-29, and 3.0% will continue for the remainder of the plan.
Other factors influencing employment costs are movements within the grading system as part of the annual performance review process, changes in the level of the superannuation contributions, workers’ compensation rates and increases in staff numbers driven by operational needs - such as population growth and the introduction of new infrastructurealso play a significant role.
Council is required to make compulsory employer superannuation contributions on behalf of its employees. The amount of employer superannuation contributions depends on whether an employee is part of an accumulation scheme or a defined benefit scheme. The primary difference between these schemes lies in the level of contributions.
For Council employees in the accumulation scheme, Council is required to follow the compulsory employer superannuation contribution limits. On 29 March 2012, the proposed increase in Superannuation Guarantee entitlements received Royal Assent and became law. This means that the Superannuation Guarantee contributions (SGC) began to increase annually since July 2014 (9.5%). The SGC applicable for FY2026-27 and beyond is 12% (as per published data from the Australian Tax Office).
The Defined Benefit Scheme requires its members to contribute a percentage of their salary to superannuation. This percentage is reviewed and changed by employees on an annual basis. Council’s contribution is calculated using a specific formula which takes into consideration the percentages nominated by the employees, and the employee’s salary.
Materials and contracts
Materials and contracts represent a significant proportion of total operating expenditure, accounting for approximately 33%. These costs are impacted by many factors including economic conditions, market competition, and availability of resources and raw materials. Generally, the plan allows for increases in accordance with CPI. As new infrastructure is developed, the plan allows for future growth in expenditure as more assets come on board.
The majority of the expenditure in this category relates to domestic waste services, aquatic services, information technology and maintenance of infrastructure assets such as roads, parks, buildings, footpaths and drainage systems. These services are delivered through service contracts.
Council has a significant amount of infrastructure assets totalling $6.2 billion. The Asset Management Strategy within the Resourcing Strategy ensures that Council develops, implements, and administers a service-centric, community focused and sustainable Asset Management Plan. This strategy provides estimates of the planned maintenance and renewal for each of the major categories of infrastructure assets which is linked to the LTFP.
Expectations for increasing levels of service, and new or upgraded community assets will lead to future cost pressures. Proper planning and management of Council’s assets are essential to ensure that services are provided at an appropriate level. This, together with ongoing reviews of contracts and services, will aim to alleviate some of these increasing cost demands.
Depreciation
Depreciation of assets is a non-cash expense that essentially spreads the cost of a tangible or physical asset over its useful life. The amount an asset is depreciated in a given period is a representation of how much of its value has been utilised.
In this plan, annual depreciation is projected to increase by an average of 3.1% per annum based on estimated capital expenditure in future years. The actual depreciation expense in future years will be impacted by future asset revaluation methods and timing as stipulated by relevant accounting standards. Depreciation is not affected by other factors such as CPI and will only change if asset values, useful lives, or the acquisition or disposal of assets occur.
It is best practice in financial management to ensure that an amount equivalent to depreciation is allocated towards the renewal of assets on an annual basis.
Other expenses
Other expenses mainly consist of expenditures related to the contribution to other levels of government such as the emergency services levy, utilities, street lighting, insurance, communication charges and recurrent project-related expenditures e.g. providing community events, library programs etc. Generally, this type of spending increases in line with the Consumer Price Index (CPI); however, expenditure patterns and trends are monitored to ensure adequate funds are allocated.
The statutory contributions to the state government are influenced by factors outside of Council’s control. In recent years the increases set by the state government have been significantly higher than CPI. Utility costs have also risen considerably over the years and as more and more facilities come on board with the rising energy charges, an appropriate level of funding has been provided.
Capital expenditure
Council has an extensive capital works program consistent with prior financial years, with a forecast budget of approximately $1.3 billion for the construction and renewal of new and existing infrastructure and facilities over the next 10 years. This significant capital program requires careful planning and financial management. It is integrated with the Asset Management Strategy plans, to ensure that delivery is achievable while maintaining operational service standards.
The capital works program for existing assets is prioritised and based on asset condition, usage, community need and risk factors. Further details are contained in Council’s Asset Management Strategy. New assets are predominantly related to new release areas under the Section 7.11/S7.12
Contribution Plans. Developer contributions funded expenditure of $17 million in FY2026-27 and $1.7 billion over the life of developer contributions plans is mainly based on providing the necessary infrastructure in the Box Hill precinct, Balmoral Road and North Kellyville release areas, Bella Vista, Kellyville, Norwest and Showground station precincts. These works are staged and dependent on activity, timing or cash flow and can span over multiple years.
Council’s cash reserves
Restricted cash reserves are funds set aside by Council to meet regulatory requirements. These funds are allocated for future projects or activities to safeguard Council from unexpected increases in expenditure, and to meet long-term financial obligations.
Council’s cash reserves are predominantly classified into the following:
• Externally restricted reserves
• Internally restricted reserves
• Unrestricted cash
Externally restricted reserves
These funds are those where there is a legislative or contractual obligation to use the funds for the purpose for which they were paid to Council and these funds must be expended for the specific purpose defined and cannot be used for general operations. These include Section 7.11/Section 7.12 developer contributions, voluntary planning agreements, domestic waste and specific purpose unexpended grants.
Internally restricted reserves
These funds are those that are restricted by resolution of Council. These restrictions are to fund future commitments and longterm obligations and have been established for a specific internal purpose. Council has internally restricted funds for the following activities, but not limited to: infrastructure, plant replacement, land development, election, insurance, workers compensation, employee leave entitlements etc.
Unrestricted cash
These funds are not restricted for a specific purpose and are held to cover day to day operational needs and must be sufficient to satisfy Council’s short term obligations. These funds are viewed as a buffer against unexpected events, losses of income, fluctuations with cashflow and unforeseen circumstances. Council must aim to ensure unrestricted cash balances remain at a positive and acceptable level.
Sensitivity analysis and financial modelling
The LTFP contains a number of assumptions based on various sources including legislation, inflation rates, and salary and wage increases. Although these assumptions inform the LTFP, it is important to note that Long Term Financial Plans are inherently uncertain and subject to change.
Any fluctuations in these assumptions during the life of the plan may have a significant impact on Council’s future financial outlook.
The draft model presents a ‘business as usual’ scenario, which forms the basis of Council’s LTFP. It is built on a range of assumptions that are considered the most likely to occur over the next 10 years and is contained in the financial reports in the LTFP.
Sensitivity analysis 1: rates income
Sensitivity analysis
The LTFP contains a number of assumptions based on various sources such as legislation, inflation, current service provisions and wage markets. Variations in these assumptions during the life of the plan may have a significant impact on Council’s future financial plans.
The assumptions in the draft model have been tested for sensitivity to both favourable and unfavourable fluctuations in revenues and expenditures. While there may be numerous factors beyond the Council’s control that could influence its finances, this specific analysis focuses on the rates income, employee costs and material and contract costs, assuming all other variables remain constant.
Rates are capped by IPART. If the rates peg increases by 1.0% per annum from 2026-2027, then the impact on the rates income would be as follows:
Rates and annual charges - ordinary and special rates ($’000)
Sensitivity analysis 2: employee costs
Salary and wages are driven by the NSW Local Government Award. The budgeted employment cost for FY2026-27 is $96.2 million. At the time of preparing this plan the Local Government State Award had not been ratified, therefore the following increases have been assumed. 4.5% in FY2026-27, 4% in FY2027-28, 3.5% in FY2028-29, and 3.0% will continue for the remainder of the plan.If the Award fluctuates by + 0.5% from FY2026-27 onwards, then the following will impact Council’s budgeted employment costs.
Employment benefits and on-costs ($’000)
2026/272027/282028/292029/302030/312031/322032/332033/342034/352035/36 Base Scenario Employment Costs + 0.5%
Sensitivity analysis 3: material and contract costs
Material and contracts are impacted by many factors including economic, and market conditions, availability of resources and raw materials. Generally the plan increases in line with CPI. If materials and contracts fluctuate by + 1% from FY2026-27 onwards, the impact would be as follows:
There may be a number of risks associated with any long term financial planning predictions. Risk can be minimised by regular review of LTFP assumptions, incorporation of risk assessment in all major project reviews, and modelling of scenarios. The following is a range of identified external risks that may also impact on the LTFP should they eventuate as they could result in a significant change in operating revenue or expenditure and the need to review service levels:
Interest on investments
Investments are placed and managed in accordance with Council’s adopted investment Policy No. 5 and in compliance with the Local Government Act. Interest on Investments is subject to movements in interest rates and the amount available to be invested. Service levels and capital expenditure are impacted by fluctuations in interest rates.
Rate pegging
Changes in rate pegging will impact revenue forecasts and the levels of service provided.
Inflation
Changes in inflation will impact both revenue and expenditure.
Employee costs
Changes in employee costs will impact both revenue and expenditure.
Termination patterns will impact both the employee leave entitlements’ reserve and liability, superannuation costs, workers compensation costs as well as recruitment and training costs.
Capping of developer contributions
While the Developer Contributions cap of $30,000 per dwelling introduced by the State Government in September 2018 had been removed on 1 July 2021, Council continues to face a funding risk as a result of not being able to receive the full gap funding from the State Government relating to CP15. However, Council has been granted $68 million of Accelerated Infrastructure Funding (AIF) from the State Government into CP15 and $3 million into CP12. Council is actively seeking options to address the funding gap in CP15.
Similarly, while contribution caps have been lifted entirely, in order to levy full contribution rates, contribution plans must be endorsed by the State Government following a review by the Independent Pricing And Regulatory Tribunal. This process can be lengthy and timing is also outside Council’s control.
Another major challenge faced by Council is managing land acquisition liabilities that are created by these contributions plans. Under the current legislation councils are required to acquire land listed under the Contribution Plans even though no contributions have been received from the Developers.
State and federal funding
Budget reductions in state and federal governments may impact future funding provisions of grants and contributions.
Cost shifting, global issues and legislative changes
Continued increased cost shifting from other levels of government may adversely impact current expenditure levels of Council. Global issues impacting cost and supply of material, market and economic conditions, changes in legislation or state policy decisions.
Methods of monitoring financial performance
Operating performance ratio
Own source operating revenue ratio
Measures Council’s achievement of containing operating expenditure within operating revenue
Measures Council’s fiscal flexibility. It is the degree of reliance on external funding sources such as operating grants and contributions
or greater15.78%
Unrestricted current ratio
Debt service cover ratio
Rates, annual charges, outstanding percentage
Cash expense cover ratio
Infrastructure backlog ratio
Asset maintenance ratio
Cost to bring assets to agreed service level
(excluding S7.11, VPA and subdivider dedications)
Assesses the adequacy of working capital, i.e. the ability to meet debt payments as they fall due 1.5x or greater3.74x
Measures the availability of operating cash to service debt including interest, principal and lease payments 2x or greater136.41x
This assesses the impact of uncollected rates and annual charges on Council’s liquidity and the adequacy of recovery efforts
This liquidity ratio indicates the number of months Council can continue paying for its immediate expenses without additional cash inflow
This ratio compares the proportion spent on infrastructure asset renewals versus the assets’ deterioration
This ratio shows what proportion the infrastructure backlog is against the total value of Council’s infrastructure assets 2% or less0%
A ratio above 1.0 indicates Council is investing enough funds within the year to stop the infrastructure backlog growing
Estimated cost to bring assets to an agreed service level set by Council
This liquidity ratio indicates the number of months Council can continue paying for its immediate expenses without additional cash inflow.
This measures Council's fiscal flexibility. It is the degree of reliance on external funding sources such as operating grants and contributions.
Assesses the adequacy of working capital and its ability to satisfy onligations in the short term.
This ratio measures Council's achievement of containing operating expenditure within operating revenue.
This is a measure which compares actual versus required annual asset maintenance. A ratio above 1.0 indicates Council is investing enough funds to stop the Infrastructure Backlog from growing. This assesses the extent to which Council is expanding its asset base through capital expenditure on all assets (new and existing) as opposed to total depreciation.
This ratio shows what proportion the infrastructure backlog is against the total value of Council’s infrastructure assets.
This ratio compares the proportion spent on infrastructure asset renewals versus the assets' deterioration.
Message from the General Manager
Local Government plays an important role in Australia’s economy by delivering essential services and facilities that support residents’ quality of life. As the third tier of government, and the closest to the community, it provides accessible and responsive support to meet the diverse needs of residents.
Council delivers a wide range of services and employs a diverse workforce across multiple occupations. Unsurprisingly, employment-related costs represents one of the largest ongoing investments required to sustain Council operations.
As one of the largest employers in our community, Council is responsible for ensuring we have the right people, skills and capacity to deliver the services our residents depend on. Our Workforce Strategy helps us plan for the future by making sure we have the skills, capacity, and support needed to meet our community’s expectations. It also guides how we respond to changing needs, address roles that are becoming harder to fill, and create a stable and skilled workforce that can continue delivering high-quality services.
Analysis from the ABS, Deloitte and Jobs and Skills Australia shows that, over the past five years, non market sectors, including including health care, social assistance, education, training, and public administration and safety have driven the majority of Australia’s employment growth, significantly outpacing market-sector job creation. Deloitte Access Economics found that around 80% of employment gains in 2023 came from non-market sectors, while ABS Labour Account data confirms that health, education and public administration
were among the largest contributors to filled-job growth since COVID. Jobs and Skills Australia reporting further shows that Health Care and Social Assistance alone has grown substantially faster than the overall economy across this period.
The Hills Shire Council plays a vital role in supporting Sydney’s housing and jobs growth. Over the past five years, the LGA has added 11,536 new dwellings, surging the population from 192,300 to 218,264, building on more than 15 years of strong population growth. Over the same period more than 17,000 dwellings and residential lots have been approved within the Shire’s greenfield areas and Metro Precincts which is the second highest dwelling approval rate in the Sydney Metropolitan Region.
This rapid expansion requires significant investment in essential infrastructure and an increase in service capacity to meet the needs of our growing community. Within this environment, Council faces several key workforce challenges, including attracting and retaining talent, strengthening training and development, filling critical hard-to-recruit roles, and keeping pace with evolving technologies.
Our operations are important and rely on a workforce and contractor network that upholds our values and consistently contributes to high-quality service delivery across all areas of our work.
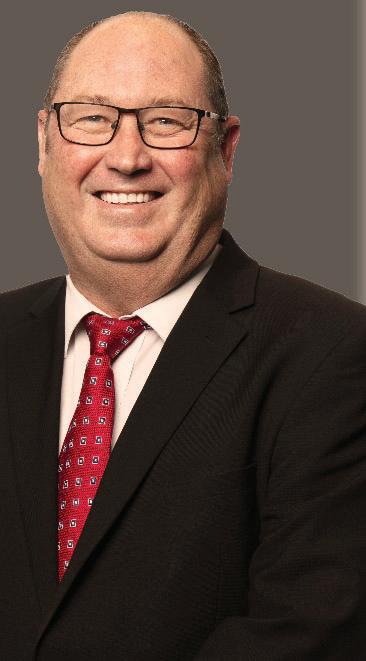
Michael Edgar
General Manager
Introduction
The Workforce Management Strategy (WMS) outlines how The Hills will ensure it has the right people, with the right skills, in the right roles at the right time to deliver the Delivery Program and annual Operational Plans.
It aligns with the Resourcing Strategy and supports the community’s long-term aspirations set out in Towards Hills 2050 (Community Strategic Plan). The WMS also fulfils the mandatory workforce planning requirements of the IP&R framework.
WMS purpose
Local governments face a perfect storm of skills shortages, rapid technological change, shifting workforce expectations, and increasing service complexity. This Strategy sets the direction for building a future-fit workforce over 2026–2030. It prioritises targeted capability building, culture and leadership, flexible employment models, and strategic workforce analytics to ensure sustainable service delivery aligned to the Community Strategic Plan (CSP) outcomes of an enriched lifestyle and connected people and places.
5 Implement 6 Monitor and evaluate
1 Scope 2 Analyse
3
4
Workforce planning approach
Council apply the Office of Local Government’s (OLG) recommended cycle and systematic process of environmental scanning, analysis, forecasting and strategy development and adopt a holistic lifecycle approach to managing human resources, with the focus areas of Attract, Develop, Retain and Transition embedded in the Resourcing Strategy.
The six-step process we followed when developing the WMS:
Step 1 – Scope: Ensure strategic alignment by validating CSP priorities and service levels and translate into workforce implications (demand).
Step 2 – Current state: Analyse staffing, capabilities, demographics, mobility, attrition and retirement risk.
Step 3 – Forecast Future workforce needs: Conduct an environmental scan to understand: labour markets, policy/regulatory shifts, technology impacts and partner ecosystem. Define the skills, workforce mix, resources and partnerships required to meet the delivery program.
Step 4 – Identify workforce gaps against future needs (Gap analysis): Compare supply vs demand by role/skill, prioritise interventions and quantify risks.
Customer Services & Venues Communications & Community
Customer Contact Centre
Records & Information Management
Community & Recreation Facility
Operation
Hall Booking, Venue Hire
Cemetery Services
Media Relations
Community Engagement & Online Services
Public Relations
Corporate Advertising
Civic & Community Events
Community Outcomes
Grants
Citizenship
Group Manager Infrastructure & Works
Civil Works Vegetation Works Capital Works
Planned Civil Maintenance
Trades Maintenance
Earth Moving & Haulage
Road Restorations & Maintenance Planning
Inspections & Solutions
Regulatory Services Environment & Public Health
Control of Unauthorised Development
Development Monitoring Fire Safety Inspections
Swimming Pool Safety
Extractive Industry
Building Certificate Applications
Parking & Vehicle Enforcement
Companion
Animals Control
Drainage (Private Property)
Food Premises/ Public Health Regulations
Environmental Monitoring & Regulation
Trees & Bushland Management (Private)
Sustainability
Environmental Education & Projects
Resource Recovery
Parks & Open Space Vegetation
Maintenance
Tree Planting & Maintenance
Bushland Maintenance
Community Nursery
Capital Works Delivery Project Supervision Tender Evaluation & Contract Administration
Technical Review & Advice
Group Manager Development & Compliance
Waste Contract
Management/ Contaminations
Management/ Illegal Dumping
Subdivision & Development Certification Development Assessment
Subdivision Applications Assessment
Subdivision Construction Plan Assessment & Inspections
Release of Subdivision Certificates (Linen Plans)
Construction Certificate & Complying
Development
Certificate Assessment
Building Inspections (Certification)
Occupation
Certificates for Building
Development Application Assessment
Construction Certification Assessment (Dwellings & Ancillary Buildings)
Our workforce total full-time equivalent employees as of 30 June 2025 was 699.86. Approximately 87.5% of employees are full-time and 12.5% are part-time. Permanent roles make up approximately 70% of the workforce with the remainder comprising mostly casual employees working in customer facing roles including our aquatic centre and childcare centres. Turnover rates dropped to 11.43% in 2025 from 14.59% the previous year, a significant improvement.
1 Castle Hill and Baulkham Hills
2 Kellyville
36% of staff live within The Hills Shire
Employment Volunteers
Employee engagement
An Employee Engagement Survey is completed annually providing a data driven understanding of how employees feel, what is helping them perform well, and what barriers may be affecting service delivery or wellbeing. The survey provides a confidential way for employees to have their voice and express their views about communication, recognition, professional development, work life balance, teamwork, performance, leadership, wellbeing and culture. Specifically, the survey helps Council to identify strengths and pain points, strengthen retention and reduce turnover costs, improve service delivery to the community, shape leadership and culture priorities and track progress over time.
Engagement at Council is trending positively overall. Council’s good engagement score in 2025 of 73% was consistent with the 2024 engagement score. Participant rates increased to 75% in 2025 from 65% in 2024. The survey showed staff feel positive about their work at The Hills Shire Council and believe that their manager genuinely cares about their wellbeing.
The results of the employee engagement survey are communicated to all team members and feedback is invited to develop and implement action plans to enhance our culture and achieve our strategic goals.
Volunteers
According to 2021 Census data, Hills residents volunteer more than the Greater Sydney average (13.7% of Hills residents are volunteers compared with 11.6% of Greater Sydney residents). Each year volunteers with Council and across The Hills community perform a wide range of tasks across many different organisations. Volunteering opportunities are available with Council for those aged 16 years and over.
The Hills Shire Council volunteers support a range of services including:
• Justices of the Peace
• Friends of the Hills Libraries
• The Hills Youth Army
• S355 Advisory committee members
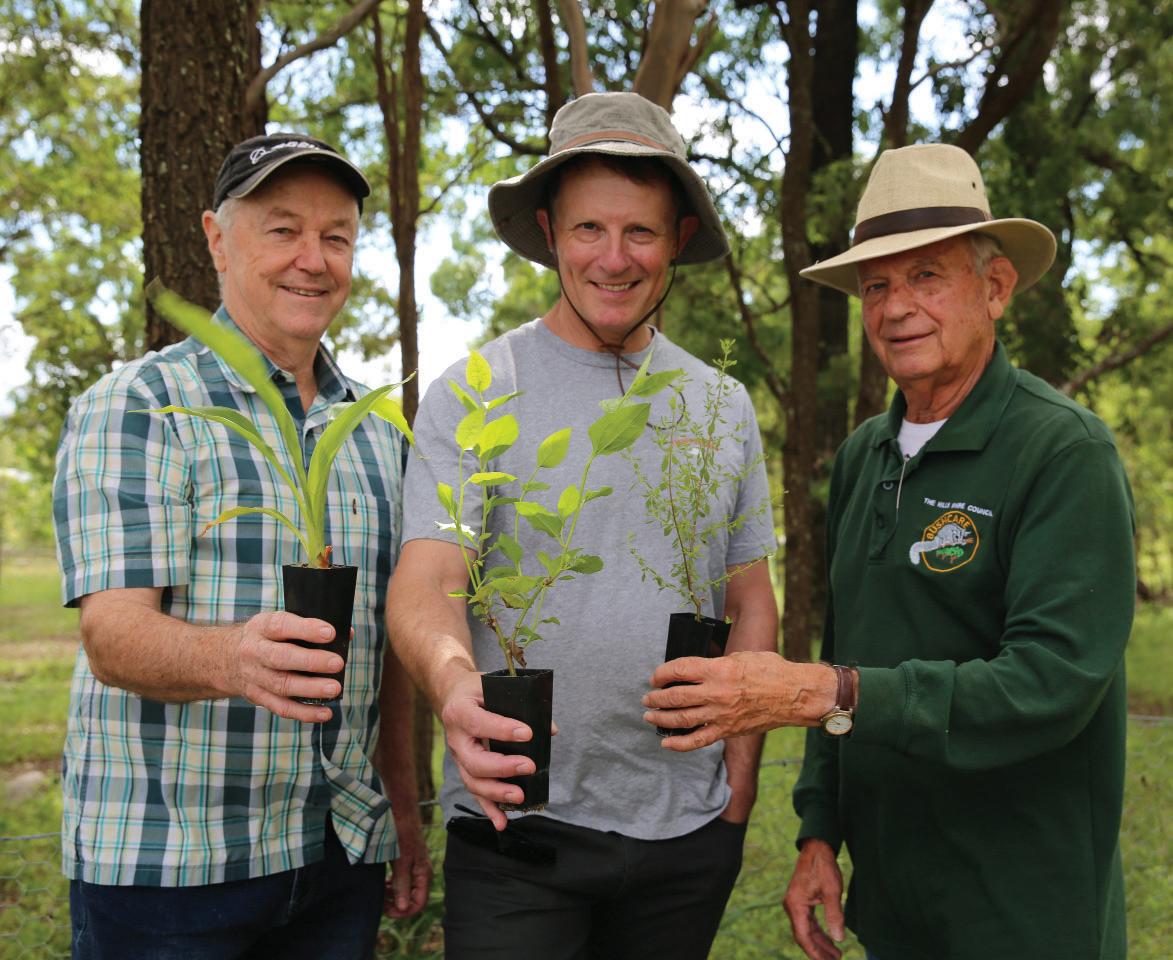
• Bushcare, community nursery and environment centre
• Hills Community Care
• Council events.
Forecast future workforce needs
Over the next decade, Council’s workforce requirements will be shaped by significant growth, evolving community expectations, and increasing complexity across core service areas. To ensure sustainable, high quality service delivery and achieve the outcomes in the Community Strategic Plan (CSP), it is essential to understand where future skills and workforce capacity will be most in demand. An environmental scan identified a range of internal and external factors that were considered when determining Council’s future workforce needs.
Environmental scan
External Global research factors suggest a strong focus on identifying and addressing skills gaps, increased AI adoption, and building organisational agility by overcoming cultural and change-related challenges. it also points to expanding talent availability through a ‘buy, borrow, build’ approach underpinned by responsible fiscal management.
Internal - Hills Shire Council factors (CSP & LSPS lens)
• Rapid change to current Land Use Regulatory Controls, with immediate demand for new infrastructure which points to a need for experienced planners, building surveyors, compliance officers and strategic planning experts, all occupations in high demand with short supply and a competitive recruitment market creating a higher vacancy risk. It also creates a capability uplift requirement to interpret new controls, statutory planning and complex assessments.
• Delivery risk for $1.3B 10-year capital works and renewals. Infrastructure delivery across Box Hill, North Kellyville and strategic centres are creating stronger demand to build and for asset upkeep, open space and community buildings. From a workforce
• 63% of employers cite that skills gaps are the leading obstacle to transformation for the period 2025 to 2030 (The World Economic Forum’s ‘Future of Jobs Report’)
• AI adoption is accelerating, reshaping workflows and team collaboration with research showing workers are using AI for increasingly sophisticated tasks
• culture and change resistance impede delivery with behaviour resistance causing wasted resources and a failure to realise productivity gains (Harvard Business Review (2026))
• Talent availability is declining especially in skilled and high demand occupations
• There are increasing financial pressures due to Local Government funding in a Rate cap environment.
planning perspective this indicates capability and role mix implications, particularly having sufficient program and project management, scheduling, cost control, contract administration and community engagement capability to manage long term, multi-stream delivery not just individual projects. It also highlights a requirement for technical and regulatory capabilities such as planners, building surveyors and compliance officers to handle approvals that sit upstream of capital delivery. Asset lifecycle skills such as stronger asset strategy/analytics and field leadership skills
required to ensure renewals are sequenced and delivered efficiently within budget. There will be a strong need for digital delivery skills and competence in Project Management Information Systems (PMIS), data/Geographic Information System (GIS), mobile field apps and data literacy to support schedule/cost control, quality and on-site productivity. The baseline competency for project management controls, approvals and asset analytics to derisk cost and sequencing needs to be lifted.
• Growth and complexity: Housing growth is driving Development Application (DA) volume and complexity, rapid change in legislation and Community expectations for timely enforcement.
• Increased safety and compliance obligations across roads, parks, drainage and buildings create specific and measurable workforce impacts. These stem from tightening regulations, greater infrastructure complexity and higher community expectations.
• Labour market scarcity: According to the 2022 Local Government Workforce Skills and Capability Survey findings, 91% of NSW Councils reported skills shortages. There is NSW wide demand and competition for urban and town planners, engineers, project managers, building surveyors, mechanical trades and aquatic/leisure talent intensifying the need for stronger talent pipelines and a more competitive Employee Value Proposition (EVP). The 2024 NSW Workforce Skills Survey reports significant recruitment challenges across the construction and technical services sectors, with acute shortages in technicians, tradespeople, and professional service roles. Jobs and Skills Australia report that engineers remain persistently scarce. Also there is a
shortage of frontline workers such as libraries/ aquatic, rangers, customer contact and outdoor workers.
• Aging workforce and succession planning – NSW demographics show a rapidly aging population. An aging workforce is a significant challenge facing NSW councils imposing a requirement to plan for workforce continuity, redesign roles and work environments to retain and attract workers. The proportion of people aged 65+ in NSW is projected to increase to 22% by 2031 and life expectancy expected to increase by 9 years by 2050. These shifts reduce growth in the working-age population impacting Council’s ability to maintain service levels. Strategies exploring the retention of experienced mature workers and volunteers is required.
• Digital expectations: There is a growing requirement for faster, transparent digital services (eDA, customer portals), asset data intelligence and mobile field work. A growing digital footprint increases cyber risk. Behavioural adoption will be essential to realising the full value of new technologies. This will require process design that promotes consistent ways of working across outdoor and indoor teams to embed everyday use of new technology, establish standardised practices and strengthen governance risk management.
• Sustainable Service Delivery: Maintaining an effective balance between customer satisfaction, a highly engaged workforce and responsible cost management will be critical to sustainable service delivery.
These trends are reshaping every level of local government work, from field operations to professional services and leadership.
Gap analysis
workforce gaps against future needs
The environmental scan revealed the following workforce challenges and opportunities:
Workforce challenges & opportunities
• Critical role scarcity creating skills gaps - it is the leading barrier to transformation to 2030 as talent availability declines leading to longer recruitment timeframes and delivery risk. (World Economic Forum, Future of Jobs 2025). Occupations of concern include planners, engineers, project managers, plant operators, trades, supervisors, regulatory roles, digital and data specialists and cyber. Competition for accredited professionals remains high leading to longer vacancy times to fill, service coverage risk in areas dependent on contingent workers such as childcare, aged care and aquatics/leisure.
• AI and automation and digital capability gaps - AI and automation is accelerating. Staff will require reskilling in digital systems, mobile field work, PM systems, asset data, GIS, eDA workflows and general digital literacy.
• Culture, engagement and change readiness gaps - the organisation may experience resistance to change and rising burnout creating risks to engagement levels and impacting the ability to adopt new technologies, redesign of roles and embedding new ways of working.
• Demand for flexible work continues to grow while regulatory and cost pressures complicate adoption creating retention and attraction challenges in competitive labour markets. (IMD Workplace Trends 2026).
• Affordability and resource constraints - rising costs vs rate pegging, especially when a Hills Shire Growth phase becomes a maintenance phase council.
• A growing succession risk threatens leadership continuity. (ManpowerGroup Global Workforce Trends 2026).
Strategic Action Plan
The Workforce Strategic Plan themes and objectives as outlined in Section 5.1 have been derived to deliver the following Community Priorities as identified in the CSP:
CSP drivers (2025-2050)
Manage rapid growth
(new homes, centres activation, Metro precincts) while maintaining high service standards and liveability.
Deliver and care for infrastructure and places
parks, paths, facilities, roads—supporting active lifestyles and connected places
Proactive leadership & governance
customer centred, financially prudent, digitally capable, and resilient to change.
To deliver the CSP outcomes identified above, the Delivery Program has identified the following Strategy and Actions in relation to Workforce.
PLG1 Proactive leadership
Strategies
What will we do to get there?Actions
PLG1.5 Create a safe and skilled workforce that delivers quality services that meet Council’s strategic direction and goals
1.5.1 Develop and implement people strategies to support all groups to deliver community outcomes
1.5.2 Provide a safe and healthy environment for staff, contractors and the community
How we’ll measure successOutcomes
· Increased staff job satisfaction
· Lost time injury frequency rate
· Increased average number of training hours per employee per year
· A resilient workforce equipped to deliver results.
· Responsible use of human resources that maximises productivity and performance.
· A workforce aligned with leadership priorities
Workforce Strategic Plan actions
The Workforce Strategy outlines the following themes and actions, informed by an assessment of current workforce capabilities, insights from the environmental scan, and the strategic gaps identified throughout this document. These themes and objectives are aligned to the Delivery Program Actions PLG 1.5.1 and PLG 1.5.2 (listed on the previous page) with a view to deliver the Community Strategic Priorities.
ThemeObjectives
1. Attract and acquire
1.1 Create a compelling, purpose driven Employee Value Proposition (EVP) that strengthens attraction in competitive and high demand labour markets.
1.2 Develop sustainable, proactive and diverse talent pipelines to ensure Council can secure the skills and workforce capacity required for current and future service delivery
2. Develop capability
3. Retain and engage
2.1 Address critical capability gaps across planning, engineering, regulatory functions, infrastructure delivery, digital, data and AI enabled work.
2.2 Build strong leadership capability at all levels, supported by robust succession pipelines, targeted development pathways, and mobility opportunities.
2.3 Increase digital adoption and data literacy to enable effective use of emerging technologies, mobile field tools, PMIS and asset intelligence platforms.
2.4 Strengthen workforce analytics, governance and insights to support evidence based decision making and continuous workforce improvement.
3.1 Enhance organisational culture and employee engagement to foster high performance, improve wellbeing and create a positive employee experience.
3.2 Strengthen retention strategies for critical, scarce skill and frontline roles to ensure continuity of service delivery.
3.3 Manage ageing workforce risks through structured knowledge transfer, mentoring, succession pathways and role redesign where appropriate.
3.4 Ensure flexible, contemporary and equitable employment practices that support workforce sustainability and attract and retain diverse talent.
4. Wellbeing and safety 4.1 Promote a mentally healthy, physically safe and resilient workplace by embedding proactive wellbeing practices.
4.2 Strengthen psychosocial risk management through preventative measures, early intervention, training and strong safety leadership.
4.3 Continuously improve WHS systems, audit processes and Safe Work Information Statements (SWIMs) to support compliance and consistent safe work practices.
5. Diversity, equity and inclusion 5.1 Build an inclusive and respectful culture where all employees feel valued, supported and able to contribute meaningfully.
5.2 Increase workforce diversity and ensure equitable access to development, opportunities and progression.
5.3 Deliver DIAP, EEO and OLG diversity commitments through structured initiatives that strengthen inclusion and reduce barriers to participation.
Theme 1. Attract and acquire
1.1 Rebuild and modernise Council’s Employee Value Proposition (EVP).
1.2 Implement targeted attraction campaigns for high demand and scarce roles.
1.3 Build and develop talent pipelines to support business growth.
1.4 Implement a Graduate/ Cadet/ Trainee/ Apprentice program (Planning, Civil/Traffic, Surveying, Horticulture, Trades and Customer Operations.
1.5Establish pre-qualified supplier panels.
Theme
2. Develop capability
2.1 Develop a Hills Capability Framework and embed in performance and development processes with learning pathways.
2.2 Develop and implement targeted AI and data literacy capability uplift programs (covering electronic Development Application (eDA), PMIS, asset intelligence (GIS/internet of things (loT), mobile field apps, data literacy and AI.
2.3 Develop and implement leadership programs (frontline, emerging/high potentials and senior leadership).
2.4 Strength succession planning by identifying successors for critical roles, embed in development plans, document handover playbooks and pair later-career experts with potential successors.
2.5 Promote secondment and temporary opportunities for potential career successors.
2.6 Enhance workforce analytics capability to improve forecasting, reporting and decision making.
Theme 3. Retain and engage
3.1 Review and update the induction and onboarding program to integrate new hires effectively.
3.2 Collect and analyse data to improve employee engagement and generate action plans that motivate increased productivity, performance and organisational commitment.
3.3 Strengthen retention strategies for critical, scarce skill and frontline roles.
Workplace Relations, Business Partnering Team
Workplace Relations, Business Partnering & Learning & Development Teams
Partnering, Learning & Development Teams
3.4 Introduce ageing workforce and knowledge transfer strategies (mentoring, handover playbooks, phased retirement pathways).
3.5 Review HR policy and procedure framework to ensure alignment with changing legislation, support flexibility and equity to enable a modern structured and accountable workplace.
Theme 4. Wellbeing and safety
4.1 Refresh and deliver an annual wellbeing program supporting engagement and performance.
4.2 Develop and implement a plan to lift work health and safety (WHS) performance over three years, aligned to WHS strategy and WHS legislation.
4.3 Conduct regular safety management system checks to proactively manage risks, strengthen compliance and continuously improve safety performance External Audits and Internal Desktop Audits.
4.4 Implement psychosocial risk management initiatives and develop processes that monitor the work environment to positively impact employee wellbeing, engagement and performance.
Theme 5. Diversity, equity and inclusion
5.1 Implement DIAP initiatives in line with legislative requirements.
5.2 Strengthen our understanding of inclusion, representation and equity across Council.
5.3 Collect and analyse data to identify the diversity makeup of Council’s workforce.
Measuring sucess workforce
related indicators
The success of the Workforce Management Strategy is measured through the annual operational performance measures.
PLG1.5 Create a
ActionsWorkforce related indicators
1.5.1 Develop and implement people strategies to support all groups to deliver community outcomes
1.5.2 Provide a safe and healthy environment for staff, contractors and the community
Population to staff
• Increased staff job satisfaction
• Lost time injury frequency rate
• Increased average number of training hours per employee per year
• Average number of days lost to absences (unplanned leave)
• Employee Engagement
• Percentage of staff retained
• Safety incidents responded to within 24 hours
• Population to staff (number of residents to every staff member)
Monitoring and reporting (IP&R)
The diagram below shows the relationship between Council’s plans and resourcing strategies.
Monitoring and reporting of the Workforce Strategy occurs through Council’s Integrated Planning and Reporting (IP&R) framework to ensure alignment with the Community Strategic Plan, Delivery Program, and Resourcing Strategy. Progress is reviewed quarterly through the QBRS, tracking Delivery Program actions, workforce KPIs, and financial impacts to identify risks and variances early.
Outcomes and KPI trends are reported in the Annual Report, with actions refreshed as needed to respond to changes in CSP priorities, organisational needs, or budget settings. A comprehensive review is also undertaken as part of Council’s broader IP&R cycle to ensure the Workforce Strategy remains fit for purpose and aligned with long-term planning.
This structured approach ensures the Workforce Strategy remains responsive, evidence-based, and aligned with Council’s long-term planning framework.
It forms part of the greater Resourcing Strategy under the Integrated Planning and Reporting (IP&R) framework.
About this plan
Overview
The Hills Shire Council Asset Management Strategy has been prepared in accordance with the state government’s Integrated Planning and Reporting Framework requirements. It covers the 10-year period from July 2025 to June 2035.
Council is responsible for managing around $6.2 billion worth of infrastructure and community assets (including investment properties) that are used to provide services to the community. These assets include roads, bridges, community buildings, land, recreation and leisure facilities, drains, libraries, parks and playgrounds.
Council invests significant resources in constructing, maintaining, renewing and upgrading these assets to meet the needs of the community and enhance their quality of life. This strategy is a dynamic document that helps to guide Council’s activities and decision-making processes into the future.
The strategy is reviewed annually to ensure applicability in the changing environment and to incorporate community feedback.
Purpose
Background
Council adopted a funding strategy in 2011 to address the infrastructure backlog of $52 million using Council’s reserve funds. In 2016 the infrastructure backlog was reduced to zero and has remained at zero since. This is achieved through our financial settings and by spending on assets above benchmark levels.
The asset maintenance ratio (below) indicates that Council spends equal or greater than the required funds to maintain assets in a satisfactory condition. This is also well above the benchmark as Council simultaneously addresses and stops a backlog from growing.
Asset maintenance ratio achieved benchmark
The Asset Management Strategy aims to ensure that Council develops, implements, and manages a service-oriented, community-focused, and sustainable Asset Management Plan. This strategy offers strategic guidance for the planning, construction, maintenance, and operation of assets that are crucial for Council to provide services to the community.
It ensures that assets are delivered and managed in a cost-effective manner, that services are offered at an appropriate level, and that the impacts of future assets are considered during the decision-making process. Additionally, the strategy guarantees that assets are maintained to an adequate standard for both current and future users. It also identifies and plans for long-term needs, both technically and financially.
Relationship with other plans
The Asset Management Strategy is one of the components of the Resourcing Strategy, linking with the following plans and documents in accordance with the NSW State Government’s Integrated Planning and Reporting (IPR) Framework (diagram below).
Asset management framework
Our asset management framework follows key areas of asset management and guides our approach in the direction of future systems, processes and planning.
Asset management aims to optimise services to the community at a cost and risk that is acceptable. To assist in undertaking this we have developed various planning tools, the primary being the Community Strategic Plan, along with our asset and risk management plans, as well as the Long Term Financial Plan. Implementation is guided by the Asset Management Strategy and Asset Management Policy.
Asset Management Strategy
Infrastructure assets play a crucial role in planning and delivering Council services. Effective asset planning requires a well-informed Council, a management team and a supportive community. Since many assets have a long lifespan and require regular renewal, planning must consider the full costs involved in the lifecycle of each asset, to address both short and long-term needs.
To achieve effective asset management, it is important to develop an Asset Management Policy and Strategy that emphasises value for money. This
also helps Council engage with the community to strike a balance between service levels, risk, and costs, alongside the creation of Asset Management Plans.
This document outlines how Council will responsibly manage infrastructure assets over time and how those assets contribute to meeting the community’s needs. It has been prepared after reviewing Council’s service delivery practices, financial sustainability indicators, and asset management maturity, and aligns with Council’s vision for the future, as outlined in the Community Strategic Plan.
Asset management policy
Asset Management Policy
Council’s Asset Management Policy outlines Council’s vision and objectives for asset management, in alignment with the Community Strategic Plan and relevant legislation.
The purpose of this policy is to:
• Establish principles for asset management that enable effective service delivery
• integrate asset management with Council’s strategic planning
• maximise value for money through lifecycle costing and performance measurement
• assign accountability and responsibility for service delivery
• promote sustainability to safeguard the needs of future generations.
The vision of the policy is to ensure the long-term financial sustainability of Council by balancing community expectations for services with their ability to pay for infrastructure assets needed to provide those services. Council will develop and maintain asset management governance, skills, processes, systems, and data to provide the level of service the community needs. This approach will result in the most cost-effective and fit-for-purpose assets, both now and in the future.
Council acknowledges that assets are crucial to its service delivery to The Hills community. Council is committed to ensuring assets are appropriate for community needs and are maintained at the agreedupon levels of service within Council’s financial capacity. A full life cycle cost approach will be taken when acquiring future assets, deciding on asset renewal projects, and disposing of existing assets.
Council’s assets will be managed through the strategic asset management plan, using technology, data, appropriate methodologies, industry practices and consultation with the community to make informed decisions regarding the allocation of resources for providing, maintaining, renewing, and disposing of assets.
Principles
1. Council is committed to providing assets that enable it to deliver meaningful local government services and facilities at the required level of service in the most cost effective manner
2. Council’s asset management methodologies are based upon the The Institute of Public Works Engineering Australia (IPWEA) and the International Infrastructure Management Manual (IIMM) prepared by the Association of Local Government Engineering New Zealand
3. all relevant legislative requirements are to be taken into account in managing our assets
4. asset management is to be integrated into Council’s budgeting, planning and operational processes
5. our assets will be inspected to assess condition
6. community needs combined with the asset’s condition decide priorities for asset provision, maintenance, renewal and disposal
7. the acquisition of new assets have regard to the community’s needs as well as Council’s ability to fund future life cycle costs
8. risk is considered in the development of asset management strategies and actions
9. each category of assets will identify the weighted average ranking score to determine priorities.
Asset critical to Council’s operations
Asset classDescriptionService standards
Buildings Aged and disability service facilities, amenities and sports facilities, childcare and baby health centres, community centres, library facilities, Rural Fire Service and SES headquarters, Council operational centres, recreational and cultural centres, rented properties, Scout and Guide halls and swimming pool buildings.
Civil infrastructure
Waterways & stormwater systems
Roads, bridges (including road bridges, foot bridges, major culverts and observation decks), kerb and gutter, carparks, traffic management devices, street furniture, bus shelters and ferry.
Provide a portfolio of public buildings and facilities required for a range of functional, social, educational and recreational activities across The Shire.
Parks & recreational facilities
Stormwater pipes, stormwater pits and structures, minor culverts, gross pollutant traps, open channels, dams, basins, swales and rain gardens.
Provide well maintained roads and bridges which allow convenient and safe access to all. An efficient transportation system which provides economic and social benefits for residents, businesses and visitors.
Improve safety and the management of stormwater and waterways to control local overland flooding, reduce adverse environmental impacts from stormwater runoff and mitigate the impact of other associated infrastructure and properties.
Sporting facilities including play equipment, playground facilities and recreational facilities, irrigation, park lighting, open space furniture and water tanks.
Provides a variety of physical, social and environmental activities via a network of open space (passive and active recreational areas) to support the health and wellbeing of the community.
Pathways Footpaths, cycleways, walkways and tracks.Provides a safe and accessible pathway network that connects pedestrians to facilities in their community. Promotes and facilitates walking as an alternative to private vehicle usage and as a form of exercise and recreation.
Risk management strategies
ImpactsMitigation strategies
Buildings
• Changing usage requirements
• Potential hazards to the community
• Population increase and changing demographics
• Under or over utilisation of some buildings
• Legislative requirements
• Aging infrastructure
• Increase in community expectations
Civil infrastructure and pathways
• Asset defects potentially creating hazards to the community
• Population increase and additional loading on roads
• Legislative requirements
• Increase in community expectations
• Ongoing development and construction work impacting assets.
• Increase in heavy truck movements
Waterways and stormwater
• Flooding, scouring or surcharge due to insufficient hydrological capacity
• Sinkholes, subsidence or blockages to network
• Ongoing development and construction work impacting assets and waterways
adings
• Disaster Recovery Plan which focuses on buildings which are considered critical for the on-going delivery of Council’s services
• Routine asset assessments and defect inspections
• Proactive maintenance programs and inspections
• Planned renewal programs
• Community engagement and service level agreements
• Sustainability and cost reduction initiatives
• Continuous improvement of Asset Management Plans
atructure & Pathways
• Use of camera based automated pavement and infrastructure data collection (laser profilometer and visual) for detailed assessments
• Routine asset assessments and defect inspections
• Proactive maintenance programs
• Planned renewal programs
• Appropriate community engagement
• Continuous improvement of Asset Management Plans
aer
• Asset condition assessment through a CCTV and physical inspection program
• Investigation of the system to determine the hydrologic level of service
• Ongoing overland flow and flood investigations
• Proactive maintenance programs
• Planned renewal programs
• Continuous improvement of Asset Management Plans
aer
Parks and recreation
• Playgrounds exceeding recommended useful lives
• Potential hazards to the community
• Population increase and changing demographics
• Legislative requirements
• Over utilisation of some parks facilities, particularly sportsfields
• Increase in community expectations
• Growth in non-traditional sports
• Routine asset assessments and defect inspections
• Annual safety audits of playgrounds
• Proactive maintenance programs
• Planned renewal programs
• Sustainability and cost reduction initiatives
• Continuous improvement of Asset Management Plans
Improvement actions
The Asset Management Strategy proposes strategies to enable the objectives of the Strategic Plan, Asset Management Policy and Asset Management Vision to be achieved.
No.ActionDesired outcome
1Develop and annually review Asset Management Plans covering at least 10 years for all major asset classes.
2Develop a Long Term Financial Plan covering 10 years incorporating asset management plan expenditure projections with a sustainable funding position outcome
3Incorporate Year One of the Long Term Financial Plan revenue and expenditure projections into annual budgets
4Review and update asset management plans and long term financial plans after adoption of annual budgets. Communicate any consequence of funding decisions on service levels and service risks
5Report Council’s financial position at fair value in accordance with Australian Accounting Standards, financial sustainability and performance against strategic objectives in annual reports
6Ensure Council’s decisions are made from accurate and current information in asset registers, on service level performance and costs and ’whole of life’ costs
7Report on Council’s resources and operational capability to deliver the services needed by the community in the annual report
8Ensure responsibilities for asset management are identified and incorporated into staff position descriptions
9Implement an improvement plan to realise ‘core’ maturity for the financial and asset management competencies within 5 years
Identification of services needed by the community and required funding to optimise ‘whole of life’ costs
Sustainable funding model to provide Council services
Long term financial planning drives budget deliberations
Council and the community are aware of changes to service levels and costs arising from budget decisions
Financial sustainability information is available for Council and the community
Improved decision making and greater value for money
Services delivery is matched to available resources and operational capabilities
Responsibility for asset management is defined
Improved financial and asset management capacity within Council
Future demand
Factors affecting demand include changes in population, demographics, consumer preferences, technology, economics, seasonal patterns, regulatory policies, vehicle ownership rates and environmental awareness.
Northwest Growth Centre
The Hills Shire is a part of the Greater Sydney Region’s Central City District which includes Parramatta, Cumberland and Blacktown local government areas. The district plays a vital role in providing housing and driving economic growth. It is expected that the population of the district will reach 1,521,500 people by 2036, which is an increase of almost 60% (550,500 people) compared to the district population of 970,000 in 2016.
To cater for the growing demand for air travel from existing and future residents of the district, the Western Sydney Airport is being built. This airport is crucial to facilitating long-term growth in the region. Council is in support of planning and delivering key infrastructure items that will improve both vehicular and public transport connections to the Western Sydney Airport, including:
• The M9 Motorway (Outer Sydney Orbital) extending from the Central Coast through to the Illawarra, west of the future airport
• the M12 Motorway providing a link to the airport by connecting the M7 Motorway and the Northern Road
• continuation of the Sydney Metro to the south, from Cudgegong Road to St Marys and the Western Sydney Airport. This rail infrastructure would connect into the South West Rail Link extension and would complete this ‘missing link’ in the rail network.
These items have been identified for investigation over the next 10 years in the Future Transport 2056 Services and Infrastructure Plan (2018) by the NSW Government for Greater Sydney and Central City District.
Other infrastructure projects that require a higher level of commitment to unlock potential, improve access to employment opportunities and support population growth include the Western Sydney light rail, which includes a connection between Parramatta and Castle Hill, and an arterial road connection via Annangrove Road to connect the North West Growth Centre to Hornsby or the Sydney CBD.
The Department of Planning and Environment for the North West Priority Growth Area has completed work that shows the release area can accommodate 90,000 dwellings, which is 20,000 more dwellings than originally identified. Due to the increase in population and the additional demands this will place on the existing transport network, it is important to prioritise investigating and setting aside land for this arterial link.
Traffic congestion is a major problem and is expected to worsen over the next 10 to 15 years as more than 60,000 planned dwellings are constructed in the North West Growth Centre. Investing in regional infrastructure through links and better direct access to motorways will be critical in freeing up capacity on local roads, other than trains. With urban development and population growth of this scale, maintaining the rural character and lifestyle of The Hills Shire, accommodating this growth, and creating a sustainable environment, community, and economy for the benefit of the current and future populations pose significant challenges.
Impact of trends
The expected growth in population, residential areas, business, and commerce has a direct impact on the demand for services. This increase results
in a higher demand for assets to support these services. Council faces some challenges in this regard, such as:
• ensuring that there are enough funds to operate, maintain, and replace new assets
• maintaining existing infrastructure to an acceptable level of service
• keeping up with the demand for new and improved services from the growing community
• upgrading assets to comply with new environmental and safety standards
• managing increased traffic congestion and dependence on motor vehicles
• maintaining the quality of our environment, including open spaces and rural settings.
The projected increase in population will have a significant impact on the existing and future assets of Council. The primary impact will be an increase in usage associated with the population increase. However, the less obvious challenge will be to ensure that the asset base is appropriate and necessary to meet the demands and requirements of the changing LGA profile. These challenges will not only centre on the capacity of the asset but also its appropriateness to provide a service to the community.
The rate of growth also challenges Council’s ability to add new infrastructure to the network. For example, in the Box Hill release area, Council is responding to community needs by accelerating the planned installation of new intersections in key locations. However, this brings forward both the capital and the recurrent maintenance expenditure.
Demand management strategies
Demand management strategies offer ways to maximise utilisation of existing assets by modifying customer demands instead of creating new assets.
Community Buildings
• Develop a buildings and facilities management strategy
• encourage sharing of facilities with government agencies (i.e. schools).
Civil
Infrastructure
• Continue lobbying the NSW Government to improve the capacity of the state road network
• promotion of public transport
• encouraging alternate modes of transport including cycling and walking
• conducting community education.
Waterways and Stormwater Systems
• Onsite stormwater retention (i.e. rain gardens and bio-swales)
• improvements in water quality control
• water sensitive urban design
• stormwater harvesting.
Parks and Recreational Facilities
• Comply and implement a recreation strategy
• multi use of recreational facilities
• improved/upgraded lighting to maximise training opportunities
• encouraging public and private sector co-share infrastructure.
Asset management plans
Current state of our assets
Council’s infrastructure assets are valued approximately $2.6 billion (excluding bulk earthworks) as at 30 June 2025. Council also has $3.1 billion worth of land consisting of operational land, community land and land under roads. These assets support the delivery of services to the community.
Percentage of total replacement cost
The graph to the right shows the value of Council’s built assets by asset class, expressed as a percentage of the $3.0 billion gross replacement cost.
$3.0B*
* Community assets excluding land and bulk earthworks as at 30 June 2025.
A significant proportion of Council’s asset portfolio is relatively new and does not currently require major renewal investment. As these assets mature, however, Council will need to adjust its management approach to ensure assets continue to deliver expected levels of service. A clear understanding of how each asset supports service delivery is essential to maximising the value of past investments and ensuring future expenditure is well-targeted and cost-effective.
Each year, Council allocates dedicated funding within the recurrent budget for capital improvements and asset renewal. This funding is distinct from allocations for routine maintenance and transfers to asset replacement reserves, providing transparency in financial planning and supporting long-term sustainability.
Infrastructure funding is prioritised and allocated in accordance with Council’s Financial Charter, which guides responsible investment, promotes long-term financial sustainability, and ensures alignment with community priorities.
• Priority is given to asset renewals to ensure that existing infrastructure is maintained at expected service levels. This is under Financial Charter 3
• all capital expenditure project proposals undergo lifecycle cost evaluations, which include construction, maintenance, operations, and transfer to reserves for replacement, as per Financial Charter 3
• identify the source of funds for new capital expenditure projects to reflect the timing of the receipt of funds, under Financial Charter 3
• if a continuous income source can be identified to service the debt, borrowing will
• be considered for new capital projects, as per Financial Charter 3.
Asset valuation
Council’s non-current assets are progressively revalued to fair value in accordance with a staged approach endorsed by the Office of Local Government.
Valuations of Council’s infrastructure assets are undertaken in compliance with the relevant Australian Accounting Standards, including:
• AASB 13 – Fair Value Measurement
• AASB 116 – Property, Plant and Equipment
• AASB 5 – Non-current Assets Held for Sale and Discontinued Operations
• AASB 136 – Impairment of Assets
• Local Government Code of Accounting Practice and Financial Reporting
Council periodically conducts comprehensive assessments of the current replacement cost of assets across all major asset classes. These include open space and recreation assets, civil infrastructure, pathways, waterways, stormwater drainage systems, and buildings. The findings from these assessments directly inform the information presented in this Asset Management Strategy.
These processes support improved decision-making by providing accurate and up-to-date asset data, which underpins the development of targeted and sustainable renewal works programs. As part of Council’s continuous improvement framework, regular condition assessments are undertaken for each asset class. The outcomes of these inspections are used to prioritise projects within the Annual Capital Works Renewal Program, ensuring resources are allocated efficiently and in alignment with Council’s asset management objectives.
Asset condition
Council conducts regular inspections of the assets it manages to monitor performance and ensure they continue to meet required service standards. The condition of an asset at any point in time is influenced by a range of factors, not only material deterioration. Elements such as design, construction quality, environmental conditions, and operational loading all affect how an asset performs over its lifecycle.
Assessing an asset’s condition remains the most practical and reliable method for understanding its current functionality and estimating its remaining useful life.
A condition assessment provides three key outputs:
• Performance insight: It helps determine how well assets are currently performing and the extent to which they meet designated service levels.
• Valuation accuracy: It informs the fair value of assets by identifying the rate at which service potential is being consumed (depreciation) and refining estimates of remaining useful life.
• Strategic planning input: It provides essential data for the strategic asset management process, particularly in prioritising renewal investment and guiding the development of renewal programs.
Condition rating of Council’s assets
Condition ratingDescription of condition
1 – Excellent/ very good No work required (normal maintenance)
2 - Good Only minor maintenance work required
3 - Satisfactory Maintenance work requiredto return to accepted level of service
4 - Poor Renewal required*
5 - Very poor Urgent renewal/upgrade required or asset requires replacement
Asset condition profile
The graph (below) shows the overall condition of Council’s assets as a percentage of the overall replacement cost.
• Floodplain Development Manual –The Management of Flood Liable Land, NSW Government April 2005
• Local Government (General) Amendment (Stormwater) Regulation 2006 under the Local Government Act, 1993
• Native Vegetation Act, 2003
• Noxious Weeds Act, 1993
• NSW Civil Liability Act, 2002
*Council sets the condition standards for each asset.
Assets rated ‘poor’ are prioritised in the coming year’s Works Program.
• NSW Companion Animals Act, 1998
• NSW Crown Lands Act, 1989
• NSW Environmental Planning and Assessment Act, 1979
• NSW Heritage Act, 1997
• NSW National Parks and Wildlife Act, 1974
• NSW State Emergency and Rescue Management Act, 1989
• NSW Water Management Act, 2000
• Protection of the Environment Administration Act, 1991
• Protection of the Environment Operations Act, 1997
• Rural Fires Act, 1997
• Threatened Species Conservation Act, 1995
Community buildings
The condition of Council’s buildings is determined using the average Service Potential Index (SPI) for each asset component, derived from the most recent condition assessment program. Component level ratings are aggregated to form an overall condition rating for each building.
Service standard - priority ranking and identification of projects
Condition ratings are assigned to individual components within a building, and these are combined to calculate the building’s overall condition rating. Council’s service standard for building assets is to maintain an overall condition rating of 1 or 2, reflecting assets that are in good or very good condition.
Some buildings may receive a condition rating of 3, indicating that aspects of the asset require intervention. In such cases, a review is undertaken to determine the scope of works needed to return the building to a condition rating of 2.
Generally, buildings should not fall into condition rating 4 unless they have been identified as special assets, for example, buildings scheduled for redevelopment, disposal, or limited operational use.
Management of reactive works Management of proposed assets Management of existing buildings
The assessment of current building assets is carried out using the following combination of methods:
1. A strategic life cycle maintenance plan
2. annual reviews of condition ratings and comprehensive assessments during asset class revaluations
3. site visits during strategic planning and project delivery
4. feedback by users or the community at large
5. planned and reactive capital work requirements
Proposals to add or remove buildings are assessed the following combination of ways:
1. The rolling 4 x year capital works plan
2. section 7.11, Section 7.12 and grant funded works
3. land development plans
4. social and economic benefit analysis review
5. prioritised work via reactive requests
Reactive capital expenditure requests are assessed the following combination of ways:
1. The demand based on population and demographic data
2. the participation, functionality and use expectations
3. the capital, operational and life-cycle costs
4. the overall risk profile
5. the current level of service
To support informed decision making throughout the building asset lifecycle, Council undertakes periodic assessments as part of its ongoing monitoring processes. These assessments identify priorities of required works. This approach enables Council to understand short to medium term renewal needs and the financial commitments necessary to maintain expected service levels for the community.
The assessment process is continually refined and informs the development of Council’s rolling multi year capital works program, ensuring renewal activities are planned proactively and aligned with strategic asset management objectives.
Council’s administration building at Columbia Court, Norwest
Civil infrastructure
Kerb and gutter1,458.04kms$290.85M
Roads1,065.45kms$914.31M
Traffic management devices2,552each$74.89M
Civil infrastructure condition
Total current replacement cost of Council’s civil infrastructure $1,490M
The average condition of civil infrastructure 1.82
There are various methods utilised to undertake condition assessments for the civil infrastructure assets and is dependent on the asset class of the assets. Various methods of asset condition inspections that are currently implemented at The Hills Shire Council as discussed in the table.
Priority ranking
Council develops its draft four year Works Program using inputs from the Strategic Asset Management System, network classifications, community requests, identified risks, and operational field observations. Assets identified through this process undergo validation and inspection, after which they are prioritised based on condition, functional performance, location, criticality, and associated risk exposure.
The outcomes of these assessments, together with the resulting recommended actions, are integrated into Council’s broader renewal and maintenance programs. These programs may also incorporate related ancillary activities, such as safety improvements, where necessary to support asset performance and network sustainability.
Council maintains an ongoing assessment regime across its transport and civil infrastructure portfolio, including roads, kerbs and gutters, traffic management devices, car parks, bridges and bus shelters. The findings from this continuous monitoring ensure that renewal and maintenance works are prioritised consistently and aligned with Council’s strategic asset management objectives.
Kerb & gutter Roads
Condition assessment methodology:
Condition assessments of Council’s road network are undertaken using a combination of specialised external service providers and Council’s asset management team. External providers utilise laser-based roughness and rutting measurements, supplemented by video-based inventory and condition surveys. In parallel, Council’s asset management team conducts routine comprehensive visual inspections.
Condition assessment methodology:
Condition assessments are undertaken through a combination of visual comprehensive inspections conducted by Council’s asset management team and/ or video-based inventory and condition surveys carried out by specialised external consultants.
Bridges
Condition assessment methodology:
Comprehensive Level 2 structural inspections of Council’s road bridges are undertaken by qualified external consultants to ensure detailed assessment of structural integrity, performance, and compliance with relevant standards.
In addition, Level 1 inspections of pedestrian bridges and observation decks are carried out by Council’s asset management team. These inspections provide routine oversight of asset condition, safety, and emerging maintenance needs.
Bus sheltersCarparksTraffic management devices
Condition assessment methodology:
Visual comprehensive inspections are undertaken by Council’s asset management team for all assets owned and directly managed by Council.
New projects
Condition assessment methodology:
Visual comprehensive inspections are undertaken by Council’s asset management team to evaluate the condition, functionality, and performance of Council-owned assets.
Proposals for the construction of new civil infrastructure assets are generated in response to the release and development of emerging growth areas. Funding for these new assets is typically sourced from relevant development contribution plans or voluntary planning agreements, ensuring that infrastructure delivery aligns with urban expansion and growth-related demand.
Identification of projects
Council collects and maintains detailed asset condition data for its road network, including indicators such as cracking, rutting, roughness, stripping, and other surface defects. These condition parameters are recorded, scored, and analysed to determine overall pavement performance and network condition.
The scores derived from these assessments form part of a broader decision-making matrix used to identify the most appropriate treatment options for
Condition assessment methodology:
Condition assessments are undertaken through a combination of visual comprehensive inspections conducted by Council’s asset management team and/or video-based inventory and condition surveys carried out by specialised external consultants.
each section of road. This process considers a range of additional factors, including identified defects and deterioration trends, projected traffic growth and network usage, historical treatment performance, planned urban growth and land-use changes.
The resulting recommended treatments are incorporated into Council’s Works Program, which sets out planned road maintenance, rehabilitation, and improvement activities.
While prioritisation based on current condition data is valuable for short-term asset management, forecasting longer-term renewal needs can be challenging due to factors such as latent structural defects, climatic impacts, and variability in traffic loading over time.
Funding assistance for road safety and traffic management projects is often supplemented by Federal and State blackspot or safety grant programs, which target locations with a history of crashes or demonstrable safety risks. In new
development areas, required traffic facilities are generally funded through developer contributions. In established areas, projects are commonly supported through a mix of external grants and Council’s own revenue streams.
Road treatment types
Treatments applied to urban road segments
• asphalt concrete correction and resheet
• asphalt concrete resheet
• full-depth mill and fill
• major patching followed by asphalt concrete correction resheet
• patching followed by asphalt concrete correction resheet
• patching and rejuvenation treatment
• rejuvenation treatment
• microsurfacing
• single or double coat spray seal
Treatments applied to rural road segments
• two coat spray seal
• patching followed by two coat spray seal
• major patching followed by two coat spray seal
• pavement stabilisation followed by two coat spray seal
The results of road condition assessments are used to inform the development of Council’s Draft Works Program and to update the Asset Management
System, ensuring that future decisions are supported by current, reliable, and evidence-based data. Ongoing monitoring of treatment performance, together with customer feedback and observed asset behaviour, supports the application of continuous improvement principles across Council’s asset management practices.
Prioritising projects using condition-based data ensures that the most cost-effective and appropriate treatments are delivered at the optimal point in each asset’s lifecycle. However, prioritisation beyond the first year of the Works Program can be challenging due to factors such as latent structural deterioration not detectable through surface inspections, prolonged wet weather, and variations in traffic volumes and loading patterns.
Council’s strategic planning for traffic facilities is informed by population growth projections and continuous monitoring of intersection and carriageway service levels. Funding for traffic safety projects is frequently supplemented through Federal and State blackspot and road safety grant programs. In new development areas, traffic facilities are generally delivered through developer contributions, while works in established areas are funded through a combination of external grants and Council revenue.
Waterways and stormwater
Waterways and stormwater asset condition
Total current replacement cost of Council’s stormwater network $505M
The average condition of waterways and stormwater system assets, based on the sample data collection 1.70
Stormwater drainage assets are durable assets mainly constructed beneath the surface level. This reduces the likelihood of network failures caused by human error or interference, unlike other asset classes. Council continuously monitors this system using both passive and active methods to ensure the network’s integrity. Passive monitoring involves CCTV or camera-based network surveys, which help identify issues such as cracking, spalling, joint displacement, or root intrusions. Active monitoring involves localised flood monitoring at the surface and assessing the indirect impact on assets, such as high moisture content in the road pavement. Council also conducts operational activities, including gross pollutant trap (GPT) and pit basket cleanups, to manage stormwater quality consistently. Since 2019-20, Council has been inspecting around 2% of the pipe network CCTV each year. When new subdivisions are created, CCTV assessments of the new stormwater drainage assets are required before they are transferred to Council. This ensures that the new assets meet Council’s design standards, comply with the work-as-executed drawings, and exhibit an acceptable quality of finish before they are transferred to Council.
Priority ranking
The criteria listed are utilised to evaluate each asset. These scores then establish a priority ranking for comparison with all other projects.
CriteriaWeighting
Identification of projects
The annual waterways capital works program assesses each project based on established risk criteria. The program should be flexible enough to include high-priority projects that may arise after a storm or any unforeseen natural event.
Maintenance hotspot1
Customer requests0
Proactive intervention is essential to minimise potential consequences, but this can only be carried out once the condition and performance of the buried stormwater system is known. For example, the consequences may lead to urban flooding or surface subsidence due to structural or system failures within the buried stormwater system. There is also the risk of erosion and the total collapse of creek banks related to natural waterways. Council’s dam surveillance assessments also identify unscheduled projects that need to be included in the program. As a result, the program must be responsive to potential consequences while ensuring that listed projects remain a priority.
Parks & recreational facilities
Total current replacement cost of Council’s parks infrastructure $244M
The average condition of parks and recreational facilities 1.75
Asset condition
Assets within this category are assessed using both internal and external resources. Council’s asset management team undertakes ongoing condition and hazard assessments to ensure assets remain safe, functional, and compliant with service level expectations. For high-use assets, such as playgrounds and associated play equipment, specialist external consultants are engaged periodically to undertake detailed condition and defect inspections. This approach enables Council to proactively manage assets that carry higher utilisation, higher risk, or greater community expectations.
As part of routine asset revaluation processes, condition assessments are undertaken across all parks, open space, and recreational facilities. These assessments are completed using a combination of internal asset management staff and qualified external contractors to ensure consistency, accuracy, and robust technical evaluation.
Priority ranking
Each asset is evaluated against a set of defined criteria, with scores assigned on a scale from 1 to 5. These scores are then multiplied by weighting factors to generate an overall priority ranking. The resulting priority scores allow comparison across all park and open space projects and guide the allocation of renewal and upgrade funding.
Identification of projects
Projects identified through strategic planning documents, such as recreation strategies, and through routine asset inspections are assessed and ranked for inclusion in the Works Program. While the prioritisation framework ensures an evidence-based approach, projects may occasionally be elevated in priority where they address identified safety risks, respond to significant community expectations or concerns, support critical service level requirements. This ensures that Council’s investment decisions remain both strategic and responsive to community needs.
Pathways assets
Footpaths689.07km$162.13M
Shared pathways145.33km$56.94M
Walkways18.65km$8.11M
Total current replacement cost of Council’s pathway network $227M
The average condition of pathways 1.59
Council manages a large network of pathway assets. Regular assessments are undertaken to ensure pathways safety and functionality. The assessments help determine the condition of pathways, identifying issues such as cracks, uneven surfaces, or other defects that may pose safety risks to users. Using the data from assessments and factors such as risk, asset criticality and location, Council determines the renewal priorities for the pathway network. This ensures that resources are allocated to the most critical areas that require attention.
The ranking system for footpaths follows a methodology similar to that used for other asset classes, but employs a slightly different mathematical approach. The evaluation process involves awarding points based on a checklist, with a predefined maximum score. The criteria related to location carry the highest weight in the assessment. While each criterion includes a risk analysis, the location significantly influences public safety.
ConnectivityScore
Identification of projects
Council has developed a footpath strategy that identifies the roads where footpaths are to be constructed on one or both sides, as well as local roads that are not prioritised for footpath provision. The strategy aims to ensure that older urban areas are progressively upgraded to achieve a level of pedestrian infrastructure comparable to that provided in newer subdivisions.
The introduction of the Sydney Metro has created additional transport options for residents, and Council continues to work collaboratively with Transport for NSW and other government agencies to deliver a connected and accessible pathway network around key transport nodes.
Council periodically reviews its Pedestrian Access and Mobility Plan (PAMP) and Bike Plan to reflect current network conditions, community expectations, and future growth. These reviews provide the community with a clear understanding of the existing pedestrian and cycling network and offer opportunities to contribute to the planning of an improved and integrated pathway system.
Works program
Footpaths
Caddies Creek Bridge (approach), North Kellyville - between Ross Place and Edwards Road - design (CP13NKB01) 13D$789,314
Castle Hill Showground, Castle Hill - pedestrian bridge design (WICR0734)D$462,406
McCall Parkway Reserve, Box Hill - opp. intersection of Terry Road and Rubidea Street - dDesign (CP15LOCALBHLP09) 15D$100,000
North Kellyville Public School - synthetic playing field - near Hezlett Road and Curtis Road - design (CP13NKLPF03) 13D$313,558
The Water Lane Reserve, Box Hill - playing fields (CP15BHPF06)15C$14,139,290
Wisemans Ferry, Wisemans Ferry - restore totems for convicts and early history monument D&C$30,000 2024-25
*D: Design | C: Construction | D&C: Design & Construction
(CP17CHNRT11)
Edwards Road to Ross Place, North Kellyville - Road and Bridge Upgrade Design (CP15BRNKB01) 15D$87,934
Glenhaven Road from Samantha Riley Drive to Glenhaven Road Bridge, North Kellyville - Four Lane Upgrade Design (CP13NKNR05) 13D$408,265
Old Castle Hill Road Upgrade Design, Castle Hill - from Eric Felton Reserve to Gilham Street (CP17CHNRT10) 17D$671,145 River Road - Rural length treatment (S94ART0064)94AD&C$200,000 River Road Embankment Stabilisation and Drainage Works along Various Sections of River Road 16 sites (AGRN1025) D&C$4,255,532
River Road, Leets Vale - Embankment Failure at CH20040 to CH20100 (AGRN1119 April 2024) D&C$595,614
River Road, Leets Vale - Embankment Stabilisation Design at Chainage 16330D$92,950
Mount Carmel Drive, Box Hill - signalised intersection at Mount Carmel Drive/Old Pitt Town Road/Valletta Drive (CP15BHR05) 15C$7,962,429
Mount Carmel Drive/Valetta Drive/Old Pitt Town Road, Box Hill - signalised intersection - design (CP15BHR05) 15D$137,541
Olive Street/Central Place, Baulkham Hills - upgrade existing pedestrian crossingsD&C$270,000 Terry Road/George Street, Box Hill - roundabout15C$5,478,867 Terry Road/George Street, Box Hill - roundabout design (CP15BHT12)15D$303,713
The Water Lane/Grandhill Parkway, Box Hill - signalised intersection - design (CP15BHT20) 15D$95,152
The Water Lane/Hynds Road, Box Hill - signalised intersection - design (CP15BHT14)15D$99,632
*D: Design | C: Construction | D&C: Design & Construction
continued
FY 2025-26 Potential carryover projects (MULTI-YEAR) (only unspent funds as at 30 June 2026 will be carried over)
BUDGET as at FEB 26
The Water Lane/Mason Road, Box Hill - signalised intersection - design (CP15BHT13)15D$99,632
The Water Lane/Nelson Road, Box Hill - signalised intersection - design (CP15BHT15)15D$99,632 The Water Lane/Outback Street, Box Hill - roundabout (CP15BHR08)15C$3,167,393 Withers Road/Mungerie Road, Beaumont Hills intersection - roundabout (S94ART0034)94AC$700,000 2025-26 TRAFFIC BUDGETS AS AT FEB 2026
Waterways
2026-2027 Section 7.11
www.thehills.nsw.gov.au
3 Columbia Court Norwest NSW 2153 PO Box 7064, Norwest 2153 P +61 2 9843 0555 E council@thehills.nsw.gov.au
If you do not speak English and need an interpreter, contact the Translating and Interpreting Service on 131 450 and ask them to call Council on 9843 0555.