Section I: The Origins of Redlining
Coloring Inside the Lines: How Did the Government See Risk?
By the end of the Great Depression, few middle-class workers were able to buy homes due to banks requiring 50% down payment, and interest-only payment, which led to large spikes in mortgage prices since the principal is only paid off after the first several years of paying just the interest; in this way, full repayment of the loan occurred within five to seven years.18 In an attempt to prevent homes that were about to enter the principal-paying stage from defaulting, President Franklin Delano Roosevelt’s administration created the Home Owners’ Loan Corporation (HOLC) that purchased and issued new mortgages that were amortized and had longer payment schedules, and to further help workers attain homes, the Federal Housing Administration was then created to insure bank mortgages.
19
The FHA’s main role was to determine which mortgage loans were at a low risk of defaulting, but this unfortunately translated to the idea that racial segregation was a necessity to determine who could qualify for the government's mortgage insurance program; in fact, residing in integrated neighborhoods or even being near Black neighborhoods meant the property was too risky to insure.20 This idea furthered the concept that race was a metric determining “trustworthiness” (since that was the quality banks were screening for) and also played a significant role in maintaining the belief that skin color could measure one’s characteristics. Some argue that these are standard practices for insurance since realistically, there can only be a certain proportion of defaults before the system collapses. As Leo Jordan, a former vice president of State Farm Insurance Co. once said, “What you have are neutral underwriting rules
18 Rothstein, The Color, 63-64.
19 Rothstein, The Color, 64.
20 Rothstein, The Color, 65.
that have a disproportionate impact upon minority, urban residents.”21 Could it be possible that in the same way, appraisers are not actively discriminating but rather putting into writing the reality that predominantly minority neighborhoods generally have worse conditions, greater gang presence, and higher rates of crimes committed?22 In several cases, this fact cannot be denied; not all redlined areas were unjustly marked, and despite the fact that race was a consideration, it was also not the only factor guiding their decisions. After all, how could color make or break a grading?
As it turns out, the practice does deserve the censure it receives. While agents marked green the middle-class suburban area of Ladue in St. Louis for having “not a single foreigner or negro,” an equivalent wealthy, middle-class area was marked red for having “the colored element now controlling the district.”23 At the hands of just a few people, a whole neighborhood became stripped of access to mortgages and other necessary financial services and gained considerable obstacles to creating generational wealth, all because of the color of their inhabitants.
Further evidence of racial considerations being ingrained in the roots of redlining can be found in the FHA underwriting manuals, the instructions that standardized how appraisers evaluated mortgage risk. The instructions were not subtle, either; the manuals featured several explicit references to race, including one that declared, “If a neighborhood is to retain stability, it is necessary that properties shall continue to be occupied by the same social and racial classes. A change in social or racial occupancy generally contributes to instability and a decline in
21 Michael Hudson, Merchants of Misery, 20.
22 Steve D. Boilard, "Redlining," in Civil Rights Movements: Past and Present, 2nd ed., https://online-salempresscom.harker.idm.oclc.org/articleDetails.do?bookId=1086&articleName=CivRight2e_0284&searchText=redlining&s earchOperators=exact&category=History
23 Rothstein, 64.
values.”24 In essence, according to the manual, the mere presence of integration was a valid enough reason to give a neighborhood a lower grade, and by extension, permanently hinder its residents’ ability to access resources essential for growing wealth. Like the HOLC, the FHA had to determine which mortgage loans were at low risk of defaulting. Unfortunately, this meant that racial segregation was a necessity to qualify for the government's mortgage insurance program; in fact, residing in integrated neighborhoods or even being near Black neighborhoods meant the property was too risky to insure.25
Perhaps one of the most pernicious effects of redlining was not even the maps. While conventional analysis of the practice commonly discusses the influence of racism on redlining, many scholars also consider the opposite: how redlining modified racism. As Adrienne Brown mentions, “Whiteness was increasingly understood as not merely a trait belonging to specific persons but as a neighborhood’s most valuable amenity, to be preserved at all costs, while blackness was deemed illiquid, presumed to devalue all it touched, neighbored, or possessed.”26
Despite the progress made toward eliminating segregation with the passage of the Fair Housing Act of 1968, the government’s attempt to make homes more accessible across socioeconomic classes ended up only initiating the trend of implicit redlining and setting additional hurdles for communities of color. Unfortunately, one act to push class equality forward created a push backward for racial equality.
Redlining’s Legacy: Financial Withdrawal
24 Federal Housing Administration, Underwriting Manual: Underwriting and Valuation Procedure under Title II of the National Housing Act, (2.9.937), 1938, accessed February 12, 2026, https://www.huduser.gov/portal/sites/default/files/pdf/Federal-Housing-Administration-Underwriting-Manual.pdf.
25 Rothstein, The Color, 64.
26 Adrienne R. Brown, The Residential Is Racial : A Perceptual History of Mass Homeownership (Stanford University Press, 2024), 4.
In 1968, the government officially ended de jure redlining, which is to say that including race as a measurement for one’s risk was no longer legal; in practice, however, it continued (in what is called de facto redlining, a topic this paper will cover a little later).27 From this, the system solidified the race barrier to accessing capital already established in writing, keeping race as a barrier to necessary capital even after the abolishment of the written law.
At this point, if a neighborhood was not already impoverished at the time of receiving its color grade, the effect of redlining on a neighborhood (especially for yellow and red ones) had already made it so; in other words, the HOLC’s grade created self-fulfilling prophecies by starving affected areas of capital. One study that explored how those born decades later were affected by HOLC boundaries drawn in the 1930s saw that the difference in adults’ income, probability of living in poverty, probability of reaching higher income brackets, and credit scores were statistically significant and had a causal relationship with the ratings given to the person’s neighborhood, which the authors note is a result of disinvestment in those communities.28 Since race comprised a significant portion of risk, these mortgages that initiated wealth growth for the middle class only saw their intended effects in white, wealthy areas. As time passed, this effect compounded as white households gained insured access to assets that appreciated whereas redlined neighborhoods were forced to pursue alternatives that not only did very little for building their credit but also oftentimes destroyed them financially.
Since redlining was enacted in 1930, large banks such as Wells Fargo and Bank of America began restricting services and even leaving red and yellow areas, though they returned in the 2000s in a process known as “reverse redlining” where, unlike the original redlining which
27 Rothstein, The Color, 17.
28 Daniel Aaronson et al., "The Long-run Effects of the 1930s HOLC 'redlining' Maps on Place-based Measures of Economic Opportunity and Socioeconomic Success," Regional Science and Urban Economics 86 (January 2021): 10-11, accessed February 11, 2026, https://doi.org/10.1016/j.regsciurbeco.2020.103622
effectively removed residents’ access to more reliable banks, branches of such banks would purposefully enter redlined neighborhoods to give out subprime loans, a practice that became especially common leading up to the Great Recession in 2008.29 Alternative financial services are a hallmark of the fringe economy, known as a market catered toward an underbanked and low-income customer base with services often costing more than they would through mainstream financial channels.30 One of their rather insidious effects is the opportunity cost that came with using such services; those living in redlined areas developed a lack of credit history, mainly from their deprivation of any long-term loans or traditional mortgages that would have generated years, even decades of evidence of their relationship with the banking industry, ironically causing them to grow dependent on services more expensive than the ones less impoverished communities could afford. With over 7,148 neighborhoods (affecting approximately 11 million people) marked “hazardous” in total at the time, this led to severe disinvestment that would one day fuel the downfall of the modern financial system.
31
In order for one to own a home and take out loans in its name, they needed to have insurance on the home; otherwise, the bank risked losing the collateral, or the asset they would receive if the borrower were to default on the loan, to hazards such as house fires and have no way of recovering the lost money. These loans often funded businesses, mortgages, and other activities that brought in wealth into a community; therefore, the lack of them also served to stagnate a local economy and accumulate disinvestment. According to the Federal Reserve Bank of Chicago, even over a decade later, in 2017, only 9% of Blacks had both a mortgage and
29 "Predatory Lending and Reverse Redlining," Milberg, accessed March 31, 2026, https://milberg.com/practiceareas/consumer-fraud/predatory-lending-reverse-redlining/.
30 Mahon, "Tracking 'Fringe," Federal Reserve Bank of Minneapolis.
31Sarah Appleton et al., "MapMaker: Redlining in the United States," National Geographic, accessed February 11, 2026, https://education.nationalgeographic.org/resource/mapmaker-redlining-united-states/
insurance in comparison to the 84% of White people in the census.32 Furthermore, data from the FDIC’s 2017 survey of unbanked (referring to those without an account at a bank insured by the FDIC) and underbanked households (referring to those that have said bank account but rely heavily on alternative financial services) shows that of the 8,402,940 unbanked households recorded in the U.S., 16.9% of them were Black and 14.0% of them were Hispanic in comparison to the 2.5% and 3.0% of Asian and White households, respectively, that were underbanked.33 While the HOLC’s and FHA’s maps may have been created back in the 1930s, several decades later, censuses still show the disparities in financial access across race that were unremedied, or even intensified, by such practices. Indeed, despite the importance of obtaining a mortgage and home insurance to accessing important banking services, we can see that there is a racial discrepancy in access to such necessities a fact that attributes itself to the myriad of obstacles, including redlining policies that not only had detrimental effects on the credit scores of those in red or yellow neighborhoods, causing them to incur on average $1,996 more in property insurance solely due to their score.34 On top of that, years of modern segregation and white flight from crowded urban areas leading to Central Business Districts (CBD), areas within cities where most employment occurs, have geographically isolated Blacks and Hispanics from labor market opportunities.35 Even if one managed to raise their socioeconomic status despite these
32 Shanthi Ramnath and Will Jeziorski, "Homeowners Insurance and Climate Change," Federal Reserve Bank of Chicago, last modified September 2021, accessed March 21, 2026, https://www.chicagofed.org/publications/chicago-fed-letter/2021/460
33 Allie Grace Garnett, "What It Means to Be Unbanked or Underbanked," Britannica Money, accessed March 21, 2026, https://www.britannica.com/money/unbanked-and-underbanked; https://www.fdic.gov/householdsurvey/2017-fdic-national-survey-unbanked-and-underbanked-households; Federal Deposit Insurance Corporation, 2017 FDIC National Survey of Unbanked and Underbanked Households, 3, October 2018, accessed March 21, 2026, https://www.fdic.gov/household-survey/2017-fdic-national-survey-unbanked-and-underbanked-households
34Consumer Federation of America, "Penalized: The Hidden Cost of Credit Score in Homeowners Insurance Premiums," Consumer Federation of America, last modified August 12, 2025, accessed March 21, 2026, Federal Deposit Insurance Corporation, 2017 FDIC National Survey of Unbanked and Underbanked https://www.fdic.gov/household-survey/2017-fdic-national-survey-unbanked-and-underbanked-households.
35 Jan K. Brueckner and Richard W. Martin, "Spatial Mismatch: An Equilibrium Analysis," Regional Science and Urban Economics 27, no. 6 (1997): https://doi.org/10.1016/s0166-0462(97)00004-5
challenges, research has shown that residential segregation informed by race places great barriers in translating these benefits into better neighborhood conditions, revealing the cruel design of our modern housing system that makes neighborhood turnarounds such a rare event.36
HUD regulation 24 CFR 207.10 required those borrowing from the FHA to have and maintain HUD-approved insurance on their homes.37 Granted, not all loans that one could take from a bank entailed home insurance; however, it is important to note that these long-term amortized loans that catalyzed middle-class growth did. Even during the housing bubble, many homeowners obtained significantly greater amounts of wealth compared to those that merely rented.
38 Since mortgages let residents build equity and earn money from their property’s appreciation over time, they help build household wealth and become the gateway for other important resources like business loans, credit score building, and generational wealth. White households with FHA-backed loans bought homes with low down payments and had the opportunity to take advantage of long-term fixed rates and build equity while formerly redlined households often had to rent, buy exploitative contracts, take shorter-term loans, and experience lower appreciation rates. Over time, these effects created a wider wealth gap between those deprived of these financial resources and those able to enjoy said advantages, putting those left behind in a much more vulnerable position during the leadup and fallout of the Financial Crisis of 2008.
36 Kiarri N. Kershaw et al., "Racial and Ethnic Residential Segregation, the Neighborhood Socioeconomic Environment, and Obesity among Blacks and Mexican Americans," American Journal of Epidemiology 177, no. 4 (2013): https://doi.org/10.1093/aje/kws372; August Benzow and Kenan Fikri, The Persistence of Neighborhood Poverty: Examining the Power of Inertia and the Rarity of Neighborhood Turnaround across U.S. Cities, 31, May 2020, accessed March 21, 2026.
37 U.S. Department of Housing and Urban Development, "Multifamily Asset Management and Project Servicing (4350.1)," U.S. Department of Housing and Urban Development, accessed March 21, 2026, https://www.hud.gov/hudclips/handbooks/housing-4350-1
38 Christopher E. Herbert et al., Is Homeownership Still an Effective Means of Building Wealth for Low-income and Minority Households? (Was It Ever?), 48.
There are a multitude of reasons for why mortgages aid wealth accumulation, but put simply, they contribute in several ways to improving one’s credit score: they leave a record of payment history, which shows lenders proof of the borrower’s ability to handle large loans; mortgages increase the length of credit history for the borrower; and they add diversity to one’s “credit mix,” or the types of loans (such as credit cards and auto loans) a person manages.39 One might ask why credit scores are so monumental to the financial advancement of individuals and the development of an area. Strong scores are essential for taking out small business loans, which allow entrepreneurs to leverage debt or in other words, generate greater gains by investing in their business with borrowed money and increase the flow of money going through the area. They are essential for refinancing existing loans, or the process through which a borrower replaces their current debt obligation for a new loan under better terms.
Since redlining effectively excluded entire neighborhoods from growing strong credit files and accessing mortgages, banks closed branches in these areas, creating “banking deserts,” in which a locality has no access to a physical bank branch within a 10 mile radius.40 As a result, those in redlined areas received few mortgages, saw major disinvestment, much higher insurance costs, and lower-valued appraisals. As the National Commission on Urban Problems noticed, “There was evidence of a tacit agreement among all groups, including lending institutions, fire insurance companies, and the FHA, to block off certain areas of cities within red lines, and not to loan or insure within them. The net result, of course, was that the slums and the areas
39 Allison Martin, "How Your Mortgage Affects Your Credit Score," ed. Alice Holbrook, Bankrate, last modified September 9, 2025, accessed March 21, 2026, https://www.bankrate.com/mortgages/how-mortgage-affects-creditscore/
40 Block, "What Banking Deserts Mean for More than 12 Million Americans," Block, last modified October 11, 2024, accessed March 21, 2026, https://block.xyz/inside/what-banking-deserts-mean-for-more-than-twelve-millionamericans
surrounding them went downhill farther and faster than before.41 This disinvestment reveals that regardless of the long periods of economic abundance and initiatives attempting to provide for the community, the inadequacy of policy has failed to properly revive neighborhoods that have fallen into disrepair, showing how once areas, like those redlined, lose the physical bank locations, they lose their tie to the rest of the nation and stagnate even if the rest of the nation progresses forward. More cruelly, the deterioration of the neighborhood means lower appraisal values of the homes, continuing to entrench those already destitute in worse situations. Further research proves that mortgage lenders still remain biased against redlined areas at a statistically significant level; though whether that is due to existing racial disparities in credit scores or a direct cause of redlining is uncertain, it is undeniable that the fact that these biases align with redlined areas lends some credence to the notion that redlining played a significant role in mortgage lending patterns that remain today.42 Bank branch density declined by 14.6% in predominantly Black neighborhoods in contrast to the 0.2% decline nationwide, yet they expanded into more affluent areas in spite of laws that mandated them to provide essential credit services for poor and middle-class places as well.43 Eventually, houses in these areas began to appreciate less, with the proportion of real estate in high minority tracks (where around 80% or more of the households in the area consist of minority families) and minority tracks (where around 30-50% of the households consist of minority families) being undervalued 74% and 43%
41 Ramzee Nwokolo, How FAIR Plans Confronted Redlining in America, report no. 484, 4, September 2023, accessed March 30, 2026.
42 Sima Namin et al., "Persistence of Mortgage Lending Bias in the United States: 80 Years after the Home Owners' Loan Corporation Security Maps," Journal of Race, Ethnicity and the City 3, no. 1 (2022): https://doi.org/10.1080/26884674.2021.2019568.
43 Kristen Broady et al., "An Analysis of Financial Institutions in Black-majority Communities: Black Borrowers and Depositors Face Considerable Challenges in Accessing Banking Services," Brookings, accessed November 2, 2021, https://www.brookings.edu/articles/an-analysis-of-financial-institutions-in-black-majority-communities-blackborrowers-and-depositors-face-considerable-challenges-in-accessing-banking-services; Nelson D. Schwarz, "Banks Moving from Poor to Rich Areas," CNBC, last modified February 23, 2011, accessed March 30, 2026, https://www.cnbc.com/2011/02/23/banks-moving-from-poor-to-rich-areas.html
more, respectively, than that of White tracts.44 All of these factors put together go to show that while the initial cause may be far back in the past, each following added consequence had a “snowballing” effect that slowly but surely separated residents of redlined neighborhoods from their unaffected counterparts in terms of wealth. Worse, a study in Baltimore City found that neighborhoods in the affluent, predominantly white neighborhoods in the area known as the “White L” were given over $3.2 billion in small business loans while poorer, predominantly Black neighborhoods in the “Black Butterfly” (making up nearly two-thirds of the city’s population) were only granted $1.3 billion; in other words, the mean Black Butterfly neighborhood was given nearly five times less in small business loans than the mean White L neighborhood.45 Notably, while the initial grade a neighborhood received, which could have been affected by factors like race that are otherwise unrelated to lending risk, may have been undeserved, decades of disinvestment meant that the area eventually deteriorated and fulfilled the image of risk associated with the grade the government originally gave it. While the HOLC’s maps may have been rendered void after the Fair Housing Act of 1968, the continuation of de facto redlining through discriminatory insurance and lending practices kept the racial boundaries alive.
Post-1968 Continuity
44 Federal Housing Finance Agency, "Exploring Appraisal Bias Using UAD Aggregate Statistics," Federal Housing Finance Agency, last modified November 2, 2022, accessed March 30, 2026, https://www.fhfa.gov/blog/insights/exploring-appraisal-bias-using-uad-aggregate-statistics; Dan Green, "Specific U.S. Census Tracts Give Access to Below-Market Mortgage Rates," The Mortgage Reports, last modified March 31, 2016, accessed March 30, 2026, https://themortgagereports.com/18912/census-tract-low-income-high-minoritymortgage-rates-homeready
45 John Hopkins University, "Small Business Bank Lending in Baltimore's Black Butterfly and White L, 20132023," John Hopkins University, last modified August 6, 2025, accessed March 30, 2026, https://21cc.jhu.edu/research/small-business-bank-lending-in-baltimores-black-butterfly-and-white-l-2013-2023/
Another shortcoming of the Fair Housing Act is that it failed to mandate reinvestment nor compensate those that suffered under the system, thereby keeping communities of color in much lower socioeconomic positions than they merited. This piece of legislation covered a wide range of discriminatory practices: it prohibited discrimination in housing sales and rentals, the access to the terms and conditions, real estate advertising, and race-based efforts to promote panic selling.46 While the Act did take measures to address racially motivated practices in theory, a U.S. Commission on Civil Rights report found reasons for why Title VIII was considered inadequate:
[It is a] weak law that does not provide effective enforcement mechanisms for ensuring fair housing; HUD, which is charged with the overall administration of that law, lacks enforcement authority; [the] various Federal agencies, including HUD and the Department of Justice, that are charged with ensuring equal housing opportunity, have not adequately carried out this duty; and [the] Federal Government's appropriations supporting fair housing have been inadequate.47
The only power the HUD had over cases of discrimination was investigation and “conference, conciliation, and persuasion,” and if the state was deemed to have a similar enough fair housing law, the HUD had to hand the issue over to the state’s authorities.48 A previous HUD Secretary, Patricia R. Harris, simplified the Act into one sentence: “asking the discovered
46 Douglas S. Massey, "The Legacy of the 1968 Fair Housing Act," Sociological Forum 30, no. S1 (2015): https://doi.org/10.1111/socf.12178.
47 United States Commission of Civil Rights, The State of Civil Rights: 1979, 5, accessed March 30, 2026, https://www.usccr.gov/historicaldocuments?field_doc_title_value=The+State+of+Civil+Rights%3A+1979&field_year_value_1=&field_group_targe t_id_1=All&field_doc_type_target_id=All&field_state_or_territory_target_id=All
48 Massey, “The Legacy.”
lawbreaker whether he wants to discuss the matter.”49 Clearly, while an attempt had been made to curb discrimination in the housing market, the lack of clarity surrounding jurisdiction over these cases and the excessive procedures surrounding them made it ineffective in reality.
The Fair Housing Act also did not encourage reinvestment in previously redlined areas or attempt to fix the increased wealth divergence caused over the course of approximately thirty years. To compensate for this, Congress passed the Community Reinvestment Act, which increased lending in lower-income areas.50 Nevertheless, it treated a symptom of the issue, but the main problem of discriminatory lending practices remained unsolved.
Since the main obstacle this act provided was a restriction of explicitly racist redlining, de facto segregation, or discrimination through already established social or economic systems rather than via legal mandates. After 1968, banks replaced explicit references to race with criteria such as creditworthiness to that on the surface were more racially neutral yet still unintentionally left out disproportionate amounts of Black and Hispanic borrowers due to the fact that they were more disadvantaged for those criteria. The Consumer Financial Protection Bureau describes disparate impact in credit as happening when a creditor uses facially neutral policies or practices that have adverse effects on protected classes unless justified by legitimate business needs that cannot be reasonably met by less discriminatory means.51
The suppressed values of redlined areas began to show themselves in the lower house values, homeownership, and higher vacancy rates over subsequent decades, consistent with significant and persistent housing disinvestment following restricted credit access.52 Since
49 Massey, “The Legacy.”
50 Eugene A. Ludwig et al., The Community Reinvestment Act: Past Successes and Future Opportunities, 1, https://fedinprint.org/item/fedfmo/13297.
51 Consumer Finance Protection Bureau, CFPB Consumer Laws and Regulations, 1, https://files.consumerfinance.gov/f/201306_cfpb_laws-and-regulations_ecoa-combined-june-2013.pdf
52 Aaronson et al., "The Long-run."
historical redlining helped depress housing investment and prices, appraisals, tied to market values and comparable sales, reflected these suppressed valuations. Even appraisals today show that homes in majority-Black neighborhoods are valued substantially below what comparable homes would be valued at in non-Black neighborhoods and are more likely to be appraised below contract price, emphasizing the scale of devaluation and the influence of appraisal bias.53 Research also shows that federal housing policy contributed both to city redlining and preferential suburban development, reinforcing a city-suburb racial geography in the postwar decades and beyond.54
Prior to the 1930s, U.S. housing finance relied heavily on short-term renewable loans with large balloon payments and high down payments.55 The Federal Housing Finance Agency Office of Inspector General’s brief describes a shift similar to that of the New Deal era in which the HOLC introduced long-term fixed-rate amortized mortgage financing.56 These terms were very attractive to borrowers, and private institutional lenders adopted similar mortgage structures to remain competitive, showing how the design of a federal insurance system influenced private markets.57 A 1938 amendment also established Fannie Mae as a secondary mortgage market institution that could purchase, hold, and sell FHA-insured loans, creating liquidity for private
53 Jonathan Rothwell and Andre M. Perry, "How Racial Bias in Appraisals Affects the Devaluation of Homes in Majority-Black Neighborhoods," Brookings, last modified December 5, 2022, accessed March 30, 2026, https://www.brookings.edu/articles/how-racial-bias-in-appraisals-affects-the-devaluation-of-homes-in-majorityblack-neighborhoods/
54 John R. Logan et al., "The Role of Suburbanization in Metropolitan Segregation after 1940," Demography 60, no. 1 (2023): https://doi.org/10.1215/00703370-10430012
55 Federal Housing Finance Agency, A Brief History of the Housing Government-Sponsored Enterprises, 1, accessed March 30, 2026.
56 Federal Housing Finance Agency, A Brief, 2.
57 Matthew Wells, "A Short History of Long-Term Mortgages," Federal Reserve Bank of Richmond, https://www.richmondfed.org/publications/research/econ_focus/2023/q1_economic_history
lenders to fund new home loans.58 Through these methods, mortgages became not just more accessible but actually promoted as a necessity to make working class members more affluent.
Section II: A Divergence in Financial Services
A Lack of Equity
Mortgage markets are essential resources for building wealth as they turn homes into assets that can be leveraged and amortized. A household that buys a home with a mortgage typically gains home price appreciation, principal paydown over time creating a “savings” channel within the monthly payments, and home equity to support future investments or provide stability during economic shocks.59 When households are denied mortgage access or face binding qualification or down payment constraints, the consequence is often to continue renting, which translates to paying the opportunity cost of equity growth during periods when public policy and financial infrastructure were actively supporting mainstream homeownership.60 The Department of the Treasury describes homeownership as providing economic benefits that include leverage and “a vehicle for building wealth,” emphasizing that for households outside the top wealth decile, housing equity is often more important than other forms of non-retirement wealth.61
Access to mortgage finance therefore determined whether households could participate in the primary U.S. engine of middle-class asset formation. When households are denied mortgage
58 Federal Housing Finance Agency, A Brief, 2.
59 U.S. Department of the Treasury, "Racial Differences in Economic Security: Housing," U.S. Department of the Treasury, last modified November 4, 2022, accessed April 5, 2026, https://home.treasury.gov/news/featuredstories/racial-differences-in-economic-security-housing
60Federal Reserve, Report on the Economic Well-Being of U.S. Households in 2024 - May 2025, by Board of Governors, 10, accessed April 5, 2026, https://www.federalreserve.gov/publications/2025-economic-well-being-ofus-households-in-2024-housing.htm
61 U.S. Department of the Treasury, "Racial Differences," U.S. Department of the Treasury.
credit or cannot satisfy binding underwriting requirements such as down payments, debt-toincome thresholds, or credit-history expectations, many remain renters during periods when ownership would otherwise allow equity accumulation. Mortgage access constraints are a major driver of renting: in 2024, just over two-thirds of renters reported they rent because they cannot afford a down payment, and 42% reported they rent because they cannot qualify for a home mortgage.62 Beyond self-reports, macroeconomic housing models show that mortgage credit conditions severely affect homeownership. When lending constraints loosen, some renters become homeowners primarily to change their portfolio composition and hold more housing equity financed with mortgage debt.63
The distribution of these opportunities has been historically uneven across space, producing a geographic divergence in asset building. Mid-20th-century housing finance innovations supported mass homeownership at scale, but existing systems also ingrained racialized and geographic criteria into the flow of mainstream mortgage credit. Primary FHA underwriting guidance recommended deed restrictions including prohibitions on occupancy “except by the race for which they are intended,” and federal housing history has shown that underwriting structures treated neighborhood racial composition as a risk factor, therefore encouraging restrictive covenants to protect home values.64 HOLC Residential Security maps, which defined risk categories, became a representation of how real estate professionals and lenders evaluated neighborhoods in the late 1930s and remain useful for tracing the footprint of disinvestment over time. Modern empirical research finds that lower-graded HOLC areas
62 Report on the Economic, 64-65.
63 Greg Kaplan et al., "The Housing Boom and Bust: Model Meets Evidence," Journal of Political Economy 128, no. 9 (2020): 3289-3290, https://doi.org/10.1086/708816
64 Federal Housing Administration, Underwriting Manual: Underwriting and Valuation Procedure under Title II of the National Housing Act, 980, digital file.
experienced lower homeownership and lower house values over subsequent decades, consistent with restricted credit access and capital withdrawal that depressed investment and slowed wealth accumulation in the same places over generations.65
These disparities provide insight into the broader divergence in credit access because home equity functions as collateral. According to the CFPB, a HELOC is defined as borrowing “using your home as collateral,” making housing equity a path to lower-cost credit for owners who have accumulated it.66 During the 2002 to 2006 period, homeowners extracted roughly $0.25 in borrowing for each $1 increase in home equity, connecting appreciation and equity growth to a greater borrowing capacity.67 The collateral channel also influences investment: expanding home-equity borrowing increased the use of home-equity finance by small businesses and increased new business and job creation. When appreciation is suppressed, liquidity options and cheaper credit opportunities also become restricted from those affected.68
The Issue with Credit
The fact that generational wealth is imperative to one’s homeowning ability shows how wealth divergence caused by redlining can become cumulative over time. The nature of down payments makes it so that a fundamental barrier to fulfilling them is wealth; according to a Federal Reserve FEDS paper, parental wealth transfers helped 30% of households overcome
65 Daniel Aaronson et al., "The Effects of the 1930s HOLC 'Redlining' Maps," American Economic Journal: Economic Policy 13, no. 4 (2021): https://doi.org/10.1257/pol.20190414
66 Consumer Financial Protection Bureau, "What Is a Home Equity Line of Credit (HELOC)?," Consumer Financial Protection Bureau, accessed April 5, 2026, https://www.consumerfinance.gov/ask-cfpb/what-is-a-home-equity-lineof-credit-heloc-en-107/
67 Atif Mian and Amir Sufi, "House Prices, Home Equity–Based Borrowing, and the US Household Leverage Crisis," American Economic Review 101, no. 5 (2011): https://doi.org/10.1257/aer.101.5.2132
68 William D. Lastrapes et al., "Home Equity Lending, Credit Constraints and Small Business in the US," SSRN Electronic Journal, 2020, 19, https://doi.org/10.2139/ssrn.3655661
minimum down-payment constraints, and it also aided homeowners in sustaining ownership over their home.69 As a result, it argues that policies lowering entry barriers can increase the importance of parental wealth by bringing more households to the margin where transfers are pivotal. Complementarily, homeowning parents can extract home equity to help children purchase homes, reinforcing the implication that mortgage exclusion can alter a family’s intergenerational capacity to meet down-payment thresholds and permanently initiate unequal access to the asset-building system.70 Where mainstream mortgage and banking services are weaker, households more often rely on nonbank and high-cost credit markets, which deepened the divergence in the financial services environment itself. Underbanked households use nonbank financial services, including alternatives to mainstream credit such as payday, pawn, auto title, and tax refund anticipation loans, that can be expensive by design: the CFPB notes that a typical two-week payday loan with a $15 per $100 fee implies an APR near 400%.71 Payday borrowing is frequently sustained through renewals, with four-fifths of payday loans rolled over or renewed within 14 days, revealing that the fringe bank model resembles repeat borrowing more than it does traditional loans.72 This reinforces the cycle of exclusion because long-term loans have more manageable monthly payments and provide additional capital to fund assets like businesses and property that generate returns over time; on the other hand, small-sum loans are only useful for supporting daily activities (hence not creating a source of wealth as long-term loans do) and additionally come with much higher interest rates since the small size of the loan
69 Eirik Eylands Brandsaas, "Illiquid Homeownership and the Bank of Mom and Dad," Finance and Economics Discussion Series, nos. 2025-094 (September 2025): 2, accessed March 31, 2026, https://doi.org/10.17016/feds.2025.094.
70 Matteo Benetton et al., "Passing along Housing Wealth from Parents to Children," Federal Reserve Bank of San Francisco, last modified November 21, 2022, accessed March 31, 2026, https://www.frbsf.org/research-andinsights/publications/economic-letter/2022/11/passing-along-housing-wealth-from-parents-to-children/.
71 Consumer Financial Protection Bureau, "What Is a Payday Loan?," Consumer Financial Protection Bureau, https://www.consumerfinance.gov/ask-cfpb/what-is-a-payday-loan-en-1567/
72 Consumer Financial Protection Bureau, "What Is a Payday," Consumer Financial Protection Bureau.
often means that the lender needs to charge more to accumulate sufficient profit. Hence, those that can access larger loans continue to gather more wealth while those unable to do so become trapped in fees and continued dependence on short-term funding.
Entrenchment in the Fringe Economy
Underbanked and unbanked households’ reliance on the fringe economy has massive repercussions on their credit scores. FICO’s published description of score construction indicates that payment history and amounts owed are the largest components of the most widely used score family, making up 35% and 30% of the score respectively, meaning that delinquency and high utilization can quickly degrade future credit access.73 The CFPB describes credit scores as predictions based on credit-report information that influence whether households can obtain mortgages and other credit products and at what price.74 In practice, however, AFSs often fail to report on-time payments, stopping users from building credit, while still reporting delinquencies that severely hurt credit scores.75 Furthermore, the predatory fees and exorbitant interest rates create a high cost of repayment, trapping customers in a cycle of debt that turns credit scores into collateral damage.76 These fee burdens and rollovers worsen credit outcomes precisely along the categories that scoring models weigh most heavily, increasing the probability that households remain excluded from cheaper and longer-term credit. Many subprime lenders, aware of these
73 FICO, "What's in my FICO Scores?," FICO, accessed April 5, 2026, https://www.myfico.com/crediteducation/whats-in-your-credit-score
74 Consumer Financial Protection Bureau, "What Is a Credit Score?," Consumer Financial Protection Bureau, accessed April 5, 2026, https://www.consumerfinance.gov/ask-cfpb/what-is-a-credit-score-en-315/.
75University of Wisconsin-Madison, "Understanding the Impact of Alternative Financial Services: A Quick Reference Guide for Employers and Community Organizations," infographic, University of Wisconsin-Madison, https://fyi.extension.wisc.edu/moneymatters/files/2021/08/Understanding-the-Impact-of-Alternative-FinancialServices-BankOn-Texas.pdf
76 University of Wisconsin-Madison, "Understanding the Impact."
issues, leveraged their customers’ lack of financial literacy and eagerness to coerce them into signing deals: such was the fate of John Doherty and Harry Powers, victims of loan sharks. Doherty “planned to sign no matter what the document said” and Powers “didn’t look them over at all” and “simply signed where [he] was told to put [his] signature.”77 Even the more careful borrowers were deterred from reading the official documents with details about the loan, whether it be through the layout of the papers that covered all but the area to be signed, the absence of important terms or excess of legal language to confuse the reader, or even persuasion from the lender that the papers were not important enough to be read.78 This would often be to their immense detriment as some of the documents were not related to the loan at all; one of them turned out to be a blank power of attorney, which allowed the agent in the document to conduct the loan transaction in a state with more lax usury laws.79 Unfortunately, Doherty and Powers’s stories are not unique instances. Their experiences reflect that of millions of others like them: looking for ways to borrow yet instead swindled into exploitative contracts that kept them ensnared in debt.
In the Context of Subprime Loans
In the subprime mortgage era, unequal credit access reappeared as inclusion on exploitative terms, commonly described as “reverse redlining.” An enforcement record from the Department of Justice shows that in its settlement with Wells Fargo, the government alleged that qualified African-American and Hispanic borrowers were steered into subprime loans or charged
77Anne Fleming, City of Debtors: A Century of Fringe Finance (Harvard University Press, 2018), 25, digital file.
78 Fleming, City of Debtors, 25.
79 Fleming, City of Debtors, 25-26.
higher fees and rates than similarly qualified White borrowers.80 Studies also demonstrate that “wealthier minorities were targeted for subprime loans when they could have qualified for prime loans,” suggesting that even when minorities achieve higher-class socioeconomic status, they cannot leverage their position in the same way their white counterparts can.81 These high-rate mortgages that put even those fully able to pay back prime loans at much higher risk of default were piled into complex, widely held financial products known as Mortgage-Backed Securities (MBSs), and lower-rated tranches of MBSs were repackaged into Collateralized Debt
Obligations (CDOs) with large shares rated AAA (the highest grade) despite being built from riskier components.82 The FDIC’s crisis history similarly emphasizes that rising defaults undermined trillions of dollars of mortgage-backed securities, disrupting the securitization funding system and turning housing-market distress into broader financial instability.83 In this way, place-based exclusion and later place-based targeting interacted with the structure of the financial system: redlining dictated who was harmed first, and the transactions of mortgage derivatives determined how far those harms propagated through the financial system.
Section III: Redlining’s Manifestation in Chicago
Historical Redlining Patterns
80 Department of Justice, "Justice Department Reaches Settlement with Wells Fargo Resulting in More than $175 Million in Relief for Homeowners to Resolve Fair Lending Claims," Department of Justice, last modified July 12, 2012, accessed April 5, 2026, https://www.justice.gov/archives/opa/pr/justice-department-reaches-settlement-wellsfargo-resulting-more-175-million-relief
81 Jacob W. Faber, "Racial Dynamics of Subprime Mortgage Lending at the Peak," Housing Policy Debate 23, no. 2 (2013): https://doi.org/10.1080/10511482.2013.771788.
82 The Financial Crisis Inquiry Commission, The Financial Crisis Inquiry Report: Final Report of the National Commission on the Causes of the Financial and Economic Crisis in the United States, 71, January 2011, accessed April 5, 2026, https://fcic.law.stanford.edu/report
83 Federal Deposit Insurance Corporation, Crisis and Response: An FDIC History, 2008–2013, xv-xvi, April 1, 2018, accessed April 5, 2026, https://archive.fdic.gov/view/fdic/6681
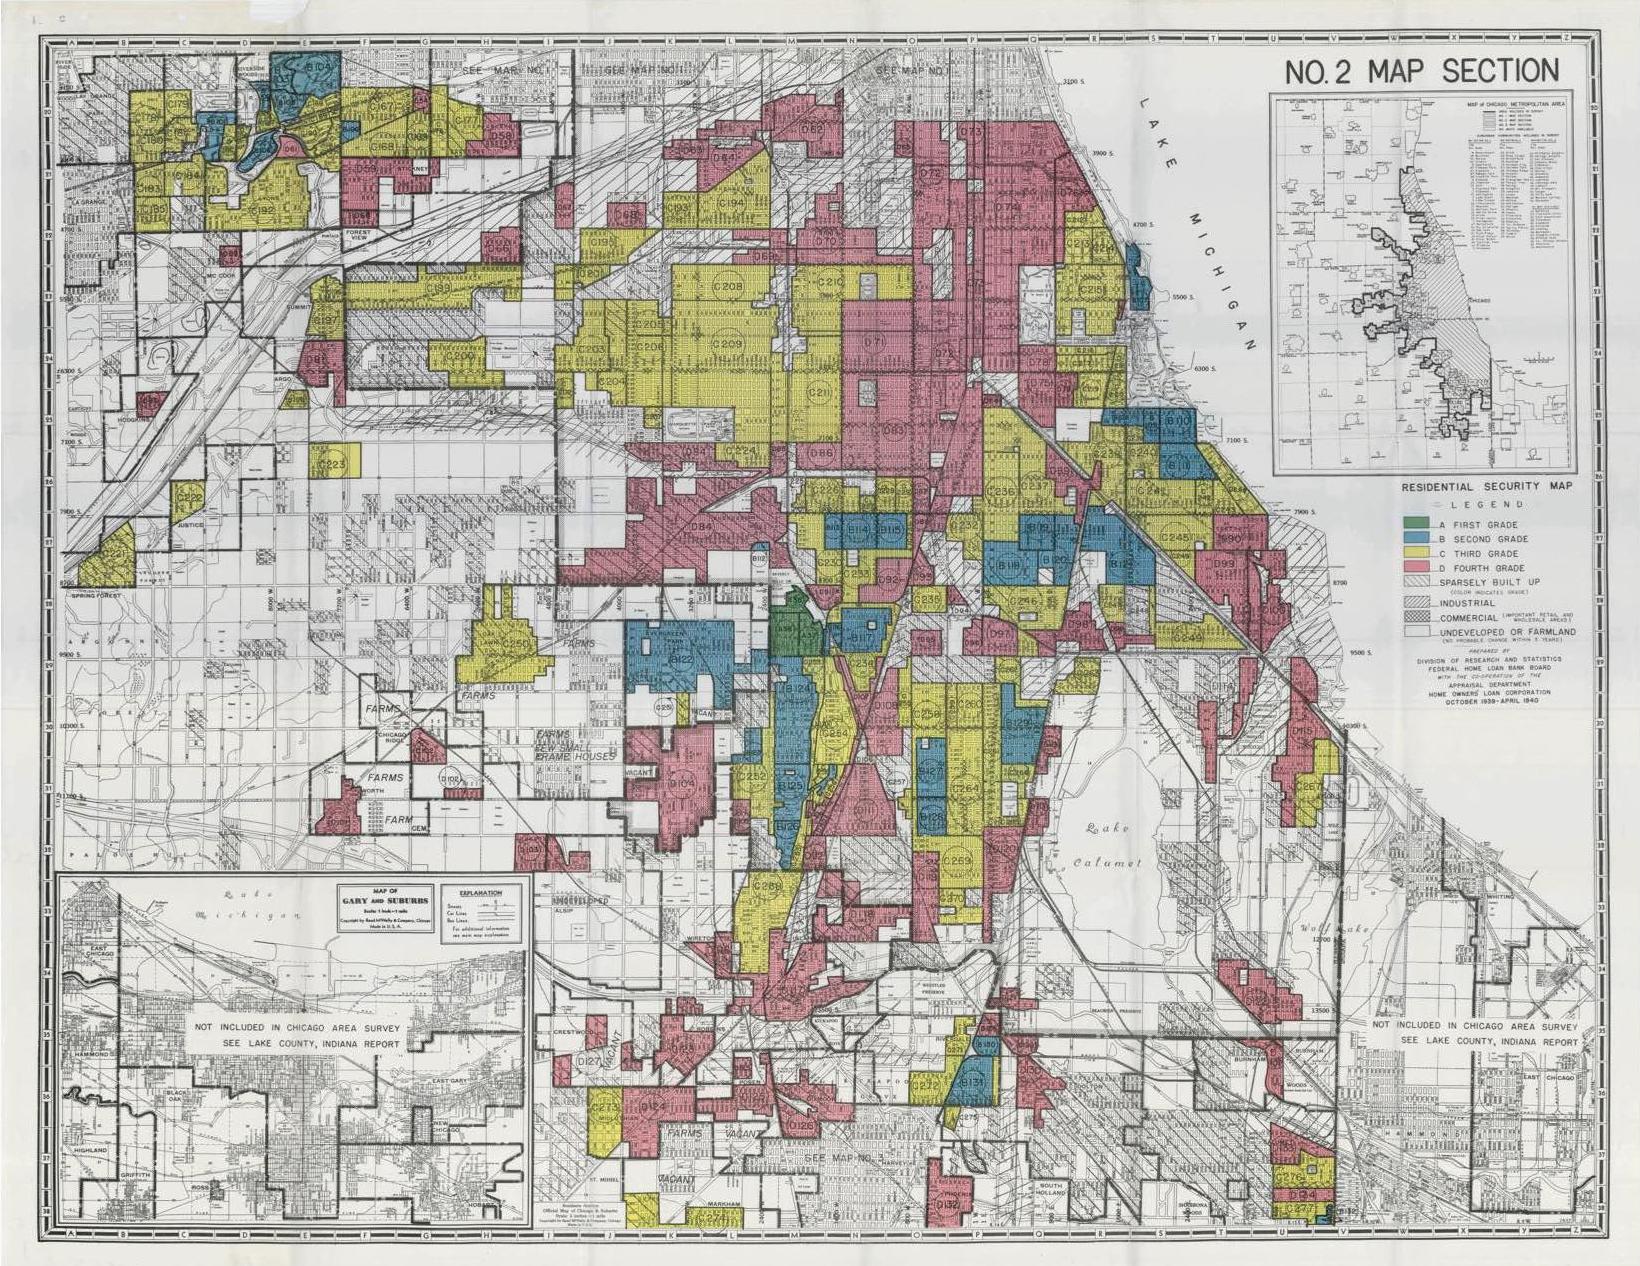
A close-up of the effects of such redlining can be seen from Chicago’s 1930s HOLC residential security map, which drew sharp boundaries labeling vast South and West Side areas C (yellow) or D (red). Chicago Fed researchers found that neighborhoods bordering a yellowlined tract had 4.7 percentage points lower homeownership in 1940, and by 1960 that gap grew to around 7 points.84 Even by 2010, the yellow side still trailed by over 6 points. Written HOLC area descriptions corroborate the underlying discriminatory intent, with one tract (that was only 1% Black at the time) was downgraded to D over fears of “encroachment of Negroes,” predicting it “will revert to the Colored race.”85 Decades of maps and biases meant that by the 1970s and beyond, formerly redlined zones saw much less conventional lending. By the 2000s, minority neighborhoods in Chicago bore the brunt of subprime lending and foreclosures, and while specific 1970s–2000s mortgage data for Chicago remain scarce, analysts note that areas graded C or D on the HOLC map suffered chronically low mortgage availability, higher subprime rates, and eventually higher foreclosure rates compared to adjacent well-graded tracts, meaning that the same boundaries that defined risky areas in 1937 continued to delineate disinvestment and distress for generations.86 The underwriting attitudes of the 1930s carried forward, and the HOLC’s appraisal reports explicitly used race and ethnicity as risk factors just as they did in other areas. HOLC appraisers described predominantly white, working-class enclaves (Irish, Italian, etc.) as mere “lower-class” risks but marked Black presence as a severe issue.87 Historian Amy Hillier notes that HOLC maps endorsed and amplified existing racial biases, effectively ratifying discrimination as mortgage policy, yet the grades they assigned essentially coded
84 "Following the Yellowlined Road," Institute for Housing Studies at DePaul University, last modified October 29, 2020, accessed April 5, 2026, https://www.housingstudies.org/news/following-yellowlinedroad/#:~:text=B%20neighborhoods%20across%20the%20United,lower%20on%20the%20yellowlined%20side
85 "Following the Yellowlined," Institute for Housing Studies at DePaul University.
86 "Following the Yellowlined," Institute for Housing Studies at DePaul University.
87 "Following the Yellowlined," Institute for Housing Studies at DePaul University.
neighborhoods’ future credit access.88 This seemingly scientific, factual grading fed directly into federal lending. Woods argues that the HOLC’s approach made it so that FHA policy soon became a self-fulfilling prophecy, making it “significantly less likely” that homes in poor, nonwhite Chicago neighborhoods would receive mortgage insurance, just as the grade dictated.89 Chicago families in redlined zones often purchased homes via contract-for-deed; under contract selling, Black buyers made large down payments and paid high interest on inflated sale prices, but built no equity, which meant missing payments often led to immediate eviction.
Parallel to mortgage policy, mainstream banking pulled back as over the late 20th century, Chicago’s Black neighborhoods lost retail banks as branches migrated to the suburbs. Fed analysis using geolocation data confirms that predominantly Black communities have fewer nearby branches, leading to approximately 5.6% fewer branch visits per month than in white or suburban areas.90 This left a void filled by check-cashing outlets and payday lenders used by roughly 75% of unbanked benefit recipients (the majority Black or Hispanic) use check-cashers and pay per-transaction fees.91 These check-cashers, along with installment lenders and later payday shops, charged exorbitant fees and APRs, extracting wealth without building any savings or credit. As the Fed notes, consumers relying on check-cashers “pay more per year to make financial transactions,” while missing out on the protections and interest accrual that bank
88 "Following the Yellowlined," Institute for Housing Studies at DePaul University.
89 Jung Sakong and Alexander K. Zentefis, "The Location of Bank Branches Matters," Federal Reserve Bank of Chicago, last modified November 2023, https://www.chicagofed.org/research/content-areas/mobility/policy-briefbank-branch-location#:~:text=In%20a%20recent%20study%2C%20we,which%20leads%20them%20to%20use.
90 Sakong and Zentefis, "The Location," Federal Reserve Bank of Chicago.
91 Sherrie L.W Rhine et al., "The Importance of Check-Cashing Businesses to the Unbanked: Racial/Ethnic Differences," SSRN Electronic Journal, 2003, 5, https://doi.org/10.2139/ssrn.439882
accounts provide.92 By the 2000s, licensed payday stores in Illinois clustered in the poorest Chicago ZIP codes (often over 16 loans per 100 people in majority-Black neighborhoods).93
Wealth Ownership and Credit Access in Chicago
In the 1930s’ federal residential security maps, much of Chicago’s South and West Sides, which had predominantly Black neighborhoods, were shaded red as Fourth Grade, or Hazardous. These official HOLC maps labeled non-white, lower-income areas as credit risks. By contrast, majority-white suburbs and neighborhoods like Beverly received top (green/A) grades. This formalized redlining steered FHA loan guarantees and mortgages away from the redlined tracts. For example, Chicago Fed researchers note that the FHA “largely excluded core urban areas and Black mortgage borrowers” from its insurance programs.94 Indeed, the FHA maintained its own maps, which closely matched the HOLC map in Chicago (82% of population-weighted areas shared the same grade) and similarly refused to insure loans in the Black Belt.95 The practical effect was that FHA-insured credit (the primary path to homeownership) flowed disproportionately into non-redlined (green/blue) areas. In Chicago as elsewhere, FHA and HOLC grading combined to institutionalize lending discrimination against Black neighborhoods.96
92 Rhine et al., "The Importance," 3.
93 Stephanie Zimmerman, "High-interest Loans in Chicago Target Black Neighborhoods," Chicago Sun Times, accessed April 5, 2026, https://chicago.suntimes.com/consumer-affairs/2021/11/26/22799745/payday-titleinstallment-rate-cap-illinois-predatory-loan-prevention-act-woodstock-institute; Tori Healy et al., "New Evidence on Where Payday Lenders Locate Their Storefronts," Federal Reserve Bank of Chicago, last modified July 2024, https://www.chicagofed.org/publications/chicago-fed-letter/2024/496
94 Jonathan Rose, "Revisiting How Two Federal Housing Agencies Propagated Redlining in the 1930s," Federal Reserve Bank of Chicago, last modified April 2022, accessed April 5, 2026, https://www.chicagofed.org/research/content-areas/mobility/policy-brief-federal-housing-programs-redlining
95 Aaronson et al., "The Effects."
96 Rose, "Revisiting How Two Federal," Federal Reserve Bank of Chicago; Aaronson et al., "The Effects."
Figure 1: The 1937 HOLC Residential Security Map of Chicago (South Side section) highlights redlined (Grade D) areas in red and favored (Grades A and B) areas in green and blue. Lenders were advised to avoid the red areas.
The legacy of redlining is starkly visible in Chicago’s housing data. Neighborhoods that were redlined in 1937 have consistently lower homeownership rates decades later. In a Chicagospecific analysis of HOLC borders, homeownership was about 4.7 percentage points lower on the C-graded (yellow) side than the adjacent B side in 1940, and the gap widened to around 7
points by 1960.97 Even by 2010, the yellowlined side still trailed by over 6 points. These maps therefore “led to reduced home ownership rates” long-term, reflecting consistently lower credit access in formerly redlined tracts.98
In absolute terms, Chicago’s overall homeownership is modest (only approximately 44% in 2000), but the gap is largest in segregated neighborhoods.99 Predominantly Black community areas have far lower owner occupancy than the city average; for example, a 2013 Chicago Urban League analysis shows that many Black neighborhoods had owner occupancy rates in the 3 to 24% range, compared to around 49% citywide.100 Table 8 of that study lists Riverdale (owneroccupied 9%), Oakland 3%, Washington Park 13%, and others as dramatically below the Chicago average.101 By contrast, majority-White areas or those with FHA favor (e.g. Beverly) achieved much higher ownership. In short, the neighborhoods that had FHA-backed loans (green and blue areas) saw decades of “equity-building through amortization and capital appreciation,” whereas redlined tracts were shut out of this engine of middle class wealth.102 This historical exclusion helps explain why the median net worth in Chicago’s Black communities is effectively near zero while white families have hundreds of thousands in home equity.103
Disinvestment and bias in appraisal compounded the wealth gap as appraisers relied on recent comparable sales; in Chicago’s investment-starved redlined areas, sale prices lagged,
97 "Following the Yellowlined," Institute for Housing Studies at DePaul University.
98 Aaronson et al., "The Effects."
99The Brookings Institution Center on Urban and Metropolitan Policy, "Chicago in Focus: A Profile from Census 2000," infographic, Brookings, November 1, 2003, https://www.brookings.edu/articles/chicago-in-focus-a-profilefrom-census-2000/
100The Chicago Urban League, "100 Years and Counting: The Enduring Legacy of Racial Residential Segregation in Chicago in the Post-Civil Rights Era," in CULtivate, 46, https://chiul.org/wp-content/uploads/2019/01/CULtivatePart-1_Residential-Segregation-and-Housing-Transportation_Full-Draft_FINAL.pdf.
101 The Chicago Urban League, "100 Years," in CULtivate, 46.
102 Aaronson et al., "The Effects."
103 The Brookings Institution Center on Urban and Metropolitan Policy, "Chicago in Focus," infographic; Zimmerman, "High-interest Loans," Chicago Sun Times.
suppressing appraised values.104 A 2022 analysis of 2018-20 loan records found homes in majority-Black tracts were far more likely to be under-valued by appraisers than homes in white areas.105 Nationally, properties in 50% or greater Black neighborhoods were 2.5 times more likely to be under-appraised (i.e. the estimated value was below the sale price) than those in white neighborhoods.106 In Cook County specifically, about 120 of every 1,000 homes sold in mostly Black areas were under-appraised, versus only about 70 per 1,000 in mostly white areas. Illinois realtors warn that such appraisal bias “robs so much wealth from our neighborhoods” since lower appraisals mean less home equity and higher loan-to-value ratios for Black homeowners (when they are able to get the loans), making them more vulnerable to downturns or predatory lending.107 Thus, even after the 1968 Fair Housing Act, Black communities’ homes appreciated more slowly, sustaining a self-reinforcing cycle where low appraisals led to low equity, riskier financing, a lack of maintenance, and lower values.
Selective access to credit influences a community’s banking access, which becomes especially clear when seeing how Chicago neighborhoods with higher Black populations have long faced banking deserts. A study found that despite controlling for income, areas with few or no bank branches tend to be poorer and “less white” than the city average. In fact, the share of a neighborhood’s population that is Black (and to a lesser extent Hispanic) is negatively correlated with the number of bank branches.108 This meant that branches migrated to the suburbs and higher-income areas, forcing residents in the inner city to travel greater distances to any one
104 "Homes in Black and Latino Neighborhoods More Likely to Be Under Appraised, Data Shows," ABC 7, https://abc7chicago.com/post/chicago-property-value-home-appraisals-estimator-discrimination/12520229/ 105 "Homes in Black," ABC 7.
106 "Homes in Black," ABC 7.
107 "Homes in Black," ABC 7.
108 Scott W. Hegerty, "'Banking Deserts,' Bank Branch Losses, and Neighborhood Socioeconomic Characteristics in the City of Chicago: A Spatial and Statistical Analysis," The Professional Geographer 72, no. 2 (2019): accessed April 5, 2026, https://doi.org/10.1080/00330124.2019.1676801
branch location.109 Interestingly, one study finds that the lower use of bank branches by residents in lower-income neighborhoods is explained by a reduced demand for those banks’ services rather than the physical distance to access those branches, which makes sense given their more prevalent use of AFSs, though the lower demand could also be attributed to their inability to meet credit requirements necessary to access certain services.110 Contrary to this, Black communities have a higher demand for bank services; yet, they specifically are obstructed from accessing branches due to the far location of the branches, indicating that race-specific causes rather than purely income-related ones could be the reason for those branches’ movement and suggesting a relationship between redlining and banking access for Black individuals.111 With traditional banks scarce in redlined areas, many residents resort to high-cost nonbank financial services. On Chicago’s South and West Sides the proliferation of payday, title, and installment loan outlets is glaring. For instance, ZIP codes 60619 and 60620 (95%+ Black) saw over 16 payday loans per 100 residents, while Lincoln Park (mostly white) saw only 1.1 per 100.112 Critics note that “these loans very specifically target Black communities” and help perpetuate racial wealth disparities.113 In the absence of conventional credit, cash-strapped families often endure triple-digit interest rates on small loans, further draining neighborhood wealth and leaving little for strengthening credit histories. The combined effect of these factors is cumulative financial divergence. Chicago Fed research of HOLC grade boundaries shows that an initial homeownership gap of approximately 5 points in 1940 widened as FHA lending flowed into favored areas.114 More than half a century later, redlined tracts still lag in ownership and
109 Sakong and Zentefis, "The Location," Federal Reserve Bank of Chicago.
110 Sakong and Zentefis, "The Location," Federal Reserve Bank of Chicago.
111 Sakong and Zentefis, "The Location," Federal Reserve Bank of Chicago.
112 Zimmerman, "High-interest Loans," Chicago Sun Times.
113 Zimmerman, "High-interest Loans," Chicago Sun Times.
114 "Following the Yellowlined," Institute for Housing Studies at DePaul University.
home equity.115 Meanwhile, exclusion from banking and reliance on payday lending mean fewer opportunities to build savings or credit. In short, historically redlined Chicago neighborhoods have chronically suffered lower rates of homeownership, slower property appreciation, and constrained credit access, with each reinforcing the other.
These Chicago-specific findings emphasize how homeownership, the main catalyst of household wealth, was curtailed in Black neighborhoods by discriminatory FHA practices, meaning that families in redlined tracts missed out on decades of equity-building.116 As Chicago Fed authors observe, the HOLC maps “account for 15–30% of the gap in homeownership and 40% of the gap in house values” between redlined and non-redlined areas.117 Lending bias and branch scarcity then perpetuated the divide, ensuring that wealth suppression along Chicago’s old redline borders continues to this day.
Fringe Financial Concentration in Chicago
Chicago’s segregated housing history left a lasting imprint on its banking geography. Recent analysis of geolocation data confirms that even today, “residents of the North Side experience better [bank-branch] access than those living in the South Side, an area with a high Black population share.”118 Branch access varies so much in Chicago that the bottom 10% of Cook County neighborhoods have access comparable to the worst-served communities nationwide.119 One report notes Cook County lost 674 bank branches in the last decade, many in
115 "Homes in Black," ABC 7; "Following the Yellowlined," Institute for Housing Studies at DePaul University.
116 Rose, "Revisiting How Two Federal," Federal Reserve Bank of Chicago; Aaronson et al., "The Effects."
117 "The Effects."
118 Sakong and Zentefis, "The Location," Federal Reserve Bank of Chicago.
119 Sakong and Zentefis, "The Location," Federal Reserve Bank of Chicago.
low-income, predominantly Black communities.120 Chicagoans in these neighborhoods often live many miles from the nearest bank; surveys show about 29 to 30% of Cook County households are unbanked or underbanked (metrics that are far above national averages), meaning nearly onethird of residents have no checking or savings account.121 The vacuum left by banks was filled by high-cost “fringe” finance firms such as payday lenders, check-cashers, and pawnshops, which have proliferated in Chicago’s historically redlined neighborhoods. A recent Chicago Fed study finds Chicago’s licensed payday outlets cluster in high-poverty, majority-minority ZIP codes: Chicago ZIP codes in the top poverty quartile were 15% more likely to have a payday store and 88% more likely to have a cluster of them, compared to the least-poor ZIP codes.
122 Over two-thirds of Chicago payday locations sit in multi-store clusters, typically in densely populated low-income areas.123 These findings echo the idea that payday and short-term lenders in Illinois “were substantially more likely to locate […] in zip codes with a relatively high fraction of residents in poverty” and with a high share of non-White residents.124 In other words, lenders were able to take advantage of established patterns of disinvestment and set up shop where banks had fled.
Unfortunately for borrowers, this physical clustering comes with several consequences for them. Payday loans in Illinois carry exorbitant costs, with median loans of around $350 and
120 Diane Eastabrook, "Unbanked and Broke: How Banking Deserts Perpetuate Poverty on Chicago's Southside," Substack, last modified August 12, 2020, accessed April 5, 2026, https://americaincontext.substack.com/p/unbanked-and-broke-how-banking-deserts
121 "Senate Unanimously Approves Comptroller's 'Bank on Illinois' Bill to Steer Illinois Residents Away from Predatory Lenders," Susana A. Mendoza Illinois State Comptroller, last modified April 4, 2019, accessed April 5, 2026, https://illinoiscomptroller.gov/press-releases/senate-unanimously-approves-comptrollers-bank-on-illinois-billto-steer-illinois-residents-away-from-predatory-lenders
122 Healy et al., "New Evidence," Federal Reserve Bank of Chicago.
123 Healy et al., "New Evidence," Federal Reserve Bank of Chicago.
124 Healy et al., "New Evidence," Federal Reserve Bank of Chicago.
typical fees equivalent to roughly 400% APR.125 Check-cashing and prepaid card fees similarly drain household income: in Chatham, a Chicago South Side community, residents report lining up to cash paychecks at a storefront. They “cash their checks at the currency exchange for a fee” then pay another fee to load a prepaid debit card, leaving them “broke for the next 13 days” because each bill payment cycle incurs heavy charges.126 Yet, one analysis notes that currency exchanges and payday lenders “continue to be the lenders of choice” in low-income Chicago neighborhoods.127 State regulators have estimated that an unbanked Illinois worker pays on the order of $40,000 in fees over a lifetime to such predatory services.128 These costs function as a regressive tax on the poor, trapping families in debt cycles: borrowers often roll over or reborrow, incurring new fees on each rollover. The result is that a small loan can balloon into a major expense, and consumers, trapped in a vicious cycle of debt, never build mainstream credit or savings as interest they pay goes to fees rather than equity.
Oftentimes, high-cost lenders in Chicago cluster along commercial strips in underbanked neighborhoods in long lines snaking around South Side storefronts where workers must cash paychecks.129 Community organizers note that residents must travel to cash pay at a “currency exchange,” paying fees just to access their own wages. These check-cashing corridors are by design located far from traditional banks.130 In the absence of a bank account, every transaction incurs a fee – from check cashing to bill-paying to ATM withdrawals. Across Cook County,
125 Paris Schutz, "Business This Legislation Could End Illinois' Payday Loan Industry," WTTW, last modified March 12, 2021, accessed April 5, 2026, https://news.wttw.com/2021/03/09/legislation-could-end-illinois-paydayloan-industry; Tom Jackson, "How Do Payday Loans Work?," InCharge, last modified October 14, 2025, accessed April 5, 2026, https://www.incharge.org/debt-relief/how-payday-loans-work/
126 Eastabrook, "Unbanked and Broke," Substack.
127 Eastabrook, "Unbanked and Broke," Substack.
128 "Senate Unanimously," Susana A. Mendoza Illinois State Comptroller.
129 Eastabrook, "Unbanked and Broke," Substack.
130 "Senate Unanimously," Susana A. Mendoza Illinois State Comptroller.
nearly 30% of people rely on these non-bank services.131 Bypassing banks means missing out on low-cost tools: people cannot accumulate savings in an interest-bearing account, nor build credit via debit or card history. Over decades, these extra transaction costs add up and leave families with poorer credit records, exacerbating their exclusion. Because alternative financial service providers see those areas as their market, Chicago’s formerly redlined neighborhoods now have vastly different credit environments than others. A person on the South or West Side may be five times more likely to find multiple storefront payday lenders nearby than someone in an affluent neighborhood.132 Conversely, respondents in those same neighborhoods make 5.6% fewer bank branch visits per month than similar-income White neighborhoods, largely because a branch is farther away.133 Empirically, researchers find that mainstream bank branches have been slower to re-enter (or enter for the first time) Chicago’s disinvested neighborhoods: in fact, an unbanked household in Chicago might pay $40,000 in penalties and fees in lieu of normal banking services.134 In these segregated credit markets, the typical path to funds for many low-income Chicagoans is via payday loans or check cashers, with each step reinforcing a cycle of debt and exclusion.
Section IV: Redlining’s Manifestation in Detroit
The HOLC and Its Redlining Policies in Detroit
While Chicago demonstrates a classic (though nevertheless strong) case of racial segregation and eventual disinvestment, Detroit’s redlining history was overlaid on a booming
131 "Senate Unanimously," Susana A. Mendoza Illinois State Comptroller.
132 Healy et al., "New Evidence," Federal Reserve Bank of Chicago.
133 Sakong and Zentefis, "The Location," Federal Reserve Bank of Chicago.
134 "Senate Unanimously," Susana A. Mendoza Illinois State Comptroller.
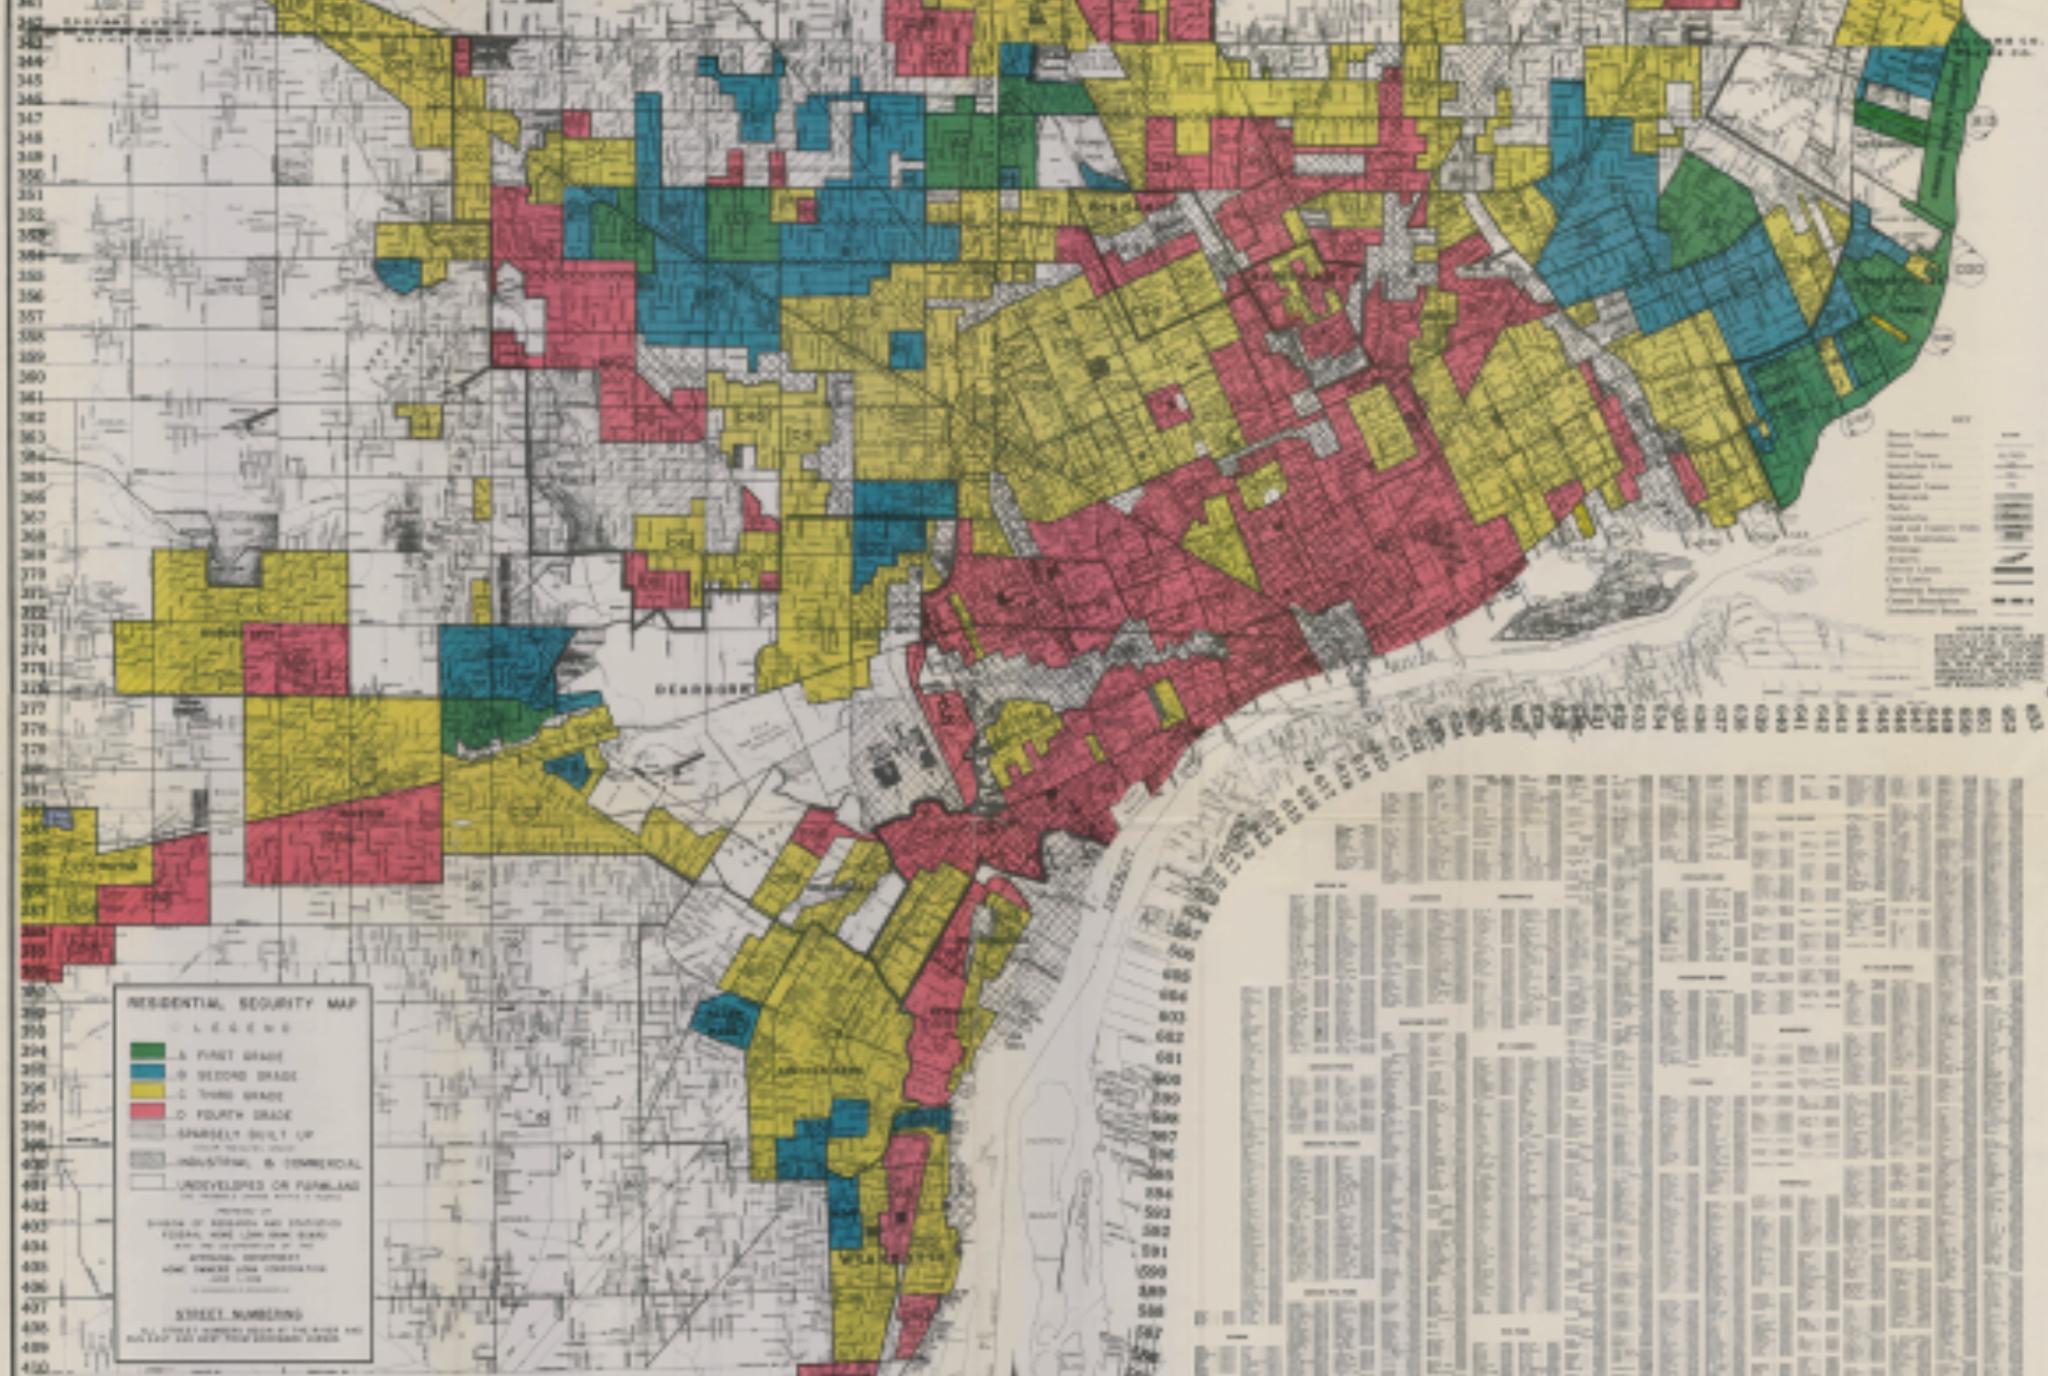
auto-industrial city, showing how redlining intensified the effects of deindustrialization on poorly-graded areas. In the 1930s, Detroit’s HOLC “hazardous” zones (Grade D) were explicitly those with Black or immigrant residents.135 Industrial jobs grew alongside these segregated communities: by 1940 Detroit was the nation’s fourth-largest city thanks to the Big Three auto firms, and high-paying union jobs drew migrants to settle in auto-worker neighborhoods.136 However, many early auto plants and parts factories were built in or adjacent to D-graded areas; “most [auto] factories were built in neighborhoods of color that were historically redlined,” exposing those residents to pollution and displacement.137 Today, all of Detroit’s remaining auto assembly plants lie in formerly redlined tracts.138 The three active Detroit auto plants, all in exredlined areas, “were the cause of air pollution and displacement.”139 Those D-grade neighborhoods now suffer far worse environmental hazards than other tracts. A recent study found historically redlined Detroit tracts had 65% higher exposure to road noise, 12% higher diesel particulate levels, and nearly twice as many hazardous waste sites and risk-managementplan (RMP) facilities as non-redlined areas.140 In other words, redlined Detroit communities are disproportionately burdened by the pollution of nearby factories and highways. They also enter the postindustrial era with deeper economic wounds due to decades of disinvestment under redlining, leaving these neighborhoods with low property values and little wealth. When the auto industry later collapsed around the 1970s to the 1990s, D-grade areas, which were already
135 Michigan State University, "Redlining in Michigan," Michigan State University, accessed April 5, 2026, https://www.canr.msu.edu/redlining/detroit
136 Jena Brooker, "Detroit's Cost for Automotive Growth: Generational Displacement," Bridge Detroit, last modified June 26, 2023, accessed April 5, 2026, https://www.bridgedetroit.com/detroits-cost-for-automotive-growthgenerational-displacement/; Michigan State University, "Redlining in Michigan," Michigan State University.
137 Brooker, "Detroit's Cost," Bridge Detroit.
138 Brooker, "Detroit's Cost," Bridge Detroit.
139 Brooker, "Detroit's Cost," Bridge Detroit.
140Abas Shkembi et al., "Linking Environmental Injustices in Detroit, MI to Institutional Racial Segregation through Historical Federal Redlining," Journal of Exposure Science & Environmental Epidemiology 34, no. 3 (2022): 392, accessed April 5, 2026, https://doi.org/10.1038/s41370-022-00512-y
dependent on manufacturing wages, saw incomes and home values fall sharply.141 Formerly redlined tracts today have lower home equity and far weaker housing appreciation compared to other parts of the city.142 Census data show Detroit tracts with higher manufacturing employment shares tend to overlap the old D-zones. Detroit’s HOLC map and employment patterns finds the “automotive boom” towns and Black neighborhoods were mapped as highest risk.143 More broadly, Detroit’s economic decline was as much a story of industrial loss as outmigration. In the 1950s to 60s, D-graded neighborhoods had the highest concentration of auto workers. After the 1980s, as plants closed, these communities experienced accelerated poverty and abandonment.
Today, it is well documented that Detroit’s population loss and fiscal crisis were centered in the African-American neighborhoods, aligning perfectly with those redlined areas.144 Detroit illustrates how deindustrialization compounded the burden upon those in redlined neighborhoods by demonstrating how an unstable industrial economy, through federal grading, disadvantaged the city’s auto-dependent, minority neighborhoods. When manufacturing later declined, those redlined tracts faced devastating consequences due to low incomes and home equity as well as high pollution exposure; the result was a Detroit where formerly redlined areas remained economically depressed and environmentally overburdened in stark contrast to more diversified cities.
141 Brooker, "Detroit's Cost," Bridge Detroit.
142 Brooker, "Detroit's Cost," Bridge Detroit.
143 Michigan State University, "Redlining in Michigan," Michigan State University; Brooker, "Detroit's Cost," Bridge Detroit.
144 Brooker, "Detroit's Cost," Bridge Detroit; Shkembi et al., "Linking Environmental."
Credit Withdrawal and Deindustrialization in Detroit
Detroit’s long decline was marked by a vicious feedback loop: as factories closed and jobs vanished, incomes fell and property values collapsed, which in turn triggered a flight of bank branches and a tightening of credit in the hardest-hit neighborhoods. This process played out especially in neighborhoods already tagged as hazardous by the HOLC and heavily dependent on manufacturing employment.145 When Detroit’s auto industry began shrinking in the 1970s to 80s, unemployment in these working-class tracts spiked, causing mortgage defaults and foreclosures to rise; home values fell sharply, which weakened local collateral.146 With deposits and lending demand drying up, banks then began closing branches in Detroit’s innercity. Economically speaking, this was a rational business decision, since without jobs and with rising defaults, maintaining branches in the poorest areas became unprofitable. However, because redlined neighborhoods already had fewer financial institutions to begin with, this rational retrenchment only deepened their isolation.
From the late 1970s onward, Detroit suffered repeated waves of plant closures from companies like GM, Chrysler, and Ford, and as a result mass layoffs.147 Industrial firms, seeking lower labor costs, reduced taxes, and more desirable production environments began relocating out of Detroit even well before the commonly cited crises of the 1970s, and this resulted in the erosion of manufacturing employment in the auto sector, which was the city’s economic base for
145 Jackson Battista, "Deindustrialization of Detroit: The Costs of Movement," Essays in Economic and Business History, 12, accessed April 5, 2026, https://ebhsoc.org/journal/index.php/ebhs/article/view/532.
146 Thomas J. Sugrue, The Origins of the Urban Crisis : Race and Inequality in Postwar Detroit : with a New Preface by the Author (Princeton University Press, 2005), 6, digital file.
147 Paul D. Ballew and Robert H. Schnorbus, "Auto Industry Restructuring and the Midwest Economy," Federal Reserve Bank of Chicago, last modified June 1993, accessed April 6, 2026, https://www.chicagofed.org/publications/chicago-fed-letter/1993/june-70
decades.148 Crucially, segregation produced through redlining had concentrated Black residents in neighborhoods with an inordinate amount of reliance on industrial jobs; in other words, redlining structured Detroit’s financial vulnerability.149 As a result, when auto plants closed or downsized, the shocks on workers’ incomes severely impacted people in these areas instead of being evenly distributed across the metropolitan region. Furthermore, the restructuring of the auto industry disproportionately displaced Black workers, showing the amplified repercussions of redlining on racial inequality.150 Studies of Detroit’s urban health and demographic patterns show that deindustrialization triggered significant emigration and falling household incomes, specifically in neighborhoods in the central area of the city that had been historically redlined.151 These areas in particular experienced sharper increases in poverty and more severe economic instability than less segregated or suburban areas.152 As manufacturing wages disappeared, many Detroit households defaulted on mortgages and abandoned homes, driving neighborhood property values down even further. Reduced equity meant even creditworthy residents could not refinance or sell to cover losses; since redlined neighborhoods started the decline with little wealth buffer, they were hit hardest by foreclosure waves and price slumps. As household incomes declined and became more volatile, mortgage delinquency rates increased and housing demand weakened, initiating a downward spiral in property values that heavily impacted neighborhoods already disadvantaged by redlining.153 Falling property values also meant reduced collateral value, a diminished capacity to refinance, and weakened equity buffers, all of which
148 Ballew and Schnorbus, "Auto Industry," Federal Reserve Bank of Chicago.
149 Sugrue, The Origins, 4.
150 Sugrue, The Origins, 4.
151Elizabeth McClure et al., "The Legacy of Redlining in the Effect of Foreclosures on Detroit Residents' Self-rated Health," Health & Place 55 (January 2019): 10, https://doi.org/10.1016/j.healthplace.2018.10.004
152 McClure et al., "The Legacy,” 10.
153 Bruce C. Mitchell, "Historic Redlining's Effects on Home Mortgages Today," National Community Reinvestment Coalition, last modified December 18, 2025, accessed April 6, 2026, https://ncrc.org/historicredlinings-effects-on-home-mortgages-today
meant that homeowners became more limited in their ability to borrow, saw their equity positions deteriorate, and faced increasing vulnerability to foreclosure. Through the accumulation of default risk, Detroit faced swift systematic collapse.
With fewer deposits and higher default risk, banks systematically pulled back. Rising unemployment increased default risk, while population loss and declining incomes reduced the local deposit base, making many neighborhoods less attractive for maintaining physical banking infrastructure. In Detroit, dozens of city-center branches closed in the 1990s and 2000s while suburban branch networks expanded, creating banking deserts by reducing access to financial services.154 In Detroit’s redlined tracts, which were already underbanked, branch closures left residents with no local access to checking, savings, or credit while suburban residents continued to benefit from robust branch and ATM coverage.155 Importantly, while the banks may have been merely responding to economic signals, those signals were formed by earlier policies, such as redlining, that already constrained wealth accumulation, suppressed property values, and geographically isolated communities of color based on discriminatory standards. From this perspective, it becomes clear that even after more objective metrics take the place of older ones, they continue to deepen historically constructed inequalities.
The result of deindustrialization was a contraction of mainstream credit in Detroit’s poorest communities and disinvestment, creating a mutually reinforcing process in which capital flight accelerated decline in already marginalized areas. Without local banks, residents of Detroit had fewer options to refinance or obtain loans, leading to an increased reliance on AFSs, and
154 Emily Engel, "Changing Banking Infrastructure: Access to Credit by Detroit's Small Businesses," Federal Reserve Bank of Chicago, last modified February 2, 2012, accessed April 6, 2026, https://www.chicagofed.org/publications/blogs/cdps/2012/changing-banking-infrastructure 155 Engel, "Changing Banking," Federal Reserve Bank of Chicago.
falling home values further discouraged lenders.156 By the 2000s, Detroit’s legacy redline zones had far fewer branches per capita than suburban neighborhoods. Declining property values then increased perceived lending risk since the value of the collateral effectively decreased, creating a cycle in which job loss reduced income, reduced income weakened housing demand, falling home values increased lending risk, increased risk led to credit contraction, and that reduced credit further depressed economic activity. Perhaps most damaging is that this cycle did not represent a momentary decline in the city’s economy but rather a restructuring of the housing market itself, making it an attractive target for reverse redlining and a dangerous arrow for the Achilles’ heel of the financial markets of the new millenium.
Foreclosure and Property Abandonment in Detroit
Decades later, Detroit’s majority-Black, redlined neighborhoods saw the worst of the mortgage crash. Indeed, Detroit’s foreclosure rate skyrocketed from 2007 to 2009, far above other cities.157 By 2013, a study counted 70,000 foreclosed homes in Detroit, with 65% remaining vacant.158 Between 2005 and 2015, roughly one in three Detroit properties went through foreclosure.159
156 Lewis Wallace, Why There's Almost No Mortgage Lending in Detroit, podcast, audio, accessed April 6, 2026, https://www.marketplace.org/story/2016/10/05/why-lending-scarce-cheapest-neighborhoods
157 Richard Drumb, "Detroit's Housing Debacle," Medium, last modified January 23, 2022, accessed April 6, 2026, https://rcdrumb.medium.com/detroits-housing-debacle-4a3d2387349e.
158 Drumb, "Detroit's Housing," Medium.
159 "Detroit: Past and Future of a Shrinking City," Economy League, https://www.economyleague.org/resources/detroit-past-and-future-shrinking-city
Figure 2: Detroit’s 1939 HOLC “residential security” map. Green = A (Best); red = D (Hazardous). Many Black neighborhoods were rated D and denied loans. Decades later these same zones suffered the highest foreclosure and vacancy. Detroit experienced about 67,000 home foreclosures from 2005 to 2007, roughly translating to over 20% of all mortgages; from 2005 to 2015, approximately 1 in 3 Detroit homes foreclosed.160 In just the first half of 2008, 4,600 Detroit properties were tax-foreclosed, with over $25 million in tax liabilities.161 At its peak, Detroit had the highest foreclosure rate of any large U.S. city.162 These foreclosures depressed home values across neighborhoods and drained
160 Drumb, "Detroit's Housing," Medium; "Detroit: Past," Economy League.
161 Drumb, "Detroit's Housing," Medium.
162 Drumb, "Detroit's Housing," Medium.
city tax revenue. Foreclosure filings overwhelmingly tracked historic segregation. Analysts note Detroit “saw a disproportionate amount of discriminatory subprime lending” in these same neighborhoods.163 A mapping study finds that today the areas once deemed “hazardous” show far higher vacancy and blight, often managed by absentee landlords.164
As bank foreclosures mounted, tax delinquencies started piling on top of Detroit’s crisis as well. From 2011 to 2015, Wayne County foreclosed on roughly 100,000 Detroit properties for unpaid taxes, representing about 25% of the city’s stock; in other words, 1 in 4 homes was lost to the tax-foreclosure process over the span of just five years.165 Auctions then followed, draining neighborhoods of homeowners: in 2015 alone, Wayne County listed 61,912 Detroit properties for tax foreclosure.166 Motor City Mapping data show 63% of those homes were occupied; nearly 98,000 people lived in houses facing seizure, and worst of all, over 80% of owners facing tax foreclosure had suffered a financial hardship such as job loss or illness.167 At the Wayne County tax auction, 6,000 occupied homes were sold in 2014 and 8,000 in 2015 (mostly to investors).168
A large proportion of the buyers were speculators, as recent reporting finds private investors now own about 20% of Detroit’s housing stock.169 Advocates note that tax foreclosures became “one of the biggest drivers of displacement and loss of homeowner wealth” in Detroit.170 The
163 Alex B. Hill, "Map: Where Are All the People in Detroit – Occupancy and Foreclosure," Detroitography, last modified January 16, 2015, accessed April 6, 2026, https://detroitography.com/2015/01/16/map-where-are-all-thepeople-in-detroit-occupancy-and-foreclosure/
164 Hill, "Map: Where," Detroitography; “Detroit: Past," Economy League.
165 Drumb, "Detroit's Housing," Medium.
166 Hill, "Map: Where," Detroitography.
167 Hill, "Map: Where," Detroitography.
168 Drumb, "Detroit's Housing," Medium.
169 Aaron Mondry, "What Is Property Speculation and Who's Doing It in Detroit?," Bridge Detroit, last modified October 22, 2024, accessed April 6, 2026, https://www.bridgedetroit.com/what-is-property-speculation-and-whosdoing-it-in-detroit/
170 "Q&A: Rocket Community Fund Leaders Speak on Helping Detroit Residents Reclaim Property Tax Proceeds," Outlier Media, last modified March 30, 2026, https://outliermedia.org/qa-rocket-community-fund-leaders-speak-onhelping-detroit-residents-reclaim-property-tax-proceeds/
foreclosure waves drove Detroit’s land vacancy to unprecedented heights, and by 2012 about 40 square miles of Detroit (one-third of the city) was vacant land.171 Empty lots and abandoned buildings concentrate precisely in the poorest, formerly redlined neighborhoods. The Economy League reports the highest vacancy clusters lie northwest of downtown (along Grand River) and northeast (near Gratiot), which were areas that once housed industrial workers.172 The map below helps illustrate this: over half of Detroit’s parcels are vacant (gray) even though 81% of its structures still stand (yellow). Large tracts of emptiness align with historic “D” zones.173
171 "Detroit: Past," Economy League.
172 "Detroit: Past," Economy League.
173 Hill, "Map: Where," Detroitography.
Figure 3: Occupied housing in Detroit (2015). Yellow indicates occupied structures, while gray indicates a vacant status. Only 54% of parcels have any occupied building. Areas of concentrated vacancy overlap the city’s long-disinvested districts.
Section V: The Financial Crisis of 2008: How Local Vulnerabilities Turned into National Collapse
The Growth of the Subprime Market
The subprime mortgage market expanded dramatically in the 2000s. In 1994, subprime loans only represented around 5% of U.S. mortgages; yet, by 2005 to 2006, they accounted for roughly one-fifth of all mortgage originations, ballooning from $65 billion in 1995 to over $500 billion in 2006, representing about 20% of the entire mortgage market (roughly $1.5 trillion out of $10 trillion).174 Subprime shares climbed steeply in 2006, and most of these high-risk loans were securitized and sold off; by 2006 roughly 75% of new subprime mortgages were immediately packaged into mortgage-backed securities.175 Private-label mortgage issuance surged past that of Government Sponsored Enterprises (or GSEs), with non-agency origination exceeding $1.48 trillion (45% above agency issuance) in 2006.176 Adjustable-rate loans, notorious for their risk, also surged by 2006.177 These trends reversed only after 2007, when default waves and liquidity shocks caused subprime originations to collapse. Although national in scope, the subprime boom was highly uneven across metros and neighborhoods. Research
174 Sandra F. Braunstein, Subprime Mortgages, March 27, 2007, accessed April 6, 2026, https://www.federalreserve.gov/newsevents/testimony/braunstein20070327a.htm; Edward L. Glaeser and Todd M. Sinai, Housing and the Financial Crisis (University of Chicago Press, 2014), 143.
175 Adam B. Ashcraft and Til Schuermann, Understanding the Securitization of Subprime Mortgage Credit, 2, March 2008, accessed April 6, 2026, https://www.newyorkfed.org/research/staff_reports/sr318.html; Glaeser and Sinai, Housing and the Financial, 11.
176 Edward L. Glaeser and Todd M. Sinai, Housing and the Financial Crisis (University of Chicago Press, 2014), 156.
177 Glaeser and Sinai, Housing and the Financial, 156.
shows subprime loans concentrated in a few overheated markets and in communities of color. Within metro areas, subprime share was far higher in zip codes with large Black and Hispanic populations.178 By 2006, it was common knowledge that subprime lending was disproportionately targeted to minority neighborhoods.179 Lower-income, high-unemployment areas also saw greater than average subprime use, though race and segregation were stronger predictors than income.
The originate-to-distribute model meant that Wall Street packaged thousands of local mortgages, many of which were subprime loans, into Mortgage-Backed Securities (MBS) and collateralized debt obligations (CDOs). Private-label securitization exploded after 2000, with subprime and Alt-A (mortgages that were above subprime but below prime) securitization rates rose drastically from 2001 to 2006, topping $1 trillion annually.180 At its peak, three-quarters of subprime loans were securitized the same year, and lenders almost immediately sold new subprime loans into these pools, meaning that virtually none were held on balance sheets.181 These securities were sold widely: pension funds, banks, and foreigners bought slices of dozens of markets at once, under the idea that pooling loans from many states would diversify risk. In theory, geographic diversification should reduce risk; yet, what happened in reality is that housing markets moved together during the boom, meaning that defaults were not independent (contrary to the assumptions made by investors). For example, one study notes that California and Washington DC two very distant markets had a correlation of 0.87 in house prices, and
178 "Cartographies of Race and Class: Mapping the Class‐Monopoly Rents of American Subprime Mortgage Capital," International Journal of Urban and Regional Research 33, no. 2 (2009): https://doi.org/10.1111/j.14682427.2009.00870.x.
179 Wyly et al., "Cartographies of Race."
180 Randall Dodd, "Subprime: Tentacles of a Crisis," International Monetary Fund, https://www.imf.org/external/pubs/ft/fandd/2007/12/dodd.htm
181 Ashcraft and Schuermann, Understanding the Securitization, 6.
the same analysis found that a typical subprime MBS deal had around 28% of its loans in California, indicating high clustering and defaults that became correlated.182 In effect, investors who assumed that the products’ risk would be geographically diversified were caught by surprise, meaning that the synchronization of local housing busts across states invalidated the standard system that supported risk-based markets like insurance.183 As such, when prices fell broadly, many local markets and the MBS backed by them failed together.184
Why Mortgage-Based Financial Derivatives Were More Vulnerable to Risk
Mortgage securitization pooled thousands of home loans into bonds sold to investors. Lenders grouped loans into Mortgage-Backed Securities (MBS) and carved each MBS into tranches (AAA senior down to low-rated equity) with differing payment priorities.185 Investors bought the tranche matching their risk appetite: the safest senior bonds promised first claim on homeowners’ principal and interest, while junior (or equity) pieces absorbed the former’s losses.186 Under the expectation that pooling made risk idiosyncratic, this system allowed for those with lower risk preferences to generate smaller returns and vice versa. In reality, however, many MBS pools contained large concentrations of high-risk loans from the same areas, meaning that when those neighborhoods’ house prices fell, even the senior tranches did not generate enough returns to pay back their investors.187 Eventually, misaligned incentives emerged,
182 Taylor D. Nadauld and Shane M. Sherlund, The Role of the Securitization Process in the Expansion of Subprime Credit, accessed April 6, 2026, https://www.federalreserve.gov/econres/feds/the-role-of-the-securitization-processin-the-expansion-of-subprime-credit.htm.
183 Nadauld and Sherlund, The Role.
184 Nadauld and Sherlund, The Role.
185 Federal Deposit Insurance Corporation, Crisis and Response, 16.
186 Federal Deposit Insurance Corporation, Crisis and Response, 16.
187 James Chen, "Understanding Tranches: Definition, Examples, and Investment Strategies," Investopedia, last modified August 22, 2025, https://www.investopedia.com/terms/t/tranches.asp
creating room for moral hazard: the concept in which one party takes excessive risk with the knowledge that another party will bear the consequences.188 Banks kept originating loans without concern for long-term repayment since originators collected hefty fees by selling mortgages to securitizers and lowered lending standards increased the amount of loans distributed.189 This produced an increasingly risky loan pool, yet rating agencies continued giving high grades to senior tranches.190 In effect, securitization helped intensify the damage caused by subprime loaning by encouraging volume over quality.
Mortgage tranches themselves were repackaged into yet more complex securities. Collateralized debt obligations (CDOs) were created by taking slices of MBS tranches and issuing a new set of senior and junior bonds backed by the pooled cash flows; for example, many high-risk BB- or BBB-rated mezzanine MBS slices were bundled into CDOs.191 The CDO designers assumed defaults across the underlying home loans would be largely uncorrelated, so if each loan pool was geographically diversified, losses in one area would be offset by stability elsewhere. Thus, senior CDO tranches could still be rated AAA as long as enough of the mortgages would pay out. Yet, the assumption of independent risk broke down in practice. By 2007 foreclosures had clustered in pockets of the country; the Fed even found that subprime lending was the most important determinant of neighborhood foreclosure rates, and Immergluck and Smith (2004) estimated that every 100 extra subprime loans in a Chicago neighborhood led
188 Will Kenton, "Moral Hazard: Meaning, Examples, and How to Manage," Investopedia, https://www.investopedia.com/terms/m/moralhazard.asp
189 Federal Deposit Insurance Corporation, Crisis and Response, 10.
190 Federal Deposit Insurance Corporation, Crisis and Response, 7.
191 Federal Deposit Insurance Corporation, Crisis and Response, 17.
to roughly 9 extra foreclosures.192 In such neighborhoods, many mortgages defaulted together. When defaults concentrated like this, even senior CDO tranches unexpectedly took losses.
Another major innovation was the synthetic CDO, which used derivatives rather than actual loans. Instead of buying physical mortgages, synthetic CDOs were bundles of credit default swaps (CDS) on MBS tranches.193 A CDS acted like an insurance; if a bank gave out a mortgage, it could purchase a CDS, which would guarantee that the provider of that service would compensate the bank if the homeowner was to default. The difference here was that one did not have to own the loan being “insured” to buy the CDS, meaning that those that traded CDSs created two parties: the “insurers” and the “insured”. Investors taking a long position would sell these CDSs, indicating that they believe that the homeowner would not default since they would profit if they never had to pay the “insurance” on the home. On the other hand, investors taking a short position would buy CDSs since they are hoping that the homeowner defaults and they receive the profits from those that took the short position. Yet, this also meant that the same mortgage could be insured or wagered on multiple times and that the value put into these wagers could exceed that of the loan itself. When unleashed upon the world, synthetic CDOs exponentially increased the stakes of default. Goldman Sachs alone underwrote dozens of synthetic CDO deals, creating outsized claims on a limited pool of mortgage bonds. As the FCIC report details, one $15 million tranche of subprime bonds ended up referenced by around $85 million of CDS bets.194 Overall, Goldman’s synthetic CDOs referenced 3,408 different mortgage securities several times: a single MBS was cited by nine different CDOs.195 In effect, a
192 Kristopher Gerardi and Paul S. Willen, Subprime Mortgages, Foreclosures, and Urban Neighborhoods, 6, accessed April 6, 2026, https://www.bostonfed.org/publications/public-policy-discussion-paper/2008/subprimemortgages-foreclosures-and-urban-neighborhoods.aspx
193 The Financial Crisis Inquiry Commission, The Financial, 21.
194 The Financial Crisis Inquiry Commission, The Financial, 145.
195 The Financial Crisis Inquiry Commission, The Financial, 145.
modest neighborhood foreclosure could trigger losses not just on the original bond, but on every derivative tied to it. Synthetic CDOs in essence multiplied the effects of each default.196
When U.S. housing prices peaked and then collapsed regionally, the fallout was magnified by these synthetic structures. By mid-2007, Florida and Southwest states, where home prices had soared, saw some of the highest foreclosure rates.197 At the same time, industrial areas (Great Lakes states like Michigan and Illinois) also saw heavy foreclosures despite milder price declines, reflecting local economic weakness intensified by redlining.198 These regional spikes mattered everywhere because Wall Street held claims on them via MBSs, CDOs, and CDSs, among other financial products, meaning that a local surge of defaults on Chicago’s South Side or Detroit mortgage portfolios, for instance, translated into losses on dozens of AAA and AA securities nationwide. In fact, up until this point, federally mandated redlining, as seen in detail especially in Chicago and Detroit, had resulted in consequences isolated to neighborhoods, perhaps at most whole cities. Yet, it was here that at last, these local catastrophes were inextricably tied to products that began to hold a greater share in the nation’s financial marketplace. Financial institutions that had insured these tranches (through CDSs) or retained them as assets faced severe losses. Credit Default Swaps themselves also became a massive risk for companies heavily invested in them since CDSs were marketed as insurance on mortgage bonds, and major insurers issued vast amounts of it.199 AIG Financial Products, for example, sold
196 The Financial Crisis Inquiry Commission, The Financial, 146.
197 William R. Emmons et al., "The Foreclosure Crisis in 2008: Predatory Lending or Household Overreaching?," Federal Reserve Bank of St. Louis, last modified July 1, 2011, accessed April 6, 2026, https://www.stlouisfed.org/publications/regional-economist/july-2011/the-foreclosure-crisis-in-2008 predatorylending-or-household-overreaching.
198 Emmons et al., "The Foreclosure," Federal Reserve Bank of St. Louis.
199 Adam Hayes, "Credit Default Swap: What It Is and How It Works," Investopedia, accessed April 6, 2026, https://www.investopedia.com/terms/c/creditdefaultswap.asp
tens of billions in CDS protection on CDO tranches.200 Banks often insured MBS holdings with CDSs (to reduce capital charges) or even speculated on defaults. However, when foreclosures surged, CDS sellers, who had been collecting steady fees, suddenly owed huge payouts. AIG and several other companies could not cover these obligations, necessitating a government bailout.
To put it shortly, financial engineering turned localized housing losses into a global crisis. Securitization was supposed to disperse risk, but concentrated subprime lending and correlated defaults meant losses spread through the network of MBS pools. Tranching and CDOs created layers of complexity that implicitly downplayed default correlation, and Synthetic CDOs and CDS then multiplied exposures, meaning one mortgage default could ripple through hundreds of instruments. The end result was that stress in a few urban neighborhoods turned into stress on the entire financial system, demonstrating how poorly regulated products changed a mortgage boom into a nationwide crisis.
Rating Agencies
Rating agencies such as Moody’s, S&P, and Fitch used proprietary statistical models to assign AAA, AA, etc. grades to securitized home loans stacked in MBSs and CDOs. These models typically assumed 3 main things: first, geographic diversification, or the idea that mortgage defaults across states or neighborhoods were largely independent or had a low enough correlation; secondly, the notion that large drops in house prices were historically confined to a few specific regions, so a simultaneous national decline was deemed very unlikely; and lastly, the fact that extreme default scenarios were deemed very low probability, based on modest
200 The Financial Crisis Inquiry Commission, The Financial, xxiv.
downturns in the recent past.201 Another issue was that agencies calibrated their models using housing data from the 1990s to the early 2000s and often employed normal loss distributions.202 Research shows that structured-finance default rates are extremely sensitive to correlation assumptions, meaning that small underestimate of default correlation among subprime loans could thus greatly understate loss risk.203 Likewise, the IMF noted that before 2007 CRAs assumed only around 20 to 25% of loans would need to default to exhaust credit buffers on a AAA subprime tranche, and that it would be nearly impossible for such a large proportion of defaults to occur at once.204 In reality, while a AAA-rated corporate bond had a probability close to 0.05% of defaulting, AAA-rated Subprime MBSs were much riskier, meaning that the CDOs dependent on these MBSs were more fragile than initially thought as well.205 By treating localized losses as isolated events, imperfect models essentially gave investors a false sense of safety.
In fact, empirical evidence shows subprime mortgages were highly clustered in vulnerable communities. Residential segregation and historic redlining created large swaths of predominantly-minority, poor neighborhoods that mainstream banks avoided yet became targets of predatory lenders.206 When the bubble burst, foreclosures hit those areas hardest, with one
201 Shuang Zhu and R. Kelley Pace, "Modeling Spatially Interdependent Mortgage Decisions," SSRN Electronic Journal, 2011, 1, https://doi.org/10.2139/ssrn.1929171; Amadou N. Sy, "The Systemic Regulation of Credit Rating Agencies and Rated Markets," IMF Working Papers 09, no. 129 (2009): 12, https://doi.org/10.5089/9781451872767.001.
202 University of Northern Carolina at Charlotte, "Fat Tailed Distribution and the 2008 Financial Crisis," University of Northern Carolina at Charlotte, https://sds.charlotte.edu/fat-tailed-distribution-and-the-2008-financial-crisis/; Sehyeok Park and Rajit Chatterjea, "Incorrectly Applying Default Correlation Theory: The Causes of the Subprime Mortgage Crisis of 2008," The National High School Journal of Science, https://nhsjs.com/2025/incorrectlyapplying-default-correlation-theory-the-causes-of-the-subprime-mortgage-crisis-of-2008/.
203 Adam Ashcraft et al., MBS Ratings and the Mortgage Credit Boom, 10, May 2010, accessed April 6, 2026, https://www.newyorkfed.org/research/staff_reports/sr449.html
204 Sy, "The Systemic," 19-20.
205 Sy, "The Systemic," 19-20.
206 Rugh and Massey, "Racial Segregation."
analysis finding that in 2006 lenders who later failed made 74% of loans to black borrowers subprime versus 54% for whites, and that foreclosures accumulated disproportionately in highsegregation, low-income tracts.207 Nearby loans influence each other, as default probability is strongly affected by neighboring mortgage characteristics.208 Because rating models effectively averaged risk across an idealized diversified pool, they missed that clusters of failures could wipe out even senior tranches. On top of these modeling errors, there were conflicts of interest preventing accurate ratings of the tranches. The rating industry was effectively an oligopoly, and issuers paid for ratings.209 Agencies had little commercial incentive to outcompete each other by issuing lower ratings, meaning that rating shopping was common.210 A 2007 SEC examination revealed that agencies struggled to model MBS and CDO risks and often had no written procedures for these complex securities.211 Worse, one agency complained that competitors were trying to squeeze them out of deals by “notching,” where they threatened to downgrade or withhold ratings on a security unless a large fraction of the pool was also placed with them.212 In essence, this meant agencies protected market share by granting deals the ratings issuers wanted. The issuer-paid model thus created a moral hazard; CRAs could collect fees by affirming AAA ratings on highly leveraged instruments under the assumption that they would not suffer from the fallout.
207 Rugh and Massey, "Racial Segregation."
208 Zhu and Pace, "Modeling Spatially."
209 "The Credit Rating Controversy," Council on Foreign Relations, last modified February 19, 2015, https://www.cfr.org/backgrounders/credit-rating-controversy.
210 "The Credit," Council on Foreign Relations.
211 U. S. Securities and Exchange Commission, Annual Report on Nationally Recognized Statistical Rating Organizations, 39, September 2009.
212 Sy, "The Systemic," 21.
Section VI: Counterarguments
Redlining Was Made to Determine Which Neighborhoods Were Lending Risks: Naturally, Should These Poorer Areas Not Receive A Larger Proportion of Subprime Loans and Foreclosures?
While it is true that historically redlined areas tend to be lower-income, multiple analyses show that the detriments of holding a previously redlined status extend beyond income levels.213 For example, a study of subprime lending found that African‐American and Hispanic borrowers were 1.6 times more likely than whites to get subprime loans from 2004 to 2008, even though those groups often had similar incomes.214 In other words, two neighborhoods with the same poverty rate experienced very different lending outcomes if one was redlined, which Rugh and Massey attribute to the fact that redlining reduced home equity and bank investment in minority areas for decades.215 Segregated tracts often lack local banks, have weaker credit histories, and suffer from chronic disinvestment, so lenders rely on expensive subprime options. These institutional differences mean that neighborhoods with approximately similar income levels can have very different financial ecosystems, and when researchers regress foreclosure or subprime rates on factors like income or house-price change, the HOLC redlining grade still appears as statistically significant, indicating that it adds explanatory power.216 For instance, controlling for income and demographics, black neighborhoods (many originally redlined) received far more subprime loans than white neighborhoods with the same earnings, demonstrating that income
213 Jackelyn Hwang et al., "Segregation and Subprime Lending within and across Metropolitan Areas," University of Wisconsin-Madison, accessed April 6, 2026, https://www.irp.wisc.edu/resource/segregation-and-subprimelending-within-and-across-metropolitan-areas/; Rugh and Massey, "Racial Segregation."
214 Hwang et al., "Segregation and Subprime," University of Wisconsin-Madison.
215 Rugh and Massey, "Racial Segregation."
216 Hwang et al., "Segregation and Subprime," University of Wisconsin-Madison; Rugh and Massey, "Racial Segregation."
alone does not explain the disparity.217 Even if neighborhoods today look similar in average income, the one with a redlined past often faces worse credit terms and outcomes, undermining the claim that an area’s status as previously redlined as a factor driving foreclosures can be explained away by poverty level.218
The Financial Crisis of 2008 Was Mainly Exacerbated by the Housing Bubble Rather Than Redlining’s Expansion of Areas Targeted
by Subprime Loan Providers
National house-price inflation certainly fueled the crisis, but the housing bubble hit some regions harder than others, with Florida, Arizona, and Nevada, among others, seeing outsized price booms and foreclosure spikes; despite this, the behavior of their markets were consistent with the characteristics of a bubble.219 However, other areas, especially in the industrial Midwest, had only modest price gains but still very high foreclosures.220 For example, Michigan and Illinois had moderate home-price growth before 2007, yet experienced foreclosure rates above the national average.221 In reality, many minority neighborhoods, often redlined in the past, saw more foreclosures than their price growth would predict, as seen by how controlling for local house-price decline does not fully eliminate the effect of a neighborhood’s historical HOLC grade.222 Thus, while speculative excess played a major role, it cannot alone account for why the crisis reached the level that it did.
217 Hwang et al., "Segregation and Subprime," University of Wisconsin-Madison.
218 Rugh and Massey, "Racial Segregation;" Emily E. Lynch et al., "The Legacy of Structural Racism: Associations between Historic Redlining, Current Mortgage Lending, and Health," SSM - Population Health 14 (June 2021): https://doi.org/10.1016/j.ssmph.2021.100793.
219 Emmons et al., "The Foreclosure," Federal Reserve Bank of St. Louis.
220 Emmons et al., "The Foreclosure," Federal Reserve Bank of St. Louis.
221 Emmons et al., "The Foreclosure," Federal Reserve Bank of St. Louis.
222 Hwang et al., "Segregation and Subprime," University of Wisconsin-Madison; Rugh and Massey, "Racial Segregation."
The Fair Housing Act Ended Discriminatory Lending; How Can We Fault Redlining When It Ended Decades Ago?
Legislation like the 1968 Fair Housing Act outlawed formal redlining, but it continued through de facto redlining. Historical redlining still predicted lending patterns decades later; in Milwaukee, researchers found that neighborhoods redlined in the 1930s are much more likely today to receive high-cost loans or very few loans.223 Even with anti-discrimination laws, redlining had long restructured neighborhoods: it depressed home values, thinned the tax base, and made banks leave or reluctant to open branches.224 As a result, formerly redlined communities often remained credit-poor banking deserts, which the law alone did not fix. At the end of the day, legally invalidating the discriminatory underwriting is not the same as undoing decades of disinvestment, closing the wealth gap, and reviving the real estate market of affected areas.
225 One clarification this paper will make is that banks post-Fair Housing Act were not discriminating by leaving deteriorating neighborhoods; after all, they were merely following the laws governing the free market. However, this changed when banks began targeting minority neighborhoods for subprime mortgages. One could reasonably argue that the fact that 47% of mortgages by Hispanics and 53% of mortgages for African Americans were subprime in 2006 (compared to 26% for Whites) is due to preexisting discrepancies in wealth, studies from the Federal Reserve and the Wharton School of Business and the Center for Responsible Lending show that even after controlling for credit risk, a positive relationship exists between the amount of subprime loans and the proportion of minorities in a neighborhood; for the latter study,
223 Lynch et al., "The Legacy," 1.
224 Rugh and Massey, "Racial Segregation;" Lynch et al., "The Legacy."
225 Rugh and Massey, "Racial Segregation;" Lynch et al., "The Legacy."
Hispanic and African American borrowers had a 30% greater chance of receiving subprime loans despite accounting for differences in credit scores, heavily suggesting discriminatory intent in subprime loan distribution.226
Section VII: Policy Implications and Continuity
Even after the crisis, continued inequalities in finance have not been fully addressed. While the Dodd-Frank Act and related reforms aim to prevent a repeat of the subprime crisis, they do little to erase past disparities. Dodd-Frank enhanced underwriting standards such as by requiring lenders to make a “good faith determination” as to the consumer’s ability to repay a loan (by calculating debt-to-income ratios and taking into account income and employment among many other factors) and bolstered regulation by mandating escrow accounts and creating the Consumer Financial Protection Bureau (CFPB).227 However, these measures targeted future risk and did not directly remedy decades of racial wealth and credit stratification, meaning that fundamental gaps continued to exist unameliorated. Historically redlined families suffered home value deficits and lost wealth that a mere rule change could not restore. Wealth divergence remains extreme, with the median white family’s wealth roughly being 10 times that of a Black family today.228 This racial wealth gap means future borrowers enter any loan scenario on very different footing.
226 Algernon Austin, "Subprime Mortgages Are Nearly Double for Hispanics and African Americans," Economic Policy Institute, last modified June 10, 2008, https://www.epi.org/publication/webfeatures_snapshots_20080611/. 227 "Dodd-Frank Act Mortgage Regulations," Consumer Compliance Outlook, https://www.consumercomplianceoutlook.org/2013/fourth-quarter/dodd-frank-mortgage-regulations
228 Kedra Newsom Reeves et al., "Racial Equity in Banking Starts with Busting the Myths," BCG, https://www.bcg.com/publications/2021/unbanked-and-underbanked-households-breaking-down-the-mythstowards-racial-equity-in-banking
Furthermore, home appraisals still rely on recent sale prices of comparable houses. Since redlined neighborhoods underwent decades of underinvestment, their recent sale prices tend to lag. Even if the appraiser does not discriminate, the market sees lower prices in those areas, leading to nearly identical houses that can appraise for tens of thousands of dollars less simply because they are in historically redlined blocks. Yet, discrimination by appraisers also unfortunately continues as a problem: the CFPB and DOJ have documented numerous cases, one example being how a Black family in Baltimore removed Black family photos and attempted to “whitewash” their home and received a 59% higher appraisal.229 In response, the Biden administration created the PAVE task force to address appraisal disparities, but these efforts confirm that appraisal bias has not been fixed by prior reforms.230
Access to mainstream banking remains highly uneven by neighborhood. Many predominantly Black and poor communities are banking deserts, with residents still relying on high-cost alternative financial services like payday lenders and check-cashers.231 This structural financial segregation persists because major banks have little incentive to enter or expand in lowincome neighborhoods without governmental pressure. Until recently, mergers have often reduced branch density, causing the net effect of people in formerly redlined areas often having no easy access to affordable credit. Relying on AFS then further reinforces inequality since high fees and lack of credit-building opportunities keep those communities locked out of lower-cost loans and savings accounts.232 Since Dodd-Frank and other reforms did not mandate branch openings or undo the rise of fringe lenders, the clustering of AFSs remains a visible vestige of
229 Seth Frotman et al., "Protecting Homeowners from Discriminatory Home Appraisals," Consumer Financial Protection Bureau, last modified March 13, 2023, https://www.consumerfinance.gov/about-us/blog/protectinghomeowners-from-discriminatory-home-appraisals/
230 Frotman et al., "Protecting Homeowners," Consumer Financial Protection Bureau.
231 Reeves et al., "Racial Equity," BCG.
232 Reeves et al., "Racial Equity," BCG.
past redlining. Policy responses in places such as Chicago have begun to address this. Public officials emphasize banking the unbanked through Illinois’s “Bank On” initiative to connect lowincome neighborhoods with no-fee or low-fee accounts.233 Community organizations like My Block My Hood My City also venture around the city and help residents open accounts while promoting financial literacy.234 Illinois also passed the Predatory Loan Prevention Act in 2021, forcing many shops providing loans with interest rates greater than 36% APR to change their rates.235
Conclusion
As the full, intertwined nature of the relationship between not merely redlining and the Financial Crisis of 2008 but federally endorsed discriminatory practices and the financial health of approximately 11 million people decades later has been laid bare, it is much easier to understand the implications of the kitchenette from which the journey began.236 The kitchenette represents the hopes of people like its inhabitants, trapped in disinvested communities and all too familiar with payday lenders. It represents the precarious state of those residing within it, both physically and financially, and the inevitable weight it will continue to rest upon the shoulders of
233 "Welcome to Bank On Illinois," Susana A. Mendoza Illinois State Comptroller, https://illinoiscomptroller.gov/constituent-services/public-services-community-programs/bankon-illinois; "About Us," Bank On Chicago, accessed April 6, 2026, https://bankonchicago.com/about-us/.
234 Jamie Nesbitt Golden, "My Block, My Hood, My City Helps South Siders Ditch the Currency Exchange, Get Bank Accounts of Their Own," Block Club Chicago, last modified February 3, 2020, https://blockclubchicago.org/2020/02/03/jahmal-cole-its-not-regular-bank-announts-chatham-currency-exchange/
235 David L. Beam et al., "Illinois Imposes Strict 36% Usury Cap for a Range of Consumer Finance Products and Providers," Mayer Brown, last modified April 23, 2021, https://www.mayerbrown.com/en/insights/publications/2021/04/illinois-imposes-strict-36-usury-cap-for-a-range-ofconsumer-finance-products-and-providers
236 Andre M. Perry and David Harshbarger, "America's Formerly Redlined Neighborhoods Have Changed, and so Must Solutions to Rectify Them," Brookings, https://www.brookings.edu/articles/americas-formerly-redlines-areaschanged-so-must-solutions/
generations to come. Most of all, it represents the vulnerability of those living in such communities, and how government negligence repeatedly resulted in those with the least paying the costliest prices. While redlining exacerbated the nation’s suffering during the crisis as a result, areas within Chicago and Detroit were already suffering for decades preceding it. Had the consequences of redlining (beyond just the cause itself) been addressed with more care earlier on, the impact and recovery from the Great Recession would have been felt to a much lesser extent. To put the situation in an analogy, it is not the illness itself that kills, but rather complications from it, such as fevers or pneumonia, that do. In the same way, even after the practice of redlining was long gone, the disinvestment and spiraling deterioration that continued in these areas failed to be addressed, leading to local and national disaster.
This paper will close with an examination of the damage done after the financial crisis, namely by observing whether the disproportionate effect on some communities follows past trends and considering whether the government’s method of reining in the damage sufficiently accounts for the greater impact of the crisis upon different demographics. Evidently, the crisis only increased the wealth gap, with white households having 13 times the wealth of Black households and 10 times the wealth of Hispanic households.
237 For non-Hispanic Black households, median wealth fell 33.7% from 2010 to 2013, while Hispanics experienced a 14.3% decrease in the same time period; conversely, white households experienced a slight increase in wealth, though all demographics in the study still had not returned to pre-recession median wealth levels.238 Possible explanations for the growing gap include the fact that Hispanic and Black households did not accumulate savings as quickly as their white counterparts, as seen from
237 Rakesh Kochhar and Richard Fry, Wealth Inequality Has Widened along Racial, Ethnic Lines since End of Great Recession, December 12, 2014, accessed January 26, 2026, https://www.pewresearch.org/shortreads/2014/12/12/racial-wealth-gaps-great-recession/
238 Kochhar and Fry, Wealth Inequality.
a decrease in income by 9% as compared to 1%, respectively, from 2010 to 2013.239 In addition, white families are much more likely to own financial assets in comparison to their non-white counterparts included in the study, meaning they were positioned more favorably for economic recovery as well.240 However, the decrease in homeownership rate was over 3 times greater for non-whites in the survey than for whites (6.5% in comparison to 2% respectively), indicating that obstacles continue standing in the way of those historically disadvantaged against homeownership.241
Figure 4: A graph from the Pew Research Center shows the progression in the size of the wealth gap before and after the Great Recession. In both comparisons, the wealth gap grew after 2008.
239 Kochhar and Fry, Wealth Inequality.
240 Kochhar and Fry, Wealth Inequality.
241 Kochhar and Fry, Wealth Inequality.
Figure 5: A bar chart from the Pew Research Center compares the median net worth of households for households of different races from 2007 to 2013.
Two of the most notable policies released post-crisis were the Troubled Asset Relief Act (TARP Act) and the American Recovery and Reinvestment Act of 2009 (ARRA).242 TARP successfully injected $245 billion in capital into 5 bank programs, preventing a collapse of the banking sector, while ARRA was a stimulus package meant to energize the job market, provide tax relief, and invest in infrastructure.243 While overall these policies were crucial in saving the nation from economic collapse, studies continue to show that more can be done to amend for
242 Christian E. Weller, "10 Reasons Why Public Policies Rescued the U.S. Economy," CAP, last modified May 29, 2012, https://www.americanprogress.org/article/10-reasons-why-public-policies-rescued-the-u-s-economy/. 243 U.S. Department of the Treasury, "Bank Investment Programs," U.S. Department of the Treasury, https://home.treasury.gov/data/troubled-assets-relief-program/bank-investment-programs; Adam Hayes, "American Recovery and Reinvestment Act (ARRA): Definition and Components," Investopedia, https://www.investopedia.com/terms/a/american-recovery-and-reinvestmentact.asp#:~:text=Jasmin%20Merdan%20/%20Getty%20Images,Recovery%20and%20Reinvestment%20Act%20(AR RA)
those who have been disadvantaged by the government’s actions and still feel those effects today.
Bibliography
Aaronson, Daniel, Jacob Faber, Daniel Hartley, Bhashkar Mazumder, and Patrick Sharkey. "The Long-run Effects of the 1930s HOLC 'redlining' Maps on Place-based Measures of Economic Opportunity and Socioeconomic Success." Regional Science and Urban Economics 86 (January 2021): 103622. Accessed February 11, 2026. https://doi.org/10.1016/j.regsciurbeco.2020.103622.
Aaronson, Daniel, Daniel Hartley, and Bhashkar Mazumder. "The Effects of the 1930s HOLC 'Redlining' Maps." American Economic Journal: Economic Policy 13, no. 4 (2021): 35592. https://doi.org/10.1257/pol.20190414.
"About Us." Bank On Chicago. Accessed April 6, 2026. https://bankonchicago.com/about-us/.
Acharya, Viral V., Matthew Richardson, Stijn Van Nieuwerburgh, and Lawrence J. White. Guaranteed to Fail : Fannie Mae, Freddie Mac, and the Debacle of Mortgage Finance. Princeton University Press, 2011.
Appleton, Sarah, The Wise Apple, and National Geographic Society. "MapMaker: Redlining in the United States." National Geographic. Accessed February 11, 2026. https://education.nationalgeographic.org/resource/mapmaker-redlining-united-states/.
Ashcraft, Adam, Paul Goldsmith-Pinkham, and James Vickery. MBS Ratings and the Mortgage Credit Boom. May 2010. Accessed April 6, 2026. https://www.newyorkfed.org/research/staff_reports/sr449.html.
Ashcraft, Adam B., and Til Schuermann. Understanding the Securitization of Subprime Mortgage Credit. March 2008. Accessed April 6, 2026. https://www.newyorkfed.org/research/staff_reports/sr318.html.
Austen, Ben. High-risers: Cabrini-Green and the Fate of American Public Housing. Harper, an imprint of HarperCollins Publishers, 2019.
Austin, Algernon. "Subprime Mortgages Are Nearly Double for Hispanics and African Americans." Economic Policy Institute. Last modified June 10, 2008. https://www.epi.org/publication/webfeatures_snapshots_20080611/.
Ballew, Paul D., and Robert H. Schnorbus. "Auto Industry Restructuring and the Midwest Economy." Federal Reserve Bank of Chicago. Last modified June 1993. Accessed April 6, 2026. https://www.chicagofed.org/publications/chicago-fed-letter/1993/june70#:~:text=Such%20numbers%20make%20clear%20that,divisional%20activities%20and %20world%20headquarters.
Battista, Jackson. "Deindustrialization of Detroit: The Costs of Movement." Essays in Economic and Business History. Accessed April 5, 2026. https://ebhsoc.org/journal/index.php/ebhs/article/view/532.
Beam, David L., Steven M. Kaplan, Eric M. Mitzenmacher, Jeffrey P. Taft, and Daniel B. Pearson. "Illinois Imposes Strict 36% Usury Cap for a Range of Consumer Finance Products and Providers." Mayer Brown. Last modified April 23, 2021. https://www.mayerbrown.com/en/insights/publications/2021/04/illinois-imposes-strict36-usury-cap-for-a-range-of-consumer-finance-products-and-providers.
Benetton, Matteo, Marianna Kudlyak, Louis Liu, John Mondragon, and Mitchell Ochse. "Passing along Housing Wealth from Parents to Children." Federal Reserve Bank of San Francisco. Last modified November 21, 2022. Accessed March 31, 2026. https://www.frbsf.org/research-and-insights/publications/economicletter/2022/11/passing-along-housing-wealth-from-parents-to-children/.
Benzow, August, and Kenan Fikri. The Persistence of Neighborhood Poverty: Examining the Power of Inertia and the Rarity of Neighborhood Turnaround across U.S. Cities. May 2020. Accessed March 21, 2026.
Block. "What Banking Deserts Mean for More than 12 Million Americans." Block. Last modified October 11, 2024. Accessed March 21, 2026. https://block.xyz/inside/whatbanking-deserts-mean-for-more-than-twelve-million-americans.
Boilard, Steve D. "Redlining." In Civil Rights Movements: Past and Present, 2nd ed. https://online-salempresscom.harker.idm.oclc.org/articleDetails.do?bookId=1086&articleName=CivRight2e_0284 &searchText=redlining&searchOperators=exact&category=History.
Brandsaas, Eirik Eylands. "Illiquid Homeownership and the Bank of Mom and Dad." Finance and Economics Discussion Series, nos. 2025-094 (September 2025). Accessed March 31, 2026. https://doi.org/10.17016/feds.2025.094.
Braunstein, Sandra F. Subprime Mortgages. March 27, 2007. Accessed April 6, 2026. https://www.federalreserve.gov/newsevents/testimony/braunstein20070327a.htm#:~:text =One%20of%20the%20products%20of,expanded%20access%20to%20subprime%20mor tgage.
Broady, Kristen, Mac McComas, and Amine Ouazad. "An Analysis of Financial Institutions in Black-majority Communities: Black Borrowers and Depositors Face Considerable Challenges in Accessing Banking Services." Brookings. Accessed November 2, 2021. https://www.brookings.edu/articles/an-analysis-of-financial-institutions-in-blackmajority-communities-black-borrowers-and-depositors-face-considerable-challenges-inaccessing-bankingservices/#:~:text=Since%202010%2C%20the%20number%20of%20banks%20in,of%20t he%20U.S.%20(Fox%2C%20et%20al.%2C%202019).
Brooker, Jena. "Detroit's Cost for Automotive Growth: Generational Displacement." Bridge Detroit. Last modified June 26, 2023. Accessed April 5, 2026. https://www.bridgedetroit.com/detroits-cost-for-automotive-growth-generationaldisplacement/#:~:text=In%20the%20early%201900s%2C%20Detroit,in%20The%20Mot or%20City%20for.
The Brookings Institution Center on Urban and Metropolitan Policy. "Chicago in Focus: A Profile from Census 2000." Infographic. Brookings, November 1, 2003. https://www.brookings.edu/articles/chicago-in-focus-a-profile-from-census-2000/.
Brown, Adrienne R. The Residential Is Racial : A Perceptual History of Mass Homeownership Stanford University Press, 2024.
Brueckner, Jan K., and Richard W. Martin. "Spatial Mismatch: An Equilibrium Analysis." Regional Science and Urban Economics 27, no. 6 (1997): 693-714. https://doi.org/10.1016/s0166-0462(97)00004-5.
Caref, Carol. "Chicago: Segregated on Purpose." Chicago Teachers Union. Last modified July 7, 2015. Accessed March 10, 2026. https://www.ctulocal1.org/posts/chicago-segregated-onpurpose/.
Chen, James. "Understanding Tranches: Definition, Examples, and Investment Strategies." Investopedia. Last modified August 22, 2025. https://www.investopedia.com/terms/t/tranches.asp#:~:text=Tranches%20in%20structure d%20finance%20emerged,%2C%20mortgages%2C%20and%20other%20debts.
The Chicago Urban League. "100 Years and Counting: The Enduring Legacy of Racial Residential Segregation in Chicago in the Post-Civil Rights Era." In CULtivate. https://chiul.org/wp-content/uploads/2019/01/CULtivate-Part-1_Residential-Segregationand-Housing-Transportation_Full-Draft_FINAL.pdf.
Consumer Federation of America. "Penalized: The Hidden Cost of Credit Score in Homeowners Insurance Premiums." Consumer Federation of America. Last modified August 12, 2025. Accessed March 21, 2026. Federal Deposit Insurance Corporation, 2017 FDIC National Survey of Unbanked and Underbanked https://www.fdic.gov/household-survey/2017fdic-national-survey-unbanked-and-underbankedhouseholds#:~:text=Some%20segments%20of%20the%20population,of%20working%2 Dage%20nondisabled%20households.
Consumer Finance Protection Bureau. CFPB Consumer Laws and Regulations. https://files.consumerfinance.gov/f/201306_cfpb_laws-and-regulations_ecoa-combinedjune-2013.pdf.
Consumer Financial Protection Bureau. "What Is a Credit Score?" Consumer Financial Protection Bureau. Accessed April 5, 2026. https://www.consumerfinance.gov/askcfpb/what-is-a-credit-score-en-315/.
Consumer Financial Protection Bureau. "What Is a Home Equity Line of Credit (HELOC)?" Consumer Financial Protection Bureau. Accessed April 5, 2026. https://www.consumerfinance.gov/ask-cfpb/what-is-a-home-equity-line-of-credit-helocen-107/.
Consumer Financial Protection Bureau. "What Is a Payday Loan?" Consumer Financial Protection Bureau. https://www.consumerfinance.gov/ask-cfpb/what-is-a-payday-loanen-1567/.
"The Credit Rating Controversy." Council on Foreign Relations. Last modified February 19, 2015. https://www.cfr.org/backgrounders/credit-rating-controversy.
Department of Justice. "Justice Department Reaches Settlement with Wells Fargo Resulting in More than $175 Million in Relief for Homeowners to Resolve Fair Lending Claims." Department of Justice. Last modified July 12, 2012. Accessed April 5, 2026.
https://www.justice.gov/archives/opa/pr/justice-department-reaches-settlement-wellsfargo-resulting-more-175-million-relief.
"Detroit: Past and Future of a Shrinking City." Economy League. https://www.economyleague.org/resources/detroit-past-and-future-shrinkingcity#:~:text=square%20miles,that%20higher%20neighborhood%20vacancy%20rates.
Dodd, Randall. "Subprime: Tentacles of a Crisis." International Monetary Fund. https://www.imf.org/external/pubs/ft/fandd/2007/12/dodd.htm.
"Dodd-Frank Act Mortgage Regulations." Consumer Compliance Outlook. https://www.consumercomplianceoutlook.org/2013/fourth-quarter/dodd-frank-mortgageregulations/#:~:text=Creditors%20must%20make%20a%20reasonable,comply%20with% 20the%20ATR%20requirement.
Drumb, Richard. "Detroit's Housing Debacle." Medium. Last modified January 23, 2022. Accessed April 6, 2026. https://rcdrumb.medium.com/detroits-housing-debacle4a3d2387349e.
Eastabrook, Diane. "Unbanked and Broke: How Banking Deserts Perpetuate Poverty on Chicago's Southside." Substack. Last modified August 12, 2020. Accessed April 5, 2026. https://americaincontext.substack.com/p/unbanked-and-broke-how-banking-deserts.
Emmons, William R., Kathy Fogel, Wayne Y. Lee, Deena Rorie, Liping Ma, and Timothy J. Yeager. "The Foreclosure Crisis in 2008: Predatory Lending or Household Overreaching?" Federal Reserve Bank of St. Louis. Last modified July 1, 2011. Accessed April 6, 2026. https://www.stlouisfed.org/publications/regional-economist/july-2011/theforeclosure-crisis-in-2008 predatory-lending-or-householdoverreaching#:~:text=Figure%203%20is%20a%20map,more%20likely%20driven%20by %20a.
Engel, Emily. "Changing Banking Infrastructure: Access to Credit by Detroit's Small Businesses." Federal Reserve Bank of Chicago. Last modified February 2, 2012. Accessed April 6, 2026. https://www.chicagofed.org/publications/blogs/cdps/2012/changing-bankinginfrastructure#:~:text=Perhaps%20the%20most%20basic%20finding,area%20covered%2 0and%20population%20density.
Faber, Jacob W. "Racial Dynamics of Subprime Mortgage Lending at the Peak." Housing Policy Debate 23, no. 2 (2013): 328-49. https://doi.org/10.1080/10511482.2013.771788.
Federal Deposit Insurance Corporation. Crisis and Response: An FDIC History, 2008–2013. April 1, 2018. Accessed April 5, 2026. https://archive.fdic.gov/view/fdic/6681.
Federal Deposit Insurance Corporation. 2017 FDIC National Survey of Unbanked and Underbanked Households. October 2018. Accessed March 21, 2026. https://www.fdic.gov/household-survey/2017-fdic-national-survey-unbanked-and-
underbankedhouseholds#:~:text=Some%20segments%20of%20the%20population,of%20working%2 Dage%20nondisabled%20households.
Federal Housing Administration. Underwriting Manual: Underwriting and Valuation Procedure under Title II of the National Housing Act. Digital file.
Federal Housing Administration. Underwriting Manual: Underwriting and Valuation Procedure under Title II of the National Housing Act. 1938. Accessed February 12, 2026. https://www.huduser.gov/portal/sites/default/files/pdf/Federal-Housing-AdministrationUnderwriting-Manual.pdf.
Federal Housing Finance Agency. A Brief History of the Housing Government-Sponsored Enterprises. Accessed March 30, 2026.
Federal Housing Finance Agency. "Exploring Appraisal Bias Using UAD Aggregate Statistics." Federal Housing Finance Agency. Last modified November 2, 2022. Accessed March 30, 2026. https://www.fhfa.gov/blog/insights/exploring-appraisal-bias-using-uad-aggregatestatistics.
Federal Reserve. Report on the Economic Well-Being of U.S. Households in 2024 - May 2025. By Board of Governors. Accessed April 5, 2026. https://www.federalreserve.gov/publications/2025-economic-well-being-of-ushouseholds-in-2024-housing.htm.
FICO. "What's in my FICO Scores?" FICO. Accessed April 5, 2026. https://www.myfico.com/credit-education/whats-in-your-credit-score.
The Financial Crisis Inquiry Commission. The Financial Crisis Inquiry Report: Final Report of the National Commission on the Causes of the Financial and Economic Crisis in the United States. January 2011. Accessed April 5, 2026. https://fcic.law.stanford.edu/report.
Fleming, Anne. City of Debtors: A Century of Fringe Finance. Harvard University Press, 2018. Digital file.
"Following the Yellowlined Road." Institute for Housing Studies at DePaul University. Last modified October 29, 2020. Accessed April 5, 2026. https://www.housingstudies.org/news/following-yellowlinedroad/#:~:text=B%20neighborhoods%20across%20the%20United,lower%20on%20the%2 0yellowlined%20side.
Frotman, Seth, Zixta Q. Martinez, and Jon Seward. "Protecting Homeowners from Discriminatory Home Appraisals." Consumer Financial Protection Bureau. Last modified March 13, 2023. https://www.consumerfinance.gov/about-us/blog/protectinghomeowners-from-discriminatory-homeappraisals/#:~:text=To%20help%20ensure%20appraisals%20used,for%20the%20District %20of%20Maryland.
Garnett, Allie Grace. "What It Means to Be Unbanked or Underbanked." Britannica Money. Accessed March 21, 2026. https://www.britannica.com/money/unbanked-andunderbanked.
Gerardi, Kristopher, and Paul S. Willen. Subprime Mortgages, Foreclosures, and Urban Neighborhoods. Accessed April 6, 2026. https://www.bostonfed.org/publications/publicpolicy-discussion-paper/2008/subprime-mortgages-foreclosures-and-urbanneighborhoods.aspx.
Glaeser, Edward L., and Todd M. Sinai. Housing and the Financial Crisis. University of Chicago Press, 2014.
Golden, Jamie Nesbitt. "My Block, My Hood, My City Helps South Siders Ditch the Currency Exchange, Get Bank Accounts of Their Own." Block Club Chicago. Last modified February 3, 2020. https://blockclubchicago.org/2020/02/03/jahmal-cole-its-not-regularbank-announts-chatham-currency-exchange/.
"The Great Migration (1910-1970)." National Archives. Accessed March 10, 2026. https://www.archives.gov/research/african-americans/migrations/greatmigration#:~:text=The%20Great%20Migration%20was%20one%20of%20the,freedom% 20from%20the%20oppression%20of%20Jim%20Crow.
Green, Dan. "Specific U.S. Census Tracts Give Access to Below-Market Mortgage Rates." The Mortgage Reports. Last modified March 31, 2016. Accessed March 30, 2026. https://themortgagereports.com/18912/census-tract-low-income-high-minority-mortgagerates-homeready.
Hayes, Adam. "American Recovery and Reinvestment Act (ARRA): Definition and Components." Investopedia. https://www.investopedia.com/terms/a/american-recoveryand-reinvestmentact.asp#:~:text=Jasmin%20Merdan%20/%20Getty%20Images,Recovery%20and%20Rei nvestment%20Act%20(ARRA).
Hayes, Adam. "Credit Default Swap: What It Is and How It Works." Investopedia. Accessed April 6, 2026. https://www.investopedia.com/terms/c/creditdefaultswap.asp.
Healy, Tori, Nathan Anderson, and Jonathan Lanning. "New Evidence on Where Payday Lenders Locate Their Storefronts." Federal Reserve Bank of Chicago. Last modified July 2024. https://www.chicagofed.org/publications/chicago-fedletter/2024/496#:~:text=%2A%20Over%20two,Hispanic%20White%20to%20the%20U. S.
Hegerty, Scott W. "'Banking Deserts,' Bank Branch Losses, and Neighborhood Socioeconomic Characteristics in the City of Chicago: A Spatial and Statistical Analysis." The Professional Geographer 72, no. 2 (2019): 194-205. Accessed April 5, 2026. https://doi.org/10.1080/00330124.2019.1676801.
Herbert, Christopher E., Daniel T. McCue, and Rocio Sanchez-Moyano. Is Homeownership Still an Effective Means of Building Wealth for Low-income and Minority Households? (Was It Ever?)
Hill, Alex B. "Map: Where Are All the People in Detroit – Occupancy and Foreclosure." Detroitography. Last modified January 16, 2015. Accessed April 6, 2026. https://detroitography.com/2015/01/16/map-where-are-all-the-people-in-detroitoccupancy-andforeclosure/#:~:text=The%20potential%20loss%20of%20almost,Detroit%20residents%2 0keep%20their%20homes.
"Homes in Black and Latino Neighborhoods More Likely to Be Under Appraised, Data Shows." ABC 7. https://abc7chicago.com/post/chicago-property-value-home-appraisals-estimatordiscrimination/12520229/#:~:text=Nationwide%2C%20homes%20sold%20in%20neighb orhoods,those%20in%20mostly%20white%20neighborhoods.
Hudson, Michael. Merchants of Misery : How Corporate America Profits from Poverty. Common Courage Press, 1996.
Hwang, Jackelyn, Michael Hankinson, and Kreg Steven Brown. "Segregation and Subprime Lending within and across Metropolitan Areas." University of Wisconsin-Madison. Accessed April 6, 2026. https://www.irp.wisc.edu/resource/segregation-and-subprimelending-within-and-across-metropolitan-areas/.
Jackson, Tom. "How Do Payday Loans Work?" InCharge. Last modified October 14, 2025. Accessed April 5, 2026. https://www.incharge.org/debt-relief/how-payday-loans-work/.
John Hopkins University. "Small Business Bank Lending in Baltimore's Black Butterfly and White L, 2013-2023." John Hopkins University. Last modified August 6, 2025. Accessed March 30, 2026. https://21cc.jhu.edu/research/small-business-bank-lending-inbaltimores-black-butterfly-and-white-l-2013-2023/.
Kagan, Julia. "Understanding Mortgage-Backed Securities: Types, Risks, and Benefits." Investopedia. Accessed March 29, 2026. https://www.investopedia.com/terms/m/mbs.asp.
Kagan, Julia. "Understanding Teaser Rates: Introductory Offers on Loans and Credit Cards." Investopedia. Accessed March 29, 2026. https://www.investopedia.com/terms/t/teaserrate.asp.
Kaplan, Greg, Kurt Mitman, and Giovanni L. Violante. "The Housing Boom and Bust: Model Meets Evidence." Journal of Political Economy 128, no. 9 (2020): 3285-345. https://doi.org/10.1086/708816.
Kenton, Will. "Moral Hazard: Meaning, Examples, and How to Manage." Investopedia. https://www.investopedia.com/terms/m/moralhazard.asp.
Kochhar, Rakesh, and Richard Fry. Wealth Inequality Has Widened along Racial, Ethnic Lines since End of Great Recession. December 12, 2014. Accessed January 26, 2026. https://www.pewresearch.org/short-reads/2014/12/12/racial-wealth-gaps-great-recession/.
Lastrapes, William D., Ian M. Schmutte, and Thor Watson. "Home Equity Lending, Credit Constraints and Small Business in the US." SSRN Electronic Journal, 2020. https://doi.org/10.2139/ssrn.3655661.
Logan, John R., Samuel Kye, H. Jacob Carlson, Elisabeta Minca, and Daniel Schleith. "The Role of Suburbanization in Metropolitan Segregation after 1940." Demography 60, no. 1 (2023): 281-301. https://doi.org/10.1215/00703370-10430012.
Ludwig, Eugene A., James Kamihachi, and Laura Toh. The Community Reinvestment Act: Past Successes and Future Opportunities. https://fedinprint.org/item/fedfmo/13297.
Lynch, Emily E., Lorraine Halinka Malcoe, Sarah E. Laurent, Jason Richardson, Bruce C. Mitchell, and Helen C.S. Meier. "The Legacy of Structural Racism: Associations between Historic Redlining, Current Mortgage Lending, and Health." SSM - Population Health 14 (June 2021): 100793. https://doi.org/10.1016/j.ssmph.2021.100793.
Mahon, Joe. "Tracking 'Fringe Banking.'" Federal Reserve Bank of Minneapolis. Last modified August 31, 2008. https://www.minneapolisfed.org/article/2008/tracking-fringe-banking.
Martin, Allison. "How Your Mortgage Affects Your Credit Score." Edited by Alice Holbrook. Bankrate. Last modified September 9, 2025. Accessed March 21, 2026. https://www.bankrate.com/mortgages/how-mortgage-affects-credit-score/.
Massey, Douglas S. "The Legacy of the 1968 Fair Housing Act." Sociological Forum 30, no. S1 (2015): 571-88. https://doi.org/10.1111/socf.12178.
McClure, Elizabeth, Lydia Feinstein, Evette Cordoba, et al. "The Legacy of Redlining in the Effect of Foreclosures on Detroit Residents' Self-rated Health." Health & Place 55 (January 2019): 9-19. https://doi.org/10.1016/j.healthplace.2018.10.004.
Mian, Atif, and Amir Sufi. "House Prices, Home Equity–Based Borrowing, and the US Household Leverage Crisis." American Economic Review 101, no. 5 (2011): 2132-56. https://doi.org/10.1257/aer.101.5.2132.
Michigan State University. "Redlining in Michigan." Michigan State University. Accessed April 5, 2026. https://www.canr.msu.edu/redlining/detroit#:~:text=The%20federal%20government%20r edline%20mapped,day%20segregation.
Mitchell, Bruce C. "Historic Redlining's Effects on Home Mortgages Today." National Community Reinvestment Coalition. Last modified December 18, 2025. Accessed April 6, 2026. https://ncrc.org/historic-redlinings-effects-on-home-mortgages-
today/#:~:text=The%20dashed%20line%20represents%20proportional,consequences%20 ripple%20through%20communities%20today.
Mitchell, Bruce C., Jad Edlebie, Helen C.S. Meier, Jason Richardson, and Liang Chen. "Decades of Disinvestment: Historic Redlining and Mortgage Lending since 1981." National Community Reinvestment Coalition. Last modified May 2024. Accessed March 11, 2026. https://ncrc.org/decades-of-disinvestment/.
Mondry, Aaron. "What Is Property Speculation and Who's Doing It in Detroit?" Bridge Detroit. Last modified October 22, 2024. Accessed April 6, 2026. https://www.bridgedetroit.com/what-is-property-speculation-and-whos-doing-it-indetroit/#:~:text=Speculators%20control%20an%20enormous%20share,early%202010s% 2C%20according%20to%20experts.
Morrison, Amani Chanel. "Kitchenette Building: A Cultural History." eScholarship. https://escholarship.org/uc/item/37q937d9.
Mullen, Haley, and Kathleen Stewart. "Assessing the Legacy of Redlining on Spatial Inequities in Social and Environmental Determinants of Health." Applied Geography 179 (June 2025): 103637. https://doi.org/10.1016/j.apgeog.2025.103637.
Nadauld, Taylor D., and Shane M. Sherlund. The Role of the Securitization Process in the Expansion of Subprime Credit. Accessed April 6, 2026. https://www.federalreserve.gov/econres/feds/the-role-of-the-securitization-process-inthe-expansion-of-subprime-credit.htm.
Namin, Sima, Yuhong Zhou, Wei Xu, et al. "Persistence of Mortgage Lending Bias in the United States: 80 Years after the Home Owners' Loan Corporation Security Maps." Journal of Race, Ethnicity and the City 3, no. 1 (2022): 70-94. https://doi.org/10.1080/26884674.2021.2019568.
Nwokolo, Ramzee. How FAIR Plans Confronted Redlining in America. Report no. 484. September 2023. Accessed March 30, 2026. https://www.chicagofed.org/publications/chicago-fed-letter/2023/484.
Park, Sehyeok, and Rajit Chatterjea. "Incorrectly Applying Default Correlation Theory: The Causes of the Subprime Mortgage Crisis of 2008." The National High School Journal of Science. https://nhsjs.com/2025/incorrectly-applying-default-correlation-theory-thecauses-of-the-subprime-mortgage-crisis-of-2008/.
Perry, Andre M., and David Harshbarger. "America's Formerly Redlined Neighborhoods Have Changed, and so Must Solutions to Rectify Them." Brookings. https://www.brookings.edu/articles/americas-formerly-redlines-areas-changed-so-mustsolutions/#:~:text=The%20University%20of%20Richmond's%20Mapping,plurality%20i n%20these%20areas%20overall.
Pickett, Kevin. "How to Preserve Generational Wealth." Greater Houston Community Foundation. Last modified May 6, 2025. Accessed February 9, 2026. https://ghcf.org/articles/how-to-preserve-generational-wealth/.
"Predatory Lending and Reverse Redlining." Milberg. Accessed March 31, 2026. https://milberg.com/practice-areas/consumer-fraud/predatory-lending-reverse-redlining/.
"Q&A: Rocket Community Fund Leaders Speak on Helping Detroit Residents Reclaim Property Tax Proceeds." Outlier Media. Last modified March 30, 2026. https://outliermedia.org/qa-rocket-community-fund-leaders-speak-on-helping-detroitresidents-reclaim-property-taxproceeds/#:~:text=Sorce%3A%20Rocket%20Community%20Fund%E2%80%99s%20mi ssion,homeowner%20wealth%20in%20the%20city.
Ramnath, Shanthi, and Will Jeziorski. "Homeowners Insurance and Climate Change." Federal Reserve Bank of Chicago. Last modified September 2021. Accessed March 21, 2026. https://www.chicagofed.org/publications/chicago-fedletter/2021/460#:~:text=from%202015%20onward.,1.,American%20Housing%20Survey%20%2C%202007%E2%80%9317&text=Notes:% 20All%20means%20are%20weighted,associated%20with%20having%20homeowners% 20insurance.
Reeves, Kedra Newsom, Mindy Hauptman, Ryan Curley, Mike Marcus, and Brian O'Malley. "Racial Equity in Banking Starts with Busting the Myths." BCG. https://www.bcg.com/publications/2021/unbanked-and-underbanked-householdsbreaking-down-the-myths-towards-racial-equity-inbanking#:~:text=First%2C%20a%20bank%20account%20may,education%20or%20a%2 0business%20venture.
Rhine, Sherrie L.W, William H. Greene, and Maude Toussaint-Comeau. "The Importance of Check-Cashing Businesses to the Unbanked: Racial/Ethnic Differences." SSRN Electronic Journal, 2003. https://doi.org/10.2139/ssrn.439882.
Roller, Shelby, and Hayden Frye. "Professor Amani Morrison Conducting New Research on the Kitchenettes of Great Migration-Era Chicago." Georgetown University. Last modified April 14, 2022. Accessed March 10, 2026. https://college.georgetown.edu/newsstory/amani-morrison-kitchenettebuildings/#:~:text=Amani%20Morrison%2C%20an%20assistant%20professor%20in%20 the,Side%2C%20which%20was%20a%20predominantly%20Black%20community.
Rose, Jonathan. "Revisiting How Two Federal Housing Agencies Propagated Redlining in the 1930s." Federal Reserve Bank of Chicago. Last modified April 2022. Accessed April 5, 2026. https://www.chicagofed.org/research/content-areas/mobility/policy-brief-federalhousing-programsredlining#:~:text=We%20conclude%20that%2C%20to%20the,did%20from%20day%20 one%20of.
Rothstein, Richard. The Color of Law: A Forgotten History of How Our Government Segregated America. Liveright Publishing Corporation, a division of W.W. Norton & Company, 2018.
Rothwell, Jonathan, and Andre M. Perry. "How Racial Bias in Appraisals Affects the Devaluation of Homes in Majority-Black Neighborhoods." Brookings. Last modified December 5, 2022. Accessed March 30, 2026. https://www.brookings.edu/articles/howracial-bias-in-appraisals-affects-the-devaluation-of-homes-in-majority-blackneighborhoods/.
Sakong, Jung, and Alexander K. Zentefis. "The Location of Bank Branches Matters." Federal Reserve Bank of Chicago. Last modified November 2023. https://www.chicagofed.org/research/content-areas/mobility/policy-brief-bank-branchlocation#:~:text=In%20a%20recent%20study%2C%20we,which%20leads%20them%20t o%20use.
Schutz, Paris. "Business This Legislation Could End Illinois' Payday Loan Industry." WTTW. Last modified March 12, 2021. Accessed April 5, 2026. https://news.wttw.com/2021/03/09/legislation-could-end-illinois-payday-loan-industry.
Schwarz, Nelson D. "Banks Moving from Poor to Rich Areas." CNBC. Last modified February 23, 2011. Accessed March 30, 2026. https://www.cnbc.com/2011/02/23/banks-movingfrom-poor-to-richareas.html#:~:text=Comparisons%20for%20two%20other%20giants,regardless%20of%2 0the%20income%20level.
"Senate Unanimously Approves Comptroller's 'Bank on Illinois' Bill to Steer Illinois Residents Away from Predatory Lenders." Susana A. Mendoza Illinois State Comptroller. Last modified April 4, 2019. Accessed April 5, 2026. https://illinoiscomptroller.gov/pressreleases/senate-unanimously-approves-comptrollers-bank-on-illinois-bill-to-steer-illinoisresidents-away-from-predatorylenders#:~:text=all%20over%20the%20state,by%20county%20can%20be%20found%C2 %A0here.
Shkembi, Abas, Lauren M. Smith, and Richard L. Neitzel. "Linking Environmental Injustices in Detroit, MI to Institutional Racial Segregation through Historical Federal Redlining." Journal of Exposure Science & Environmental Epidemiology 34, no. 3 (2022): 389-98. Accessed April 5, 2026. https://doi.org/10.1038/s41370-022-00512-y.
Steil, Justin P., Len Albright, Jacob S. Rugh, and Douglas S. Massey. "The Social Structure of Mortgage Discrimination." Housing Studies 33, no. 5 (2017): 759-76. https://doi.org/10.1080/02673037.2017.1390076.
Sugrue, Thomas J. The Origins of the Urban Crisis : Race and Inequality in Postwar Detroit : with a New Preface by the Author. Princeton University Press, 2005. Digital file.
Sy, Amadou N. "The Systemic Regulation of Credit Rating Agencies and Rated Markets." IMF Working Papers 09, no. 129 (2009): 1. https://doi.org/10.5089/9781451872767.001.
United States Commission of Civil Rights. The State of Civil Rights: 1979. Accessed March 30, 2026. https://www.usccr.gov/historicaldocuments?field_doc_title_value=The+State+of+Civil+Rights%3A+1979&field_year_va lue_1=&field_group_target_id_1=All&field_doc_type_target_id=All&field_state_or_terr itory_target_id=All.
University of Northern Carolina at Charlotte. "Fat Tailed Distribution and the 2008 Financial Crisis." University of Northern Carolina at Charlotte. https://sds.charlotte.edu/fat-taileddistribution-and-the-2008-financial-crisis/.
University of Wisconsin-Madison. "Understanding the Impact of Alternative Financial Services: A Quick Reference Guide for Employers and Community Organizations." Infographic. University of Wisconsin-Madison. https://fyi.extension.wisc.edu/moneymatters/files/2021/08/Understanding-the-Impact-ofAlternative-Financial-Services-BankOn-Texas.pdf.
U.S. Department of Housing and Urban Development. "Multifamily Asset Management and Project Servicing (4350.1)." U.S. Department of Housing and Urban Development. Accessed March 21, 2026. https://www.hud.gov/hudclips/handbooks/housing-4350-1.
U.S. Department of the Treasury. "Bank Investment Programs." U.S. Department of the Treasury. https://home.treasury.gov/data/troubled-assets-relief-program/bank-investmentprograms.
U.S. Department of the Treasury. "Racial Differences in Economic Security: Housing." U.S. Department of the Treasury. Last modified November 4, 2022. Accessed April 5, 2026. https://home.treasury.gov/news/featured-stories/racial-differences-in-economic-securityhousing.
U. S. Securities and Exchange Commission. Annual Report on Nationally Recognized Statistical Rating Organizations. September 2009.
Wallace, Lewis. Why There's Almost No Mortgage Lending in Detroit. Podcast, audio. Accessed April 6, 2026. https://www.marketplace.org/story/2016/10/05/why-lending-scarcecheapest-neighborhoods.
"Welcome to Bank On Illinois." Susana A. Mendoza Illinois State Comptroller. https://illinoiscomptroller.gov/constituent-services/public-services-communityprograms/bankon-illinois.
Weller, Christian E. "10 Reasons Why Public Policies Rescued the U.S. Economy." CAP. Last modified May 29, 2012. https://www.americanprogress.org/article/10-reasons-whypublic-policies-rescued-the-u-seconomy/#:~:text=The%20Troubled%20Asset%20Relief%20Program%20in%202008%
2C%20the%20American%20Recovery,for%20infrastructure%20spending%20to%20start .
Wells, Matthew. "A Short History of Long-Term Mortgages." Federal Reserve Bank of Richmond.
https://www.richmondfed.org/publications/research/econ_focus/2023/q1_economic_histo ry.
Wyly, Elvin, Markus Moos, Daniel Hammel, and Emanuel Kabahizi. "Cartographies of Race and Class: Mapping the Class‐Monopoly Rents of American Subprime Mortgage Capital." International Journal of Urban and Regional Research 33, no. 2 (2009): 332-54. https://doi.org/10.1111/j.1468-2427.2009.00870.x.
Zhu, Shuang, and R. Kelley Pace. "Modeling Spatially Interdependent Mortgage Decisions." SSRN Electronic Journal, 2011. https://doi.org/10.2139/ssrn.1929171.
Zimmerman, Stephanie. "High-interest Loans in Chicago Target Black Neighborhoods." Chicago Sun Times. Accessed April 5, 2026. https://chicago.suntimes.com/consumeraffairs/2021/11/26/22799745/payday-title-installment-rate-cap-illinois-predatory-loanprevention-act-woodstock-institute.
The Harker School | 500 Saratoga Ave., San Jose CA 95129