2026 Hobart Bike Plan
The Bike Plan is the City's vision for a safe, connected and comfortable network for cycling

The Bike Plan is the City's vision for a safe, connected and comfortable network for cycling
In recognition of the deep history and culture of Nipaluna (Hobart), we acknowledge the Palawa (Tasmanian Aboriginal people), their elders past and present as the Traditional Custodians of the skies, land, and waterways of Lutruwita (Tasmania). We recognise that Palawa have made journeys across Lutruwita and Nipaluna for many thousands of years. We acknowledge the determination and resilience of the Palawa people who have survived invasion and dispossession and continue to maintain their identity, culture, and rights.
We also acknowledge all Aboriginal and Torres Strait Islander people who live on the country of the Palawa, here in Nipaluna (Hobart), Lutruwita Tasmania.
The Hobart Bike Plan 2026 contributes to achieving the City of Hobart’s community vision. The vision for Hobart’s transport network over the next ten years aligns with Pillar 5, Movement and Connectivity, from our community vision:
"We are a city where everyone has effective, safe, healthy and environmentally-friendly ways to move and connect, with people, information and goods, and to and through spaces and the natural environment. We are able to maintain a pace of life that allows us to fulfil our needs, such as work, study, business, socialising, recreation, accessing services, shopping, entertainment and spending time with loved ones."
To achieve this, Hobart needs to hone our bike network into one which feels like a real transport choice that you or anyone you know would feel comfortable and confident riding.
We take many short trips locally. In Greater Hobart, more than half of all trips are under five kilometres.1 Many households have already invested in riding with over half of Tasmanian households owning at least one working bicycle, e-bike or e-scooter. 2 And with Hobart's strong connection to fresh air and the outdoors, we already have an active culture to build from.
But we also have a clear gap.
Hobart residents used a bike for just 3% of those short trips.3 Yet 40% of Tasmanians are interested in cycling but have concerns.4 This potential is even stronger among women of all ages and young people aged 18–29, with about half of whom saying they would ride more or take up riding if they felt more comfortable or confident.
Sources:
1, 3 Greater Hobart Household Travel Survey, 2023.
2, 4 National Walking & Cycling Participation Survey Report, 2025.
5 ABS 2021, compiled and presented by .id
Bike Plan 2026
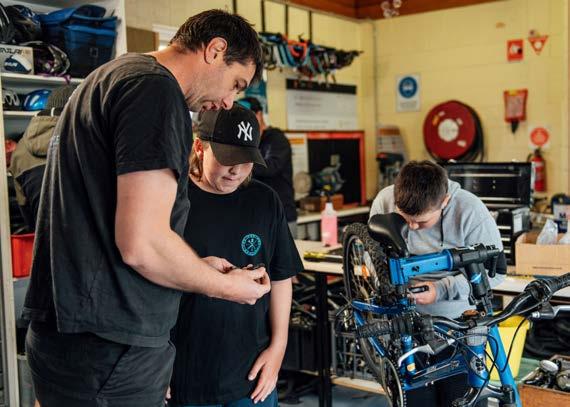
Cycling offers a more convenient commute, one where you don’t need to search for or pay for parking. For many workers, a bike provides a predictable travel time, a front- door-to -front- door journey, and a way to bypass traffic altogether.
Cycling is also an opportunity for independence. For young people, a connected bike network opens up access to school, sport, friends and after-school jobs without relying on parents for lifts.
One in five Hobart residents live in households without any car.5 Improving our bike network directly supports access to jobs, services and education.
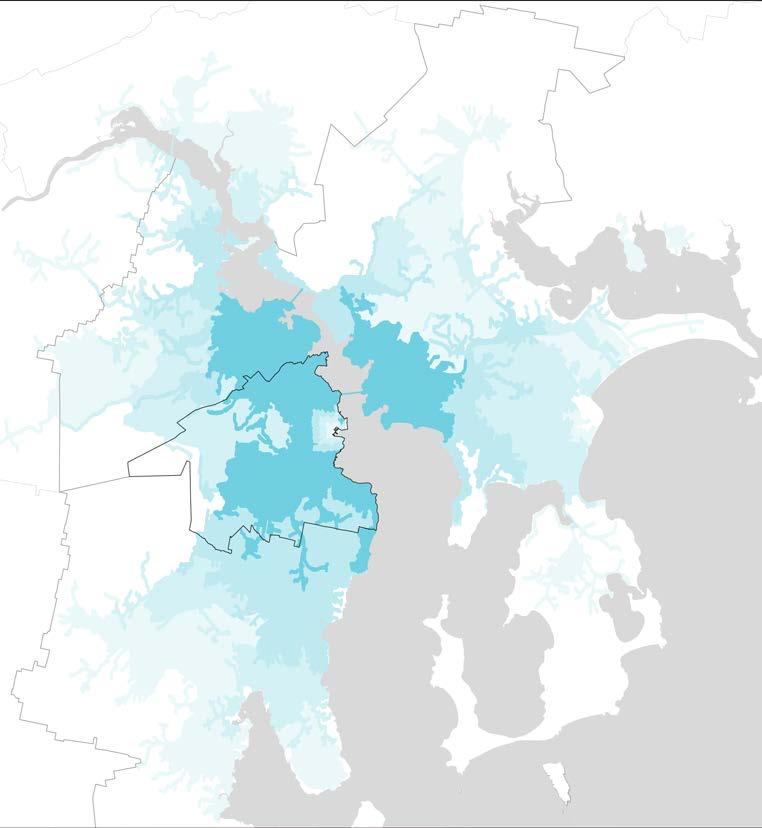
Many people drive into Hobart from bikeable distances. A safe, connected and comfortable bike network could make riding to work or school a practical choice for more people, even if that’s hard to picture at the moment.
65% of Hobart workers
commute from outside the City each day.
83% of Hobart,*
60% of Glenorchy, 44% of Clarence, and 6% of Kingborough live within a bikeable distance of the CBD.
* (17% of Hobart lives within a walkable distance)
Distance from the city centre...
...How you might choose to get there
km Walk Cycle (+ Public Transport) Drive (+ Public Transport)
Sources: ABS Census (2021), Esri
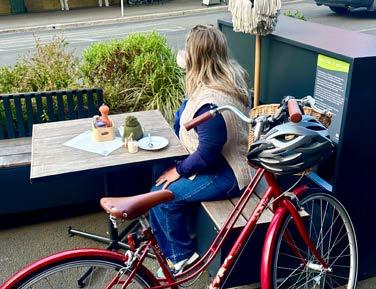
Over several years, we’ve gathered insights from our community on values, needs and behaviours related to transport, drawing on:
• feedback on neighbourhood plans and local projects
• discussions through the City Transport Committee
• public feedback through events and customer service
While we prepared this plan, we also engaged with key stakeholders to understand what about cycling in Hobart is already working well, the opportunities ahead, and the key outcomes we want to achieve as a city.
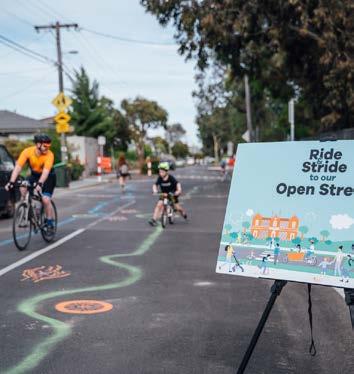
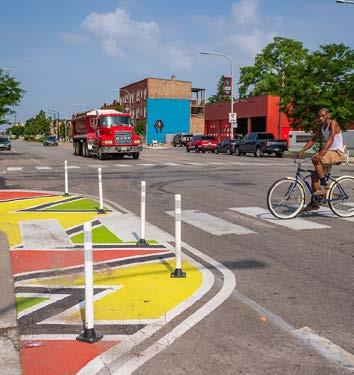
Calm Streets or street calming interventions that successfully slow streets to encourage walking and riding, were considered survey respondents' highest priority action.
- West Hobart Local Area Mobility Plan engagement (1 June 2024 - 31 December 2024)
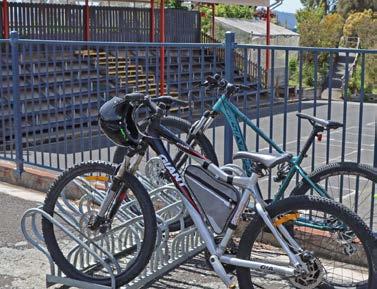
"The area needs bike paths that don't stop and start."
- Lenah Valley Primary School Access Travel Plan engagement (19 May 2025 - 23 June 2025)
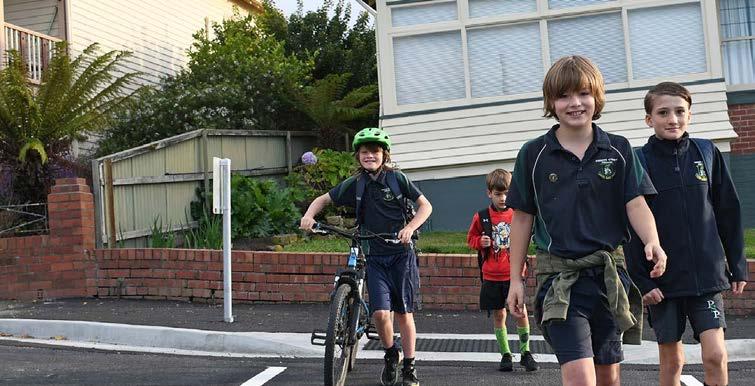
"I look forward to increased transport choice for me and my family. I would love to feel like my children could safely cycle around Hobart city and to and from school — currently not the case."
- Hobart Transport Strategy 2024 engagement (1-31 May 2024)
The Hobart Bike Plan 2026 brings together cycling outcomes from our existing local strategies and plans, consolidating them into one city-wide network. It draws directly from:
• Hobart Transport Strategy 2024
• 2040 Climate Ready Hobart Strategy
• Neighbourhood Plans
• Local Area Mobility Plans
• School Access Travel Plans
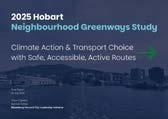
• Hobart Neighbourhood Greenways Study
• Inner Hobart Transport Network Operations Plan
• Inner City Development Plan, public spaces and public life study by GEHL Architects




The plan also aligns with wider bike - planning and transport efforts across Greater Hobart and Tasmania. It coordinates with existing and ongoing initiatives including:
• State plans and strategies
• Regional transport plans
• Adjacent council bike plans





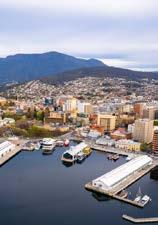
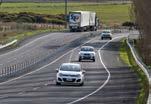


This plan confirms the function of each route in an aspirational city-wide bike network. While this plan does not define the future form of each corridor, project development will prioritise safety, comfort and connectivity for all ages and abilities.
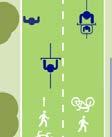
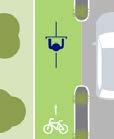
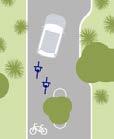
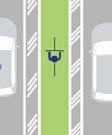
Routes are classified into four categories in alignment with the Tasmanian Government's (draft) Cycling Network Planning Guide. As individual projects move from planning into design and construction, their form will be developed through community engagement in line with the City of Hobart Community Engagement Policy and Framework and guided by the Tasmanian Government's Cycling Infrastructure Design Guide. This includes considering key factors such as traffic speed and volume to determine a suitable design. This could look like:
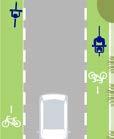
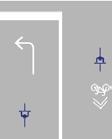
Primary Routes Secondary Routes
Directness:
Directness:
Capacity:
Function: Connect across town centres or between suburbs. These core routes provide access to many destinations and are the backbone of the network.
Example:
Intercity Cycleway
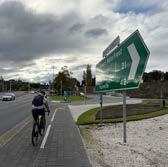
Capacity:
Function: Connect local streets to primary routes and to attractors such as schools, employment areas, shops, local services and notable tourist destinations.
Example:
Forster and Giblin Streets
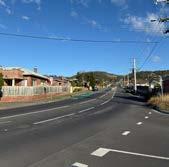
Neighbourhood Routes
Directness:
Recreational Routes
Directness:
Capacity:
Capacity:
We indicate where routes are on E-Rideable Hills, or streets that have slopes steeper than 10% within any of the four route classes. These short and steep segments prioritise directness for people with e-rideable devices, such as e-bikes and e-scooters, or who have a desire to ride up steep hills.
Function: Connect people from their homes to a primary or secondary route or a local destination.
Example: Fitzroy Place
Function: Provide a leisurely and scenic riding experience.
Example: The Domain

We know that speed is a key factor in how seriously someone is hurt in a crash.1 That’s why it’s important that shared spaces encourage lower driving speeds and to separate cyclists and drivers on higherspeed roads.
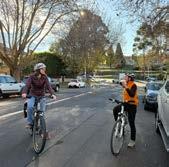
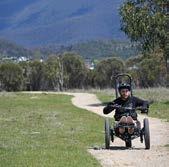
Reducing speeds from 50 km/h to 40 km/h halves the risk of a fatal crash. At 30 km/h, the risk is even lower, which is why low-speed environments, such as neighbourhood streets and areas around community hubs, are part of creating safer places for everyone.
1: Tasmanian Cycling Infrastructure Design Guide and Towards Safe System Infrastructure: A Compendium of Current Knowledge (2018) Austroads
We will invest in a bike network that connects neighbourhoods to schools, parks and sportsgrounds, local activity centres and major destinations.
• 34% of Hobart live within 300 metres of an existing primary or secondary route treatment
• 25 schools will be connected to a primary, secondary or neighbourhood route
Simple Neighbourhood Route Treatments (indicative)
Route Classification Route Overlays
Wayfinding New Trees and Plantings Safer Crossing Traffic Calming + Primary Secondary
Neighbourhood
Recreational
Existing Treatment Proposed Study E-Rideable Hill (>10% Slope)
Sources: ABS Census (2021), City of Hobart, OSM, Esri
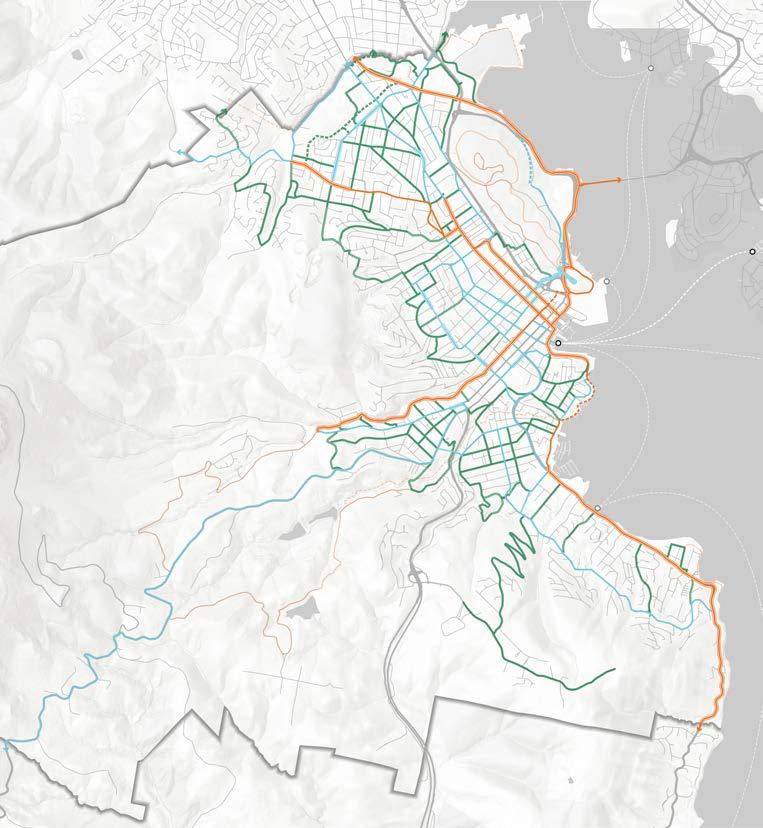
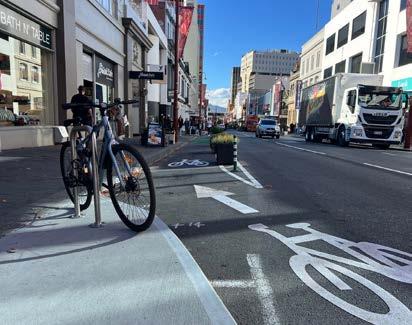
Central Hobart is our employment and retail hub and where major public transport transfers occur. The centre city hosts five schools and many University of Tasmania buildings, another local retail precinct in Midtown, and the weekly Salamanca and Farm Gate Markets. It will be home to the Mac Point stadium and borders the Queens Doman.
Simple Neighbourhood Route Treatments (indicative) Route Classification Route Overlays
Sources: ABS Census (2021), City of Hobart, WSP, OSM, Esri
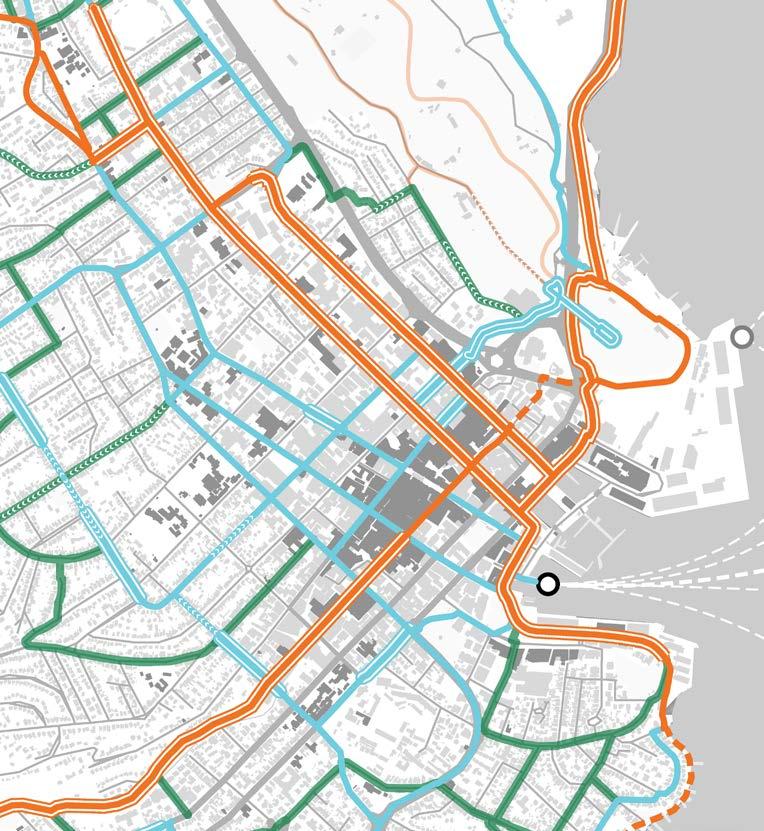
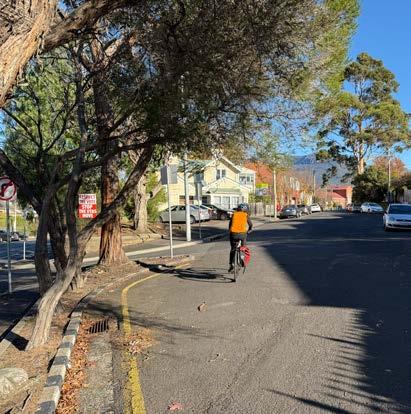
Population 2,096
Density 3,082 people per km2
Kilometres of neighbourhood routes 6.8 km
Battery Point is home to a primary school, seven parks, and the Hampden Road local retail precinct. The weekly Salamanca Market is held along the suburb’s border.
Simple Neighbourhood Route Treatments (indicative) Route Classification Route Overlays
Crossing
Trees and Plantings
Treatment
Slope)
Sources: ABS Census (2021), City of Hobart, WSP, OSM, Esri
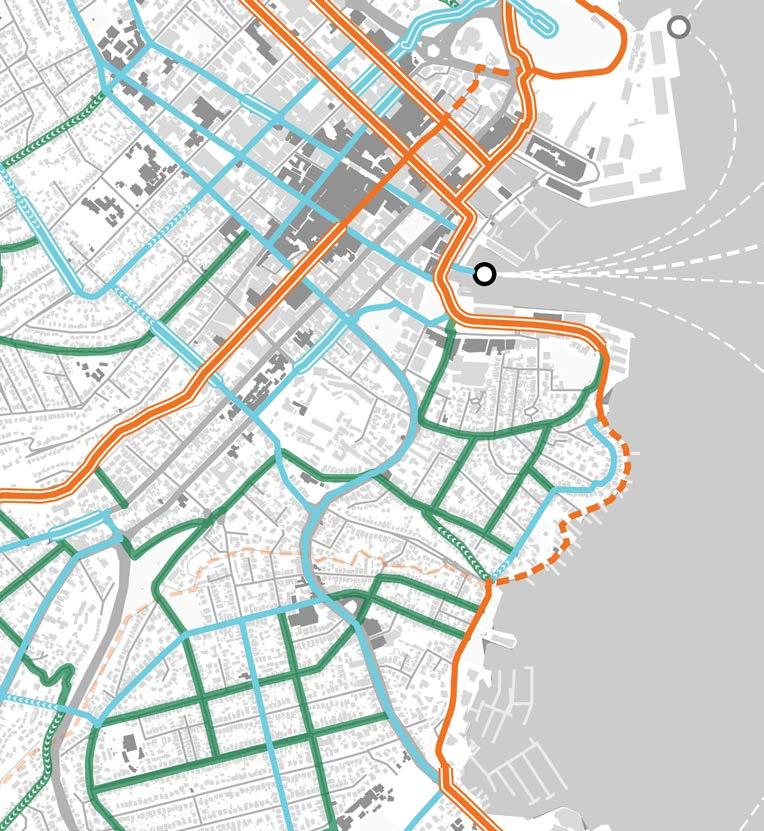
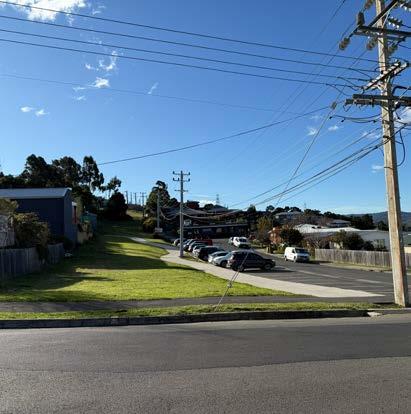
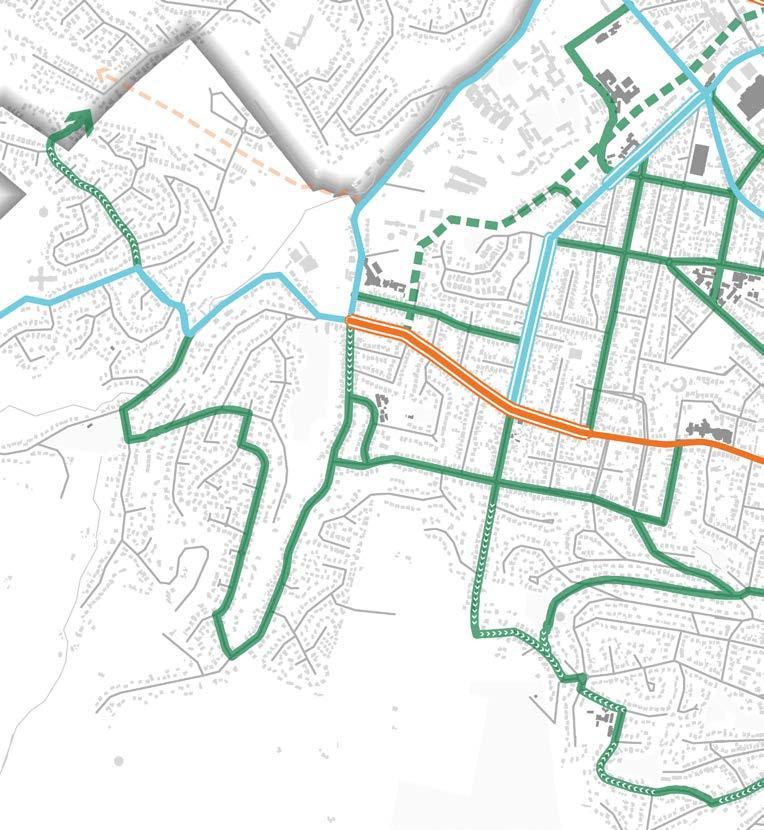
Population 6,522
Density 783 people per km2
Kilometres of neighbourhood routes 8.7 km
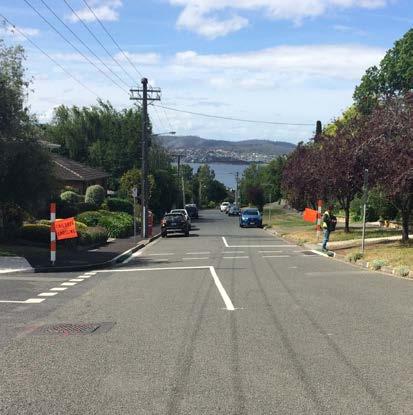
Situated within Lenah Valley are two schools, 12 parks, one sportsground, the Augusta Road local retail precinct and Calvary Hospital. Easement
Simple Neighbourhood Route Treatments (indicative)
Wayfinding New Trees and Plantings Safer Crossing Traffic Calming +
Route Classification Route Overlays
Existing Treatment Proposed Study
E-Rideable Hill (>10% Slope)
Sources: ABS Census (2021), City of Hobart, WSP, OSM, Esri
Population 7,427
Density 1,516 people per km2
Kilometres of neighbourhood routes 3 km
Lower Sandy Bay is home to three schools, three parks and a sportsground, the Lower Sandy Bay local retail precinct and Sandy Bay Sailing Club.
Simple Neighbourhood Route Treatments (indicative)
Wayfinding
New Trees and Plantings
Safer Crossing Traffic Calming +
Route Classification Route Overlays
Primary
Secondary
Neighbourhood
Recreational
Existing Treatment
Proposed Study
E-Rideable Hill (>10% Slope)
Sources: ABS Census (2021), City of Hobart, WSP, OSM, Esri
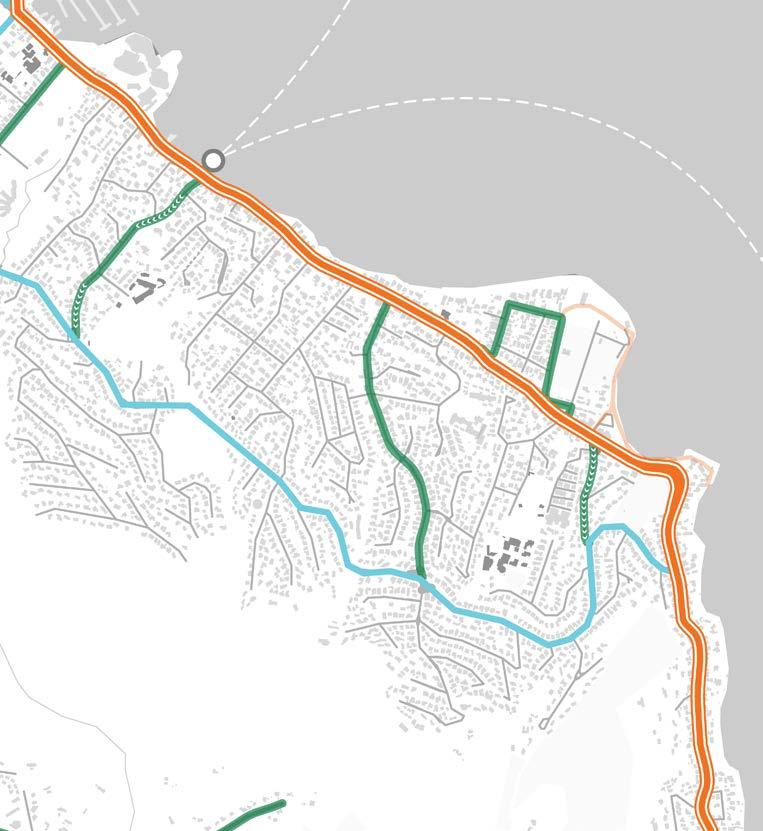
Population 2,749
Density 419 people per km2
Kilometres of neighbourhood routes 7.2 km
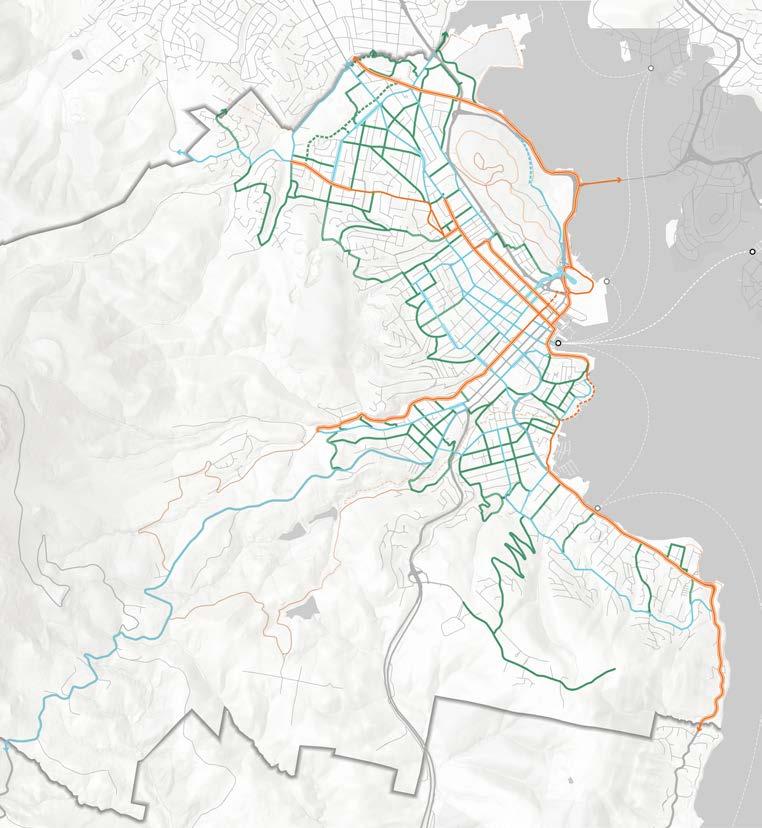
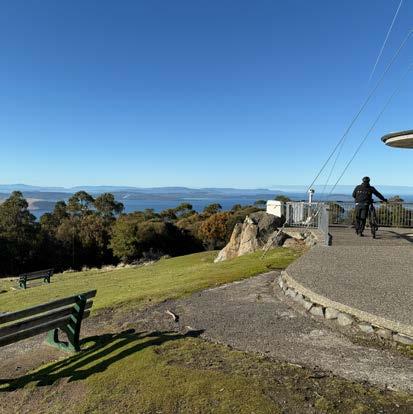
The hilltop suburb of Mount Nelson is the site of two schools, one sportsground and two parks including the historic Mount Nelson Signal Station.
Simple Neighbourhood Route Treatments (indicative)
Route Classification Route Overlays
Secondary Neighbourhood Recreational
E-Rideable Hill (>10% Slope) Wayfinding New Trees and Plantings Safer Crossing Traffic Calming + Primary
Existing Treatment Proposed Study
Sources: ABS Census (2021), City of Hobart, OSM, Esri
Hobart Bike Plan 2026
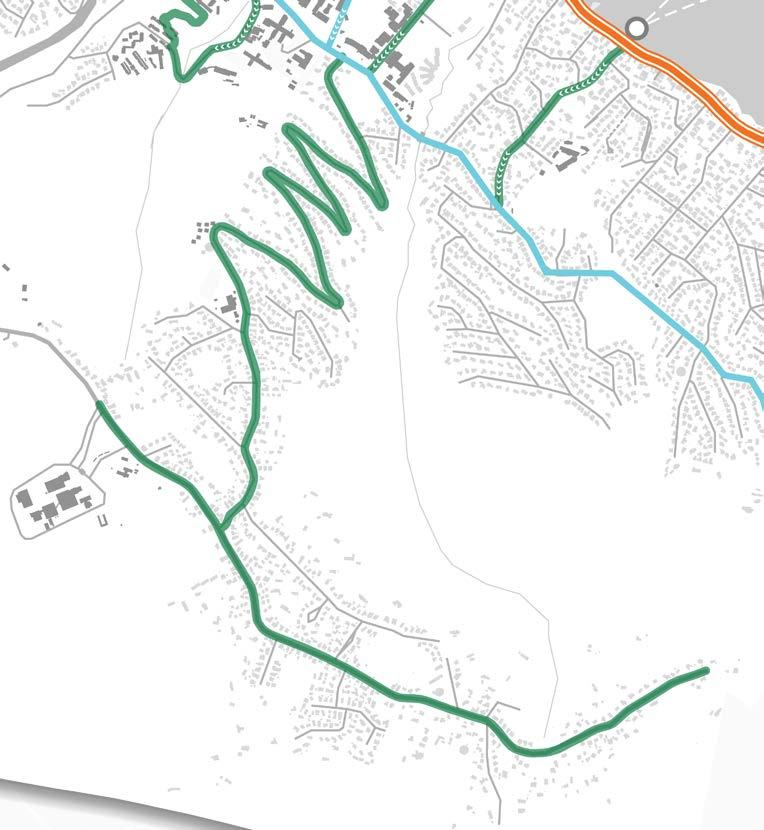
Population 2,444
Density 2,420 people per km2
Kilometres of neighbourhood routes 6.6 km
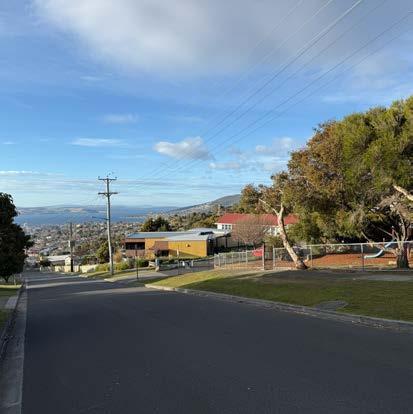
Mount Stuart is home to a primary school and three parks. Both the Augusta Road and North Hobart local retail precincts are within a short, albeit hilly, reach.
Simple Neighbourhood Route Treatments (indicative)
Wayfinding
New Trees and Plantings
Route Classification Route Overlays
Existing Treatment Proposed Study E-Rideable Hill (>10% Slope)
Sources: ABS Census (2021), City of Hobart, WSP, OSM, Esri
Hobart Bike Plan 2026
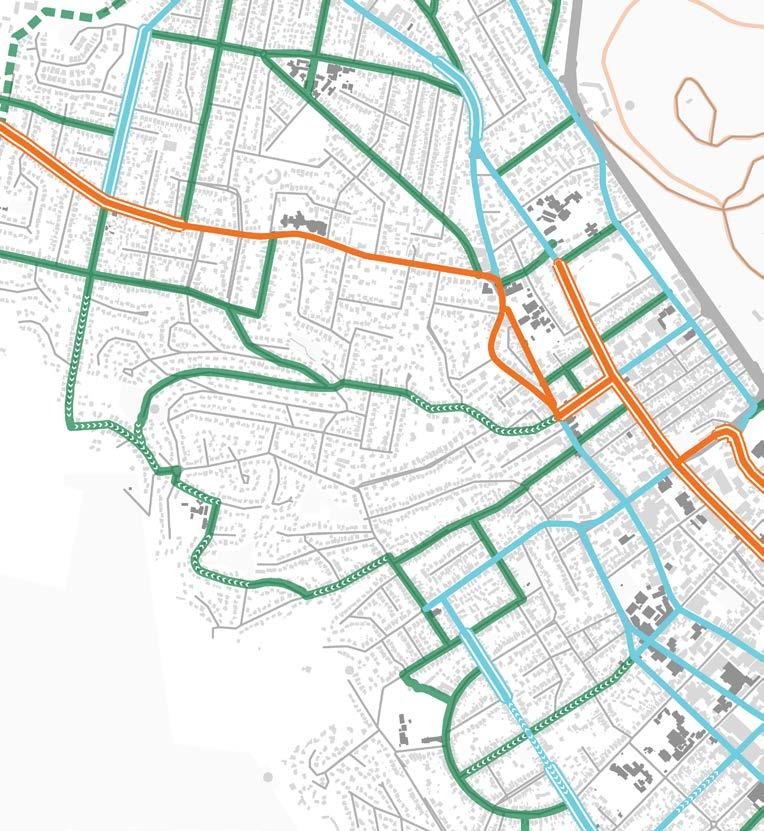
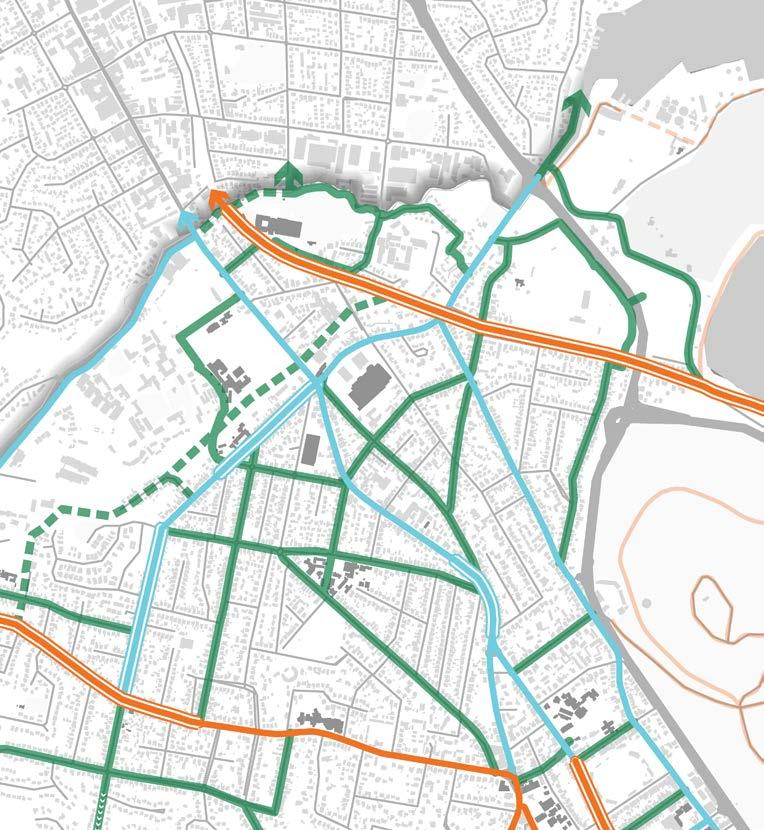
Population 6,781
Density 1,780 people per km2
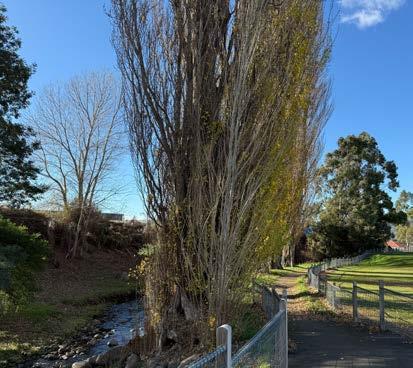
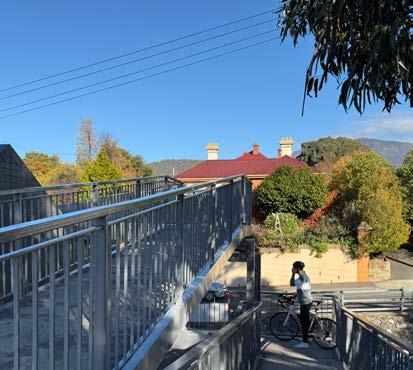
New Town has three schools, three parks, four sportsgrounds and the New Town Road retail precinct all within easy reach. Current masterplanning for the St John’s Health and Wellbeing Precinct and the Self’s Point/ Cornelian Bay area offer opportunity for better walking and cycling access.
Simple Neighbourhood Route Treatments (indicative)
New Trees and Plantings Safer Crossing Traffic Calming
Route Classification Route Overlays
Kilometres of neighbourhood routes 19 km Sources: ABS
Primary Secondary Neighbourhood Recreational Existing Treatment Proposed Study E-Rideable Hill (>10% Slope) Wayfinding
Population 3,201
Density 902 people per km2
Kilometres of neighbourhood routes 6.5 km
Sitting just above the city centre, North Hobart's three schools, three parks, sportsground and North Hobart local retail precinct are also a short distance from the Glebe, Queens Domain and the Royal Tasmanian Botanical Gardens.
Simple Neighbourhood Route Treatments (indicative)
Trees and Plantings Safer Crossing Traffic Calming +
Route Classification Route Overlays Existing Treatment
Slope) Wayfinding
Sources: ABS Census (2021), City of Hobart, WSP,
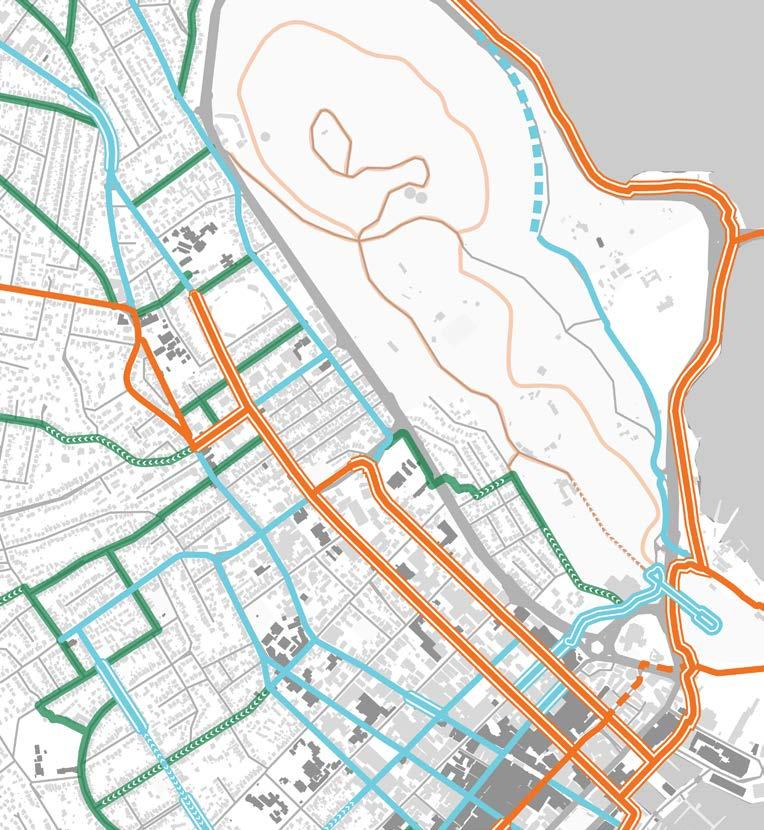
Population 4,888
Density 2,420 people per km2
Kilometres of neighbourhood routes 11.2 km
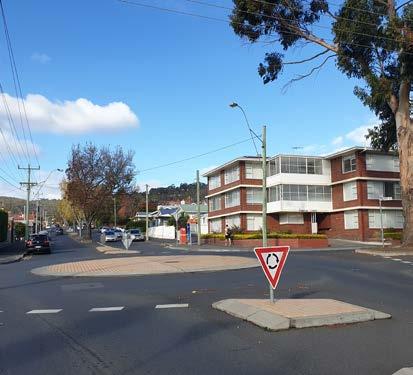
Sandy Bay is home to three schools and the University of Tasmania Sandy Bay campus, two parks, two sportsgrounds, the Sandy Bay local retail precinct, the Royal Yacht Club of Tasmania, Wrest Point Casino and a proposed public ferry terminal.
Simple Neighbourhood Route Treatments (indicative)
Crossing Traffic Calming +
Slope) Wayfinding New Trees and Plantings
Route Classification Route Overlays Existing Treatment
Study
Hill
Sources: ABS Census (2021), City of Hobart, WSP, OSM, Esri
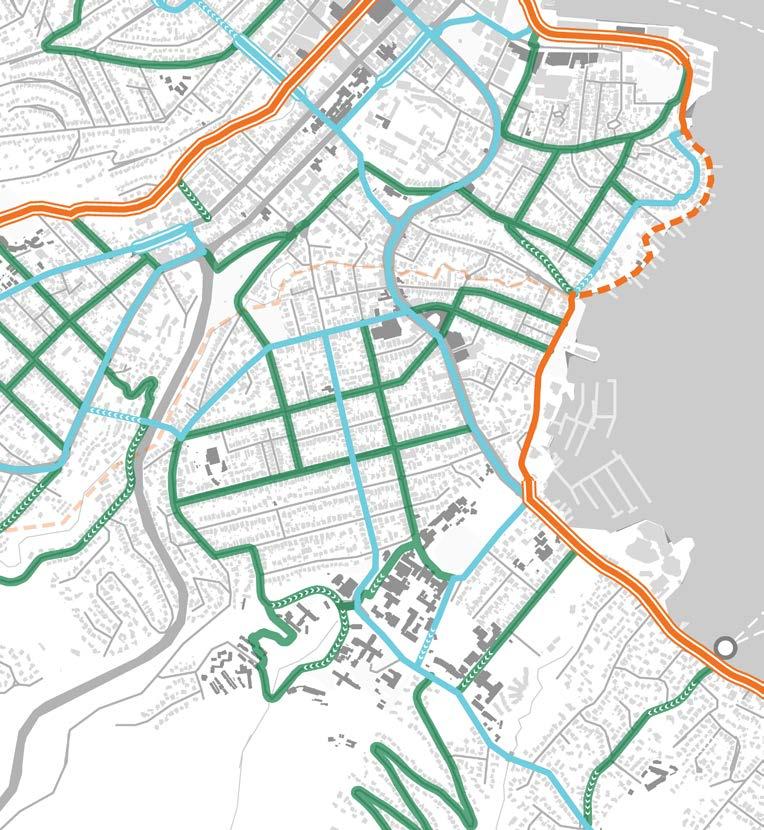
Population 5,886
Density 788 people per km2
Kilometres of neighbourhood routes 12.2 km
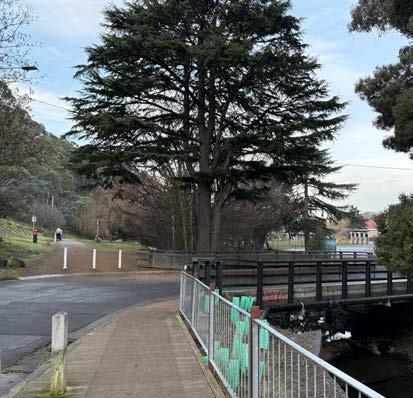
South Hobart is the site of two schools, seven parks, two sportsgrounds, the South Hobart local retail precinct and the historic Cascade Brewery. The Hobart Rivulet Trail connects many of these destinations.
Simple Neighbourhood Route Treatments (indicative)
Crossing
Classification Route Overlays
Treatment
Study
Hill
Slope)
Sources: ABS Census (2021), City of Hobart, WSP, OSM, Esri
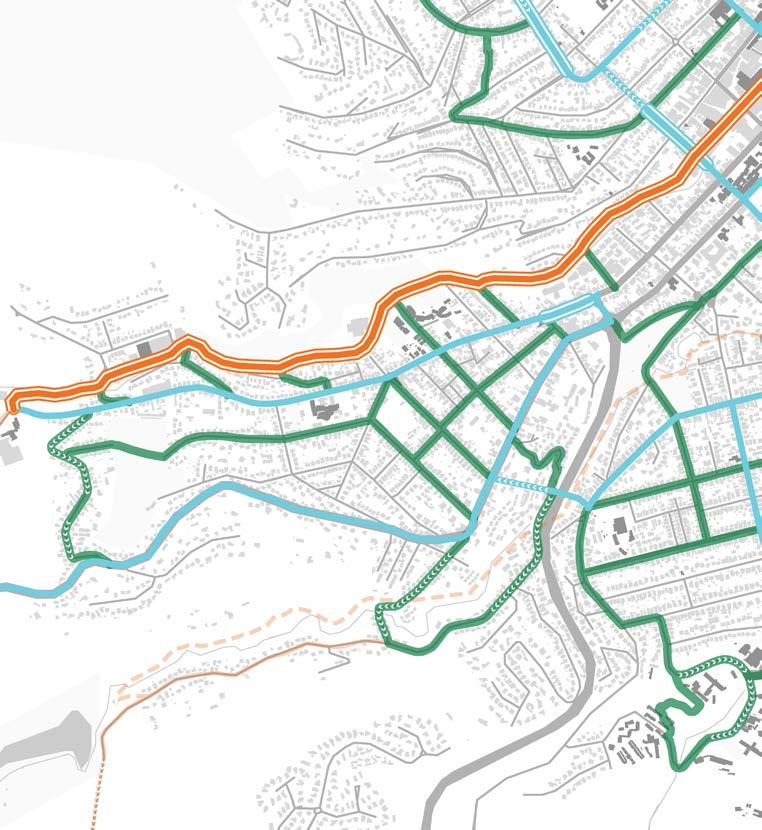
Population 6,525
Density 1,603 people per km2
Kilometres of neighbourhood routes 6.6 km
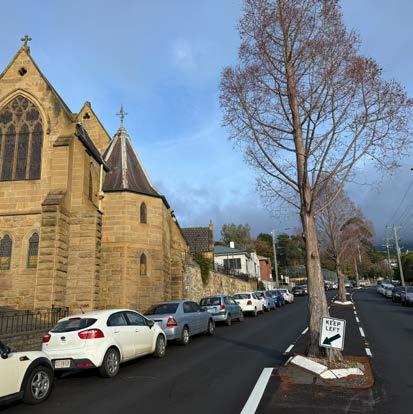
On West Hobart's doorstep are two schools, a sportsground, and five parks including access to Knocklofty Reserve.
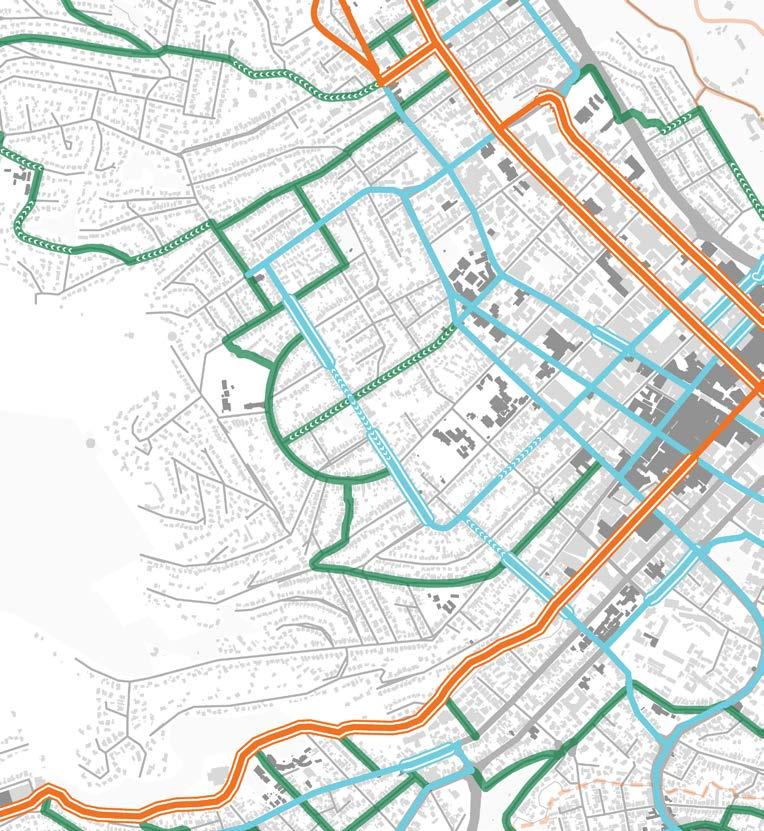
Simple Neighbourhood Route Treatments (indicative)
Route Classification Route Overlays
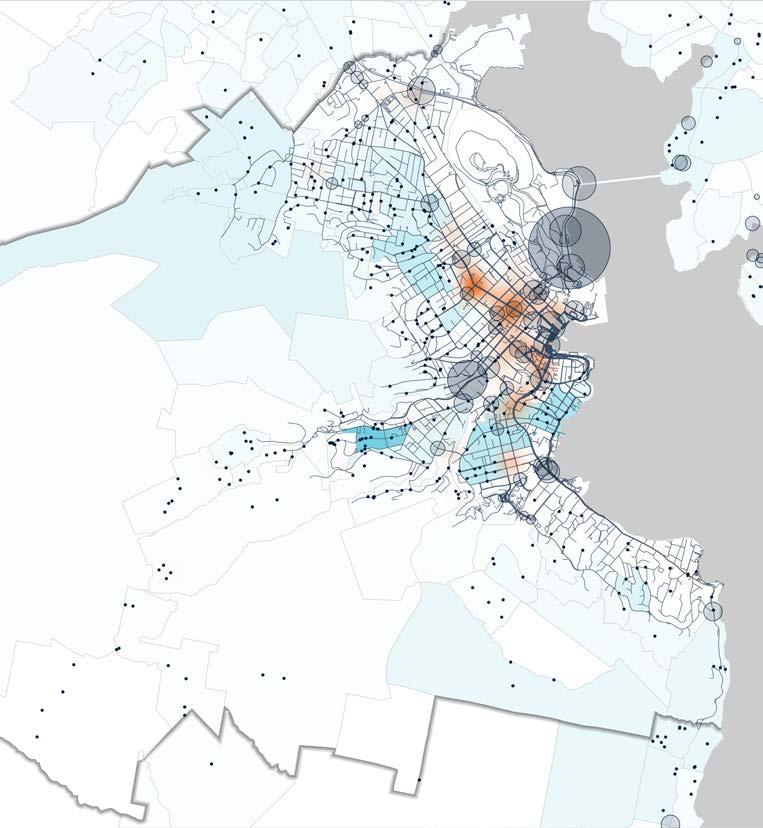
To understand how easy, or challenging, it is to ride a bike in Hobart today, we looked at current cycling levels, how suitable different streets are for riding, how likely people are to switch from driving to cycling, and which areas may face barriers to transport choice.
Hobart residents make 4,800 bike trips a day, even with a network that has gaps.1 We can choose to cycle even more trips if all levels of our bike network improve. We've seen how investment in a cycling corridor has changed the way we make trips:
South Hobart resident cycle-to-work rates grew from 2% to 7% in 20 years (2001–21)2, reflecting the investment in the Hobart Rivulet Track. Imagine if other areas could grow their bike commutes by 250%.
Bike ridership indicators: Synthesising historic data
Constant daily bike counts (2025 avg)3
Super Tuesday bike counts (2010–2025 avg)4
Bicycle Network members4
Crashes involving cyclists (2020–2024)5
E-scooter and e-bike trip density (2021–2025)6
Bike commuter density (2011, 2016, 2021 avg)2
– E-Bike Library Borrower
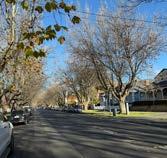
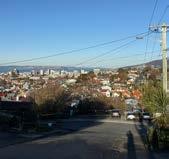
2. We looked at where street slope, speed and shade make for a more comfortable ride.
83% of Hobart’s 373km street network has bike-friendly slopes (under 10%) comfortable for cycling, while steeper streets serve as e-rideable routes.
Increasing canopy cover along our road assets by 16% would meet Hobart’s 40% target by 2046, a new progress metric for Hobart’s Urban Tree Strategy. This is a simple treatment that can make our bike corridors more comfortable for cycling, walking and catching the bus.
Bike suitability indicators: Safety and comfort
Street slope (flat to steep, >10% slope)
Street class (slow to fast)
Street tree planting priority (high to low, >40% canopy cover)
Sources: City of Hobart (2022 canopy cover analysis), OpenStreetMap,
3. We analysed where people are more likely to shift from a car to cycling with investment in our bike network.
55% of Hobart residents live in high propensity areas for ridership growth (75th+ percentile), even though only 3% of Hobart cycled to work on Census Day in 2021.
Potential cyclist index (density, equal weight) Bike propensity indicators: Journeys and demographics
Potential cycling trips (most efficient routes)
School Population (Ages 5–19) Bicycle Network
Low Car Ownership (0–1 per Household)
Residential Population Bikeable Distance to Work (1.5–10 km)
Bike Commute to Work (Census Day)
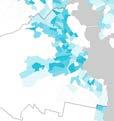
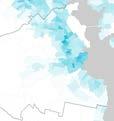
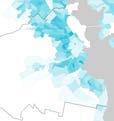
Sources: ABS Census (2021), Bicycle Network Tasmania, Department of State Growth, OpenStreetMap, Esri
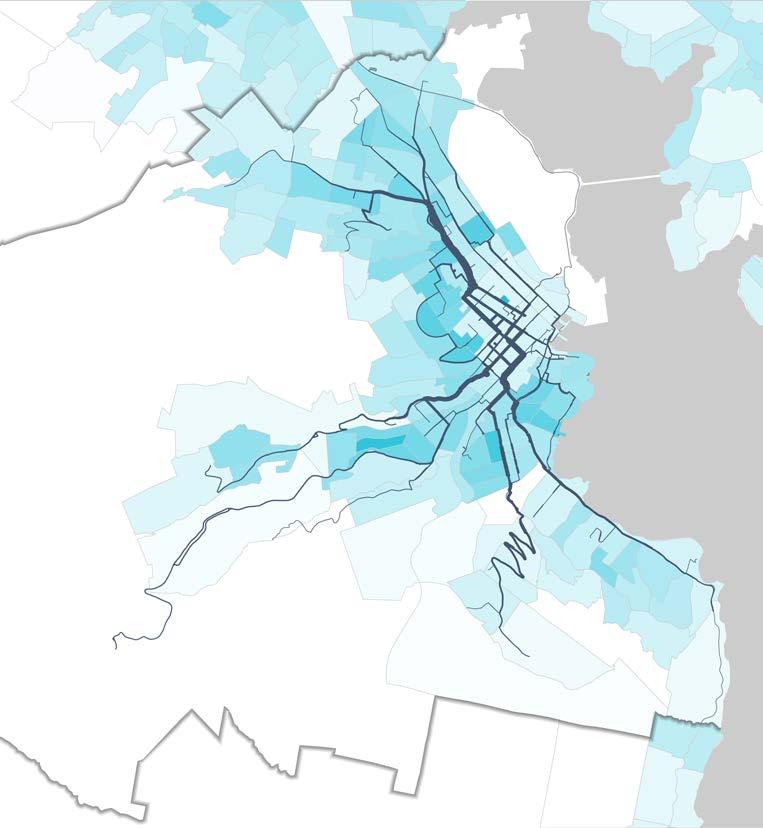
4.
asked where cycling investments could make the biggest difference in reducing transport inequities.
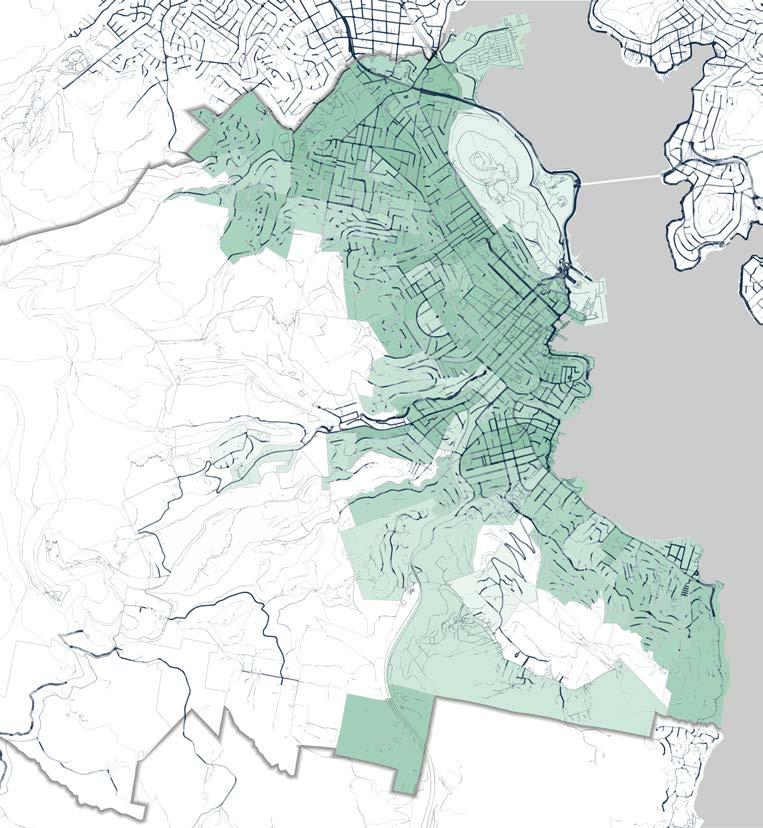
34% of Hobart residents live within a 300-metre walk of an existing primary or secondary route treatment
Bike Equity Indicators: Access & Disparity
300m walkshed from an existing route treatment Socio-economic Disadvantage Index (%)
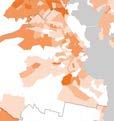
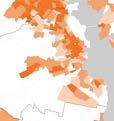
Population Families with Unemployed Parents
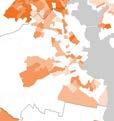
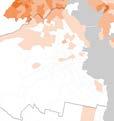
Sources: ITDP Atlas of Sustainable Transport, ABS Census (2021), Esri
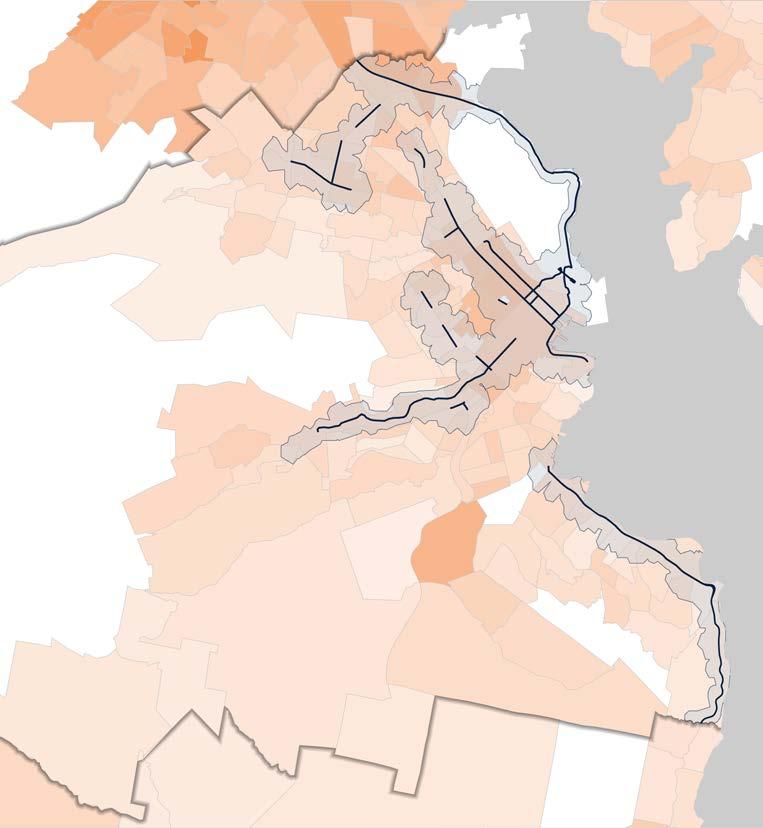
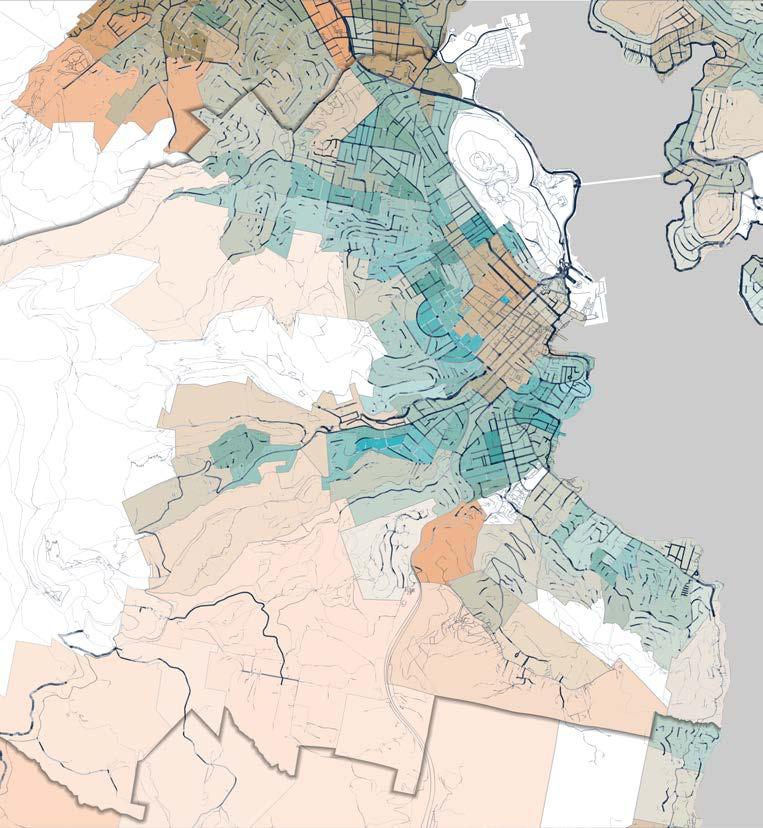
This analysis gives us a picture of where higher potential demand and where improving access to cycling could support more equitable transport choices.
The next page applies this analysis at a neighbourhood scale to support strategic planning and ensures all parts of Hobart are considered as we upgrade the bike network.
Where cycling appeal and transport need overlap
"most bikeable streets"
Sources: ABS Census (2021), Bicycle Network, OSM, Esri
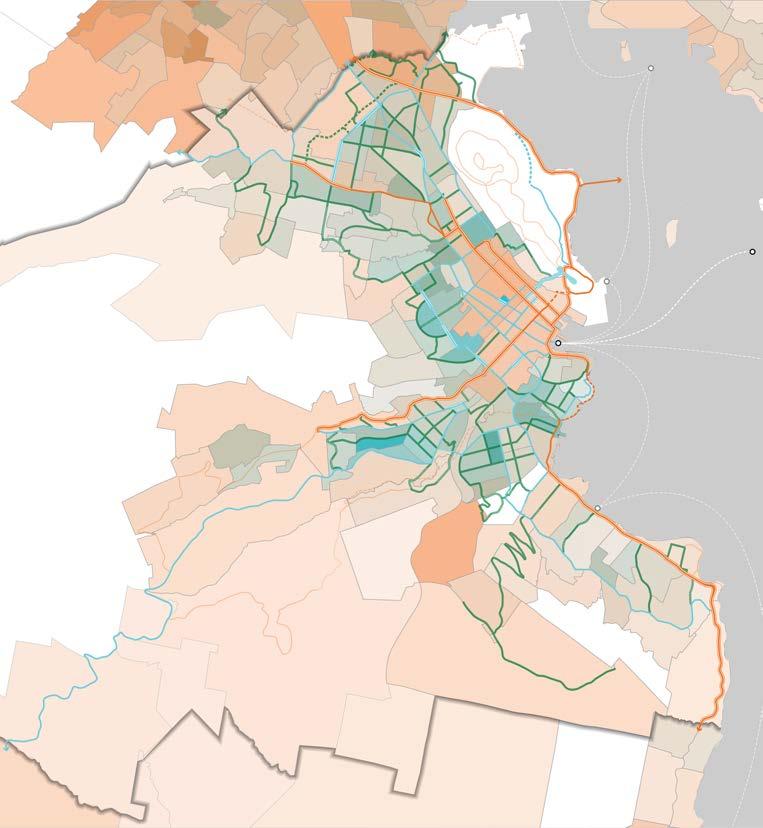
elements.
The bike network blends existing and planned links, showing where routes will be maintained or upgraded to meet their function.
The following six elements explain how we will progressively build a safe, comfortable and connected bike network.
The projects listed are the first priorities for delivery, with improvements hoped to be completed over the next five years (by 203031). Implementation is subject to annual budget processes.
This work involves completing projects identified in regional and local planning documents including the Greater Hobart Cycling Plan and the Neighbourhood Plans, Local Area Mobility Plans (LAMPs) and School Access Travel Plans endorsed by Council.
Intersections are the tricky point of the network when connectivity often breaks down. Nationally, one-quarter of crashes fatal for cyclists occur at intersections.1 This work involves connecting gaps and getting people across busy streets safely and comfortably.
Route Classification
Primary Route
Secondary Route
Neighbourhood Route
All
Source:
1 National Road Safety Data Hub. "Road crashes involving cyclists." 2024.
Augusta Road - Better Streets | $$$
Collins Street (Molle to Campbell) permanent solution, subject to 2025-2027 trial | $$$
Arthur Street and Mellifont Street intersection redesign | $$$
Nelson Road and Olinda Grove intersection and crossing upgrades | $$
Sandy Bay Ferry Terminal active transport connection (Derwentwater to Waimea) | $$-$$$
Murray Street across Macquarie and Davey Streets | $$
St Georges Terrace across Sandy Bay Road to Albuera Street neighbourhood route | $$
Route Classification
Primary Route
Secondary Route
Neighbourhood Route
All area
under $250,000
under $1 million
over $1 million
When renewal work is happening around the city, such as kerb replacements and street resealing, this work can include making other street changes that improve conditions for walking, cycling and public transport. This enables coordinated changes which maximise the benefit for minimal marginal cost.
While this approach will lead to some disconneted routes inititally, over time the network improvements will join up to create the connected network we need.
Looking after the bike network shows we’re serious about making cycling a safe and reliable way to get around. When paths, lanes and signs are kept in good condition, people feel confident using them. Just like roads for cars or footpaths for walking, a well-maintained bike network tells the community that this mode is valued and supported.
This work involves understanding the duration of linemarking of cycling facilities and budgeting for consistent maintenance.
Burnett Street active transport connection (Argyle to Campbell) | $$
Campbell Street (Liverpool to Collins; Macquarie to Davey) protection upgrade | $-$$
Cascade Road crossing upgrades | $$
Carlton Street neighbourhood route | $-$$
Sandy Bay Road bike lane linemarking enhancement | $
Molle Street (Goulburn to Macquarie) linemarking enhancement | $
Cycle facility linemarking and maintenance strategy and implementation plan | $
This work helps us deliver small but important projects that make our higher-order routes more accessible to more people. Wayfinding, trees and plantings, safer crossings and traffic calming along neighbourhood routes all help make it more comfortable to ride or walk through a neighbourhood to reach a variety of destinations.
Neighbourhood routes, and the small improvements recommended for them, are informed by the Neighbourhood Greenways Study completed by the Bloomberg Harvard City Leadership Initiative Fellow in 2025.
In addition to physical infrastructure, a range of complementary initiatives undertaken by the City and by community partners support the uptake and safety of cycling.
• bike parking and other end-oftrip facilities
• group bike rides and cycle skills training, including Back on your Bike and Ride2School
• route planning assistance and maps
• active travel to school activities
• community events
• safety and awareness campaigns
• Hobart E-bike Library
Mellifont Street and Butterworth Street neighourhood route | $
Romilly and Waterworks neighbourhood route | $$
Wayfinding strategy and implementation plan | $
Bike parking strategy and implementation plan | $
Open Streets event with a School Access Travel Plan school | $
"Back on your Bike" training and route planning assistance | $
- Better
Burnett Street active transport connection (Argyle to Campbell)
Campbell Street (Liverpool to Collins; Macquarie to Davey) protection
Collins Street (Molle to Campbell) permanent solution, subject to 20252027 trial
Sandy Bay Ferry Terminal active transport connection (Derwentwater to Waimea)
Transport Strategy; Central Hobart Plan; Inner Hobart TNOP; Greater Hobart Cycling Plan
Arthur Street and Mellifont Street intersection redesign
Nelson Road and Olinda Grove intersection and crossing upgrades
in 2033.
The indicator of this plan's success will be uptake in daily bike trips by Hobart residents, a data point available through the the Greater Hobart Household Travel Survey. Uptake will serve as a proxy for other intended positive outcomes, including diveristy of bicycle users and perceived comfort of the bike network.
The City will regularly monitor progress on our bike plan.
Progress will be monitored by reviewing:
Sources:
1 Greater Hobart Household Travel Survey, 2023
• percent of the Hobart population living with 300 metres of an existing primary or secondary route treatment
• number of schools connected by the bike network
• kilometres of primary, secondary, neighourhood and recreational routes improved
• specific small projects and line marking relevant to the bike network completed
• partnerships and funding secured
• priorities for the following year
• post-project sentiment, targeting projects in place for at least 12 months
Success will be indicated by uptake of daily bike trips in Hobart:
A baseline is provided through the State’s Greater Hobart Household Travel Survey, which found that Hobart residents took 4,800 daily bike trips in 2023.
A target of 10,000 daily bike trips is just higher than double this number (9,600).
This is in line with the draft Keeping Hobart Moving (2024) plan, which aimed to double the number of people walking, wheeling and bike riding over 10 years.
2023
4,800 bike trips1
2033 10,000 bike trips
Visit hobartcity.com.au for an online bike network map and current project status. For each bike network corridor, we list the plan(s) it is sourced from and relevant actions, whenever that information is available.
t
f (03) 6238 2186
e coh@hobartcity.com.au
w hobartcity.com.au