The City of Hobart's Quarterly Economic Snapshot provides an overview of datasets that give an indication of economic activity in the LGA. To create a complete picture of activity in a place, no one data set should be considered in isolation. Data is updated every quarter as it becomes available.
4.0%
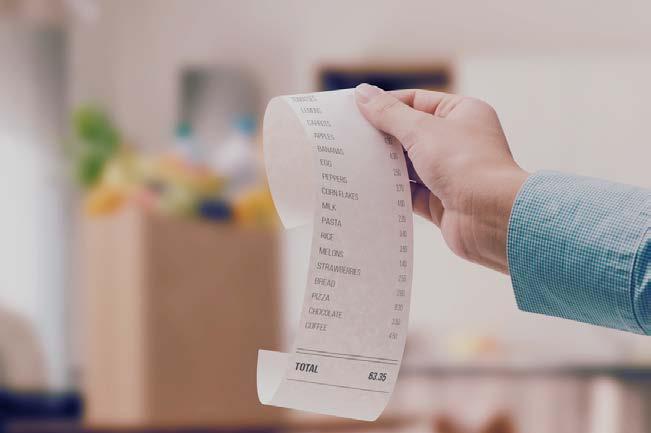
Spending Data
$464M (Dec 2025 Qtr)
Total Spend, City of Hobart
Quarterly Sum $M
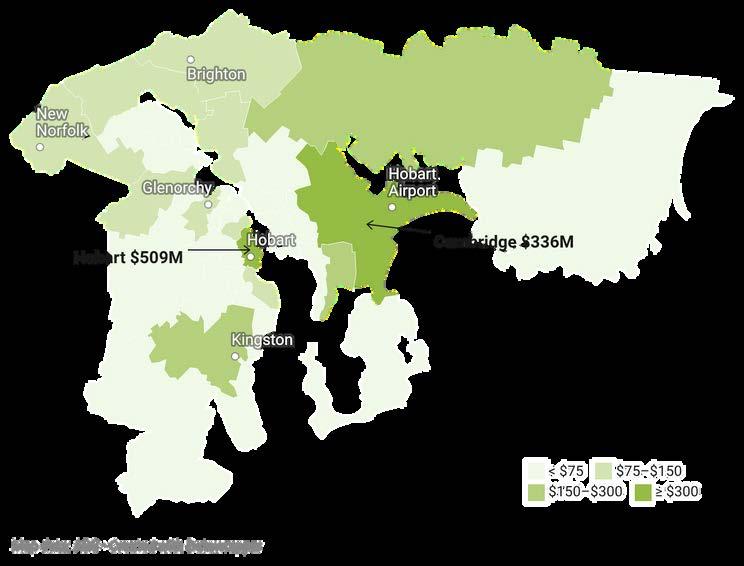
In the Dec 2025 quarter, resident and visitor spending in the City of Hobart was estimated at $464M. This was up 18% from the previous quarter due to the Black Friday and festive season spending and 2% up from the same quarter a year ago.
There was strong % growth in takeaways and online accommodation from the previous year, and strong $ growth in supermarkets and non-department store discretionary retail. Declines occurred in department store/clothing retail spending and breweries/wineries. Night-time spending grew by 2.3% compared to the same quarter last year.
Over the twelve months to the Dec 2025 quarter, the CPI for Hobart rose 3.8%, on par with the Australian Capital Cities average of 3.7%. This figure was well above the Dec 2024 quarter, where the CPI annual change was only 1.5%.
The household spending category that saw the largest price growth over the year was Alcohol and Tobacco (7.6%). However, the largest contributers to the increase of the CPI were food and housing as they represent a higher proportion of household costs.
Alcohol & Tobacco
(Compared to Dec 2024)
Consumer Price Index Change Annual
Annual Inflation by Category
Annual % change; Sorted in order of contribution to household spending
Food and non-alcoholic beverage
Employment
The number of employed residents in the Greater Hobart area was estimated at 131,582 in the Dec 2025 quarter, up slightly from the year before (131,010). The average 4 quarter unemployment rate for the City of Hobart was 2.7% and for Greater Hobart 4.0%. The estimated unemployment rate was down from last year, but reflects declining labour force participation as well as employment increases. There were an average of 1,465 online job vacancies advertised in the Dec 2025 quarter, down 17% from the year before and 16% from the previous quarter.
131,582 (Average Dec Qtr 2025)
Employed Residents
Smoothed average quarterly amount ‘000s
4.0% Greater Hobart (4 quarters to Sep 2025)
1,465 (Average to Dec Qtr 2025)
Job Advertisements
Building Approvals
$234M
(4 quarters to Sep 2025)
Value of Building Approvals, CoH
$M, Rolling 12 months
The value of building approvals in the City of Hobart area was estimated at $234M in the 12 months to Sep 2025 quarter, up 8.8% from the year before ($200.1M). Residential building approvals were up 4%, while non-residential were up 6%.
Education ($200M) and Office ($126M) buildings represented the largest value of non-residential buildings approved in the City of Hobart over the three years to Sep 2025.
Hobart SA2 - $509M
(Last 3 years)
Value Approved, Last 3 Years
Education - $200M
(Last 3 years)
Non-Residential Approvals, City of Hobart, Last 3 Years
$Millions
Housing Costs
$970,000 (Median Sep 2025*)
Median House Price
Quarterly
The median house price for the City of Hobart in the Sep 2025 quarter was estimated at $970,000. This was up 2.4% from the year before, and up 4% from the previous quarter. The median unit price was $600,000, down 3.6% from the previous year, but up from the preceding quarter.
The median weekly rent for a house in the City of Hobart in the Sep 2025 quarter was $660, up 10% from the year before. The median unit weekly rent was $500 (+6.4%).
.id is the leading provider of small area demographic and economic data and analysis in Australia. Over 300 local councils and regional authorities across Australia and New Zealand commission our detailed local area profiles, which are then made available to the public as a shared resource for the community. For more economic data on Hobart and the rest of Tasmania, visit economy.id.com.au/tasmania. economy@id.com.au
This Report is prepared only for use by the City of Hobart and may only be used for the purpose for which it was commissioned. .id accepts no liability in connection with the recipients use or reliance on the Report. The content of much of this Report is based on ABS; CommBank iQ; and Jobs and Skills Australia Data. The data and the copyright in the data remains the property of the relevant entities. .id accepts no liability with respect to the correctness, accuracy, currency, completeness, relevance or otherwise of the Data. This Report and all material contained within it is subject to Australian copyright law.