THE SAFETY NET CO N SU LTA N T S
•
DESIGNERS
•
ENGINEERS
JULY 2021
IT’S ALWAYS SAFETY FIRST. •
CO N STRUCTO RS
VOLUME 15 ISSUE 07
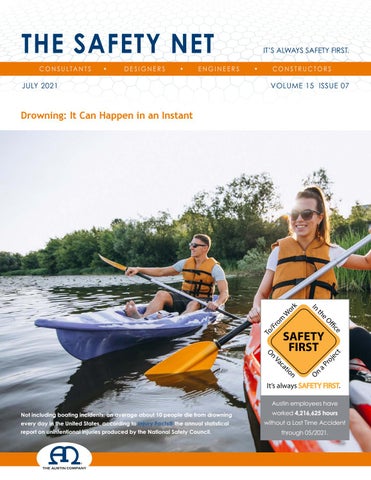
Drowning: It Can Happen in an Instant
SAFETY FIRST. Austin employees have Not including boating incidents, on average about 10 people die from drowning
worked 4,216,625 hours
every day in the United States, according to Injury Facts® the annual statistical
without a Lost Time Accident
report on unintentional injuries produced by the National Safety Council.
through 05/2021.
POOL SAFELY THIS SUMMER; TAKE THE PLEDGE NSC and the Consumer Product Safety Commission are encouraging everyone to keep water safety top of mind and reduce child drowning in pools and spas. The Pool Safely campaign reminds everyone to follow five simple steps to stay safer in and around water. More than 75,000 adults and children have signed the Pool Safely Pledge last summer. Take the Pledge today and get a free Pool Safely Toolkit. The USA Swimming Foundation reports nearly 90 children younger than 15 drowned in a pool or spa from January through May 2018, and every year about 19 children drown during the July 4 holiday. CPSC also reports: • 74% of drowning incidents for children younger than 15 between 2015 and 2017 occurred in residential locations • Boys younger than 15 die from drowning at twice the rate as girls • 351 children younger than 15 died in pools and spas in 2015 • Emergency departments treat about 6,400 pool and spa injuries in children younger than 15 every year
TEENS AND YOUNG ADULTS OFTEN DON’T THINK ABOUT WATER SAFETY While drowning deaths peak among one and two year olds, drownings continue to be the second leading cause of preventable death through age 15. According to NSC research, 353 people ages 5 to 24 drowned in 2017. Swimmers should keep a few safety precautions in mind: • Don’t go in the water unless you know how to swim; swim lessons are available for all ages • Never swim alone • Learn CPR and rescue techniques • Make sure the body of water matches your skill level; swimming in a pool is much different than swimming in a lake or river, where more strength is needed to handle currents • If you do get caught in a current, don’t try to fight it; stay calm and float with it, or swim parallel to the shore until you can swim free • Swim in areas supervised by a lifeguard • Don’t push or jump on others • Don’t dive in unfamiliar areas • Never drink alcohol when swimming; alcohol is involved in about half of all male teen drownings, according to KidsHealth.org
THE YOUNGER THE CHILD, THE GREATER THE RISK Most parents think water safety is first and foremost on their minds whenever they are enjoying summer activities with their young kids. But when the unthinkable happens, caregivers often say, “I only looked away for a second.” NSC statistics point to drowning as a leading cause of death for young children – mostly due to children falling into a pool or being left alone in the bathtub. Of the 3,709 drownings in 2017, more than 12% were children age 4 and younger, according to Injury Facts. Bathtubs, toilets and even buckets also can pose a danger for very young children.
DISTRACTIONS MAKE FOR TRAGEDIES Parents are cautioned all the time about water safety, but drownings still occur. Always be aware and be in the present moment with your children. Following are a few water safety precautions: • Never leave your child alone; if you have to leave, take your child with you • Find age-appropriate swim lessons for your child, but keep in mind that lessons do not make your child “drown-proof” • Lifeguards aren’t babysitters; always keep your eyes on your child • Don’t let children play around drains and suction fittings • Never consume alcohol when operating a boat, and always make sure everyone is wearing U.S. Coast Guard-approved life jackets • Don’t underestimate the power of water; even rivers and lakes can have undertows • Always have a first aid kit and emergency contacts handy • Get training in CPR • If a child is missing, check the water first Every pool, every lake and every warm summer day holds the possibility of new, fun summer experiences. All you need to add is your undivided attention.
3
Best Practices on Preventing Heat Illness at Work 05.27.2021 | US Department of Labor - Filed in Safety and Health by Jim Frederick With temperatures rising as we head into the summer months, so does the risk of heat hazards. In 2019, exposure to heat led to 43 work-related deaths and 2,410 injuries and illnesses, according to the U.S. Bureau of Labor Statistics. The Occupational Safety and Health Administration has resources to help employers and workers beat the heat and stay healthy and safe. Here are some practices to remember as you prepare for the summer heat:
1. Train all workers. Employers should train supervisors and workers on how to control and recognize heat hazards. Workers should also know about first aid for heat illness. Training should always be conducted in a language workers understand.
2. Follow the 20% rule. On a worker’s first day, no more than 20 percent of the duration of their shift should be at full intensity in the heat. The duration of time at full intensity should be increased by no more than 20 percent a day until workers are used to working in the heat.
3. Remember these three words: “Water. Rest. Shade.”
is why “acclimatization” – the process of building resistance to increased temperatures – is so important. Learn how to protect new workers from heat-related illness and monitor them until they are acclimatized.
5. Hazardous heat exposure can happen indoors or outdoors. Though heat stress is typically related to outdoor work environments, and construction workers account for about onethird of heat-related deaths, workers in hot indoor environments like kitchens, laundries, warehouses and electrical utilities are also at risk.
6. Engineering controls and modified work practices can reduce the risk of heat illness. Consider reducing physical activity as much as possible by planning for the work ahead and rotating job functions among workers to help minimize exertion. Find more work practices here. Learn more about OSHA’s campaign to prevent heat illness and find resources in English and Spanish on our website. Workers and employers who have questions or concerns about workplace safety can contact us online or by phone at 1-800-321-6742 (OSHA).
Workers should drink one cup of water every 20 minutes while working in the heat to stay hydrated. When the temperature is high, employers should make sure workers take frequent rest breaks in shaded, cool or air-conditioned areas to recover from the heat.
4. Workers new to the job are at higher risk. Workers who are new or returning to working in warm or hot environments need more time to adapt. More than 75 percent of heat-related fatalities occur during a worker’s first week, which
Jim Frederick is the acting assistant secretary for the U.S. Department of Labor’s Occupational Safety and Health Administration. Follow OSHA on Twitter at @OSHA_DOL.
Putting the Heart Back in Safety 05.01.2021 | OH&S by Sydny Shepard Many parts of the health and safety industry can be logical and straightforward, with no room for error, however, there can also be grey areas. The times when you can’t keep an eagle eye on employees—the instances in which they decide not to wear their safety gear or to take shortcuts when doing maintenance on a machine. These grey areas represent the moment when injuries—and sometimes even fatalities—become reality on work sites. In a recent OH&S SafetyPod podcast episode, I had a really great chat with Thomas Kramer, the Managing Principal at LJB Inc. about how making safety personal can save lives. Thom has nearly 25 years of experience in designing fall protection systems for organizations. Through those years, he has seen these grey areas. He saw the results of shortcuts, poor training and lack of motivation when it comes to worker safety. During our interview, I mentioned to Thom that OSHA had released its list of the Top 10 Most Frequently Cited Standards for fiscal year 2020. Fall Protection – General Requirements and Fall Protection – Training Requirements alone made-up 29 percent of the Top 10’s combined violation count. I couldn’t help myself, so I asked, “How disheartening is this for you to see?” Thom’s viewpoint is important here. He explained that as a registered professional engineer and certified safety professional, he is taught to keep the emotions at home. The job isn’t supposed to be emotional; it is supposed to be solution and success-driven. You should always be looking for better outcomes—not focusing on the past. “As an engineer, we are supposed to be emotionless. We are supposed to put everything on the facts,” Thom said in our interview. “But I have to say, when I see that number, and I see it not coming down—it does hurt me. It does help you to realize that there are literally hundreds of lives out there that we can do better with and that we have to do better with. We can’t bring those lives back, but what we can do is try to work better and differently in the future.”
5
The Workforce is Testing Positive for Marijuana at Very High Levels 06.15.2021 | EHS Today Staff Positivity was 12.2% higher than in 2016.
drug testing as a way to keep the workplace, their customers
The COVID-19 pandemic did not dampen workforce drug
and the community safe.”
testing positivity for marijuana, which continued to increase last
POSITIVITY DOWN OR FLAT FOR MOST DRUG CATEGORIES, BUT INCREASE FOR ECSTASY
year in the general U.S. workforce, according to a new analysis released on May 26 by Quest Diagnostics. The company said it’s the first large-scale analysis of de-identified results of laboratory workforce drug tests performed during the COVID-19 pandemic. The overall positivity rate in the combined U.S. workforce based on more than seven million urine drug tests collected between January and December 2020 was down only slightly in 2020 (4.4%) compared to 2019 (4.5%, a sixteen-year high).
Urine drug test results in the general U.S. workforce declined in eight drug categories but stayed the same in two drug categories (excluding propoxyphene, which was withdrawn from the U.S. market a decade ago). Positivity for cocaine declined 18.5% (0.27% in 2019 versus 0.22% in 2020), the semisynthetic opiates (hydrocodone/hydromorphone) declined 10.8 percent (0.37% in 2019 versus 0.33% in 2020), oxycodone group
Positivity in the federally mandated, safety-sensitive workforce
of opiates (oxycodone/oxymorphone) declined 14.7% (0.34% in
based on more than 2 million urine drug tests declined 8.3% (2.4%
2019 versus 0.29% in 2020) and benzodiazepines declined 9.3%
in 2019 versus 2.2% in 2020) but was still 10% higher than the 2016
(0.43% in 2019 versus 0.39% in 2020).
rate (5 years prior).
While the positivity for MDMA/MDA
In the general U.S. workforce, positivity increased 3.8% (5.3% in
3,4-Methylenedioxymethamphetamine (commonly known as
2019 versus 5.5% in 2020) and was 12.2% higher than in 2016.
ecstasy) increased by 25% (0.008% in 2019 versus 0.010% in 2020)
As positivity for most drug categories, other than marijuana, declined or remained flat in the combined U.S. workforce over the past five years, amphetamines (which includes
and has demonstrated small, year-over-year increases, the positivity rate remains very low at 1 in every 10,000 (0.010%) tests.
“Driven largely by surging rates of marijuana general U.S.
POSITIVITY RATES DECLINED IN FEDERALLY MANDATED, SAFETY-SENSITIVE WORKFORCE TESTING CATEGORIES
workforce positives and steady rates of amphetamines
Urine drug test results for the federally mandated, safety-
methamphetamine) persisted at 1.1% positive each year.
positives, the rate of drug positivity remained stubbornly high despite seismic shifts to the workplace caused by the COVID-19 pandemic,” said Barry Sample, Ph.D., senior director of science and technology, Quest Diagnostics, in a statement. “However, as we see upticks in hiring and many employees returning to the workplace, it is important that employers consider workforce
sensitive workforce declined in all drug categories other than phencyclidine (PCP), which remained at 0.011%, same as in 2019. Of note, positivity for marijuana declined 10.2% (0.88% in 2019 versus 0.79% in 2020), cocaine declined 20% (0.25% in 2019 versus 0.20% in 2020), semi-synthetic opiates (hydrocodone/
hydromorphone) declined 14.3% (0.35% in 2019 versus 0.30%
difference). In 2020, pre-employment marijuana positivity was
in 2020) and the oxycodone group of opiates (oxycodone/
3.7% and post-accident 6.4% (a 73% difference).
oxymorphone) declined 19.2% (0.26% in 2019 versus 0.21% in 2020).
“The Drug Testing Index data shows states with recreational
While the positivity for MDMA/MDA 3,4- Methylenedioxy-
marijuana statutes have significantly higher positivity and the
methamphetamine (commonly known as ecstasy) increased
year-over-year differences between recreational states and
by 25% (0.008% in 2019 versus 0.010% in 2020) and has
states with medical and no legalization statutes has grown. In
demonstrated small, year-over-year increases, the positivity rate
addition, while urine drug testing cannot determine whether an
remains very low at 1 in every 10,000 (0.010%) tests.
individual is under the influence or impaired at the time of test,
MARIJUANA CONTINUED DOUBLE-DIGIT YEAROVER-YEAR INCREASES IN THE GENERAL U.S. WORKFORCE, WITH LOWER POSITIVITY RATES IN STATES WITH ONLY MEDICAL MARIJUANA USE OR NO FORM OF LEGALIZED MARIJUANA USE VERSUS STATES WITH LEGALIZED RECREATIONAL STATUTES
our post-accident data suggests that marijuana use may play a role in those workplace incidents prompting a drug test,” Dr. Sample said.
COCAINE POSITIVITY LOWEST SINCE 2012 GENERAL U.S. WORKFORCE Urine drug test positivity for cocaine in the general U.S. workforce dropped to the lowest level since 2012. Positivity for cocaine
Marijuana positivity surged ahead in 2020 in the U.S. general
declined 18.5% (0.27% in 2019 versus 0.22% in 2020). Positivity for
workforce and across specimen types (urine, oral fluid, and hair).
cocaine over the past five years declined 21.4% (0.28% in 2016
In the U.S. general workforce, marijuana positivity increased
versus 0.22% in 2020).
16.1% in urine testing (3.1% in 2019 versus 3.6% in 2020), 35.2% in oral fluid testing (9.1% in 2019 versus 12.3% in 2020) and 22.5% in hair testing (7.1% in 2019 versus 8.7% in 2020). The Drug Testing Index data also showed stark differences between states that have legalized recreational marijuana use versus states that have only legalized medical marijuana use or no form of legal marijuana use. Marijuana positivity surged in states with legal recreational use statutes 118.2% from 2012-2020 (2.2% in 2012 versus 4.8% in 2020). In states with only medical marijuana statutes, marijuana positivity increased 68.4% (1.9% in 2012 versus 3.2% in 2020). In states with no medical or recreational
WORKFORCE POSITIVITY INCREASED SIGNIFICANTLY IN MULTIPLE INDUSTRIES The Quest Diagnostics Drug Testing Index Industry Insights of general U.S. workforce positivity rates, based on more than 17 million urine drug test results between 2016 and 2020, shows yearover-year increases in overall workplace drug positivity in 6 of the 17 sectors reported. The Retail Trade industry had the highest overall positivity rates for all drug categories across all five years of the analysis (5.1% in 2016, 5.2% in 2017, 5.4% in 2018, 5.5% in 2019 and 6.2% in 2020).
marijuana statutes, marijuana positives increased 57.9% (1.9% in
Accommodation and Food Services tied with Retail Trade for the
2012 versus 3.0% in 2020).
highest positivity in 2020 alone (4.7% in 2016, 4.6% in 2017, 4.9% in
“Our data suggest that marijuana positivity has increased sharply nationwide since states began to legalize marijuana in 2012. However, it appears that states, where medical marijuana use alone is legal, are not experiencing much higher rates of
2018, 5.1% in 2019 and 6.2% in 2020). The Accommodations and Food Service category had the highest workforce positivity for marijuana at 6.3%, a relative increase of 96.9% over five years (3.2% in 2016 versus 6.3% in 2020).
increase than states where neither medical nor recreational use
“Impairment, whether it be by drugs, alcohol, fatigue or stress,
is legal,” Dr. Sample said.
decreases the safety of the workforce,” said Jenny Burke,
THE POSITIVITY RATE OF POST-ACCIDENT TEST RESULTS GREW FASTER THAN THE RATE OF POSITIVITY FOR PRE-EMPLOYMENT TESTING
senior director of impairment practice, National Safety Council. “The DTI results, reflecting decreases in many drug categories, occurred in a unique year. Even though these are down, we must continue to educate people about the impairing impacts
Between 2012, when the first state legalized recreational
of these substances. And, as states and the federal government
marijuana, and 2020, the gap between pre-employment and
consider changes to the legality of marijuana, we can’t take for
post-accident marijuana positivity increased each year. In the
granted that they also understand the impairing impact of THC.
U.S. general workforce, in 2012, marijuana pre-employment
The safety of people who share the roadways and workplaces
positivity was 1.9% and post-accident positivity was 2.4% (a 26.3%
with impaired people needs to be a priority.”
7
Does Your Safety Report Card Have Three Fs? 06.14.2021 | EHS Today by Terry Mathis Improving safety performance involves three elements: focus, feedback and facilitation. When I was in school, an F was a failing grade. Having one or more on your report card could result in undesirable consequences. However, now that I am past the basic part of my ongoing education, I feel free to use the alphabet more liberally.
To create the kind of focus that promotes improvement, start by defining what safety is and how to create it. I recommend a definition such as “know the risks, know the precautions to address the risks, and take those precautions every time.” After you have focused workers on a common definition, you need to determine specific safety improvement targets. You can’t become perfect at everything at once, but you can work toward perfection in a few areas over the near term.
I mproving safety performance is about three elements that all start with the letter F. Unfortunately, I don’t find these three elements in many of the client sites I work with. Some have one or two, but almost none have all three. Many misunderstand or under utilize these elements to the detriment of their improvement efforts.
Once you have reached your targeted improvements, you can move on to other targets. The journey to safety excellence begins with a single step. Once your workforce knows how to step, they can put as many steps together as needed to reach your performance goals.
The three elements are focus, feedback and facilitation.
FEEDBACK
Most improvement efforts in safety are either unfocused or too overly ambitious to create focus. Improvement needs to be divided into doable steps and not an overall goal of becoming perfect. The most common problem I encounter is that the client is trying to do too much at once. The second most common problem is that if they are not making the desired progress, they think the answer is to do more rather than to do better.
If there is one F that is most used by organizations, it is feedback. However, feedback without focus is not only less effective, it is sometimes destructive.
These two mindsets undermine the majority of safety improvement efforts where they exist. The alternative to this is the 3-F approach. Let’s examine each of these and then see how they work synergistically together.
One organization I was working with recently encouraged their safety professionals to catch workers doing something safe and give them positive reinforcement feedback. Many reported having trouble finding meaningful positive behaviors to reinforce. They also had to bite their tongues to not criticize workers’ poor safety performance.
FOCUS I find there is an underlying assumption that workers know what safety is and how to make it happen. When I interview workers, I do not always find that to be true. Few organizations have a defined and shared definition of safety. Workers can tell me the goals of safety, but the only methodologies they name are following rules and procedures or “think before you act.”
Without a specific focus, feedback is largely or wholly subjective. Without training and guidance, feedback tends to be wholly negative. Those giving feedback overlook everything positive and become critics of the negative.
When you focus on specific safety improvements, feedback is directed to those targeted improvements. Either the worker being observed did them or did not. The subjectivity is gone, and the feedback becomes concrete and objective.
This type of feedback benefits from focus and reinforces the focus areas. Workers can see progress toward targeted goals and how to improve their own performance to accomplish said goals. A past Harvard study concluded that seeing progress toward specific goals was one of the most effective motivators toward performance improvement.
Congratulations!
FACILITATION The Latin root of this word means “easy.” When you facilitate safety, you make it easier for workers to do their jobs safely. The most effective approach to feedback is twofold: 1) to positively reinforce and encourage continuation of targeted safe behaviors, and 2) to determine the influences driving unsafe behaviors in the targeted areas. It is naïve to think that one instance of verbal feedback can change a safety practice that is reinforced by habit or other organizational factors. If feedback determines what is facilitating at-risk behaviors, the logical next step is to work with those facilitating factors to align them toward safer performance. Good facilitation often involves four broad areas:
• Perceptions—Workers’ perception of risk often varies by their individual experiences in the workplace. Perceptions can be managed and aligned with the desired focus. Doing so will facilitate safe performance. • Habits—Past patterns of behavior can be strong but can also be facilitated to change with spaced reinforcement from feedback and other reminders.
Cryoport Facility Demolition efforts began at the new Houston Cryoport facility in February 2021. “The Austin Company” (TAC) managed, which took over 6-weeks to complete without a
• Obstacles—Some workplace issues can make it difficult
safety incident. This project is managed by one of Austin’s
to perform work safely; such issues can be addressed or
Project Managers, Bill Adams, and Project Superintendent
modified to make it easier to be safe.
is Richard Garcia, who reports to Brandon Davis. One
• Barriers—Some workplace conditions can make it
of the integral contractors to the demolition efforts was
impossible to perform work safely; such conditions
The Brandt Companies, responsible for the mechanical,
cannot always be eliminated, but sometimes
electrical, and HVAC work. Therefore, Brandt was
workarounds can be found. If that is not possible,
responsible for the utility connections were saved off, and
everyone can be made more aware of the dangers so
demolition efforts could be carried out without electrical
they can proceed with caution.
or mechanical hazards exposed. Upon completing
Safety programs have been developed to encourage organizations to examine workplace influences and align them to desired performance. The 3-F approach can give such efforts more practical data to accomplish this purpose.
demolition activities, work was initiated on permanent HVAC, electrical, and plumbing installations after obtaining a construction permit. The Brandt Companies proceeded with the permanent installations in a safe and
Safety improvement efforts often fail. The common causes of failure are trying to do too much at once and failing to follow the 3-F approach.
quality manner, and two Brandt craft employees stood
If you align your workforce on a common definition of safety and set some specific improvement targets (focus), establish a process of giving regular feedback that positively reinforces workers achieving the targeted improvements and discovers the influences keeping them from that achievement, and work to amend the influences and align them to produce the desired safety improvements (facilitation), then safety excellence is most often the result that follows.
leadership in supporting TAC’s priority regarding safety.
out as being “Safety Responsible.” They demonstrated In addition to working safely, we found the quality of the work delivered by two of the Brandt craft are Mike Ridge (Electrical) and Bruno Perez (Mechanical). As a result, TAC formed a “Safety Committee,” and these individuals were recognized as safety leaders and nominated as the awardees for May 2021 to demonstrate consistent efforts to work safely and in a quality manner. We provided lunch and issued certificates of recognition to the Brandt employees Mike and Bruno.
9
Problems with Safety Management: Accident Issues 05.25.2021 | OH&S by Peter Furst Clear communication of objectives can play a big part in
accident as poor planning on the part of managements for not
avoiding confusion and clarifying expectations.
having sufficient appropriate ladders available on site.
An accident investigation was conducted in a commercial
BASIS OF CONTROL
high-rise office building. The investigator started out with where did the accident happen? It occurred on the fourth floor. The next question was, “When did it happen?” The answer: it happened at 11:15 AM. This was followed by, “What happened?” A worker fell of a step ladder while installing duct work. Then: How did the fall occur? The worker was on the top step of the ladder working when he lost his balance and fell. After talking to the injured person and others working in the area who were able to contribute to the investigation; the conclusion was that the worker was working unsafely because the standards as well as company safety program state that no work should be done by standing on the top two steps of a step ladder. The safety manager then discussed this with the foreman indicating the worker violated a basic safety rule, and should be admonished and made to understand that such behavior is unacceptable. Back at the office he reviews a summary of all accidents to that date on the various company work sites and found three other ladder use accidents happened that year. He then informed management that all the workforce should be given a refresher training on all ladder use. Problem solved... right? Not really. The safety manager should have asked the foreman as to why he did not observe this in his walks around the site that morning. Better yet he should have asked why did the worker use a ladder that was too short for that task. This may have pointed out that a taller ladder was not available, and that there was a concerted “push” from supervision to improve on production. This would have highlighted another significant reason for the
06.11.2021 | Weeklysafety.com Sometimes it takes a dramatic statement to provide a wake-up call, especially when it comes to bringing attention to the importance of workplace safety.
It is generally some act on a worker’s part that ends up resulting in the accident. Over the years, there have been numerous studies of accident data which indicated that just about all accidents are caused by workers making choices which lead to incidents, injuries, and ultimately losses (see Herbert Heinrich, & Frank Bird on accident causation). As a result, safety practitioners have structured their organizational programs, policies, and procedures to generally focus their interventions to deal with controlling the physical environment and more importantly the action and behavior of the part of the workforce. The underlying premise governing safety performance improvement is that somehow by “fixing” the worker, most safety problems will be resolved. There is no question that the workers do have control over their own behavior, and that they do make choices or mistakes that sometimes lead to incidents, but in the workplace, there is much, much more at play than individual worker decisions and choices. A significant, overlooked area is the jobsite management’s ability to exercise considerable oversight and control over virtually everything that transpires at the workplace, involving planning, organizing, staffing or task assigning, directing, problem solving, coordinating and controlling, including affecting the worker’s Working safely is like breathing - ifsafe you behavior. don't, you die. - Jerry Smith decision-making, as well as
TYPICAL PRACTICES Safety performance improvement strategies typically start with a review of past losses. From this analysis flows the interventions for the upcoming time period. These interventions typically include more training, emphasis on certain program elements, writing of new procedures, or more rigorous inspections. More than likely, in the short-term, some of these interventions do garner improved result in the safety outcome metrics. But in the long run, the results never live up to expectations. And so more training, retaining, priority programs, incentives, or discipline are instituted which ultimately result in less than stellar outcomes.
management) much more than we do the “worker”. We will find most of our solutions at the organizational/operational level than the unsafe condition or worker’s act level. It is the management people who define the values and create the culture that delineates the norms, symbols, rituals, artifacts, heroes, and stories of the culture. We must assess the work climate to see what is deemed acceptable and what is not. We have to look at management in the organization and the systems they devised to drive it. How much emphasis is placed on leadership as opposed to management? Is dealing with risk and safety an intrinsic part of everything that is planned and done? It is leadership that inspires excellence while
Some of this is because the improvement strategy is based on
management stresses achieving goals. Are people put into
historic data and the future is never exactly the same as the
situations where they have to choose between production
past. The data analyzed may not give a true picture of all the
goals and safe work practices? We have to determine why
contributing causes, see example above. The focus generally
workers do what they do, how the organizational systems allow
is on the worker and not on the task factors, performance
and the work climate encourages such actions. Until we get to
objectives, operational systems, work climate, and culture
that causal level, we are not going to get very far in improving
which influence the worker’s actions. Focusing on “changing”
our safety results.
the worker’s behavior does not remove the underlying drivers of the behavior. These remain and influence the actions of the next worker. This approach to safety improvement has been in effect for over a century, and is still utilized by many construction organizations.
There is another issue to note. Unless we eliminate the systems that allowed risk to enter into the operations as well as allowed it to exist, intervention focused on changing or removing a worker will not effectively solve the problem. The system will eventually “get” the next worker and then the next and the
Safety objectives are usually out of alignment with business
next and so on. Therefore, management must be vigilant to
goals. Safety management is not integrated into operational
ferret out any possible situation that may cause confusion or is
processes, and safety metrics have little relationship to
open to misinterpretation. Clear communication of objectives
measures used to manage the operation. There should be an
can play a big part in avoiding confusion and clarifying
organizational integrated strategy with defined objectives,
expectations. The organizational metrics, how people are
aligned metrics, and achievable goals. Safety should report to
measured and rewarded, the culture of the organization, and
senior management and have a part in the operation’s overall
the work climate all may lead the worker to thinking that unsafe
strategy. Safe operations should be an organizational core
behavior is somehow okay. Excess pressure to achieve goals or
value—it should be instinctual.
to meet the schedule increases stress and may lead to errors
CONCLUSION
resulting in inferior work quality or worker injuries.
To solve the safety problem, we primarily have to look at the people overseeing the operations, (foreman, supervisors and
11