


Data Focus & Sources..................................................... Key Findings on the State of Tech Jobs in MSA..........
Data Focus & Sources..................................................... Key Findings on the State of Tech Jobs in MSA..........
As noted in the 2024 Tech Jobs Report, core tech occupations aren’t static and shift over time as tech, tools, and industry demand continue to change. In 2022, TechSTL released the IT Labor Market Report, which established our baseline benchmarks for the St. Louis MSA IT and data economy from 2018–2022 and defined 55 core tech occupations (listed on pages 8-9). These same occupations were consistently referenced in the 2022–2024 Tech Jobs Reports to maintain year-over-year comparability. In 2025, the number of core tech occupations increased to 56 with the addition of Video Game Designers, reflecting the growing role of interactive media, digital content creation, and creative technology within the broader tech ecosystem, alongside continued expansion in areas such as artificial intelligence and cybersecurity.
It is important to explain the key difference between the two data sets referenced in this report. Tech Employment or the Labor Market represents the number of tech occupations currently in existence with the St. Louis MSA. The Job Postings or Active Job Ads references the open positions available within the MSA. Employment data is a lagging indicator of the job market while the job ads data can indicate if demand for expansion is growing or contracting.
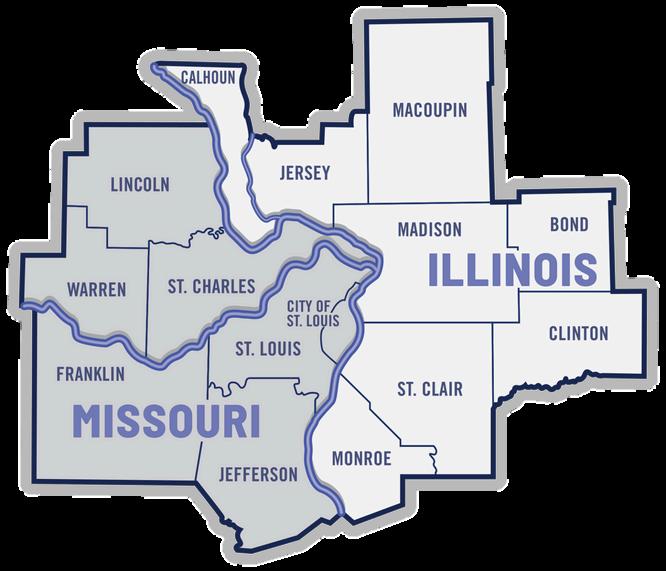
This data report is looking only at the labor market and job postings available within the 15-county bistate region of the St. Louis Metropolitan Statistical Area.
We sourced this data from JobsEQ, Chumura Economics, U.S. Bureau of Labor Statistics, U.S. Department of Labor O*Net Online, CompTIA Tech Jobs Report, Coursera 2025 Global Skills Report
on the state of tech jobs in St. Louis 4
1.
2.
TechSTL occupation job postings increased by .5% from 2024 to 2025, with 35,455 total active jobs over the 12 months from 56 core tech occupations (up from 55 in 2024)
3.
The Computer and Information System Managers occupation increased by 10.9% to secure the top ranking in the St. Louis Metro with 4,830 postings in 2025

4.
All 19 industries continue to see a volume of job ads for TechSTL Occupations in the STL Metro and are strongly correlated with the region’s highest median wages likely due to the impact of AI changes in occupational demand,
STL tech job postings and IT employment declined more sharply than national trends, indicating a weaker local market and structural

From 2019–2025, both national & St. Louis Metro labor market data point to a tech workforce undergoing structural transformation rather than simple contraction. While headline indicators show cooling job postings compared to post-pandemic highs, the underlying trends reveal sustained demand for advanced technical skills, rising wage premiums for specialized roles, and a broad diffusion of technology across nearly every industry. The divergence between national resilience and regional softness in St. Louis highlights the shifting tech demand and the importance of understanding that it is not disappearing.
At the national level, computer and information technology occupations remain among the strongest segments of the U.S. labor market. In 2025, the median annual wage for tech occupations was approximately $105,990, substantially higher than the median wage across all U.S. jobs, reinforcing tech’s role as a primary driver of income growth and economic mobility (U.S. Bureau of Labor Statistics). Long-term projections indicate that tech employment will continue to grow faster than the overall labor market, with particularly strong momentum in AI, data science, cloud computing, and cybersecurity. Demand for information security analysts alone is projected to grow by more than 29% through 2034, far exceeding average occupational growth rates (U.S. Bureau of Labor Statistics). Industry analysts similarly project double-digit growth for AI and data-driven roles as organizations expand automation, analytics, and digital infrastructure investments (World Economic Forum).
As importantly, national research shows that tech skills have become a baseline requirement across industries, not just within traditional technology firms. Cloud platforms, AI-assisted workflows, cybersecurity awareness & data literacy now
underpin operations in healthcare, finance, manufacturing, logistic, and professional services. This cross-industry demand is contributing to persistent skills shortages in security and data analytics, even as overall hiring volumes fluctuate (ISC2).
Despite softer job posting volumes compared to the 2021–2022 surge, national surveys show that many employers continue to prioritize tech hiring aligned with digital transformation and AI adoption. In mid-2025, nearly one-in-four companies reported plans to increase hiring for digital or AI-related roles, while many others aimed to maintain current tech staffing levels rather than cut back (Experis).
Additionaly, hiring strategies have become more selective. Employers increasingly favor experienced specialists and hybrid professionals who combine technical expertise with business impact, rather than broad expansion of junior or generalist roles. This shift reflects a move toward leaner, high-productivity teams designed to maximize ROI on technology investments (Motion Recruitment).
Across the U.S., tech wages remain elevated relative to the broader labor market. Roles tied to cloud architecture, cybersecurity engineering, AI implementation, and data platforms continue to command strong compensation premiums. While wage growth has moderated in some traditional development roles, positions that blend technical depth with strategic or AI-enabled impact continue to see robust earnings potential (Payscale).
At the same time, national analyses emphasize that the definition of a “tech job” is
expanding. Many non-IT roles now require meaningful digital competencies, contributing to rising wages in occupations outside traditional tech classifications (LinkedIn).
Against this national backdrop, the St. Louis Metro exhibits a more pronounced contraction in tech job postings and employment across the 2019–2025 period. The decline in TechSTL occupation job ads continued in 2024–25 and outpaced national reductions, signaling comparatively weaker short-term labor market conditions locally.
While U.S. tech postings softened modestly, the sharper pullback in the St. Louis MSA suggests regional exposure to cost pressures, organizational consolidation, and shifts in how employers source technical talent. The data also shows a changing mix of tech occupations represented in both employment and job postings, indicating that demand is reallocating toward different skill sets rather than uniformly declining.
Although the dataset does not directly confirm causal factors such as outsourcing or remote-first hiring redistribution, these dynamics remain plausible contextual contributors—particularly as national employers increasingly decouple tech roles from geographic proximity.
To better capture these dynamics, the 2025 St. Louis Metro Tech Jobs Report significantly expanded its analytical scope. The research examined job posting data from both the St. Louis MSA & the United States across 2019–2025, providing
direct regional-to-national comparisons. In 2025 alone, the dataset included:
326,002 total job postings
26,599 employers across all 19 industries
5,628 tech industry employers posting within the region’s 56 core tech occupations
1,827 distinct tech hard skills in demand across all occupations
This expanded approach is required to reflect the reality that tech demand is no longer confined to a narrow set of IT roles, but is a skillset imbedded in most occupations.
Mirroring national patterns, St. Louis Metro data shows that tech skills are now embedded across all 19 major industries, including healthcare, manufacturing, finance, logistics, education, government, and professional services. Many roles not traditionally classified as “tech” now require digital fluency, data interaction, and technology-enabled workflows.
In response, the 2025 report broadened its lens beyond the 56 core TechSTL occupations to track tech skill demand across the entire labor market. With confirmation that hard tech skills are increasingly integral across all industries, TechSTL will continue working with vertical industry partners to further expand analysis beyond IT and Computer & Math occupations in future reporting cycles.
The St. Louis data reveals a clear distinction between baseline digital skills and advanced technical capabilities. Foundational competencies, such as Microsoft
Office, Excel, CRM platforms, project management tools, collaboration software & emerging AI-assisted tools, now appear across nearly all occupations. These skills increasingly function as minimum qualifications, shaping access to employment, job stability & lateral mobility.
At the same time, demand remains strong for advanced skills including SQL, Python, cloud platforms, cybersecurity, Agile methodologies, data analytics, and AI-related competencies. These higher-order skills are consistently associated with higher wages, faster hiring cycles, and cross-industry portability, reinforcing their importance to both individual career advancement and regional economic competitiveness.
Taken together, this research affirms that continued, coordinated investment in the St. Louis tech ecosystem is not optional; it is essential to the region’s longterm economic competitiveness. As technology becomes embedded across all industries and occupations, the data underscores the critical role of locally rooted leaders, businesses, and talent in shaping a future-ready workforce for the St. Louis Metro. Even amid shifting hiring dynamics and short-term volatility, St. Louis-based companies and practitioners remain the region’s most valuable economic asset, driving innovation, skill adoption, and productivity across sectors.
TechSTL members and partners are actively investing in the advancement of technical skills, applied innovation, and inclusive access to tech opportunity, positioning the region to respond to national labor market shifts while strengthening local pathways to high-quality employment. This research reinforces that sustained ecosystem leadership; grounded in data, collaboration, and local capacity, will be central to ensuring that the benefits of technological change translate into shared economic growth for the MSA and all residents.
Note: The BLS Occupational Employment and Wage Statistics (OEWS) survey is not designed to compare employment over time. Data for each year is based on semi-annual survey data from the past three years, adjusted to reflect the current year. These adjustments and occupational classification issues can skew changes from year to year.
Source: “Employment and Wage Estimates" May 2023 & 2024, U.S. Bureau of Labor Statistics, https://www.bls.gov/oes/tables.htm, Accessed 5/27/25.
Computer Occupations, All Other (1st)
Computer and Information Systems Managers (2nd)
Computer Programmers (3rd)
Web and Digital Interface Designers (4th)
Database Architects (5th)
Computer User Support Specialists
Computer and Information Research Scientists
Computer Hardware Engineers
Web Developers
Database Administrators
Software Quality Assurance Analysts & Testers
Information Security Analysts
Computer Network Support Specialists
Computer Network Architects
Network and Computer Systems Administrators
Computer Systems Analysts
Software Developers
Source: “Employment and Wage Estimates" May 2023 & 2024, U.S. Bureau of Labor Statistics, Accessed 5/27/25.
A dashboard of total job postings in 2025
1.8%

21,871 TECH OCCUPATIONS
35,455 56 5,628 444 TOTAL JOB POSTINGS REGIONAL EMPLOYERS REQUESTED CERTIFICATIONS UNIQUE JOB TITLES

1,827 REQUESTED HARD SKILLS
Computer and Information Systems Managers
Business Operations Specialists, All Other
Software Developers
Management Analysts
Computer User Support Specialists
Network and Computer Systems Administrators
Marketing Managers
Information Technology Project Managers
Financial and Investment Analysts
Information Security Analysts
Operations Research Analysts
Computer Systems Analysts
Market Research Analysts and Marketing Specialists
Statisticians
Software Quality Assurance Analysts and Testers
Logistics Analysts
Computer and Information Research Scientists
Business Intelligence Analysts
Search Marketing Strategists
Clinical
Web

1.Information
2.Statisticians
3.Computer
4.Operations Research Analysts
5.Clinical Data Managers
6.Computer, Automated Teller & Office Machine Repairers
7.Document Management Specialists
8.Information Security Analysts
9.Marketing Managers 10.Business

Health Care & Social Assistance
Administrative & Support, Waste Management
& Remediation Services
Retail Trade
Professional, Scientific & Technical Services
Accommodation & Food Services
Finance & Insurance
Educational Services
Wholesale Trade
Manufacturing
Information
Public Administration
Other Services (except Public Administration)
Transportation & Warehousing Real
25,250 24,763 20,011 11,561 10,102 7,301 6,407 6,128 5,073 3,353 2,556 2,335 2,254 2,209 1,556 556 546
Wholesale
Educational
Real
Retail
tech jobs added in STL Metro, by top industries GROWTH BY INDUSTRY
Professional, Scientific, and Technical Services
Finance and Insurance
Admin/Support Waste Management & Remediation Servi…
Wholesale Trade Information
0 2,000 4,000 6,000 8,000 10,000 12,000 14,000
“Posted Jobs” include postings tied to the 56 core tech occupations available in the STL Metro YEARS


Microsoft
Microsoft
Structured
Microsoft
Microsoft
Microsoft
Microsoft
Microsoft
Customer
13,175 11,126 9,702 7,415 5,345 5,081 4,753 4,583 4,313 4,114 4,054 4,024 3,313 3,255 3,064 2,791 2,748 2,676 2,559 2,528 2,222 2,069 1,986 1,941 1,900
Secret Clearance
Project Management Professional (PMP)
Certified Information Systems Security Professional
Certified Public Accountant (CPA)
Certified Information Security Manager (CISM)
CompTIA Security+ CE (Continuing Education)
Cisco Certified Network Associate (CCNA)
Certified Information Systems Auditor (CISA)
Cisco Certified Network Professional (CCNP)
Systems Security Certified Practitioner (SSCP)
GIAC Security Essentials Certification (GSEC)
Certified ScrumMaster (CSM)
Chartered Financial Analyst (CFA)
CompTIA Advanced Security Practitioner (CASP)
GIAC Certified Incident Handler (GCIH)
Certified Network Defender (CND)
GIAC Global Industrial Cyber Security Professional
GIAC Security Leadership Certification (GSLC)
Certified Cloud Security Professional (CCSP)
AWS Certified Solutions Architect
Cisco Certified Internetwork Expert (CCIE)
(A+ Certification)
Certified Internal Auditor (CIA)
Series 63
Certified Associate in Project Management (CAPM)
Microsoft Certified Solutions Expert (MCSE)
Certified Government Financial Manager (CGFM)
Certified Defense Financial Manager (CDFM)
Vmware Certified Professional (VCP)
Program Management Professional (PgMP)
Series 66 - Uniform Combined State Law (Series 66)
GIAC Certified Intrusion Analyst (GCIA)
Licensed Professional Engineer
Certified Fraud Examiner (CFE)
Microsoft Certified Professional (MCP)
Offensive Security Certified Professional (OSCP)
Oracle Certified
Certified Financial Planner (CFP)
AWS Certified DevOps Engineer
Certified Business Analysis Professional (CBAP)
Juniper Networks Certified Internet Associate (JNCIA)
GIAC Certified Enterprise Defender (GCED)
Series 10
Underwriter (CPCU)
(CSPO)
Secret Clearance
Certified Public Accountant (CPA)
Project Management Professional (PMP)
Certified Information Systems Security Professional
Licensed Professional Engineer
CompTIA Security+ CE Certification
Certified Information Security Manager (CISM)
Cisco Certified Network Associate (CCNA)
Certified Information Systems Auditor (CISA)
Series 63
Chartered Financial Analyst (CFA)
Certified Financial Planner (CFP)
Certified Internal Auditor (CIA)
Cisco Certified Network Professional (CCNP)
Series 66 - Uniform Combined State Law (Series 66)
Systems Security Certified Practitioner (SSCP)
GIAC Security Essentials Certification (GSEC)
Certified ScrumMaster (CSM)
Chartered Property Casualty Underwriter (CPCU)
CompTIA Advanced Security Practitioner (CASP)
GIAC Certified Incident Handler (GCIH)
(CFE)
(CND)*
CompTIA A+ Certification (A+ Certification)
Cisco Certified Internetwork Expert (CCIE)
Certification in Risk and Information Systems Control
Network+ Certification
Certified Associate in Project Management (CAPM)
Certified System Administrator (CSA)
Certified Government Financial Manager (CGFM)
Certified Defense Financial Manager (CDFM)
Microsoft Certified Solutions Associate (MCSA)
Program Management Professional (PgMP)
Amazon Web Services Certification (AWS Certification)
Microsoft Certified Solutions Expert (MCSE)
Vmware Certified Professional (VCP)
Offensive Security Certified Professional (OSCP)
GIAC Certified Intrusion Analyst (GCIA)
Microsoft Certified Professional (MCP)
Oracle Certified
AWS Certified DevOps Engineer
Series 10
Certified in Production and Inventory Management (CPIM)
Certified Business Analysis Professional (CBAP)
Juniper Networks Certified Internet Associate (JNCIA)
(GCED)
STL institutions offering tech certificates or degrees UNIVERSITY


UNIVERSITY


COLLEGE


STL institutions offering tech certificates or degrees
COLLEGE

COLLEGE


COLLEGE COLLEGE


COLLEGE

The St. Louis Metro
The 15 county bistate and
Metropolitan Statistical Area
2025 Tech Education Global Trends
170M
35.8M
North America shows significant strides in workforce readiness. Employers across the region are intensely focused on GenAI, data analytics, and shortform, career-aligned credentials. Reflecting this demand, job postings in AI fields have spiked 68% in the United States from 2022 to 2024, while Canadian employers now offer an average wage premium of 11% for AI related skills.

2025 Tech Education Global Trends

RISING PARTICIPATION IN ONLINE LEARNING 1 2 3 4
GENAI ADOPTION FUELS GLOBAL SKILL DEMANDS
CYBERSECURITY ENROLLMENTS RISE RAPIDLY,
BUT STILL LAG BEHIND DEMAND
MICRO-CREDENTIALS IMPROVE LEARNER
EMPLOYABILITY, SIGNALING KEY SKILLS TO EMPLOYERS
GENAI SKILL GAPS PERSIST DESPITE WOMEN’S
SKILL GAPS THREATEN GLOBAL
COMPETITIVENESS, PROMPTING EMPLOYERS TO
INVEST IN UPSKILLING

In the United States, AI and Machine Learning Specialist roles have expanded by 142% year over-year, far surpassing global averages.
Coursera enrollments in GenAI courses rose 135% year-over-year, and the US ranks #4 globally in Coursera’s AI Maturity Index. This aligns with 94% of US firms anticipating significant AI-driven transformations by 2030, especially as GenAI’s rapid adoption could necessitate up to 12 million career shifts by the decade’s end.
Women represent 52% of Coursera learners, showing balanced representation in digital training. With strong upskilling pathways, the US workforce is strategically preparing to leverage AI’s potential, helping the nation maintain its competitive edge in the global economy