

Prepared by :
Grant Black, Ph.D., & Gokhan Egilmez, PhD, Center for Applied Economics at Lindenwood University
Phyllis Ellison, Workforce Solutions at St. Louis Community College
Emily Hemingway, TechSTL


The StartupSTL Study was conducted by a partnership between Lindenwood University, St Louis Community College, and TechSTL to assess the health of the St Louis Entrepreneurial Ecosystem The three-year research partnership was funded by a Ewing Marion Kauffman Foundation Inclusive Ecosystem Grant to determine the level of upward mobility and resource accessibility for BIPOC business owners in high-growth industries, especially those leading tech-based and tech-enabled businesses
In 2023-2024, STL Startups were responsible for the net gain of new jobs across the Metro
With startup growth up 50% and job creation surging 34% in just one year, St. Louis entrepreneurs are not just participating in our economy, they are driving it. Locally owned businesses are responsible for the net gain of new jobs, especially in high-impact sectors like Health Care & Social Assistance and Professional & Technical Services
This is more than a success story. It is a blueprint for the future. By continuing to champion locally owned businesses, we can turn this surge into sustained growth and build a St Louis economy that is innovative, resilient, and prepared for whatever comes next.
Yet this momentum is fragile In times of market uncertainty, entrepreneurial ventures are our strongest defense against economic decline. If we fail to back them now, we risk losing the very engine that powers job creation, innovation, and community wealth The time to invest is now, because if we wait, we lose.

Ecosystem partners charged to collaborate after a 46% loss of resources since 2020
Since 2020, St. Louis has lost 46% of its entrepreneur support programs, with 58 of 127 resources changing or closing during the 5 year period. This erosion of infrastructure threatens the region’s ability to launch and scale new ventures at the pace needed to compete nationally
The study confirms that more analysis is urgently needed to map the current funding and programming landscape, including what currently remains available by stage, industry, and type of business. With fewer active programs, less funding in circulation, and reduced full-time leadership driving growth, the path forward demands smarter, more strategic collaboration across the partner network
This is not the time for fragmentation or territorialism. It is a moment for every partner to come to the table, align around shared priorities, and build a stronger, more connected, and more equitable startup ecosystem By working together with intention, we can transform disruption into opportunity and position St Louis to lead with unity, resilience, and innovation.
Capital Access is the single greatest barrier to business growth in the St. Louis Metro. The top need is early-stage funding, especially low-interest microloans under $50,000, a gap that forces many women and BIPOC founders to self-finance and scale back ambitions Closing this gap requires creative, collaborative solutions that expand affordable financing, protect revenue, and deliver relevant, high-impact business education. If we fail to act, we will continue to sideline promising founders, stifle growth, and weaken the region’s economic future.
4
Over 70% of St. Louis businesses report that Artificial Intelligence is already influencing their strategies, yet only 9% believe AI training and support are widely available in the region Since the launch of ChatGPT in late 2022, AI has moved from a distant concept to a real-time force, reshaping workflows, products, funding models, customer expectations, and even how investors assess the viability of startups
While 23% of local entrepreneurs say AI has significantly changed their business model, product, or funding approach, most are still in early adoption stages. Founders cite sales and marketing, business systems, and product development as top areas for AI integration, yet struggle to find the technical expertise, training, and mentorship needed to compete in an AI-driven economy.
This moment challenges the entire entrepreneurial ecosystem to gain the training and insight required to support businesses effectively in the new AI Era The ecosystem is only as relevant as the staff it employs, and if our staff are undertrained and underinformed, the region cannot offer meaningful value To stay competitive, St Louis must quickly expand AI-focused resources, talent pipelines, and informed leadership, or risk losing our best founders to more aggressive metros.
St Louis Partners will be convening in Fall of 2025 to expand on the data collected in this study and to address the regional efforts required to address ecosystem gaps
To be included in this effort, contact Emily@TechSTLcom

The St Louis Work and Business Survey is a key source of data for this case study It was developed for this project in summer and fall 2022, with minor revisions in 2023 and 2025 It is based in part on the U.S. Census Bureau’s Annual Survey of Entrepreneurs that was discontinued in 2016 but absorbed in its Annual Business Survey starting in 2017. Survey responses were anonymous, with no identifying information collected, including name, address, employer, or business name The survey was released to the public in 2023, with responses being received through early July 2025 In total, 289 responses were received, however, 77 were from respondents outside the St Louis Metropolitan Statistical Area (MSA), the area of this study. (See Technical Note 1 on the geographic definitions used in the study.) The remaining 212 observations were the foundation for the analysis. Of those, 116 reported being solely or partially self-employed or owning a business Among those not currently self-employed or owning a business, 43 reported entrepreneurial plans to start a business or become self-employed in the near future
Figure 1.2 shows the racial distribution of survey respondents. The largest non-white racial group is Black or African American (18.4%), followed by Asian (6.6%) and Other (4.7%). The sample racial distribution is similar to the overall population in the St Louis MSA based on estimates from the 2020 US Census, which shows blacks comprise 17 percent of the metro population, Asians 3 percent, and Hispanics 4 percent After taking Hispanic ethnicity into account, approximately 42 percent of respondents are BIPOC (black, indigenous, or people of color), which includes all categories outside non-Hispanic white. Just over 5 percent of respondents are U.S. military veterans or active service members. S T A R T U P S T L . C O M
Among the survey respondents, 43 percent are female, with only four respondents indicating they are non-binary/third gender or preferred not to say. Almost four out of ten respondents are under 35 years of age, while 44 percent are prime-age (35-54) and 16% are 55 or older. Almost nine out of ten are US-born citizens. Five percent have served in the US military Most live in suburban areas of the region, but 22 percent live in St Louis City while only 8 percent live in a surrounding (defined as rural) county Figure 11 shows a map of the zip code of residence for the survey respondents
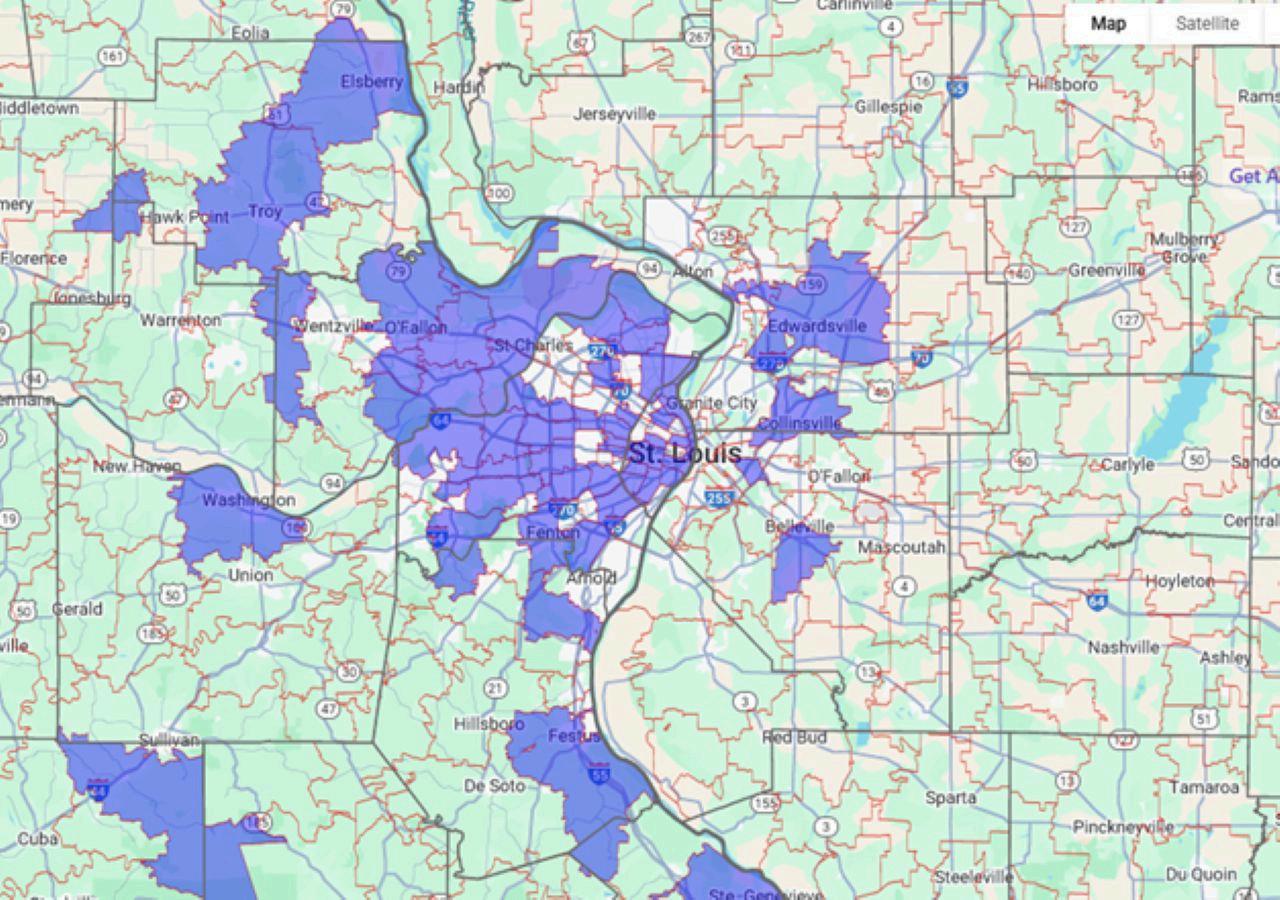
(Figure 1.1) Shows a map of the zip codes of residence for the survey respondents Source: wwwrandymajorsorg
S T A R T U P S T L . C O M
As a partner on the StartupSTL study, the 2025 St. Louis Community College “State of the St Louis Workforce Report” sheds light on how the impact of economic uncertainty is taking its toll on the creation of companies and on young companies hiring their first employees Startups and the ideas that launch them do not inherently stop or slow during times of economic hardship Recessions typically see an increase in startup creation What frequently impacts startups the most is customers cutting back on orders or key supporting businesses changing course.
Currently, access to credit may be more difficult due to higher interest rates and banks tightening lending requirements Venture capital investment is dramatically different than two or three years ago, with a drop in available investment and more selective investment strategies cutting out companies who would have received funding previously. Locally, there are fewer accelerators and even fewer investing accelerators, resulting in fewer companies receiving that first infusion of investment
Note: For the purposes of this report, a first-year startup is defined as a company that hires its first employee.
Following a six-year period (2017–2022) of stable startup creation, averaging approximately 7,300 new companies per year, the St Louis region experienced a significant decline of 27% in 2023 However, in 2024, startup activity rebounded sharply, reaching the highest level observed in more than a decade This resurgence was primarily driven by increased activity in the healthcare, construction, professional, scientific, and technical services sectors
ST. LOUIS METRO: FIRST-TIME STARTUPS BY YEAR
The 8,460 new startups in the region created 15,612 new jobs in 2024 This was a significant rebound from the 11,663 jobs created in 2023 and continues a five year trend of new jobs in the 14,800-15,600 range from 2018 to 2022.
For the last decade, startups in the area created a total of 145,642 new first-time jobs For the same period, the St Louis MSA grew by approximately 91,000 jobs Startups were responsible for the net gain in new jobs, a scenario that plays out across the country and was documented by the Ewing Marion Kauffman Foundation, based in Kansas City
(Job Creation Methodology: A new startup is identified by the first appearance of firm records in the employer file with no predecessor record in the Quarterly Census of Employment and Wages (QCEW) The QCEW contains individual records of wages paid for Unemployment Insurance (UI) Under this method, new startups are defined as new establishments The QCEW data set doesn’t include entities that are self-employed individuals or contract employees. Firm-level job counts represent the average employer-reported monthly employment in the QCEW employer file for quarterly observations. The number of jobs includes all employment types: full-time, part-time & multiple jobs, but excludes self-employed workers
34% Increase in Job Creation S T A R T U P S T L . C O M
This analysis is based on raw QCEW data, and the statistical methods used to calculate total employment differ from those employed by the US Bureau of Labor Statistics (BLS) in its published QCEW data. The BLS applies a six-step statistical test that MOSourceLink is unable to replicate. The number of startups for each year counts the number of new firms with fewer than 20 employees in each quarter of that year The number of new jobs from startups is measured by the jobs in Quarter 4 from new firms identified in Quarters 1 through 4)
ST. LOUIS METRO: JOBS CREATED BY FIRST-TIME STARTUPS BY YEAR
Nearly seven out of ten respondents reported holding an associate degree or higher, with 25% having earned a bachelor’s degree and 36% holding a master’s, doctorate, or professional degree. This is significantly higher than the general population in the St. Louis metro area, where only 39% have a bachelor’s degree or higher. An additional 9% of respondents had attended college without completing a degree, while fewer than 2% reported attending a technical, trade, or vocational school
Among those with at least a bachelor’s degree, more than a quarter (273%) held a degree in a tech-related field, and 22% had studied business or finance. Additionally, over half of respondents (52.4%) had completed one or more certificate or non-degree training programs outside of formal education Approximately one in five had completed training in a tech field, and nearly the same proportion had completed an entrepreneurship program
Among respondents who had not participated in any non-degree training, over one-third said they were unaware such programs existed. Another 9% cited lack of convenient access, 8% had started but not completed a program, and 5% reported applying but not being accepted
C O M
S T A R T U P S T L
The survey sheds light on what motivates individuals to become entrepreneurs Respondents were asked to rank the importance of nine reasons for owning a business or being selfemployed based on a scale of Not Important, Somewhat Important, and Very Important The top five factors ranked as somewhat or very important are (1) best avenue for my ideas/goods/services (94% of entrepreneurs), (2) opportunity for greater income and/or wealth (also 94%), (3) want to be my own boss (86%), (4) flexible hours (83%), and balance work and family (83%) The top three least important reasons are (1) difficulty finding employment (64% reported not important), (2) an entrepreneurial friend or family member was a role model (40%), and (3) always wanted to start/own my own business (25%)
More than half (54.6%) of the entrepreneurs work full-time or more on average (considered 31+ hours per week) in their business. Yet, 36 percent only work 20 or fewer hours each week on their business More than two-thirds of the entrepreneurs operate their business primarily from a home, likely to reduce operating costs and increase work flexibility Almost half (47%) of the entrepreneurs have customers located within metro St Louis, while 36 percent have customers within the US but outside the general region and 12 percent have customers outside the US. Approximately half of the entrepreneurs’ businesses are in professional and business services; among those, 27 percent are in consulting. The other half is widely dispersed across sectors, with 8 percent in other services excluding government, 7 percent in information, and 7 percent in manufacturing
S T A R T U P S T L . C O M
Sixty-one percent of the respondents reported they own a business or are self-employed fully or to some extent, including those with a side hustle Figure 15 shows a map of the zip codes of the business locations associated with these entrepreneurs The entrepreneurs’ businesses are found in 41 of the zip codes within the St Louis MSA
Almost 40% of the businesses are at an early stage of development (idea, pre-launch, launching), with another 30% consistently operating Almost 24% are considered in expansion, and only 7% are at a late stage of development Nine out of ten of the entrepreneurs operate microenterprises More than half (52%) of the entrepreneurs have no employees (classifying them as non-employer businesses) while another 38 percent hire fewer than 10 employees Only four percent employ 50 or more workers About 83 percent of the entrepreneurs own a majority of their business (at least a 50 percent share), with seven out of ten being sole owners Virtually all (94%) of the entrepreneurs founded their business More than half (55%) of the businesses are five years old or less, with more than three-fourths (76%) only being up to ten years old Among these entrepreneurs, more than four out of ten entrepreneurs had not previously owned a business or been self-employed, while 36 percent had started only one to two businesses However, 9 percent could be considered serial entrepreneurs, having previously owned five or more businesses.
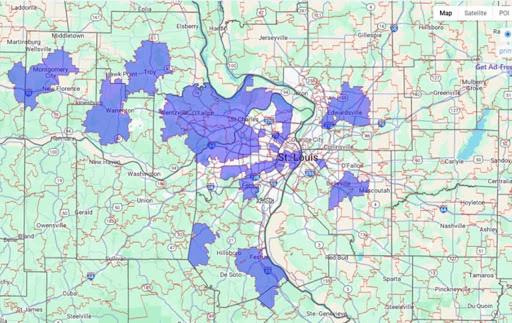
(Figure 1.5) Survey Respondents’ Business Location by Zip Code Source: wwwrandymajorsorg
Approximately half of the entrepreneurs’ businesses are in professional and business services; among those, 27 percent are in consulting The other half is widely dispersed across sectors, with 8 percent in other services excluding government, 7 percent in information, and 7 percent in manufacturing.
M
To better understand the challenges faced by St Louis entrepreneurs, survey respondents were asked to rate the extent to which ten specific factors negatively impacted the profitability and/or success of their business. Using a scale of Not Important, Somewhat Important, and Very Important, the top three perceived challenges ranked as Somewhat or Very Important were: (1) access to funding (73%), (2) unpredictability of the business environment (73%), and tied for third, the cost of funding (69%) and a weak overall business environment (69%) Other commonly cited concerns included taxes (58%) and government regulation (52%), underscoring the significant influence of financial, economic, and regulatory conditions on entrepreneurial success.
Conversely, the three least pressing challenges were: (1) lack of training in starting or running a business (64%), (2) customers or clients not making payments or paying late (56%), and (3) finding qualified or suitable labor (54%) The relatively low concern about labor may reflect the prevalence of non-employer firms in the region Notably, the perception that lack of business training is the least important challenge may suggest an overestimation by entrepreneurs of their own capabilities in business management.
S T A R T U
S T A R T U P S T L . C O M
This case study, based largely on the St Louis Work and Business Survey, in part explores how the experiences of BIPOC (Black, Indigenous, and People of Color) individuals compare to those of non-Hispanic white residents in the St Louis region According to the 2020 US Census, BIPOC individuals make up 29% of the metro population, primarily Black (17%), Hispanic (4%), and Asian (3%) residents, while non-Hispanic whites account for the remaining 71%
To identify meaningful differences between these groups, the analysis used Chi-square tests to determine whether variations in outcomes were statistically significant When differences were not statistically significant, this suggests that BIPOC and white respondents shared similar experiences. When differences were statistically significant, it points to potential disparities that may merit targeted policy or support
One area where a significant difference emerged was in educational attainment White respondents were more likely to have achieved higher levels of education, which may reflect broader systemic inequities in access to education and could influence business preparedness, confidence, or access to resources. However, there were no significant differences between BIPOC and white respondents in terms of completing certificate or nondegree training programs or in employment status This suggests that BIPOC individuals were just as likely to pursue practical business training and to be employed or self-employed
Interestingly, BIPOC individuals made up 36% of the entrepreneurs in the survey, well above their 29% share of the regional population, indicating strong entrepreneurial engagement. Across many key indicators of entrepreneurship, there were no significant differences between BIPOC and white business owners These include business ownership percentage, how they acquired the business, prior business experience, business stage, number of employees, time spent on the business, and whether it was home-based Financially, there were also no significant differences in sources of startup funding, total startup costs, current profitability, or recent revenue trends. These findings suggest that minority entrepreneurs are participating actively and successfully in the regional startup ecosystem
73%
Still, some important differences emerged When asked about their motivations for starting a business, BIPOC entrepreneurs were significantly more likely than white entrepreneurs to cite flexible work hours, lifelong dreams of owning a business, and the influence of entrepreneurial friends or family as major factors. These findings suggest that entrepreneurship holds personal and cultural significance for many BIPOC individuals, often as a path to financial independence and community advancement in the face of systemic barriers These motivations also highlight the importance of role models and social networks in shaping entrepreneurial aspirations Policy and support programs could help accelerate this trend by increasing the visibility of successful minority entrepreneurs and building pathways that honor these cultural motivators.
When it comes to challenges, BIPOC entrepreneurs were significantly more likely to identify four barriers as having a negative impact on their businesses:
#1
Access to funds
#3
Customers not paying on time or at all
#2
Cost of funds
#4
Lack of training in starting or running a business S T A R T U P S T L . C O M
These challenges are consistent with broader financial disparities, such as lower average income and savings levels, higher rates of being underbanked, and unequal access to credit These financial constraints make issues like funding gaps, high financing costs, and delayed customer payments especially burdensome For example, only 28% of BIPOC businesses in the sample were in the professional and business services sector, compared to 62% of white-owned businesses. BIPOC-owned firms may be more often concentrated in sectors with lower margins and greater exposure to customer payment delays
Interestingly, while BIPOC individuals were just as likely to complete non-degree business training, they were still significantly more likely to report a lack of business training as a barrier. This may reflect gaps in the relevance or accessibility of available training programs, suggesting a need for more culturally tailored, practical, and affordable business education
Taken together, these findings point to several opportunities for policy and ecosystem-level responses:
Increase access to affordable capital and financing tools tailored to minority businesses
Support invoice protection or legal services for collections
Expand access to culturally relevant, high-impact business training
Elevate minority role models and strengthen community-based mentorship networks
The study also employed regression analysis using a linear probability model to assess the likelihood of certain entrepreneurial outcomes based on demographic characteristics This method allowed researchers to estimate how factors such as race, gender, age, education, training, veteran status, and geography influence the probability of business ownership or selfemployment The model uses binary (yes/no) outcomes as dependent variables and interprets the effect of each explanatory variable as a percentage-point change in the likelihood of the outcome, while controlling for other variables (See Technical Note 2 for methodological details, including the rationale for using this approach and explanation of the pseudo-R² metric for evaluating model fit)
The first model focused on what factors affect the probability that an individual is a business owner or self-employed Variables included race (BIPOC status), gender, age under 35, US citizenship, military service, levels of education, non-degree entrepreneurial training, and location (City of St Louis or rural areas) Table 21 presents the full results of this model
Coefficient (Standard Error)
(0.06414)
-001273 (007494)
-01907** (008131)
Citizen 01709 (01106)
Military Service -01420 (01472)
Education of High School or Less (EdHSor<) -03205*** (009804)
Education of Some College but No Degree, Associate Degree, or Technical/Vocational Schooling (Ed<Bach) -005533 (009167) Completed Non-Degree Entrepreneurship Training (EntCert)
(007892)
The regression model in Table 21 assesses how various personal characteristics influence the likelihood of an individual being a business owner or self-employed. The model demonstrates a strong fit, with a pseudo-R² of 0.68 indicating that, on average, 68% of the variation in business ownership or self-employment status is explained by the model
In this analysis, the baseline comparison group is defined as a male, non-Hispanic white, aged 35 or older, foreign-born, with no US military service, holding at least a bachelor’s degree, who has not completed non-degree entrepreneurship training, and does not reside in either St. Louis City or a rural area.
U.S.citizenship,military service,andresidence ineitherSt.LouisCityor ruralareasalsoshow nostatistically significanteffects. S T A R T U P S T L . C O M
Individualsunder35 aresignificantlyless likelytoownabusiness orbeself-employedin theSt.LouisMetro.
Individualswithonlya highschooldiplomaor lessaresignificantly lesslikelytoowna businessorbeselfemployedthanthose withabachelor’s degreeorhigher.
Completinganondegreeentrepreneurship trainingprogram significantlyincreases thelikelihoodofowning abusiness.
Neitherbeingfemale norBIPOChasa significantlydifferent effectonbusiness ownershipstatusthan beingawhiteman.
These results highlight the importance of education and targeted entrepreneurship training in increasing business ownership rates. While race and gender did not significantly affect the likelihood of business ownership in this model, younger age and lower levels of formal education were associated with decreased likelihood, suggesting that age and education remain important barriers to entrepreneurship
S T A R T U P S T L . C O M
The second phase of regression analysis examines how both personal and business characteristics affect an entrepreneur’s experience specifically, their likelihood of perceiving businesschallenges
The first set of models explores whether entrepreneurs perceive one or more of ten specific challenges to their business success
Independent variables include demographic characteristics such as gender, race/ethnicity (BIPOC status), age under 35, education level (high school diploma or less; less than a bachelor’s degree), completion of non-degree entrepreneurship training, and prior business ownership experience. Business characteristics include whether the venture cost less than $50,000 to start and whether it operates in an industryotherthanprofessionalandbusinessservices(thedominantsectorinthesample)
The reference comparison group (or "omitted conditions") is a male, non-Hispanic white entrepreneur, age 35 or older, with at least a bachelor’s degree, no entrepreneurship training, no prior business experience, running a business in the professional and business services sectorthatcostmorethan$50,000tostart.
73%
Gender:Femaleentrepreneursarelesslikelytoreportfacingchallenges.
Race/Ethnicity: BIPOC entrepreneurs are more likely to report challenges, with a 13 percentagepointincreaseinthelikelihoodcomparedtonon-Hispanicwhitepeers
Education: Entrepreneurs with a high school diploma or less are less likely to perceive challenges than those with higher education levels This may reflect the typesofbusinessesoperatedordifferencesinexpectations
Entrepreneurial Training: Completing a non-degree entrepreneurship program reducesthelikelihoodofperceivingchallenges,likelyduetoincreasedpreparedness.
Business Experience: Prior business ownership increases the likelihood of perceiving challenges, suggesting experienced entrepreneurs may better recognize operationalrisks.
Startup Cost: Running a business that cost less than $50,000 to start raises the likelihood of reporting challenges by 32 percentage points, indicating the unique vulnerabilitiesoflow-capitalventures
Industry: Operating in a sector other than professional and business services reduces the likelihood of perceiving challenges, suggesting that professional servicesmayinvolvemorecomplexordemandingoperationalenvironments
When examining individual types of challenges, BIPOC status is the most consistent predictor being statistically significant in six out of ten categories It increases the likelihood of challenges related to:
Cost of funds
Taxes
Government regulation
Lack of business training
Late- or non-paying customers
Interestingly, BIPOC status is associated with a lower likelihood of reporting “access to funds” as a challenge This may reflect increased participation in targeted funding programs or greater awareness of existing financial support options among BIPOC entrepreneurs in the sample. As a whole, these findings suggest the need for ongoing support in reducing financing costs, improving business training access, and strengthening customer payment protections for minority-owned businesses
Low startup cost is the second most consistent factor, influencing challenges related to:
Alternate model specifications tested variables such as U.S.-born status, technical education or occupation, and early-stage business status. These additions reduced overall model performance and were excluded to maintain statistical reliability given the sample size 73%
This suggests that low-cost startups may be especially vulnerable to market conditions and more likely to struggle without adequate preparation or financial buffers
Across Missouri, the majority of startups are concentrated in the state’s primary population centers, including Kansas City, Columbia, Springfield, Joplin, Cape Girardeau, and St. Louis. St. Louis County holds the highest density of first-year startups among all counties in the state, as indicated by the deep orange shading on the accompanying heat map While startup activity is more pronounced in urban areas, new businesses and entrepreneurial ventures are present in every county throughout Missouri, as illustrated in the heat map provided by MOSourceLink’s “Show Me Jobs” report (Figure 3.1).
Startups in the St. Louis region tend to emerge in the same industry sectors that are well-established among larger employers The health care and social assistance sector remains the largest employer in the St. Louis metropolitan statistical area (MSA) and continues to lead in both startup activity and job creation Since 2015, 41,441 first-year startups have been launched in this sector, accounting for approximately 59% of the 70,158 total first-year startups during this period
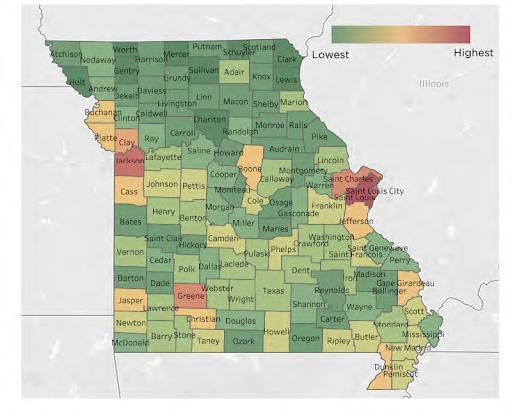
(Figure 31) 2019-2023 New Businesses across Missouri, shown by County Source: wwwmosourcelinkcom
The professional, scientific, and technical services sector represents the second largest concentration of startup activity, with 5,067 first-year startups since 2015, comprising about 7% of all new startups In addition to these leading sectors, the retail trade, construction, and accommodation and food services industries consistently rank among the top five sectors for startup formation These same sectors also dominate startup activity across the broader state of Missouri, indicating alignment between regional and statewide entrepreneurial trends.
Between 2015 and 2024, the leading sectors for startup activity correspond closely with the primary sectors driving job creation, just in different concentrations For example, the Retail Trade sector constitutes 44% of startups but accounts for a higher 94% of new jobs Similarly, the Accommodations and Food Services sector represents 35% of startups while generating 13.3% of new employment opportunities. It is important to note, however, that positions created within these sectors generally tend to be at lower wages. In contrast, startups operating within the health care, science, and technical fields typically generate higher-paying jobs, though they create relatively fewer positions compared to the number of startups in each of these areas S T A R T U P S T L . C O M
The St Louis Health Care industry is the largest industry sector for the St Louis MSA, and both the number of new startups and new jobs reflects the dominance of the industry in the region. In 2024, Health Care and Social Assistance added 5,585 startups. Professional, Scientific and Technical Services added 510 startups. Every industry continues to add startups each year, even those that are capital intensive like mining and utilities
Health Care and Social Assistance (NAICS 62) 41441
Professional, Scientific, and Technical Services (NAICS 54) 5067
Other Services except Public Administration (NAICS 81) 3866
Retail Trade (NAICS 44) 3054
Construction (NAICS 23) 2859
Accommodation and Food Services (NAICS 72) 2463
Administrative and Support and Waste Management (NAICS 56) 2125
Finance and Insurance (NAICS 52) 2088
Real Estate and Rental and Leasing (NAICS 53) 1585
Transportation and Warehousing (NAICS 48) 1288
Wholesale Trade (NAICS 42) 1173
Manufacturing (NAICS 31) 782
Information (NAICS 51) 732
Arts, Entertainment, and Recreation (NAICS 71) 582
Educational Services (NAICS 61) 504
Management of Companies and Enterprises (NAICS 55) 280
Public Administration (NAICS 92) 111
Agriculture, Forestry, Fishing, and Hunting (NAICS 11) 100
Utilities (NAICS 22) 39 Mining, Quarrying, and Oil and Gas Extraction (NAICS 21) 17
The number of startups and jobs created by startups rebounded from 2023 Health care and social assistance new first-time jobs experienced growth of 6,225 jobs or 14.2% over last year.
Accommodation and food services grew by 13.4%. Retail trade new first-time jobs grew by 109% industries had strong increases over the last year Professional, Scientific and Technical Services added 970 new jobs, a 102% increase over 2023
BY STARTUPS BY INDUSTRY 2015-2024 S T A R T U P S T L . C O M
Health Care and Social Assistance (NAICS 62)
0 20000
Accommodation and Food Services (NAICS 72) 19301
Retail Trade (NAICS 44) 13653
Professional, Scientific, and Technical Services (NAICS 54) 10441
Other Services except Public Administration (NAICS 81) 8147
Construction (NAICS 23) 7387
Administrative and Support and Waste Management (NAICS 56) 6808
Finance and Insurance (NAICS 52) 4953
Transportation and Warehousing (NAICS 48) 4866
Wholesale Trade (NAICS 42) 4081
Real Estate and Rental and Leasing (NAICS 53) 4024
Arts, Entertainment, and Recreation (NAICS 71) 3393
Manufacturing (NAICS 31) 2602
Educational Services (NAICS 61) 2125
Information (NAICS 51) 1845
Management of Companies and Enterprises (NAICS 55) 1058
Agriculture, Forestry, Fishing, and Hunting (NAICS 11) 386
50121
Public Administration (NAICS 92) 152
Utilities (NAICS 22) 186 Mining, Quarrying, and Oil and Gas Extraction (NAICS 21) 113
Overall, the entrepreneurs’ businesses are financially healthy based on the survey results. The vast majority (88%) of entrepreneurs expected their businesses to break even or earn positive profits in the year they responded to the survey Among those whose businesses had been in operation more than a year, 56 percent saw revenues increase in the past two years Another 27 percent had no substantive change in revenues during that time However, 17 percent saw declines in revenues, which could be a residual pandemic effect Looking into the near future, more than eight out of ten of the entrepreneurs expect revenues to increase to some degree within two years, with one-third predicting rapid growth in revenues of 100% or more. Only 4 percent of the entrepreneurs expect to experience modest decreases in revenues within two years, and no one plans to close their business
Increased by 100% or more
Increased by 50% to 99% Increased by 25% to 49% Increased by 10% to 24% Increased by less than 10% Stayed about the same. I
Increase by 100% or more
Increase by 50% to 99%
Increase by 25% to 49% Increase by 10% to 24%
The vast majority of funds used to start entrepreneurs’ businesses came from personal sources Ninety percent of the entrepreneurs reporting they used personal funds of some kind to start their business, including personal savings (85% of the entrepreneurs), personal assets other than savings (23%), and personal credit cards (16%). Among external sources, business loans or investments from family or friends ranked highest (10%), followed by business loans from the government (7%), grants (6%), and business loans from financial institutions (5%) Business credit cards also served as a source of funds for 6 percent of the entrepreneurs These results suggest many entrepreneurs may face challenges in acquiring external funds or sufficient amounts of external funding to start their businesses. This may contribute to why almost three out of four of these entrepreneurs started their business with less than $25,000 and 44 percent with less than $5,000 Still, 20 percent required at least $50,000 to launch
Top 3 are Personally Financed
When ChatGPT was launched in late 2022, it marked a turning point in how the world thinks about work, technology, and entrepreneurship In just a few months, artificial intelligence shifted from a futuristic concept to a real-time force unlocking new efficiencies, upending traditional workflows, and reshaping customer expectations In the St Louis Metro, these ripples are already being felt across the startup landscape, where founders are racing to adapt their business models, product strategies, and operational systems in response to this technological leap.
According to the St Louis Work and Business Survey of entrepreneurs across the region, AI is becoming a central consideration in how businesses are being built and scaled While only 23% of respondents say AI has significantly changed their business model, product, or funding approach, over 70% report it is influencing their strategy to some extent or significantly. Less than 30% say AI has had no impact at all, a clear signal that the AI era is already shaping entrepreneurial decision-making, even if many are still in early adoption stages
When asked where they most need support, founders identified sales and marketing (36%) as the top area for AI integration, followed by business systems (21%) and product development (21%) This suggests that while interest in automation and efficiency is growing, there’s an equally strong push to understand how AI can drive customer acquisition, market reach, and value delivery
“I encourage our team to use AI when possible, but require them to review all work. It’s very helpful for research & a big time save for our administrative work.”
“AI has transformed our business operations, especially for marketing.”
“I am currently using AI to help with daunting tasks like email marketing and digital marketing.”
“Just started using AI to help submitting proposals, bids, and email marketing.”
Yet, despite this rising interest, many founders report gaps in the local AI support infrastructure. Fewer than 12% of respondents believe the St Louis region offers widely available AI-related resources across any category from training to technical co-founders to product development Most resources are seen as only somewhat available, with a third or more of founders unsure where to find what they need especially when it comes to advanced training, access to capital for AI-powered ventures, or mentorship from AI-experienced advisors.
As AI continues to redefine the pace and patterns of innovation, the St Louis startup community faces a critical inflection point The opportunity now is not only to embrace AI but to build the support systems, talent pipelines, and capital strategies that ensure founders aren’t left behind in a rapidly accelerating market
Widely Available
Somewhat Available Not At All Available Unsure
Advantage Capital
Ameren Accelerator
Arch Grants
Arsenal Capital Management
Ascend Venture Capital
BioGenerator
Callais Capital Ventures
Capital Innovators
Cultivation Capital
DEI/Anchor Accelerator
Dundee Ventures
Fintop Capital
FTL Capital
iSelect Fund
Justine PETERSEN
Lewis & Clark Ventures
Lindbergh Technology Fund
Lindenwood FORWARD
Missouri Technology Corporation
Regional Growth Capital
RiverVest Venture Partners
SixThirty
SixThirty CYBER
Spirit of St. Louis Fund
Stadia Ventures
St. Louis Arch Angels
The Yield Lab
The BALSA Foundation
Operating in Similar Capacity
Significant Changes Made
No Longer Operating in St. Louis
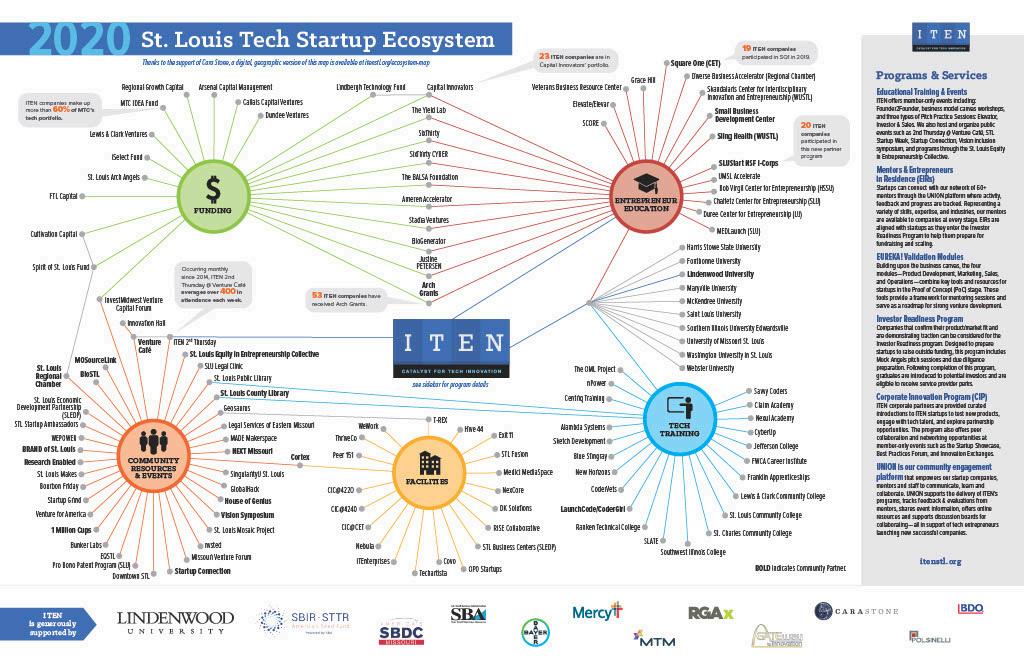
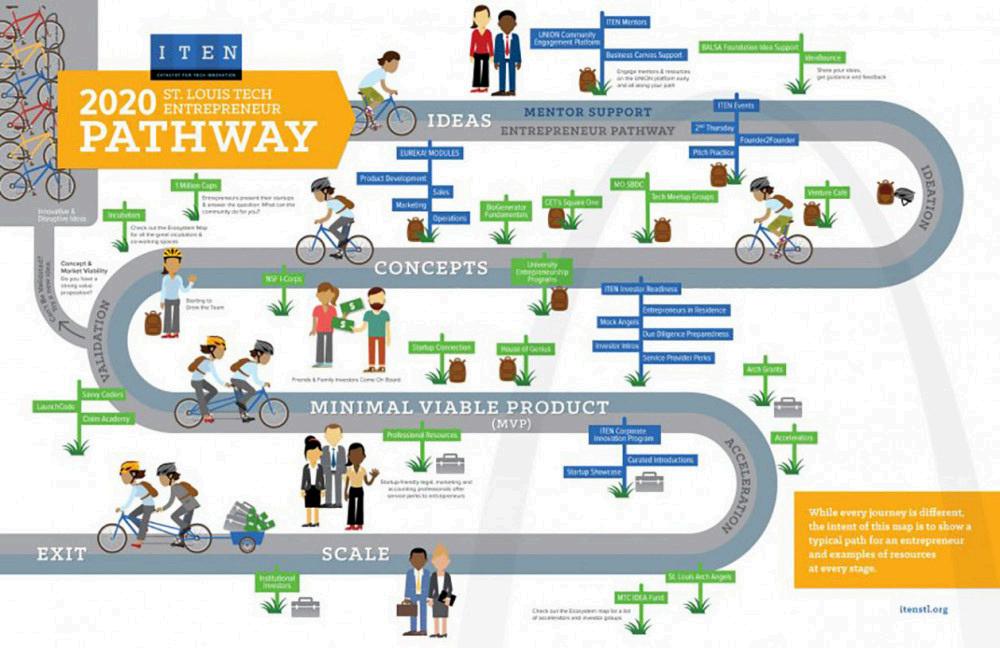
For over 14 years, ITEN served as a catalyst for technology innovation in the St. Louis region. ITEN supported tech entrepreneurs in the successful launch of new companies by delivering targeted educational programs & events, collaborative corporate & community partnerships, and a robust network of experienced mentors. Their most recent St. Louis Ecosystem Map was published in 2020.
This list reflects the changes to the ecosystem that have seen since the 2020 ITEN map was published, plus the new resources which have been added to the ecosystem between 2020-2025.
S T A R T U P S T L . C O M
1 Million Cups
BioSTL
Bourbon Friday
BRAND of St. Louis
Bunker Labs
Downtown STL
EQSTL
Geosaurus
GlobalHack
House of Genius
Innovation Hall
InvestMidwest Forum
Legal Services of Eastern Missouri
MADE Makerspace
Missouri Venture Forum
MOSourceLink
NEXT Missouri
nvested
Pro Bono Patent Program (SLU)
SingularityU St. Louis
SLU Legal Clinic
STL Equity in Entrepreneurship Collective
St. Louis Makes
St. Louis Mosaic Project
St. Louis Regional Chamber
Startup Connection / STL StartupWeek
Startup Grind
STL Startup Ambassadors
Venture Café
Vision Symposium
WEPOWER
89 Collective th
CIC at Cortex
Conflux
Covo
DK Solutions
Exit11
Guild of St. Louis (Brand of St. Louis)
Hive 44
Innovation Hall
IT Enterprises
Medici
MediaSpace
NexCore
OPO Startups
Peer 151
RISE Collaborative
St. Louis Business Centers (SLEDP)
STL Fusion
TechArtista
T‐REX
The Wedge Innovation Center
ThriveCo
WeWork
Bob Virgil Center for Entrepreneurship
Chaifetz Center for Entrepreneurship (SLU)
Center for Innovation & Entrepreneurship (Harris Stowe State University)
Diverse Business Accelerator (DBA)
Duree Center for Entrepreneurship (Lindenwood University)
Elevate/Elevar (WEPOWER)
Fontbonne University
Grace Hill
Maryville University
McKendree University
MEDLaunch
SCORE
Skandalaris Center for Interdisciplinary Innovation and Entrepreneurship (WashU)
Sling Health (WashU)
SLUStart NSF I‐Corps
Small Business Development Center
Southern Illinois University Edwardsville
Square One (Cortex)
UMSL Entrepreneurship & Innovation Center
VetBiz / Veterans Business Resource Center
Webster University
TECH TRAINING
Blue Stingray
Alambda Systems
Centriq Training
Claim Academy
CoderVets
CyberUp
Franklin Apprenticeships
FWCA Career Institute
Gateway Global
Jefferson College
Lewis & Clark
Community College
MADE Makerspace
New Horizons
Nexul Academy
nPower
Perscholas
Ranken Technical College
RUNG for Women
The OML Project
Savvy Coders
Sketch Development
SLATE
Southwest Illinois College
St. Charles Community College
St. Louis Community College
S T A R T U P S T L . C O M
Since the release of the 2020 ITEN Tech Startup Ecosystem Map, the St. Louis entrepreneurship landscape has undergone significant transformation marked by both opportunity and instability The COVID-19 pandemic ushered in an era of extreme volatility, disrupting markets, shuttering programs, and forcing institutions to rapidly pivot Just as the region began its path toward recovery, the introduction of transformative technologies like ChatGPT and concurrent freezes in federal funding reshaped the entrepreneurial terrain once again shifting priorities, funding flows, and the pace of innovation.
Today, the St Louis Metro entrepreneurship ecosystem is still rich with potential but undeniably more fragile than it was just a few years ago An analysis across five core infrastructure categories: Funding, Community Resources, Facilities, Entrepreneur Education, and Tech Training, shows both the adaptive resilience of key institutions and the stark reality of ecosystem contraction.
Funding sources, including accelerators with capital, startup grants, angel groups, VC firms, and pitch competitions, remain a cornerstone of ecosystem vitality Of the 28 funding entities identified in 2020, 18 remain active, 5 have significantly changed, and 5 have ceased operations entirely This represents a 36% change rate and a 18% net loss, highlighting both shifting models in venture funding and the increased difficulty of sustaining early-stage capital channels in a post-pandemic, AI-disrupted market.
Support programs, events, and grassroots organizations are essential for connecting founders, fostering collaboration, and providing navigational support. Yet, this is the area with the most dramatic decline over the past 5 years Of the 31 community-facing entities and programs from 2020, 6 have shifted focus or structure, and 15 have fully shut down, resulting in a 68% change rate and a 48% loss These losses point to a weakening social infrastructure for entrepreneurs with now fewer spaces to gather, share, and grow.
Innovation spaces like incubators, co-working hubs, and innovation districts have long been at the heart of St. Louis’s entrepreneurial identity. Of the 22 physical facilities listed in 2020, 9 have closed their doors, leading to a 41% reduction in accessible startup spaces Virtual work environments, rising overhead costs, changing work preferences, and funding shortfalls have changed the face of much of the region’s network of physical innovation spaces
University-based entrepreneurship centers, mentorship networks, and non-capital accelerators have also seen significant disruption From the 21 educational programs tracked in 2020, 5 have changed their structure or service model, and 4 have shut down entirely This results in a 43% overall change and a 24% program loss, indicating a need to reinvest in scalable, relevant education models that align with evolving founder needs.
Programs supporting technical skill-building, in areas like coding, AI, cybersecurity, and geospatial tech, are crucial for enabling tech-driven entrepreneurship. Of the 25 programs originally identified, 5 have changed structure or delivery, and 4 have closed, resulting in a 36% change rate and 16% loss. While this sector has proven more resilient than others, it still faces significant pressure to keep pace with rapidly evolving technologies and labor market demands
In total, these findings reveal a startup ecosystem under strain: Across all five categories, the ecosystem has seen significant change or complete closure of 58 of the 127 regional resources, which results in the loss of up to 46% of the Entrepreneurial Ecosystem of St Louis
The region is grappling with multiple layers of disruption, beginning with the COVID-19 pandemic, followed by the rapid rise of generative AI, and compounded by uncertainty in the national funding landscape While some organizations have adapted or reinvented themselves, many have shuttered, leaving critical gaps in the support infrastructure for emerging ventures Economic downturns are often when entrepreneurship matters most New ventures bring fresh solutions and reimagine outdated systems.
This is St Louis’s moment to re-engage, not to rebuild what was, but to intentionally design a stronger, leaner, and more equitable startup ecosystem that meets the needs of all business owners Doing so will require bold collaboration, targeted investment, and a shared commitment to supporting underrepresented founders, modernizing legacy systems, and bridging the structural gaps exposed in recent years.
If the region is to reclaim and expand its role as a national hub for innovation, the call to action is clear: Invest in entrepreneurship now, not just to survive the downturn, but to define the future that comes after it S T A R T U P S T L . C O M


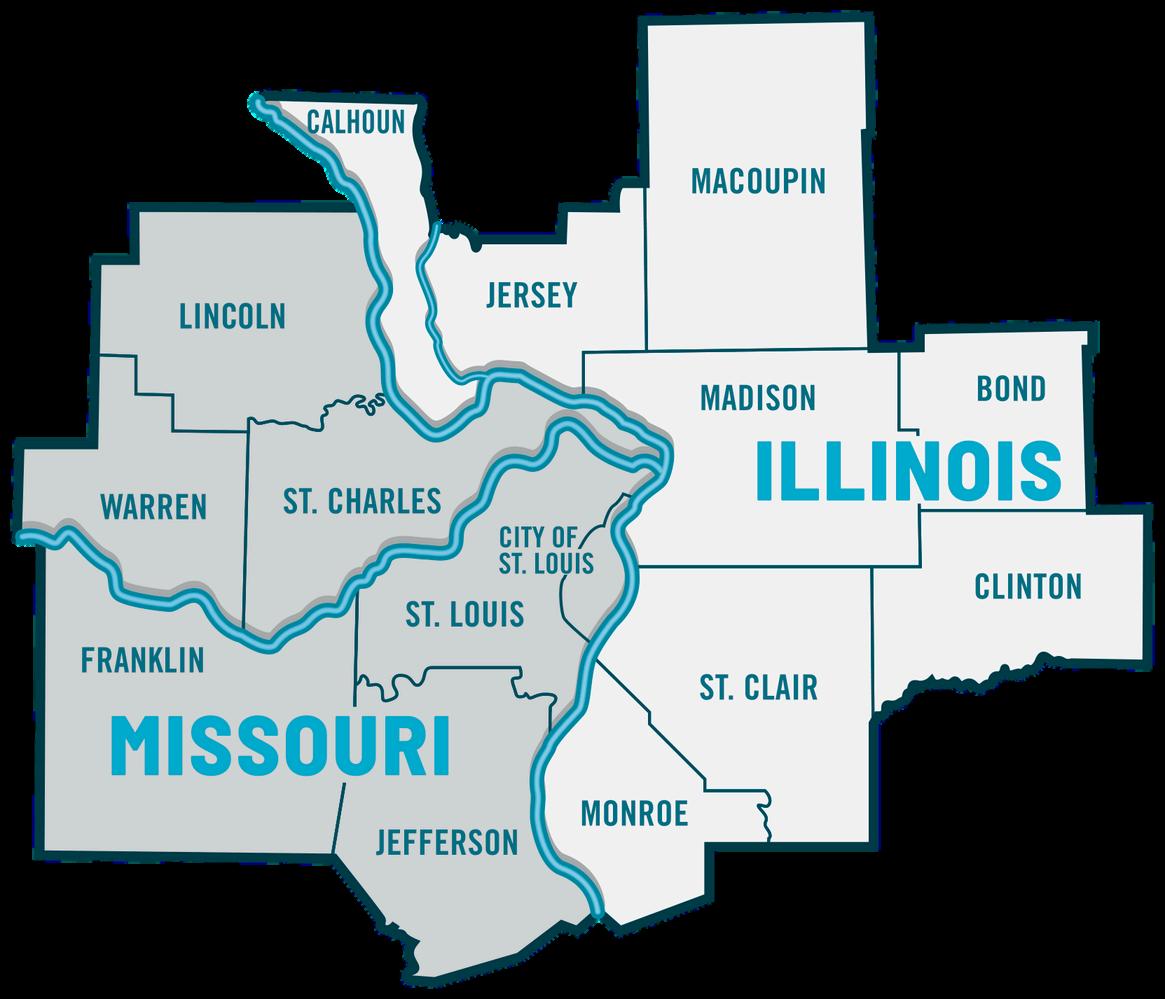
1) Location data were collected by zip codes. Zip code information was collected from wwwdatamogov/zipcodes-by-county-city/ and wwwuszipcodesorg to determine whether respondents, their places of employment, and their businesses were located in the St Louis Metropolitan Statistical Area, the City of St Louis, and rural areas For this study, rural was defined as living in a zip code in the Missouri counties of Franklin, Jefferson, Lincoln, and Warren, and the Illinois counties of Bond, Calhoun, Clinton, Jersey, Macoupin, and Monroe. (In other words, outside the City of St Louis, the Missouri counties of St Charles and St Louis, and the Illinois counties of Madison and St Clair) S T A R T U P S T L . C O M
2) Analysis of data collected from the St Louis Work and Business Survey took place in two methods: (1) analysis of frequency distributions of the data and (2) regression analysis For the frequency distributions, statistical significance of differences in the outcomes for BIPOC and nonHispanic white respondents was determined using a Chi-square test. For the regression analysis, models were estimated using linear probability models since the dependent variables estimated were categorical (dummy) variables. The linear probability model can be appropriate whenever the relationship between probability and log odds is approximately linear over the range of modeled probabilities (Von Hippel, 2017) Moreover, this technique is viable given that the independent variables are largely categorical variables (Angrist and Pischke, 2008) The number of independent variables was limited to 11, given the number of observations (116), to follow the common guideline of having at least 10 observations per regressor to reduce inaccuracies in the technique’s estimation (Agresti, 2007) Given that the dependent variable is a dummy variable, R2 and 2 should not be relied on as a necessarily accurate measure of goodness of fit. Therefore, pseudo-2 is used in this analysis as a more accurate indicator of a model’s goodness of fit. This measure is defined as the average of the percentage of ones explained correctly and the number of zeroes explained correctly by a given model (Studendmund 2017) In the linear probability model, the expected value of the dependent variable is the probably that D=1, in other words that the condition in question occurs To interpret the results, an estimated coefficient is an estimate of the change in the probability that the independent variable’s condition occurring (D=1) caused by a one-unit increase for continuous dependent variables or a categorical independent variable’s condition occurring, holding the other independent variables constant An estimated coefficient is interpreted as a percentage-point change.
3) Tech fields of degree are defined as being in the following categories: (1) economics, mathematics, statistics; (2) information technology or computer science; and (3) engineering and related technologies Tech occupations are defined as being in the following categories: (1) computer and mathematical; (2) architecture and engineering; and (3) life, physical, and social science
Agresti, Alan, An Introduction to Categorical Data Analysis, 2nd ed, John Wiley & Sons, 2007
Angrist, J. D., and J. s. Pischke, Mostly Harmless Econometrics: An Empirical Companion, 1st ed., Princeton University, 2008.
Long, JS, Regression Models for Categorical and Limited Dependent Variables, 1st ed, Sage, 1997
McIntosh, C. S., and J. J. Dorfman, “Qualitative Forecast Evaluation: A Comparison of Two Performance Measures,” American Journal of Agricultural Economics, 74(1), February 1992, pp 209-214
Studenmund, A H, Using Econometrics: A Practical Guide, 7th ed, Pearson, 2017
U.S. Census Bureau, 2022 American Business Survey, Table 2022: ECNSVY Nonemployer Statistics by Demographics Company Summary, accessed July 24, 2025 from <<link: https://datacensusgov/table/ABSNESD2022AB2200NESD01? q=AB2200*&g=310XX00US41180>>
US Census Bureau, American Community Survey 1-year estimates, 2023, retrieved July 14, 2025, from Census Reporter Profile page for St. Louis, MO-IL Metro Area, <<link: http://censusreporter.org/profiles/31000US41180-st-louis-mo-il-metro-area/>>.
Veal, M R, and K F Zimmerman, “Pseudo-R2 Measures for Some Common Limited Dependent Variables Models,” Journal of Economic Surveys, 10(3), 1996, pp 241-259
Von Hippel, Paul, “When Can You Fit a Linear Probability Model? More Often Than You Think,” Statistical Horizons Blog, March 8, 2017, accessed July 7, 2025 from <<link: http://wwwstatisticalhorizonscom/when-can-you-fit/>> S T A R T U P S T L . C O M