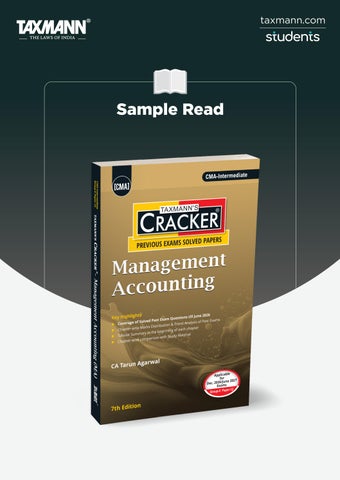
Sample Read
© All rights reserved Price : ` 455 Seventh Edition : July 2026 Published by : Taxmann Publications (P.) Ltd. Sales & Marketing : 59/32, New Rohtak Road, New Delhi-110 005 India Phone : +91-11-45562222 Website : www.taxmann.com E-mail : sales@taxmann.com Regd. Office : 21/35, West Punjabi Bagh, New Delhi-110 026 India Printed at : Tan Prints (India) Pvt. Ltd. 44 Km. Mile Stone, National Highway, Rohtak Road Village Rohad, Distt. Jhajjar (Haryana) India E-mail : sales@tanprints.com Disclaimer Every effort has been made to avoid errors or omissions in this publication. In spite of this, errors may creep in. Any mistake, error or discrepancy noted may be brought to our notice which shall be taken care of in the next edition. It is notified that neither the publisher nor the author or seller will be responsible for any damage or loss of action to any one, of any kind, in any manner, therefrom. No part of this book may be reproduced or copied in any form or by any means [graphic, electronic or mechanical, including photocopying, recording, taping, or information retrieval systems] or reproduced on any disc, tape, perforated media or other information storage device, etc., without the written permission of the publishers. Breach of this condition is liable for legal action. For binding mistake, misprints or for missing pages, etc., the publisher’s liability is limited to replacement within seven days of purchase by similar edition. All expenses in this connection are to be borne by the purchaser. All disputes are subject to Delhi jurisdiction only.
Contents PAGE
Chapter-wise Marks Distribution
I-5
Previous Exams Trend Analysis
I-7
Chapter-wise Comparison with Study Material
I-13
Chapter 1 INTRODUCTION TO MANAGEMENT ACCOUNTING
1.1
Chapter 2 2.1
Chapter 3 MARGINAL COSTING
3.1
Chapter 4 APPLICATIONS OF MARGINAL COSTING IN SHORT TERM DECISION MAKING
4.1
Chapter 5 TRANSFER PRICING
5.1
Chapter 6 STANDARD COSTING AND VARIANCE ANALYSIS
6.1
Chapter 7 FORECASTING, BUDGETING AND BUDGETARY CONTROL
7.1
Chapter 8 DIVISIONAL PERFORMANCE MEASUREMENT
8.1
Chapter 9 RESPONSIBILITY ACCOUNTING
9.1
I-15
TAXMANN®
ACTIVITY BASED COSTING
I-16
CONTENTS PAGE
Chapter 10
TAXMANN®
DECISION THEORY
10.1
2
ACTIVITY BASED COSTING
CHAPTER A Quick Review TRADITIONAL COSTING SYSTEM Introduction: The traditional cost accumulation system of absorption costing was developed at a time when most organisations produced only a narrow range of products (so that products underwent similar operations and consumed similar proportions of overheads). The overhead costs were only a very small fraction of total costs. The benefits of more accurate systems for overhead allocation would probably have been relatively small. In addition, information processing costs were high.
Drawbacks of Traditional Costing System: (a) Different products utilize different amount of resources, which is not recognized in traditional costing system. (b) Overheads now constitute the largest share of cost, often greater than 50% and are typically applied to products as percentage of the smallest cost (direct labour) leading to serious distortion of product cost. (c) By relying on volume-related measures to determine product costs, traditional costing system do poor job in reflecting supporting costs for manufacturing and distribution of products or services. More and more factory overheads, such as set-up cost, materials handling cost, and product design and research and development costs, are unrelated to the number of units produced. (d) Traditional costing system tends to overcast standard, high volume products and under-cost low-volume products, leading to incorrect pricing and product-mix decisions. (e) It creates a bias toward direct labour reduction as a cost reduction rather than overall productivity improvement.
2.1
TAXMANN®
Traditional costing systems, which assume that all products consume all resources in proportion to their production volumes, tend to allocate too great a proportion of overheads to high volume products (which cause relatively little diversity and hence use fewer support services) and too small a proportion of overheads to low volume products (which cause greater diversity and therefore use more support services).
2.2
ACTIVITY BASED COSTING
(f) It provides no information useful in either identifying productivity improvement opportunities or determining if productivity improvement efforts have yielded significant results. Indeed, often traditional costing system indicates higher cost in the presence of known productivity improvement or vice versa. ACTIVITY BASED COSTING Definition: According to CIMA Official Terminology, Activity Based Costing is ‘An approach to the costing and monitoring of activities which involves tracing resource consumption and costing final outputs. Resources are assigned to activities, and activities to cost objects based on consumption estimates. The latter utilize cost drivers to attach activity costs to outputs.’ Meaning of Activities: Activities comprise of units of work or tasks. For example, purchase of materials is an activity consisting a series of tasks like purchase requisition, advertisement inviting quotations, identification of suppliers, placement of purchase order, follow-up, etc. TAXMANN®
1. Value Added Activities (VA): u These are activities necessary for the performance of the process. u These represent work that is valued by the external or internal customer. u They improve the quality or function of a product. Hence, the customers
are usually willing to pay for the service. u VA activities result in ‘Cost’ and not in losses. u Example: Making product more versatile for certain other uses.
2. Non-Value Added Activities (NVA): u These are additional and extraneous activities, not fully necessary for the
performance of the process. u These represent work that is not valued by the external or internal customer. u NVA activities do not improve the quality or function of a product or service
but they can adversely affect costs and prices. u NVA activities create waste, result in delay of some sort, add cost to the
products or services for which the customer is not willing to pay. u Example: Moving materials and machine set up for a production run.
Steps in ABC System: 1. To identify the different activities within the organisation: Usually, the number of cost centres that a traditional overhead system uses is quite small, say up to 15. In ABC the number of activities will be much more, say 200 the number will depend on how the management sub-divides the organisation’s activities. It is possible to break the organisation down into many very small
ACTIVITY BASED COSTING
2.3
activities, but if ABC is to be an acceptable and practical system it is necessary to use larger groupings, so that, say, 40 activities may be used in practice. 2. To determine what causes the cost of each activity: The cost driver (e.g. machine hours; number of dispatch orders). 3. To calculate the total cost for each activity: The cost pool (e.g. total machining costs; total costs of dispatch department). 4. To calculate an overhead absorption rate for each cost driver. 5. Activity Cost Driver Rate = Total Cost of an Activity/Cost Driver. 6. To calculate the total overhead cost for each product manufactured. 7. To calculate the overhead cost per unit for each product. Applications of ABC: (a) When an ABC analysis is combined with a review of investment costs for various tactical or strategic options, one can determine the return on investment to be expected for each of the investment options.
(c) An ABC analysis will itemize the costs of each plant, and correctly allocate these costs to the activities conducted within them, which allows a company to determine which plants are more efficient than others. (d) An ABC analysis includes all activity costs associated with a manufactured item, which yields a comprehensive view of all costs associated with it, and which can then be more easily compared with the cost of a similar item that is purchased. (e) By using internal ABC analyses to determine the cost of various activities, a company can create a benchmark for what these costs should be in potential acquisition targets. If the targets have higher costs than the benchmark levels, then the acquiring company knows that it can strip out costs from the acquisition candidate by improving its processes, which may justify the cost of the acquisition. (f) An ABC analysis can reveal the cost of each activity within an organisation. The system is really designed to trace the costs of only the most significant activities, but its design can be altered to itemize the costs of many more activities. This information can then be used to determine which activities are so expensive that they will be the main focus of management attention, or which can be profitably combined with other activities through process centering. This is a primary cost-reduction activity. (g) An ABC analysis reveals all of the costs associated with a product, and so is useful for determining the minimum price that should be charged. However, the actual price charged may be much higher, since this may be driven by the ability of the market to absorb a higher price, rather than the underlying cost of a product.
TAXMANN®
(b) An ABC system can accumulate all of the costs associated with a particular distribution method, which allows managers to compare this cost to the profit margins earned on sales of products that are sold through it.
2.4
ACTIVITY BASED COSTING
(h) An ABC analysis can be combined with product prices to yield a list of margins for each product sold. When sorted by market, product line, or customer, it is easy to see which products have low or negative returns, or which yield such low margin volume that they are not worth keeping. (i) An ABC analysis reveals the cost of anything that a management team needs to know about—activities, products, or customers—which can then be sorted to see where the highest-cost items are located. When combined with a value analysis, one can determine what costs return the lowest values, and structure a cost-reduction effort accordingly. (j) An ABC analysis can itemize the costs that are specific to each customer, such as special customer service or packaging issues, as well as increased levels of warranty claims or product returns. When added to the margins on products sold to customers, this reveals which customers are the most profitable after all costs are considered. Merits of ABC:
TAXMANN®
(a) ABC recognizes the increased complexity of modern businesses with its multiple cost drivers, many of which are transaction based rather than volume based. (b) ABC is concerned with all overhead costs, including such ‘non-factory floor’ costs as quality control and customer service, and so it takes cost accounting beyond its ‘traditional’ factory floor boundaries. (c) ABC gives a meaningful analysis of costs which should provide a suitable basis for decisions about pricing, product mix, design and production. (d) ABC helps with cost reduction because it provides an insight into causal activities and allows organisations to consider the possibility of outsourcing particular activities, or even of moving to different areas in the industry value chain. (e) ABC can be used in conjunction with Customer Profitability Analysis (CPA) to determine more accurately the profit earned by serving particular customers. (f) ABC can be used by service and retail organisations. Many service and retail businesses have characteristics very similar to those required for the successful application of ABC in modern manufacturing industry. Demerits of ABC: (a) The cost of obtaining and interpreting the new information may be considerable. ABC should not be introduced unless it can provide additional information for management to use in planning or control decisions. (b) Some arbitrary cost apportionment may still be required at the cost pooling stage for items like rent, rates and building depreciation. If an ABC system has many cost pools, the amount of apportionment needed may be greater than ever.
ACTIVITY BASED COSTING
2.5
(c) Many overheads relate neither to volume nor to complexity. The ability of a single cost driver to fully explain the cost behaviour of all items in its associated pool is questionable. (d) There will have to be a trade-off between accuracy, the number of cost drivers and complexity. (e) ABC tends to burden low-volume (new) products with a punitive level of overhead costs and hence threatens opportunities for successful innovation if it is used without due care. (f) Some people have questioned the fundamental assumption that activities cause cost; they suggest that decisions cause cost or the passage of time causes cost or that there may be no clear cause of cost. Use of ABC in Decision Making: (a) For decisions like relocation or opening of a new distribution center, reduction in freight or other logistics costs can offset the expense of a new facility, staff or equipment. ABC system can identify the specific cost elements being targeted, providing a much clearer picture according to which management can decide and act accordingly.
(c) Using traditional absorption system, overheads may get distributed equally across all product lines. ABC system traces the costs back to the activity and the consumption of resources by each product. This helps in analysing the costs and profits of existing and new products in a more realistic manner. (d) ABC can augment decision support for human resources. ABC can present a number of options, including outsourcing, productivity improvements through automation and determination of employee/revenue ratios. AREAS IN WHICH ACTIVITY BASED INFORMATION IS USED FOR DECISION MAKING Product line profitability Capital Investment decisions Transfer Pricing Pricing of products Market Segmentation and Distribution Channels Make-or-Buy decisions and outsourcing Plant shut-down decisions Evaluation of off-shore production, etc. COST POOLS Cost pools are commonly used for the allocation of factory overhead to units of production, as required by several accounting frameworks. They are also used
TAXMANN®
(b) ABC is a complement to Total Quality Management (TQM) and it provides quantitative data that can track the financial impact of improvements implemented as part of the TQM initiative.
2.6
ACTIVITY BASED COSTING
in activity-based costing to allocate costs to activities. A business that wants to allocate costs at a highly-refined level may choose to do so using a number of cost pools. The various Cost Pools may be as under in a manufacturing company: a. Purchasing Department b. Receiving Department c. Material Handling d. Set-up of Machines e. Inspection and Quality Control f. Research and Developments g. Customer Service h. Production Control COST DRIVER It is a factor that causes a change in the cost of an activity. Categories of cost driver: TAXMANN®
1. Resource Cost Driver: It is a measure of the quantity of resources consumed by an activity. It is used to assign the cost of a resource to an activity or cost pool. For example, number of purchase orders placed will influence the cost of materials to be purchased. 2. Activity Cost Driver: It is a measure of the frequency and intensity of demand, placed on activities by cost objects. It is used to assign activity costs to cost objects. Activity cost drivers can be transaction drivers (e.g. No. of purchase orders processed, no. of customer orders processed, etc.) as well as duration drivers (it represent amount of time required to perform an activity e.g. Setup hours, inspection hours, etc.) 3. Volume Based Cost Drivers: They assume that a product’s consumption of overhead is directly related to units produced i.e. in case of Machine hours, if volume is increased by 10%, machine hours will increase by 10% hence energy cost will increase by 10%. 4. Non-volume Based Cost Drivers: They are in contrast of volume based cost drivers. Non-volume based activities are not performed each time a unit of the product or service is produced e.g. number of production runs for production scheduling & the number of purchase orders for the purchasing activity. Some Cost Drivers that are used in the context of Activity Based Costing: Number of requisitions rose Number of machine set-up
2.7
ACTIVITY BASED COSTING
Number of machine hours Number of production runs Number of processed orders Number of purchase orders Number of orders completed Number of labour hours Number of orders packed and delivered Number of inspections Number of customers visit, etc. COST OBJECT It is an item for which cost ascertainment is required. For example, a product, a service, a job, a work order No. or a customer, etc.
Past Examination Questions
Q.1 A company manufactures two products using common handling facility. The total budgeted material handling cost is ` 60,000. Other details are: Particulars
Product A
Product B
Number of units produced
30
30
Material moves per product line
5
15
Under Activity Based Costing System, material handling cost to be allocated to Product A per unit is (a) ` 1,000 (b) ` 1,500 (c) ` 500 (d) ` 2,500.
[Dec. 2014, 2 Marks]
Ans. (c) ` 500 Working Note: Total move in material handling = 5 + 15 = 20 Percentage move for Product A = 5/20 = 25% Material handling cost to be allocated to Product A = ` 60,000 × 25% = ` 15,000 Therefore, per unit = ` 15,000 ÷ 30 units = ` 500. Q.2 RTM Ltd., using Activity Based Costing (ABC), manufactures two types of products P and Q respectively. During a period, the company incurred ` 50,000 as inspection cost and it worked for 10 and 15 production runs respectively for producing products P and Q. The inspection cost for product P under ABC system was:
TAXMANN®
OBJECTIVE QUESTIONS
2.8
ACTIVITY BASED COSTING
(a) ` 20,000 (b) ` 30,000 (c) ` 40,000 (d) None of the above
[July 2023, 1 Mark]
Ans. (a) ` 20,000 Working Note: Inspection Cost per run = 50,000/ 25 = ` 2,000. Inspection cost for P = 2,000 × 10 = ` 20,000. Q.3 The term, _______ is used to describe a location to which overhead costs are initially assigned. (a) Cost driver (b) Cost pool (c) Activity (d) Cost objects
[July 2023, 1 Mark]
TAXMANN®
Ans. (b) Cost pool Q.4 In Activity Based Costing, the allocation basis used for applying costs to services or products is called ________. [July 2023, 1 Mark] Ans. Cost Drivers Q.5 M/s. SB Limited produces 10,000 units of Product S and 15,000 units of Product-R at a total cost of ` 2,00,000. Total Cost of the company is apportioned in two types of activities, Machine hour related and Labour hour related in the ratio of 3:2. The following information is also provided: Particulars
Product - S
Product - R
Machine Hour
3,000
2,000
Labour Hour
5,000
3,000
The Cost Per Unit of Product – S and Product – R are: (a) Product-S ` 15.80 and Product-R ` 6.40 (b) Product-S ` 13.70 and Product-R ` 7.15 (c) Product-S ` 12.20 and Product-R ` 5.20 (d) Product-S ` 11.80 and Product-R ` 5.30 Ans. (c) Product-S ` 12.20 and Product-R ` 5.20 Working Note: Machine Related Costs = 2,00,000 × 3/5 = ` 1,20,000 Labour Related Costs = 2,00,000 × 2/5 = ` 80,000
[Dec. 2024, 2 Marks]
2.9
ACTIVITY BASED COSTING
Cost driver Rates: Machine related Costs = 1,20,000/5,000 = ` 24/Machine Hour Labour Related Costs = 80,000/8,000 = ` 10/ Labour Hour Calculation of Costs of Products: Particulars
Product - S
Product - R
Machine Related Costs
3,000 × 24 = 72,000
2,000 × 24 = 48,000
Labour Related Costs
5,000 × 10 = 50,000
3,000 × 10 = 30,000
1,22,000
78,000
Units
10,000
15,000
Cost Per Unit
12.20
5.20
Total Costs
Q.6 Which of the following is the main cost driver of customer order processing activity? (a) Flow of the product from the assembly line (b) Order value (c) Number of product suppliers [Dec. 2024, 2 Marks]
Ans. (b) Order value Q.7 Process of cost allocation under Activity Based Costing is: (a) Cost of activities → Activities → Cost driver → Cost allocated to cost objects. (b) Cost driver → Cost of activities → Cost allocated to cost objects → Activities. (c) Activities → Cost of activities → Cost driver → Cost allocated to cost objects. (d) Activities → Cost driver → Cost allocated to cost objects → Cost of activities. [June 2025, 2 Marks] Ans. (c) Activities → Cost of activities → Cost driver → Cost allocated to cost objects. Q.8 Production details of M/s Bani Food Care are as under : Product Production (units) Machine Hours (Per production run)
A
B
C
D
1,000
1,100
1,200
1,500
50
40
30
40
Units are produced in production run of 10 units. If activity cost pool during the period is ` 2,25,000 and overheads are absorbed based on machine hour rate, the rate per cost driver is:
TAXMANN®
(d) Number of machine charges
2.10
ACTIVITY BASED COSTING
(a) ` 10.58 (b) ` 11.84 (c) ` 7.20 (d) ` 6.55
[Dec. 2025, 2 Marks]
Ans. (b) ` 11.84 Working Note: Product
Units
Production runs
Hours per run
Total Machine Hours
A
1,000
1,000/10 = 100
50
100 × 50 = 5,000
B
1,100
1,100/10 = 110
40
110 × 40 = 4,400
C
1,200
1,200/10 = 120
30
120 × 30 = 3,600
D
1,500
1,500/10 = 150
40
150 × 40 = 6,000
Total
19,000
Cost Driver rate = 2,25,000/19,000 = ` 11.84
TAXMANN®
Q.9 In Activity Based Costing, an item for which cost measurement is required is called: (a) Cost Driver (b) Cost Object (c) Cost Pool (d) Cost Matrix
[Dec. 2025, 2 Marks]
Ans. (b) Cost Object Q.10 LPG Limited uses Activity Based Costing (ABC) system, produces three products i.e. L, P & G. Material handling & Inspection related cost for the period is ` 1,50,000 for 500 material moves & ` 90,000 for 300 inspection calls. Product P uses 40 material moves and 15 inspection calls during the period. Total overhead cost of Product-P under ABC system is: (a) ` 15,000 (b) ` 17,000 (c) ` 14,500 (d) ` 16,500
[June 2026, 2 Marks]
Ans. (d) ` 16,500 Working Note: Material Handling Cost per Move = 1,50,000/500 = ` 300 Inspection cost per call = 90,000/300 = ` 300 Overheads allocated to product P = (40 × 300) + (300 × 15) = ` 16,500
MANAGEMENT ACCOUNTING (MA) | CRACKER AUTHOR : PUBLISHER : DATE OF PUBLICATION : EDITION : ISBN NO : NO. OF PAGES : BINDING TYPE :
Tarun Agarwal Taxmann July 2026 7th Edition 9789375619918 404 Paperback
Rs. 455 DESCRIPTION Management Accounting – CRACKER is an exam-oriented question bank from Taxmann's acclaimed CRACKER series, built for CMA Intermediate (Group II – Paper 12) under the 2022 Syllabus of the Institute of Cost Accountants of India (ICMAI). More a scoring tool than a textbook, it condenses the entire Paper 12 syllabus into ten tightly organised chapters across 400+ pages—each opening with a concise theory digest ('A Quick Review') before an extensive bank of past-examination questions solved in full, with step-by-step workings. Its archive runs deep: questions span more than a decade—from 2013 through the June 2026 attempt—covering both objective/MCQ-type and descriptive/practical problems, and are fully refreshed for the December 2026 and June 2027 examination cycles. The Present Publication is the 7th Edition | July 2026, authored by CA. Tarun Agarwal, with the following noteworthy features: • [Solved Past-Exam Questions up to June 2026] Previous questions worked out completely—final answer, detailed Working Notes and tabular computations • [A Deep, Decade-spanning Archive] Questions drawn from many attempts (2013 through June 2026), far more practice than a 'last-few-papers' compilation • [Chapter-wise Marks Distribution] An at-a-glance grid of marks carried by each chapter, with a 7-attempt average, to rank topics by importance • [Previous Exams Trend Analysis] A question-by-question map of past papers—question number, compulsory status, chapter, marks and Theory/ Practical tag • [Tabular 'A Quick Review' in Every Chapter] A theory snapshot—definitions, key concepts, features, limitations and comparison tables—for rapid pre-exam recall • [Chapter-wise Comparison with the ICMAI (CMA) Study Material] Each chapter mapped to its CMA Study Material Module (1–10) for effortless cross-referencing • [Objective & Descriptive Coverage] Every chapter opens with Objective Questions (MCQs, fill-in-the-blanks, one-liners) before full theoretical and numerical problems • [Authoritative, Terminology-grounded Theory] 'Quick Review' recaps use CIMA Official Terminology for precise, exam-ready definitions • [Concise, Revision-first Presentation] Trimmed to what actually scores—ideal for study under time pressure
Buy Now