Sample Read
© NATIONAL INSTITUTE OF SECURITIES MARKETS, MUMBAI, 2026 PRINTING AND PUBLISHING RIGHTS WITH THE PUBLISHER All rights reserved. No part of this publication may be reproduced, stored in or introduced into a retrieval system, or transmitted in any form or by any means (electronic, mechanical, photocopying, recording or otherwise), without the prior written permission of National Institute of Securities Markets. Any person who does any unauthorised act in relation to this publication may be liable to criminal prosecution and civil claims for damages. While every care has been taken in compiling the information contained in this publication, National Institute of Securities Markets accepts no responsibility for any errors or omissions. Workbook Version : September 2025 Price : ` 445 Published by : Taxmann Publications (P.) Ltd. Sales & Marketing : 59/32, New Rohtak Road, New Delhi-110 005 India Phone : +91-11-45562222 Website : www.taxmann.com, E-mail : sales@taxmann.com Mumbai 35, Bodke Building, Ground Floor, M.G. Road, Opp. Railway Station, Mulund (West), Mumbai-400080 Ph : +91-22-25934806, 25934807, 25934809; Mobile : 09322247686, 9619668669, 7045453844/45/48/51 E-mail : sales.mumbai@taxmann.com; nileshbhanushali@taxmann.com Regd. Office : 21/35, West Punjabi Bagh, New Delhi-110 026 India Printed at : Tan Prints (India) Pvt. Ltd. 44 Km. Mile Stone, National Highway, Rohtak Road, Village Rohad, Distt. Jhajjar (Haryana) India E-mail : sales@tanprints.com
DISCLAIMER The contents of this publication do not necessarily constitute or imply its endorsement, recommendation, or favoring by the National Institute of Securities Markets (NISM) or the Securities and Exchange Board of India (SEBI). This publication is meant for general reading and educational purpose only. The statements/explanations/concepts are of general nature and may not have taken into account the particular objective/move/aim/need/circumstances of individual user/reader/organization/institute. Thus NISM and SEBI do not assume any responsibility for any wrong move or action taken based on the information available in this publication. Therefore before acting on or following the steps suggested on any theme or before following any recommendation given in this publication user/reader should consider/seek professional advice. The publication contains information, statements, opinions, statistics and materials that have been obtained from sources believed to be reliable and the publishers of this title have made best efforts to avoid any errors. However, publishers of this material offer no guarantees and warranties of any kind to the readers/users of the information contained in this publication. Since the work and research is still going on in all these knowledge streams, NISM and SEBI do not warrant the totality and absolute accuracy, adequacy or completeness of this information and material and expressly disclaim any liability for errors or omissions in this information and material herein. NISM and SEBI do not accept any legal liability what-so-ever based on any information contained herein. While the NISM Certification examination will be largely based on material in this workbook, NISM does not guarantee that all questions in the examination will be from material covered herein.
CONTENTS PAGE
Foreword Acknowledgement About NISM Certifications About the Certification Examination for Portfolio Management Service Distributors Syllabus Outline and Weightages
I-3 I-5 I-7 I-9 I-17
CHAPTER 1 INVESTMENTS 1.1 1.2 1.3 1.4 1.5 1.6
What is Investment? Investment versus Speculation Investment Objectives Estimating the required rate of return Types of Investments Channels for making investments
1 3 3 5 10 16
CHAPTER 2 INTRODUCTION TO SECURITIES MARKETS 2.1 2.2 2.3
Securities Market Primary and Secondary Market Market Participants and their Activities
21 23 29 I-11
CONTENTS
PAGE
CHAPTER 3 INVESTING IN STOCKS 3.1 3.2 3.3 3.4 3.5 3.6 3.7
Equity as an Investment Diversification of Risk through Equity Instruments Risks of Equity Investments Overview of Equity Market Equity Research and Stock Selection Technical Analysis Understanding Corporate Governance
37 38 39 41 43 64 68
CHAPTER 4 INVESTING IN FIXED INCOME SECURITIES 4.1 4.2 4.3 4.4 4.5
Overview of Fixed Income Securities Bond Characteristics Determinants of Bond Safety Valuation of Bonds Measuring Price Volatility of Bonds
71 72 76 79 87
CHAPTER 5 DERIVATIVES 5.1 5.2 5.3 5.4 5.5 5.6 5.7 I-12
Definition of Derivatives Types of Derivative Products Structure of Derivative Markets Purpose of Derivatives Commodity and Currency Futures and Options Underlying Concepts in Derivatives Investment in Derivatives in PMS
95 96 101 102 103 106 108
CONTENTS
PAGE
CHAPTER 6 MUTUAL FUND 6.1 6.2 6.3 6.4 6.5 6.6 6.7 6.8 6.9 6.10 6.11
Concept and Role of Mutual Fund Benefits of Investing through Mutual Funds Legal Structure of Mutual Fund in India Working of Mutual Funds Types of Mutual Fund Products Processes of Investing in Mutual Funds Legal and Regulatory Framework – Key SEBI Regulation Fact Sheet – Scheme Related Information Net Asset Value, Total Expense Ratio, Pricing of Units Mutual Fund Scheme Performance Key Performance Measures
111 112 114 115 118 120 122 123 124 125 125
CHAPTER 7 ROLE OF PORTFOLIO MANAGERS 7.1 7.2 7.3 7.4 7.5 7.6
Overview of Portfolio Managers in India Types of Portfolio Management Services Organizational Structure of PMS in India Registration Requirements of a Portfolio Manager General Responsibilities of a Portfolio Manager Administration of Investor’s Portfolio
129 130 131 132 138 139
CHAPTER 8 OPERATIONAL ASPECTS OF PORTFOLIO MANAGERS 8.1 8.2
Entities which can Invest in PMS Disclosures to the Prospective Clients
147 148 I-13
CONTENTS
PAGE
8.3 8.4 8.5 8.6 8.7 8.8
Process of On-boarding of Clients Direct On-boarding in PMS Liability in Case of Default Redressal of Investors Grievances Disclosures to the Regulator Costs, Expenses and Fees of Investing in PMS
156 162 163 163 165 166
CHAPTER 9 PORTFOLIO MANAGEMENT PROCESS 9.1 9.2 9.3 9.4 9.5 9.6
Importance of Asset Allocation Decision Understanding Correlation Across Asset Classes and Securities Steps in Portfolio Management Process Asset Allocation Decision Strategic versus Tactical Asset Allocation Rebalancing of Portfolio
173 174 175 187 188 189
CHAPTER 10 PERFORMANCE MEASUREMENT AND EVALUATION OF PORTFOLIO MANAGERS 10.1 10.2 10.3 10.4 10.5 10.6 10.7 10.8
I-14
Parameters to Define Performance – Risk and Return Rate of Return Measures Risk Measures Risk-adjusted Return Performance Evaluation: Benchmarking and Peer Group Analysis Performance Attribution Analysis Performance Reporting to the Investor Valuation of Securities by Portfolio Managers
193 193 209 212 216 218 220 221
CONTENTS
PAGE
10.9 10.10 10.11
Due Diligence and Portfolio Manager Selection Global Investment Performance Standards (GIPS®) GIPS Advertisement Guidelines
222 222 223
CHAPTER 11 TAXATION 11.1 11.2 11.3
Taxation of Investors Taxation of Various Streams of Income Section 9A of ITA
227 235 240
CHAPTER 12 REGULATORY, GOVERNANCE AND ETHICAL ASPECTS OF PORTFOLIO MANAGERS 12.1 12.2 12.3
Prevention of Money Laundering Act, 2002 SEBI (Prohibition of Insider Trading) Regulations, 2015 SEBI (Prohibition of Fraudulent and Unfair Trade Practices Relating to Securities Market) Regulations, 2003 12.4 SEBI (Portfolio Managers) Regulations, 2020 12.5 Best Practices for Portfolio Managers 12.6 Investor Charter for Portfolio Management Services Sample Case Study Questions
245 248 252 253 264 266 269
I-15
CHAPTER 3 INVESTING IN STOCKS LEARNING OBJECTIVES: After studying this chapter, you should understand about: Ø Equity as an investment opportunity Ø Types of risk involved in equity investment Ø Management of risk through diversification Ø The process of equity research and stock selection Ø Fundamental and Technical analysis of equity investment
3.1 Equity as an investment Securities markets enable investors to invest and disinvest their surplus funds in various securities. These securities are pre-defined for their features, issued under regulatory supervision, and in most cases have ready liquidity. Liquidity refers to the marketability (meaning existence of sellers when one needs to buy; and buyers when one needs to sell). There are two broad types of securities that are issued by seekers of capital from investors: Equity and Debt. Equity securities are issued by companies providing ownership to the investor in their company, and Debt securities are issued by companies providing the rights of a lender to the investor. The features of both these securities differ due to the inherent difference in the claim of the investors on the company. Equity investors also known as shareholders have residual claim9 in the business. Because they are the owners of the company and not lenders, the company which 9
Claim on the company’s net assets, i.e. the value of assets after all liabilities have been paid.
37
INVESTING IN STOCKS
issues equity securities is not contractually obligated to repay the amount it receives from the shareholders. It is also not contractually obligated to make periodic payments to shareholders for the use of their funds, like interest payments in the case of lenders. Equity investors get voting rights. When equity investor own a sizeable amount of shares in a company, they get an opportunity to participate in the management of the business. Investors who purchase equity shares look for capital appreciation and dividend income. There is no assurance of both by the company to the equity investor. While dividend payment depends on the profitability of the company, capital appreciation depends on the share market conditions and peculiarities. Because all residual benefits of deploying capital in a business go to the equity investor, the return to equity investor is likely to be higher than that of the debt investors. Choosing between equity and debt is a trade-off. Investors desiring lower risk, and willing to accept a lower stable return choose debt. However, if they seek a higher return, they may not be able to earn it without taking on the additional risk of the equity investment. Most investors tend to allocate their capital between these two choices, depending on their expected return, their investing time period, their risk appetite and their needs.
3.2 Diversification of risk through equity instruments Equity is inherently riskier compared to bonds and many other asset classes. However, there are ways to mitigate the risks in stocks. The most meaningful way to risk reduction is through diversification – both on cross sectional (i.e. across business sectors and industries) as well as on time series basis (i.e. across various time periods). Empirical research has demonstrated that a significant portion of risk can be reduced through diversification. Conceptually, it is achieved due to the relatively less correlated behaviour of various business sectors which underlie each equity investment. This is what the old adage ‘Don’t put all your eggs in one basket’ means. Cross sectional risk diversification is reducing risk by holding equities in many different kinds of businesses at a point in time and also across various geographies of the world. Reaping the benefits of time diversification requires investing in equities for a long period of time. The belief is that bad times will get cancelled out
38
Diversification of equity investment achieves risk reduction. Conceptually, it is achieve to the relatively less correlated behaviour of various business sectors which underlie equity investment. This is what the old adage ‘Don’t put all your eggs in one basket’ m Since equity investments enable an investor to own shares of many businesses a INVESTING STOCKSrisk by holding shares in different businesse sectors and regions, investors canIN mitigate
by good times. This is why “time in the market” is suggested for equity investment Underlying themarket”. word ‘diversification’ is the concept of business cycles and counter‐c as against “timing the
businesses. There is also the understanding of lagging and leading behaviour of invest
Underlying the word ‘diversification’ is the concept of business cycles and countercountries’ performance. cyclical returns, businesses, and theeconomic phenomenon of lag and lead between the behaviour of investments returns and countries’ economic performance.
In Exhibit 3.1, a business cycle is shown as a dark line. Some businesses may be at
In Exhibit 3.1, a business cycle is shown as a dark line. Some businesses may be at when others are at their trough, as shown by the broken line. These products or busin peak when the business cycle is in its trough, as shown by the broken line. These are called ‘counter‐cyclical’ or defensive businesses. do better in a rec products or businesses are called ‘counter-cyclical’ or defensiveBusinesses businesses.that Businesses called businesses. Some products, sectors countries come ou that do are better in a ‘recession‐proof’ recession are called ‘recession-proof ’ businesses. Someorproducts, recession faster than other products, countries may asgo into rec sectors or countries come outothers; of a recession faster thansectors othersor (these are called than other others.products, sectors or countries may go into recession later leading later sectors); than others (these are called lagging sectors). EXHIBIT 3.1: COUNTER-CYCLICAL PRODUCTS Exhibit 3.1 Counter‐cyclical products Counter
Cyclical Products
3.3 Risks of equity investments Empirical research has demonstrated that a significant portion of risk can be re diversification. Crossthan sectional is reducing by holding eq Equitiesthrough are often regarded as riskier otherrisk assetdiversification classes. The main types ofrisk risks in in many differentofkinds businesses are at discussed a point inbelow: time. Reaping the benefits of discussed the context equityofinvestments diversification requires investing in equities for a long period of time. The belief is tha times will get cancelled out by good times. This is why “time in the market” is suggest 3.3-1 Market risk equity investment as against “timing the market”. Market risks arise due to the fluctuations in the prices of equity shares due to various market related dynamics. These factors affect all the listed, market traded assets, irrespective of their business sector. The degree of impact may be different. Beta is a proxy measure for market risk. Market risk cannot be diversified away, though it 43 can be hedged.
39
INVESTING IN STOCKS
3.3-2 Sector specific risk Risks, which are specific to a particular sector may not be relevant to other sectors. Sector specific risks are non-systematic in nature and hence can be diversified. Benefit of diversification will come by way of adding securities from other sectors in the portfolio, which have low or negative correlation with the companies from the given sector. 3.3-3 Company specific risk Company-specific risk, also known as unsystematic risk or idiosyncratic risk, refers to the risk that affects an individual company rather than the broader market or economy. This type of risk arises due to factors unique to a specific company and can impact its stock price, financial performance, and overall stability. It can be due to management quality, financial health, compliances, operations or competitive landscape. However, such risk can be mitigated by way of diversification and is considered avoidable compared to market-wide risks (systematic risks) like interest rates, inflation, or economic downturns, which affect all companies. 3.3-4 Liquidity risk Liquidity risk is defined in Chapter 1. It is measured by impact cost. The impact cost is the percentage price movement caused by a particular order size (let’s say an order size of Rs.1 lakh) from the average of the best bid and offer price in the order book snapshot. The impact cost is calculated for both—the buy and the sell side. Less liquid stocks are more thinly traded, and a single large trade can move their prices considerably. Such stocks have high impact costs. A lower market impact implies the stock is more liquid. 3.3-5 Currency Risk Prima facie, it appears that currency risk is not directly related to prices of equity. However, once the financial markets are open to the international investors, currency risk sets in. Currency risk arises due to uncontrollable, unpredictable and volatile exchange rates of various pairs of currencies. When a significant proportion of players in a financial market belong to the international institutional investors groups, then 40
INVESTING IN STOCKS
that financial market is bound to be related to exchange rate movements. Many times we hear that stock market reacts to FPIs’ buy and sell pressure, and FPIs move in and move out of a country with changes in their home country interest rates, or due to sudden unfavourable exchange rate movements, like deep depreciations in their host countries or due to any other socio-politico-economic, industry or market shocks. Apart from the above most prominent risks, all other macro-economic factors like inflation, fuel prices, interest rates, economic growth, economic slowdown, do influence stock markets.
3.4 Overview of Equity Market Equity securities represent ownership claims on a company’s net assets. A thorough understanding of equity market is required to make optimal allocation to this asset class. The equity market provides various choices to investors in terms of risk-returnliquidity profile. There are opportunities in listed as well as unlisted equity space available.10 Investments in listed companies is relatively more liquid than investment in unlisted companies. Listed companies have to abide by the listing norms, making this investment space more regulated with better disclosures. In addition to equity shares, companies may also issue preference shares. Preference Shares rank above equity shares with respect to the payment of dividends and distribution of company’s net assets in case of liquidation. However, preference shares do not generally have voting rights like equity shares, unless stated otherwise. Preference shares share some characteristics with debt securities like fixed dividend payment. Similar to equity shares, preference shares can be perpetual. Dividends on preference shares can be cumulative, non-cumulative, participating, non-participating or some combination thereof (i.e. cumulative participating, cumulative nonparticipating, non-cumulative participating, non-cumulative non-participating). In case preference stock is cumulative, the unpaid dividends would accumulate to be paid in full at a later time, whereas in non-cumulative stocks the unpaid or omitted dividend does not get paid.
Listing is a process through which the companies fulfilling the eligibility criteria prescribed by the Exchange(s) are admitted for trading on the Exchange. 10
41
INVESTING IN STOCKS
A non-participating preference share is one in which a dividend is paid, usually at a fixed rate, and not determined by a company’s earnings. Participating preference share gives the holder the right to receive specified dividends plus an additional dividend based on some pre-specified conditions. Participating preference shares can also have liquidation preferences upon a liquidation event. Preference shares can also be convertible. Convertible preference shares entitle shareholders to convert their preference shares into a specified number of equity shares. Since preference shares carry some characteristics of equity share and at the same time some of the debt securities, they are referred to as hybrid or blended securities. The chief characteristic of equity shares is shareholders’ participation in the governance of the company through voting rights. Generally companies issue only one kind of common shares, on the principle of ‘one share, one vote’. Some companies, however issue share with differential voting rights (DVRs). Shares with DVRs can either have superior voting rights (i.e. multiple votes on one share) or inferior voting rights (i.e. a fraction of the voting right on one equity share) or differential rights as to dividend. Shares with DVRs are very popular in the western world for many decades. They have not really gained momentum in India. Though way back in 2000, the Companies Act, 1956, was amended to permit issuance of shares with DVRs, not many companies have issued shares with DVRs. Tata Motors was one of the first companies in India to issue DVRs in 2008. These DVRs carried 1/10voting rights and 5% higher dividend than ordinary shares. Since then, Pantaloon Retails (currently Future Enterprises Ltd.), Gujarat NRE Coke Ltd., Jain Irrigation Systems Ltd. have issued DVRs. Companies issuing equity shares can be classified on the basis of size—measured by way of their market capitalization as ultra large cap, large cap, mid-cap, small cap, micro-cap etc., each group represents a particular risk-return-liquidity profile. For example large cap companies as a group have lower variability in return than small cap companies. Technological advancements and integration of global markets have expanded the investment opportunity set for the investors. They can invest in global equities within the restrictions placed by the RBI.
42
INVESTING IN STOCKS
3.5 Equity research and stock selection As there are thousands of opportunities available to investors in equity market, equity research and stock selection process plays a very important role in identifying stocks which suits the risk-return-liquidity requirements of the investors. Equity research involves thorough analysis and research of the companies and its environment. Equity research primarily means analysing the company’s financials and non-financial information, study the dynamics of the sector the company belongs to, competitors of the company, economic conditions etc.. The idea behind equity research is to come up with intrinsic value of the stock to compare with market price and then decide whether to buy or hold or sell the stock. There are many frameworks/methodologies available for stock selection. Analysts use fundamental analysis -top-down approach or bottom-up approach - quantitative screens, technical indicators etc., to select stocks. 3.5-1 Fundamental Analysis Fundamental analysis is the process of determining intrinsic value for the stock. These values depend on underlying economic factors such as future earnings or cash flows, interest rates, and risk variables. By examining these factors, intrinsic value of the stock is determined. Investor should buy the stock if its market price is below intrinsic value and do not buy, or sell, if the market price is above the intrinsic value, after taking into consideration the transaction cost. In other words, the difference between intrinsic value and market price should be enough to cover the transaction costs. Investors who are engaged in fundamental analysis believe that, intrinsic value may differ from the market price but eventually market price will merge with the intrinsic value. An investor or portfolio manager who can do a superior job of estimating intrinsic value will generate above-average returns by acquiring undervalued securities. Fundamental analysis involves economy analysis, industry analysis, company analysis. Top Down approach versus Bottom up Approach Analysts follow two broad approaches to fundamental analysis—top down and bottom up. The factors to consider are economic (E), industry (I) and company (C) factors. Beginning at company-specific factors and moving up to the macro factors that impact the performance of the company is called the bottom-up approach. 43
INVESTING IN STOCKS
Scanning the macro economic scenario and then identifying industries to choose from and zeroing in on companies, is the top-down approach. EIC framework is the commonly used approach to understanding fundamental factors impacting the earnings of a company, scanning both micro and macro data and information. Buy side research versus Sell Side Research Though both Sell-side and Buy-side researchers and analysts take up similar works, they differ in terms of: for whom they work, how accurate they need to be, and for what are they paid. Sell-side Analysts work for firms that provide investment banking, broking, advisory services for clients. They typically publish research reports on the securities of companies or industries with specific recommendation to buy, hold, or sell the subject security. These recommendations include the analyst’s expectations of the earnings of the company and future price performance of the security (“price target”). In essence, the sell-side analysts are paid for providing useful information to be acted upon. In this regard, the expectations from the sell-side research is a broad guidance on multiple sectors, rather than accurate price predictions. Buy-side Analysts work for fund managers like those of mutual funds, hedge funds, pension funds, or portfolio managers that purchase and sell securities for their own investment accounts or on behalf of their clients. These analysts generate investment recommendations for their internal consumption viz. use by the fund managers within organization. Research reports of these analysts are generally circulated among the top management/investment managers of the employer firms as these reports contain recommendations about which securities to buy, hold or sell. Therefore the buy-side researchers need to be more accurate and they are paid for their investment recommendations. 3.5-2 Stock Analysis Process The value of an investment is determined by its expected cash flows and the investor’s/ analyst’s required rate of return (i.e. its discount rate). The expected cashflows as well as required rate of return are influenced by the economic environment. The analyst needs to have good understanding of important economic variables and economic
44
INVESTING IN STOCKS
series. The macroeconomic analysis provides a framework for developing insights into sector and company analysis. The objective of stock analysis is to make the critical risk-return decision at the market-industry-company stock level. The stock analysis process involves three steps. It requires analysis of the economy and market. Another crucial step in the process is examination of various sectors. The process culminates with the analysis of stocks. Economy Analysis Macro-economic environment influences all industries and companies within the industry. Monetary and fiscal policy influences the business environment of the industries and companies. Fiscal policy initiatives such as tax reduction encourages spending while removal of subsidies or additional tax on income discourages spending. Similarly, monetary policy may reduce the money supply in the economy affecting the expansionary plans and working capital requirements of all the businesses. Hence a thorough macro-economic forecast is required to value a sector/firm/equity. Any macro-economic forecast should include estimates of all of the important economic numbers, including gross domestic product, inflation rates, interest rates unemployment etc. The most important thing an analyst does is to watch for releases of various economic statistics by the government, central bank and private sources. Especially, they keep a keen eye on the Index of economic indicators like the WPI, CPI, monthly inflation indices, Index of Industrial Production, GDP growth rate etc. Analysts assess the economic and security market outlooks before proceeding to consider the best sector or company. Interest rate volatility affect different industries differently. Financial institution or bank stocks are typically placed among the most interest-sensitive of all stocks. Sectors such as pharmaceuticals are less affected by interest rate change. The economy and the stock market have a strong and consistent relationship. The stock market is known as a leading economic indicator. A leading economic indicator is a measure of economic recovery that shows improvement before the actual economy does because stock price decisions reflect expectations for future economic activity, not past or current activity. Industry/Sector Analysis Industry analysis is an integral part of the three steps of top-down stock analysis. Rates of return and risk measures vary over time in different industries. Industry 45
INVESTING IN STOCKS
analysis helps identify both unprofitable and profitable opportunities. Industry analysis involves conducting a macro analysis of the industry to determine how different industry relates to the business cycle. Performance of industries is related to the stage of the business cycle. Different industries perform differently in different stages of the business cycle. On the basis of the relationship different sectors share with the business cycles, they are classified as cyclical and noncyclical sectors. For example, banking and financial sector perform well towards the end of a recession. During the phase of recovery, consumer durable sectors such as producers of cars, personal computers, refrigerators, tractors etc. become attractive investments. Cyclical industries are attractive investments during the early stages of an economic recovery. These sectors employ high degree of operating costs. They benefit greatly during an economic expansion due to increasing sales, as they reap the benefits of economies of scale. Similarly, sectors employing high financial leverage also benefit during this phase, as debt is good in good times. At the peak of business cycle, inflation increases as demand overtakes supply. Inflation impacts different industries differently. There are industries, which are able to pass on the increase in the costs of products to their consumers by increasing prices. Their revenue and profits may remain unaffected by inflation. Industries producing basic materials such as oil and metals benefits the situation. Rising inflation doesn’t impact the cost of extracting these products. These industries can increase prices and experience higher profit margins. However, there are industries that are not able to charge the increased costs of production to their consumers. Their profitability suffers due to inflation. During a recession phase also, some industries do better than others. Defensive industries such as consumer staples, pharmaceuticals, FMCG, outperform other sectors. In such times, even though the spending power of consumer may decrease, people still spend money on necessities. Analyst also see the stage the industry is in its life cycle. The number of stages in the life cycle of the industry are depicted in Exhibit 3.2.
46
INVESTING IN STOCKS EXHIBIT 3.2: INDUSTRY LIFE CYCLE
Industry output
Industry Life Cycle
introduction
growth
maturity
decline
Time
Introduction: During this stage, industry experiences modest sale and very small or negative profit. The market of the products of the industry is small and the firms in the industry may have high development costs. Growth: During this stage, market develops for the products or services of the industry. Number of firms in the industry is less during this phase and hence they may have little competition. Profit margins at this stage are generally high. This stage is followed by mature industry growth. The rapid growth of the earlier phase attracts competitors contributing profits margins go to normal levels. Maturity: This is generally the longest phase in the life cycle of the industry. During this stage, growth rate in the industry normally matches with the economy’s growth rate. Firms in the industry differ from one another given their cost structure and ability to control costs. Competition is high during this stage reducing the profit margin to normal levels. Deceleration of growth and decline: This stage observes decline in sales due to shift in demand. Profits margins are under pressure and some firms may even witness negative profits. Similar to life cycle analysis, competitive structure of the industry is to be analysed by the analysts. It is a key factor affecting the profitability of the firms in the industry. Competition influences the rate of return on invested capital. If the rate is “competitive” it will encourage investment. Porter looked at forces influencing competition in an industry and the elements of industry structure. He described these forces as industry’s micro- environment. Porters model is presented in Exhibit 3.3.
47
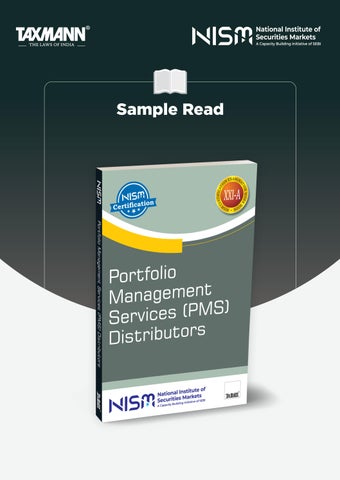
PORTFOLIO MANAGEMENT SERVICES (PMS) DISTRIBUTORS AUTHOR
:
PUBLISHER : DATE OF PUBLICATION : EDITION : ISBN NO : NO. OF PAGES : BINDING TYPE :
National Institute of Securities Markets (NISM) | An Educational Initiative of SEBI Taxmann September 2026 Workbook Version - September 2025 9788167011756 296 Paperback
Rs. 445 DESCRIPTION Portfolio Management Services (PMS) Distributors is a single-volume account of how portfolio management services work in India: what a PMS mandate is, who may offer one and on what conditions, what the client must be told before signing, and how the portfolio is then constructed, administered, priced, measured, reported and taxed. Published by Taxmann for the National Institute of Securities Markets, it is the official NISM workbook for the NISM-Series-XXI-A certification. The book is written to a specific proposition: a PMS mandate is not a packaged product. There is no scheme information document, no daily published NAV and no single headline expense ratio. What the client receives is a bilateral agreement, governed by a disclosure document, priced by a fee structure that someone must be able to explain, and judged by statistics that someone must be able to read. The treatment is worked rather than asserted—fee calculations, return measures, bond valuations and risk statistics are each derived from a numerical example, with statutory positions footnoted to the governing regulation or circular. This book is intended for the following audience: • Distributors, Relationship Managers and Sales Staff • Wealth Managers, Private Bankers, Family Office Executives • Compliance, Operations, Dealing-Desk and Client-Servicing Staff • Principal Officers and Fund-Management Decision-Makers • Registered Investment Advisers and Mutual Fund Distributors • Chartered Accountants, Company Secretaries and Lawyers • HNI and Family-Office Investors • Candidates for the NISM-Series-XXI-A Certification Examination The Present Publication is the September 2025 Workbook Version, developed and reviewed by Certification Team of NISM, jointly with Dr Rachana Baid, Dr Kameshwar Rao and Dr Kishore Rathi, drawing on other NISM certification workbooks and NISM Resource Persons, with the contribution of the Examination Committee for NISM-Series-XXI-A comprising industry experts. It is published exclusively by Taxmann, with the following noteworthy features: • [Both Codes of Conduct in Full] The eighteen-clause Code of Conduct for PMS Distributors, and the thirteen-clause code for portfolio managers under Schedule III • [Amended & Updated] The simplified Disclosure Document format notified on 9th September 2025, the MITC document and mandatory fee calculation tool, mandatory APMI registration for distributors, and the Online Dispute Resolution mechanism • [Fees Worked Line By Line] Performance fee under a high water mark and hurdle rate computed across four years, including a minus 25 per cent year, showing exactly when a performance fee is and is not payable • [Spreadsheet Method Taught Explicitly] Four MS Excel illustrations printing the full argument syntax for the PRICE, YIELD and DURATION functions • [Built Around the Distribution Role] The disclosure document heading by heading, the client agreement point by point and the cost stack line by line, including the manager's duty to disclose the commission paid to the distributor • [A Usable Regulatory Reference] The Portfolio Managers Regulations 2020, PMLA obligations, Schedule C insider trading standards and PFUTP prohibitions each summarised in their own right • [Self-Testing Throughout] Sample questions with indicated answers at the end of every chapter, and four extended caselets at the close
Buy Now