Let's Roll: Reimagining Transit on Washtenaw Avenue
Let’s Roll: Reimagining Transit on Washtenaw Avenue
Taubman College of Architecture & Urban Planning
University of Michigan
April 2012
Prepared by: Joel Batterman|Becca Homa|Shintaro Hori|Kimberly Jongsma|Moyin Li|Gautam Mani|Julia Roberts
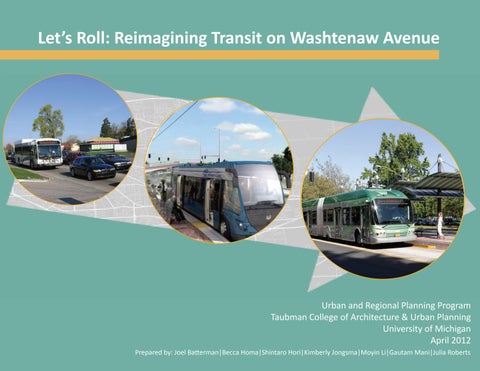
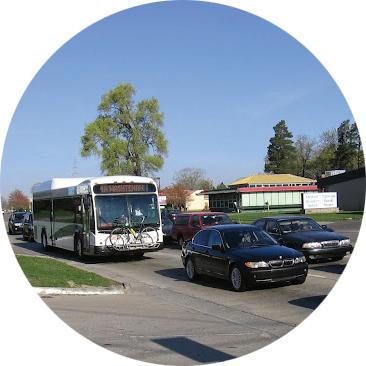
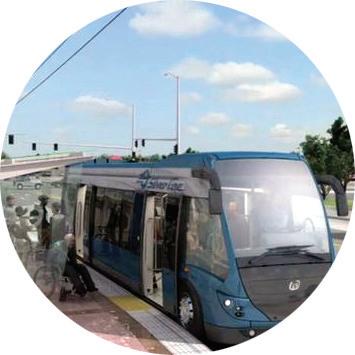
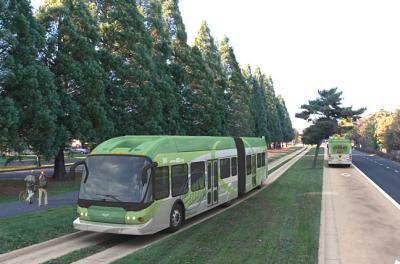
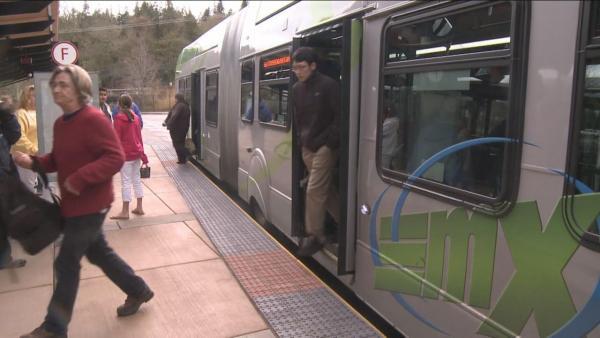
Cover photo source (left to right):
AATA Route 4-Washtenaw (Joel Batterman), proposed Grand Rapids Silver Line (NC3D), and Eugene, Oregon Emerald Express (Wildish Land Co.).
Let’s Roll: Reimagining Transit on Washtenaw Avenue
Urban and Regional Planning Program, Taubman College of Architecture & Urban Planning, University of Michigan, Ann Arbor | April, 2012
Prepared by:
Joel Batterman
Becca Homa
Shintaro Hori
Kimberly Jongsma
Moyin Li
Gautam Mani
Julia Roberts
Acknowledgements
The authors would like to thank Chris White and the Ann Arbor Transportation Authority (AATA) for the opportunity to complete this study, which would not have been possible without encouragement and advice from Chris and the entire AATA staff. Particular thanks are also due to AATA’s Michael Benham and Jeff Murphy.
Invaluable assistance also came from the following members of the Re-Imagine Washtenaw Joint Technical Committee and other organizations:
Terri Blackmore, Washtenaw Area Transportation Study
Pat Cawley, City of Ann Arbor
Eli Cooper, City of Ann Arbor
Anya Dale, University of Michigan (formerly Washtenaw County)
Teresa Gillotti, City of Ypsilanti
Joe Lawson, Ypsilanti Township
Paul Lott, Michigan Department of Transportation
Kari Martin, Michigan Department of Transportation
Paul Montagno, Pittsfield Township
Richard Murphy, City of Ypsilanti
Tom Schwetz, Lane Transit District
Conrad Venema, Interurban Transit Partnership (The Rapid)
Nathaniel Voght, Washtenaw County
Finally, we would like to acknowledge the enthusiastic guidance and supervision of Jonathan Levine and Eric Dueweke of the University of Michigan Taubman College of Architecture and Urban Planning.
List of Figures
List of Tables
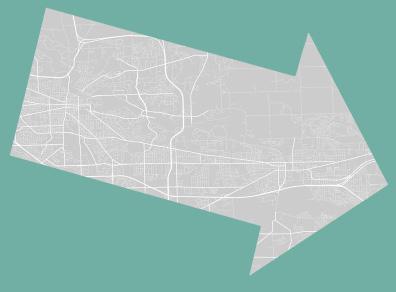
Map of AATA Route 4 and Study Area
Executive Summary
Chapter 1: The Washtenaw Corridor
Chapter 2: Route 4 Delay Source Analysis
Table of Contents
Chapter 3: Transit Improvement Toolkit
Intersection Treatments
Roadway Treatments
Expidited Boarding Practices
Putting Together the Transit Improvement Puzzle: BRT
Conclusion
Chapter 4: Recommendations
Vision
Corridor-Wide Applications
Recommendations by Segment
Conclusion
Chapter 5: Implementation
Phased Improvements for Washtenaw Transit
Phase One: Enhanced Bus
Phase Two: Bus Rapid Transit Lite
Phase Three: Bus Rapid Transit
List of Figures
Chapter 1
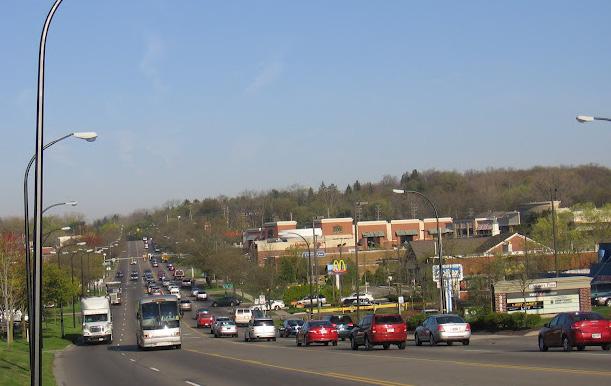
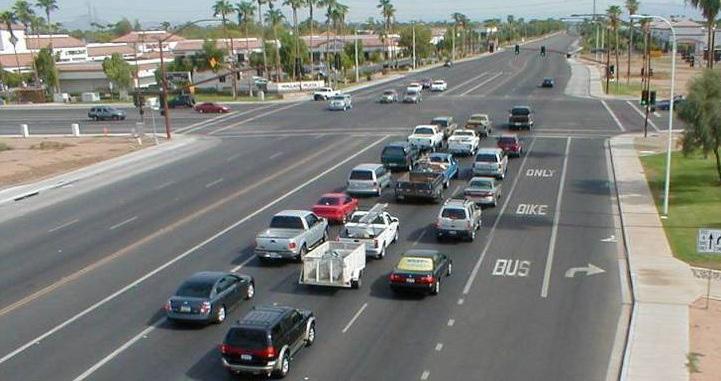
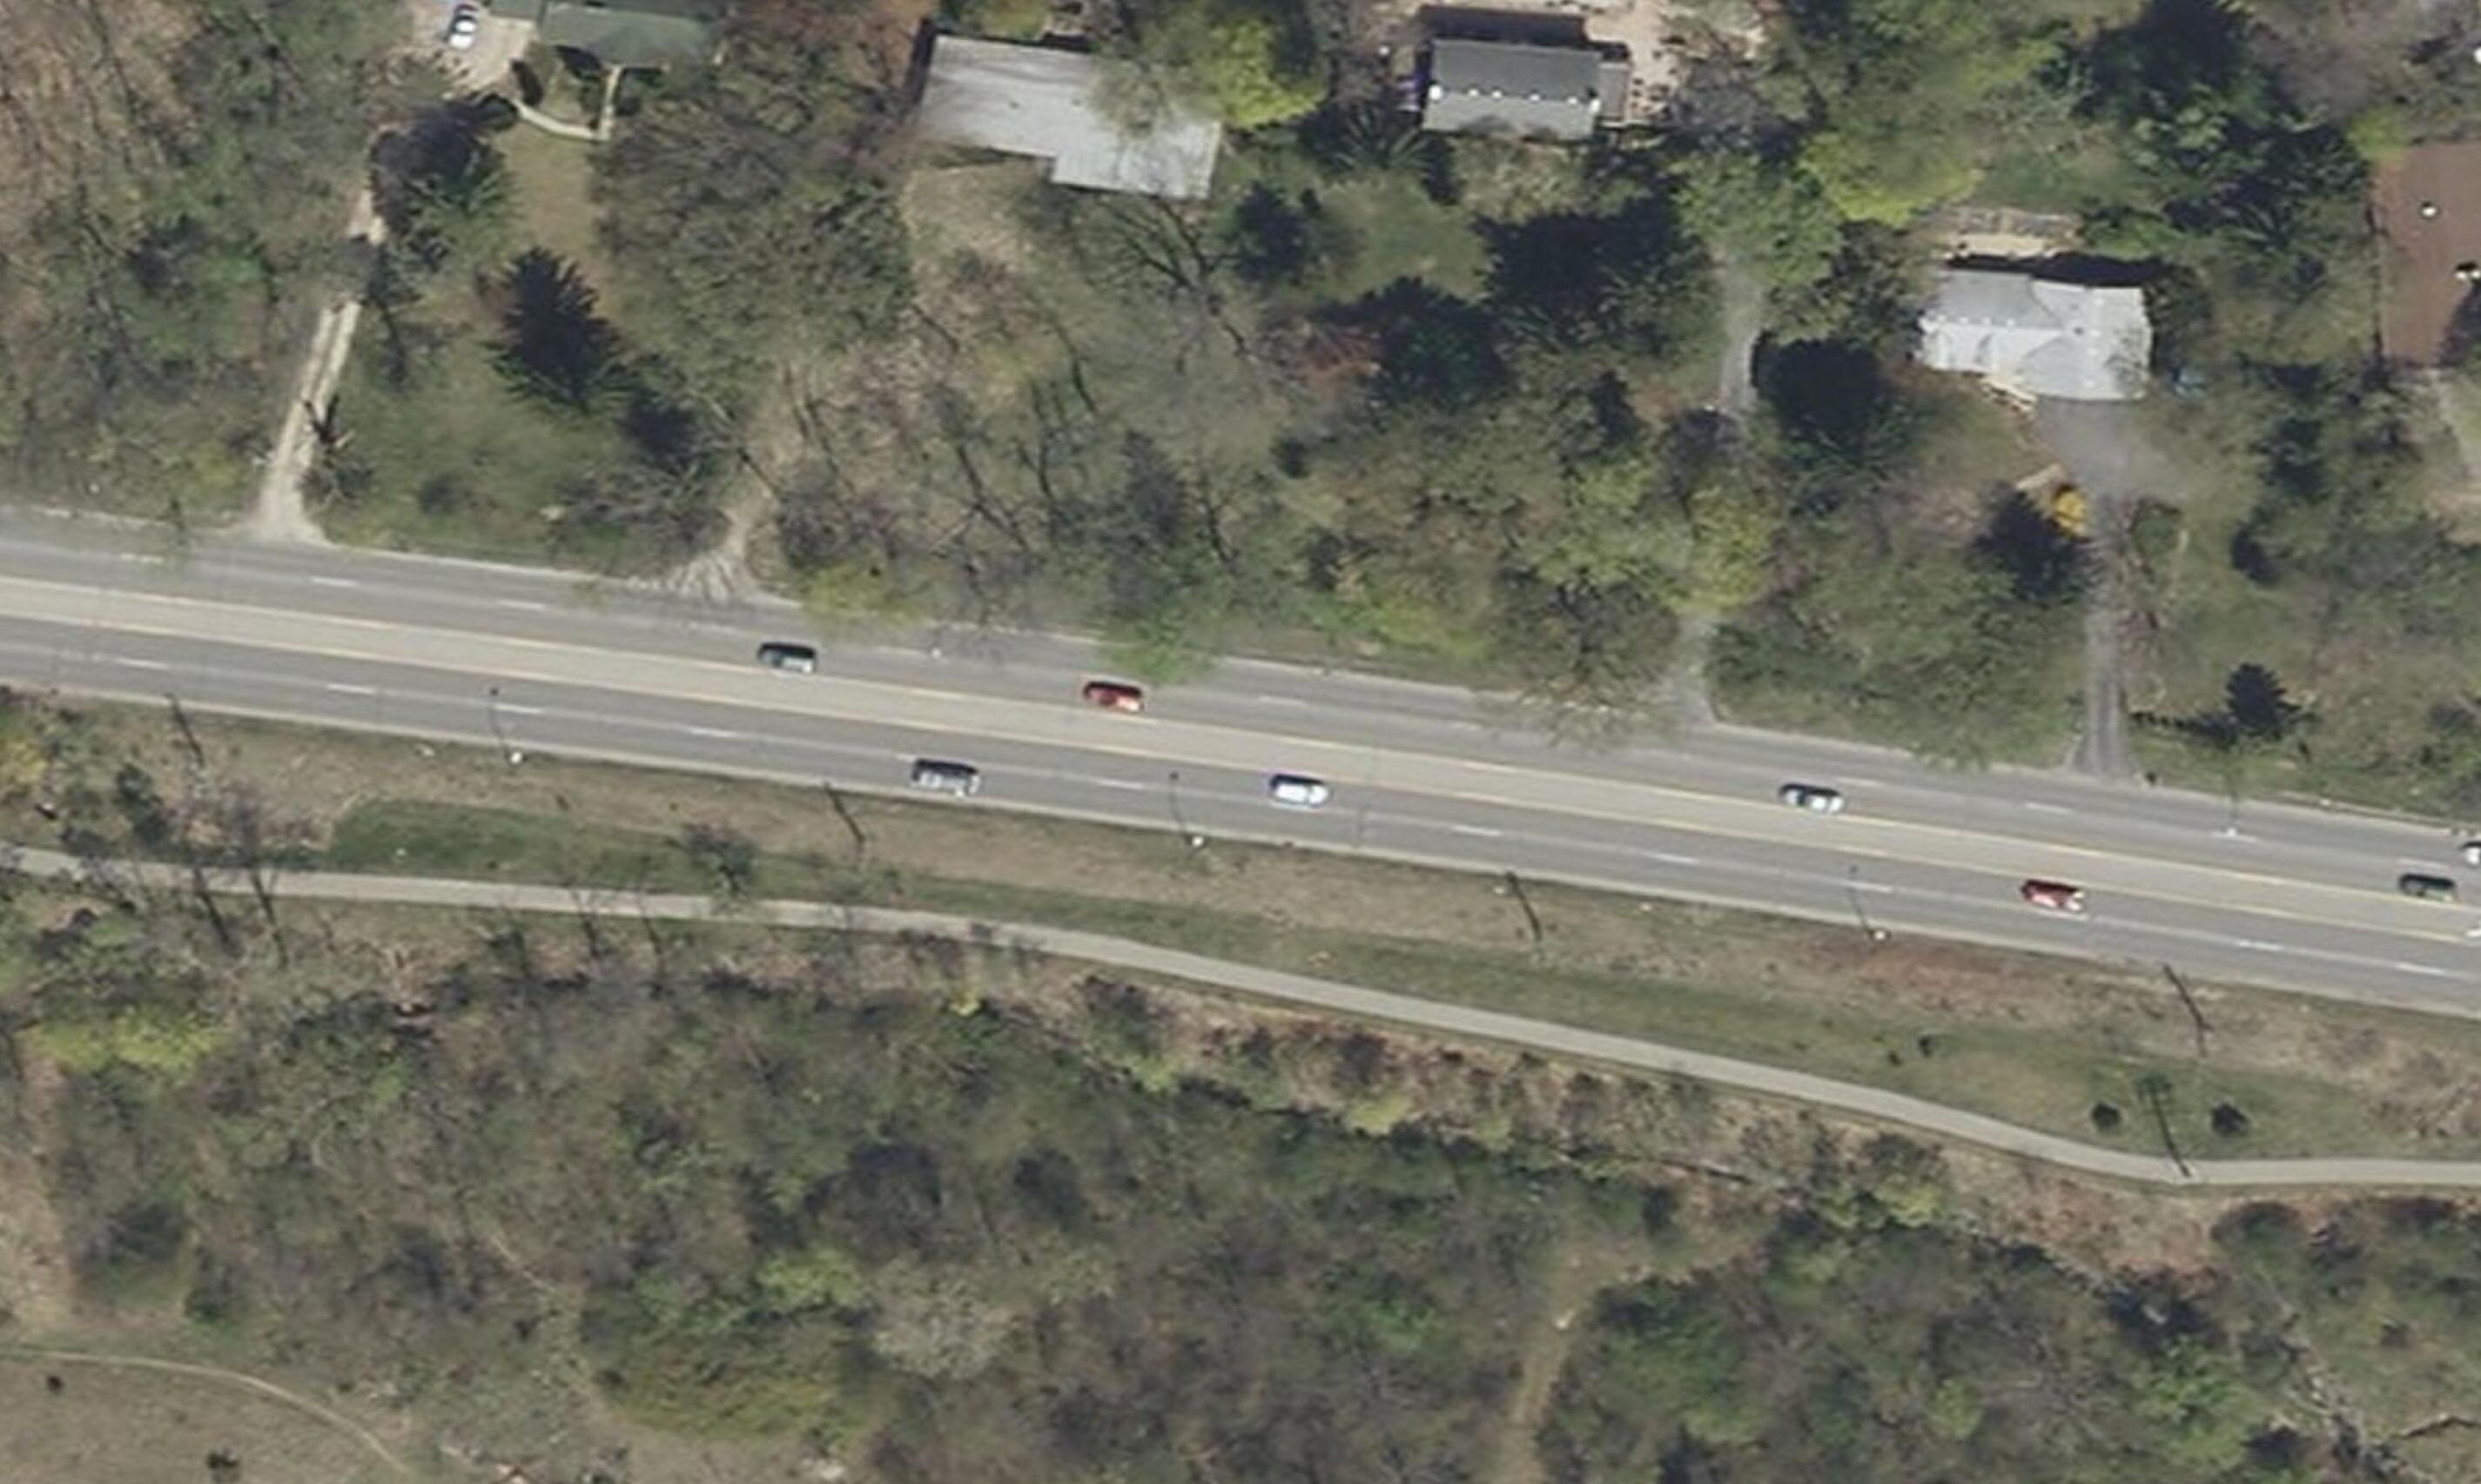
Figure1.1 Heavy traffic on westbound Washtenaw, in Ann Arbor west of US-23, during the morning rush-hour
Figure 1.2. “Ypsi-Ann” interurban trolley, downtown Ann Arbor, 1901
Figure 1.3. Washtenaw Avenue at US-23 and Arborland Mall
Figure 1.4. Underused commercial property on Washtenaw
Figure 1.5. Ypsi-Arbor Lanes bowling alley, now closed
Figure 1.6. Land uses along and near the Washtenaw Avenue
Figure 1.7. Large commercial development, Ann Arbor
Figure 1.8. Small strip commercial development, Ann Arbor
Figure 1.19. Intersection of Washtenaw and Golfside, lacking sidewalks and curb ramps
Figure 1.20 Washtenaw and Fountain Square entrance drive, a signalized intersection lacking pedestrian crossing facilities
Figure 1.21. Unsignalized mid-block crossing near Platt
Figure 1.22. Pedestrian and bicycle crashes on Washtenaw, 2004-2009
Figure 1.23. Average weekday ridership for Route 4 and other AATA routes
Figure 1.24. Ann Arbor Transportation Authority system map
Figure 1.25. Bus stop amenities on Route 4 corridor
Figure 1.26. AATA Route 4 riders by payment method
Figure 1.27(a). Average Daily Boardings on Route4 (Westbound)
Figure 1.27(b). Average Daily Boardings on Route4 (Eastbound)
Figure 1.28. On-time Performance percentage by time of day- Route 4
Figure 1.29. AATA On-time performance by Percentage, Selected Routes
Chapter 2
Figure 2.1: AM Peak Bus Traffic Light Delay on the Corridor
Figure 2.2: PM Peak Bus Traffic Light Delay on the Corridor
Figure 2.3: Off-peak Bus Traffic Light Delay on the Corridor
Figure 2.4: Peak Bus Dwell Time on the Corridor
Figure 2.5: Off-peak Bus Dwell Time on the Corridor
Figure 2.6: AM Peak Bus Speeds Between Stops on the Corridor (to Ypsilanti)
Figure 2.7: Off-peak Bus Speeds Between Stops on the Corridor (to Ypsilanti)
Figure 2.8: PM Peak Bus Speeds Between Stops on the Corridor (to Ypsilanti)
Figure 2.9: AM Peak Bus Speeds Between Stops on the Corridor (to Ann Arbor)
Figure 2.10: Off-peak Bus Speeds Between Stops on the Corridor (to Ann Arbor)
Figure 2.11: PM Peak Bus Speeds Between Stops on the Corridor (to Ann Arbor)
Figure 2.12: Total Route 4 Travel Time on Corridor, by Bus Activity (both directions) List of Figures
List of Figures
Chapter 3
Figure 3.1: A configuration for Active TSP
Figure 3.2: Bus Queue Jump Illustration
Figure 3.3: Bus Queue Bypass Lane Illustration
Figure 3.4(a): Queue Jump Lane in Portland, OR
Figure 3.4(b): Queue Jump Lane in Chandler, AZ
Figure 3.4 (C): Queue Jump Lane in Oakland, CA
Figure 3.5: Queue Jump Sign in Portland, Oregon
Figure 3.6: Bus Lane Sign in New York City
Figure 3.7 (a): Bus Priority Lane in Albany New, York
Figure 3.7 (b): Bus and Bike Priority Lane in Seattle
Figure 3.8: VTA Bus Operating in Mixed Traffic Lanes
Figure 3.9: Confusing Bus Lane Sign in San Francisco
Figure 3.10: Exclusive Bus Lane with Bollards in Boston
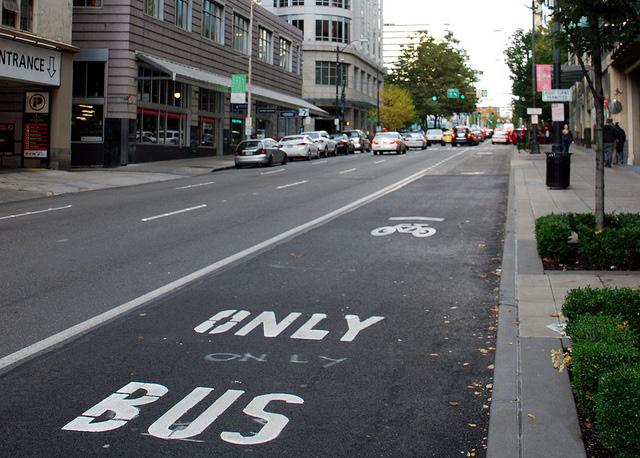
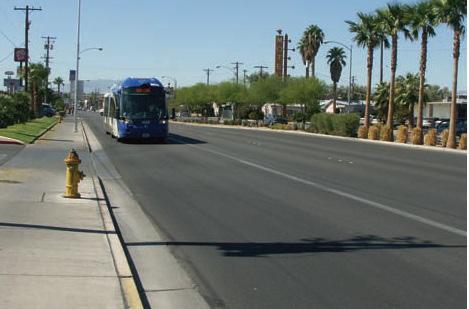
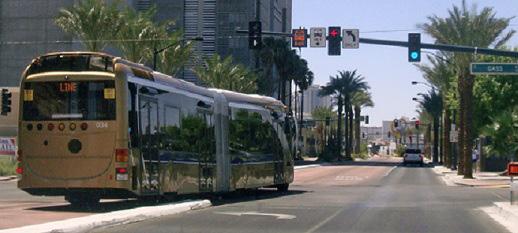
Figure 3.11: Las Vegas MAX Bus Exclusive Lane
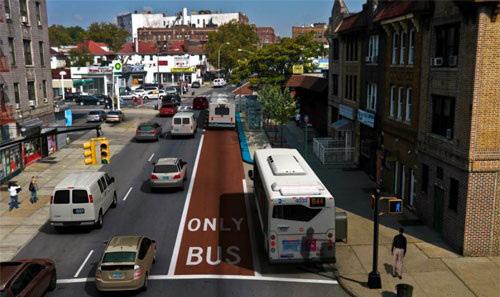
Figure 3.12: Las Vegas SDX Bus in Median Bus Only Lane
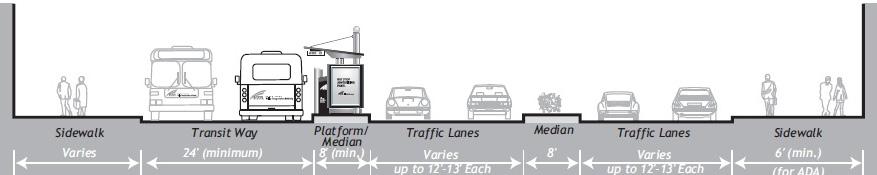
Figure 3.13: Median Transitway Alignment
Figure 3.14: South Miami-Dade Busway
Figure 3.15: Pittsburgh’s East Busway
Figure 3.16: Median Transitway, Eugene, Oregon
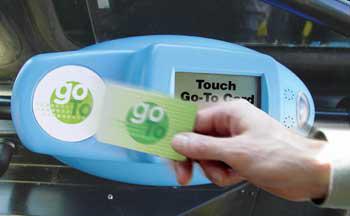
Figure 3.17: Twin Cities Go-To Card
Figure 3.18: Las Vegas SDX Vending Machine
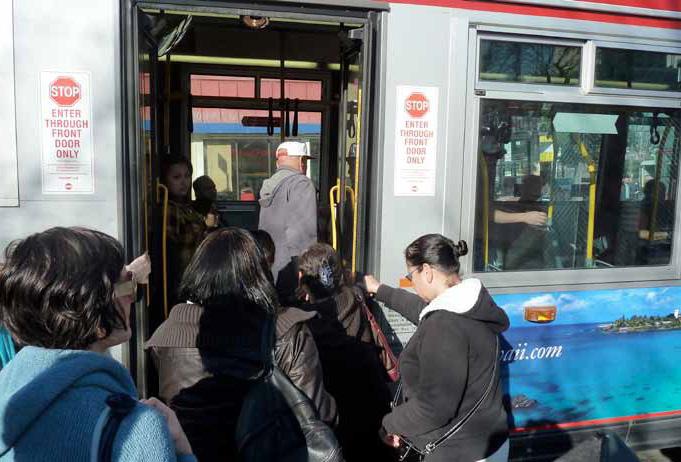
Figure 3.19: Both Doors Open on Metro Orange
Figure 3.20: Illegal Back Door Boarding
List of Figures
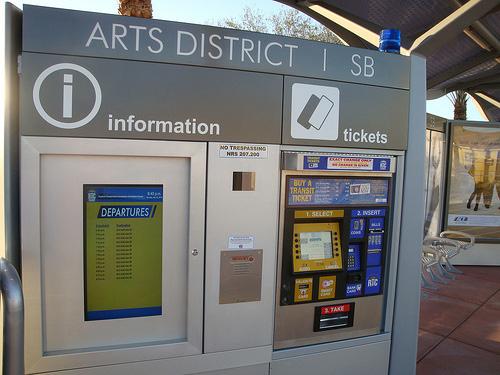
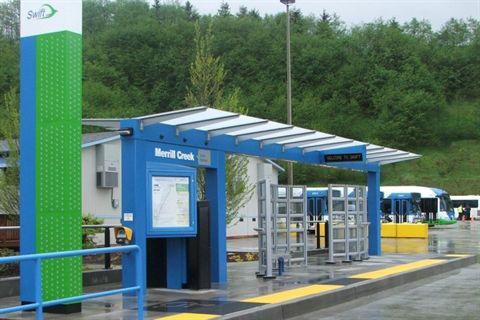
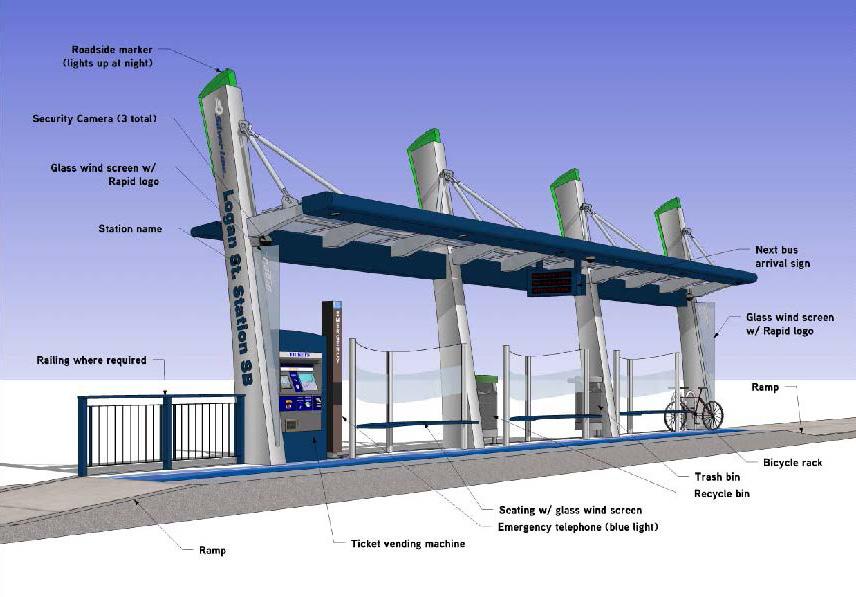
Figure 3.21: BRT Station, Community Transit
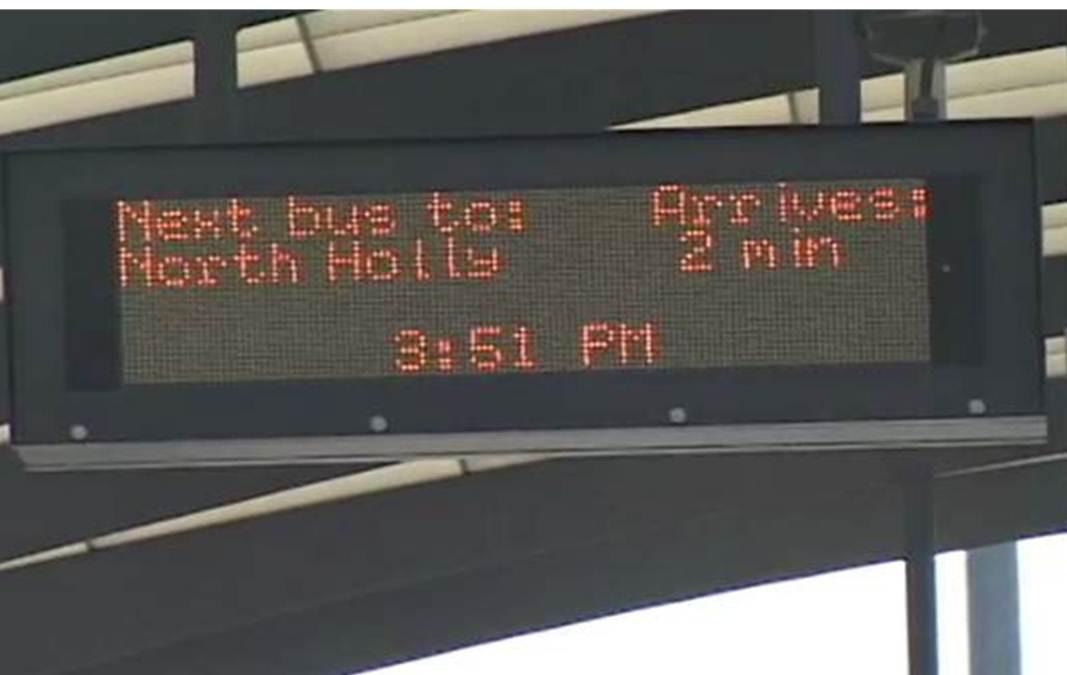
Figure 3.22: Real Time Information Screen
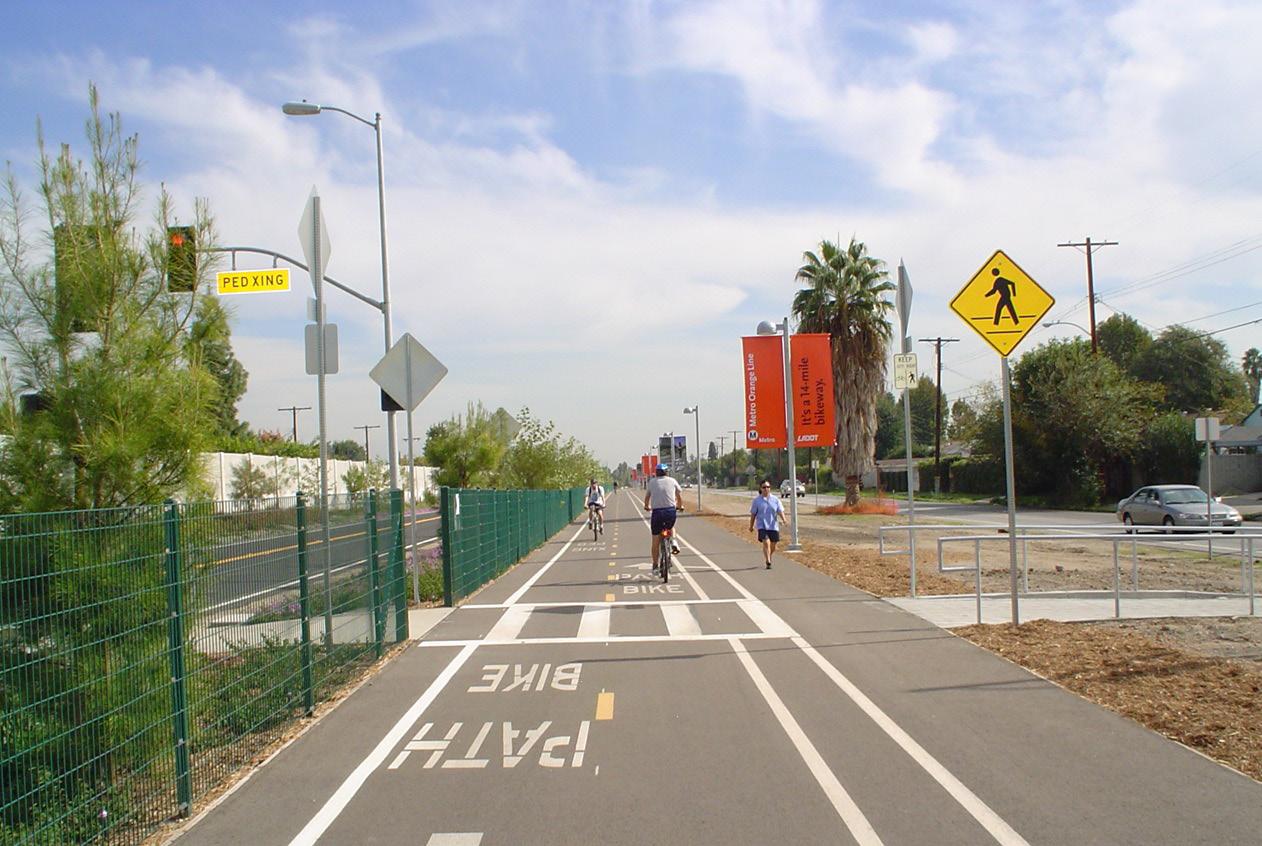
Figure 3.23: Bike Path Near Metro Orange Station
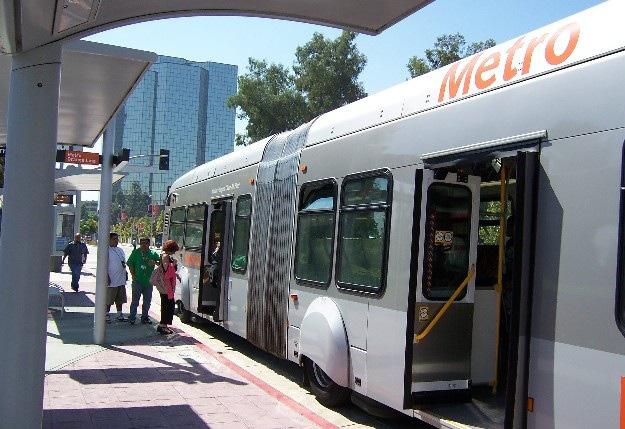
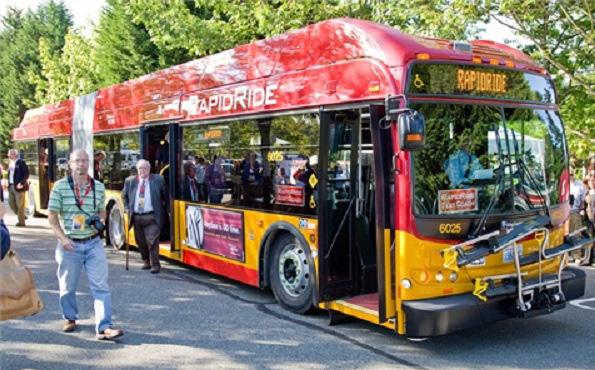
Figure 3.24: RapidRide Bus With Three Doors
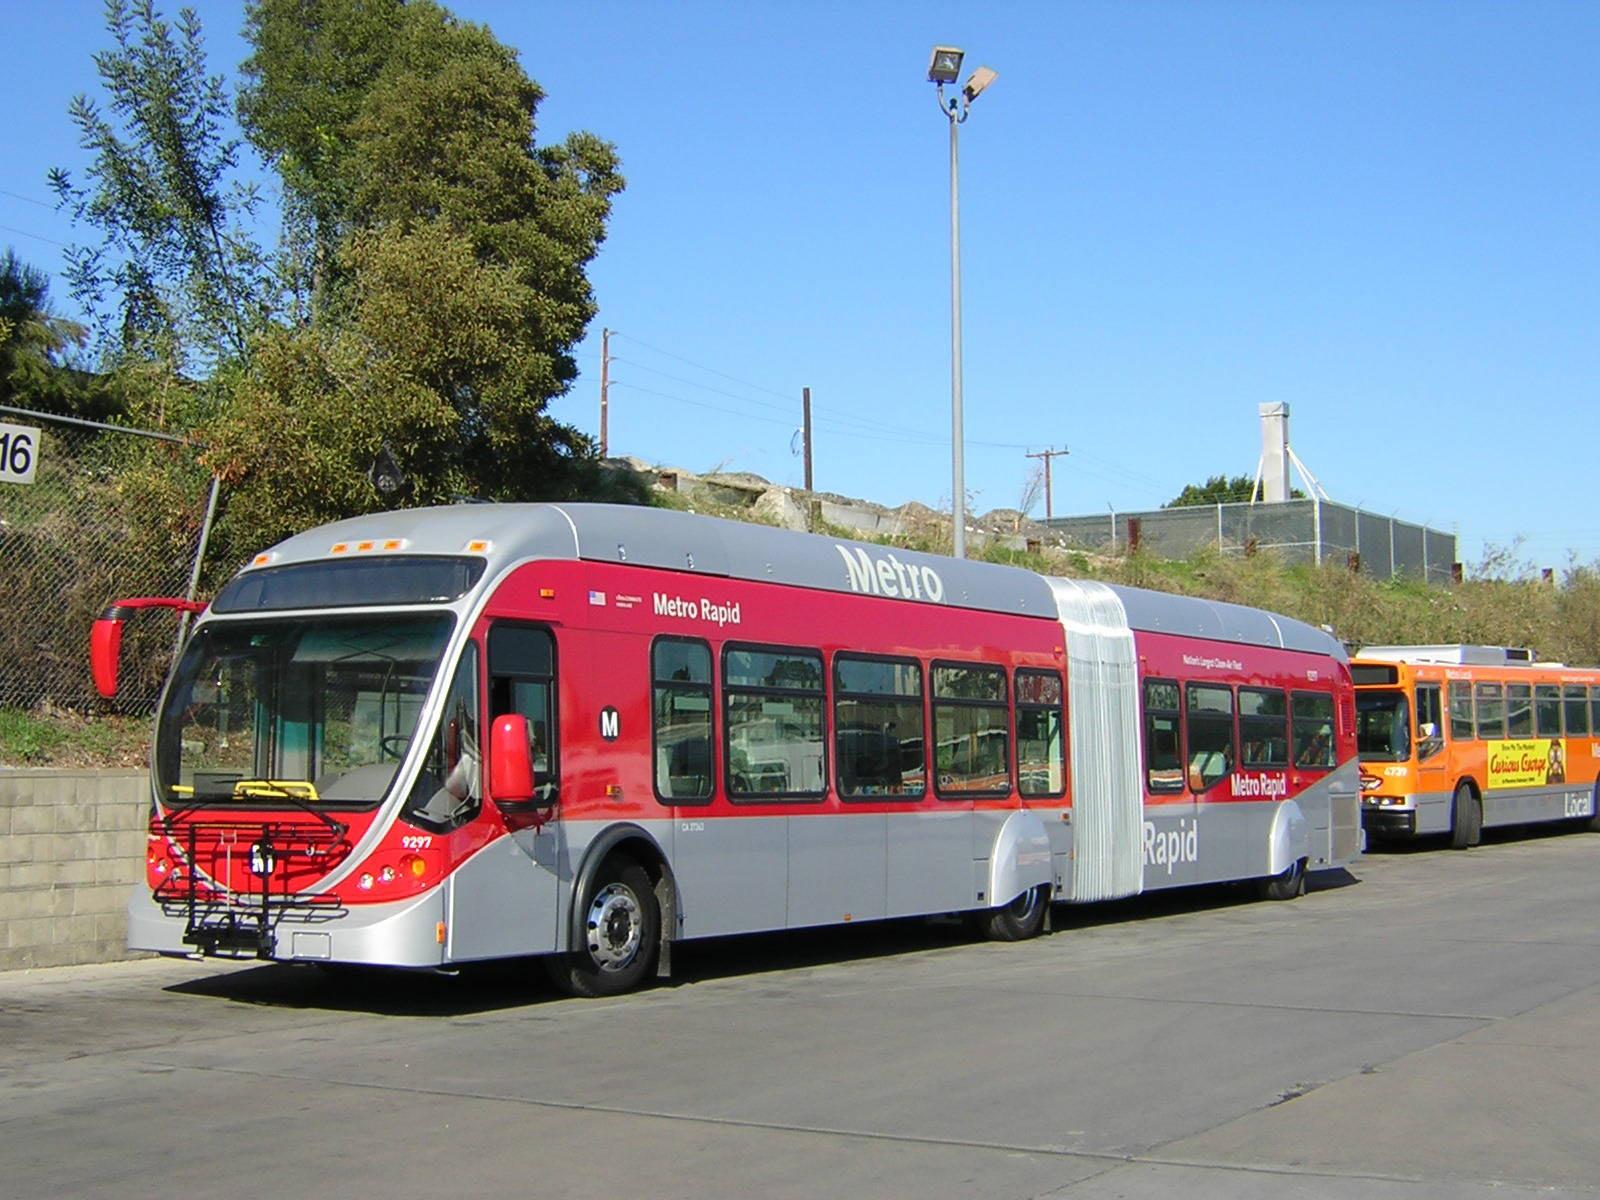
Figure 3.25: Metro Rapid Bus With Covered Wheels
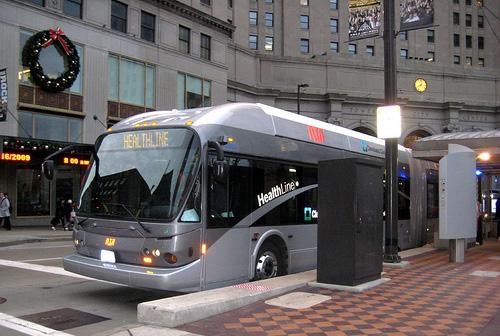
Figure 3.26: Docking BRT Vehicle in Cleveland
Chapter 4
Figure 4.1(a) Map of Proposed BRT-Ready Stations (Eastbound)
Figure 4.1(b) Map of Proposed BRT-Ready Stations (Westbound)
Figure 4.2. Los Angeles Rapid Transit Station
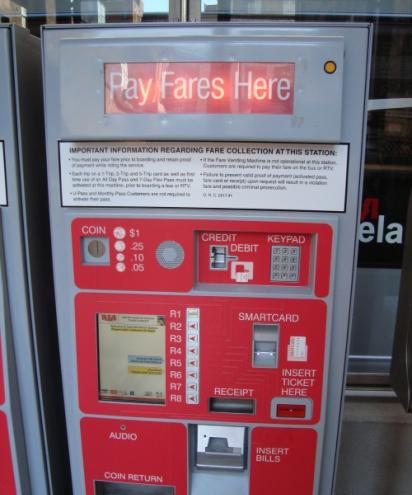
Figure 4.3. Fare Vending Machine at BRT Station in Cleveland
Figure 4.4. Intersections with High Need for Transit Signal Priority
Figure 4.5. Proposed Locations for Queue Jump Lanes
Figure 4.6. Bus Through Lane between Manchester and Platt
Figure 4.7. Potential Transit Priority Lane between Manchester and Platt
Figure 4.8. Proposed Queue Jump Lanes with Transit Signal Priority at Huron Parkway
Figure 4.9. Proposed Queue Jump Lanes with Transit Signal Priority at Yost Boulevard
Figure 4.10. Proposed Queue Jump Lanes with Transit Signal Priority at Carpenter/Hogback Road
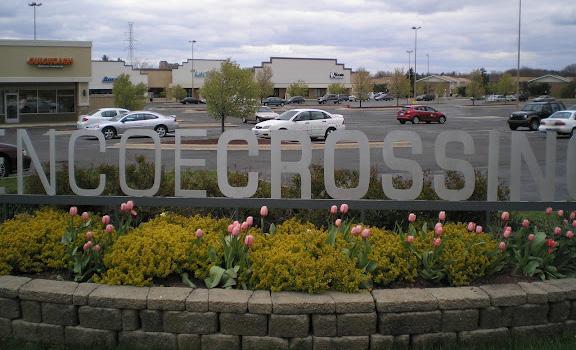
Figure 4.11. Glencoe Crossing Shopping Mall at Deake Road
Figure 4.12. Stop Location at Golfside Road
Figure 4.13. Proposed Queue Jump with Transit Signal Priority at Golfside Road
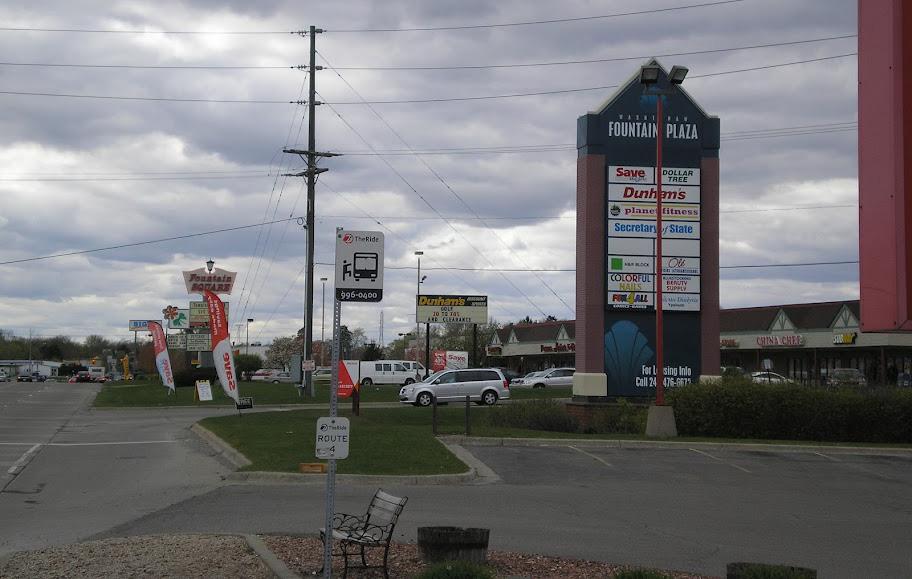
Figure 4.14. Current Stop Location at Fountain Plaza
Figure 4.15. Proposed Queue Jump with Transit Signal Priority at Hewitt Road
Chapter 1
Table 1.1. Roadway Segment Characteristics
Chapter 2
Table 2.1: Moving Delay for the AM Peak Period
Table 2.2: Moving Delay on Mid-Day Trips
Table 2.3: Moving Delay for Afternoon Peak Trips
Chapter 3
Table 3.1: The Capital and Operating Costs of Transit Signal Priority
Table 3.2: Types of Benefits Observed with TSP, United States
Table 3.3: Capital Costs of Fareboxes
Chapter 4
Table 4.1(a): Types of Transit Recommendations by Segment on Washtenaw Avenue (1 of 3)
Table 4.1(b): Types of Transit Recommendations by Segment on Washtenaw Avenue (2 of 3)
Table 4.1(c): Types of Transit Recommendations by Segment on Washtenaw Avenue (3 of 3)
Chapter 5
Table 5.1: Enhanced Bus Improvements
Table 5.2: Average Time Savings in Seconds Per Run for Transit Signal Priority
Table 5.3: Bus Rapid Transit Lite Improvements
Table 5.4: Average Time Savings in Seconds Per Run of Queue Jump Lanes
Table 5.5: Bus Rapid Transit Improvements
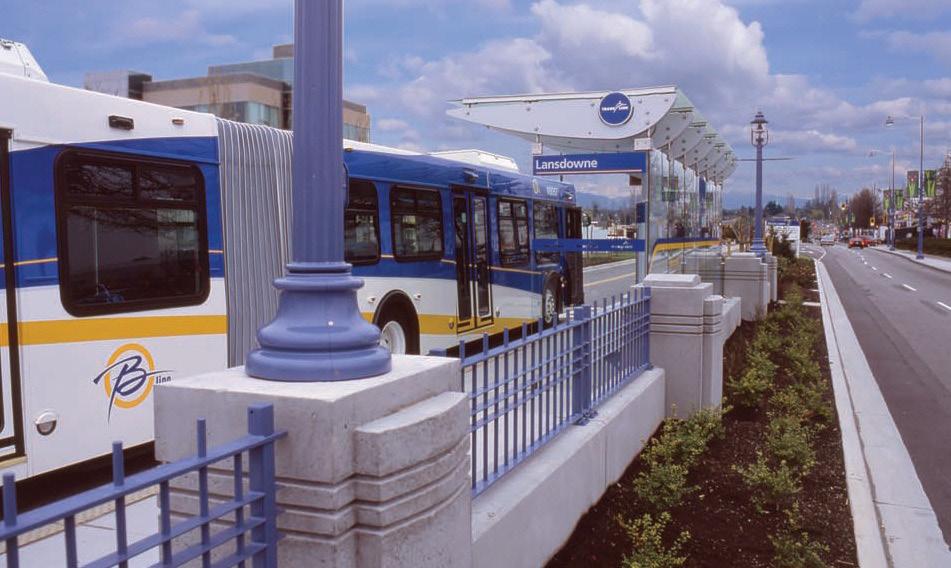
Study Area Reimagining Washtenaw Avenue Transit
AATA Route
4 and
Every day, thousands of people use the Route 4 - Washtenaw Avenue bus to access central Ann Arbor, Ypsilanti, and destinations in between. Yet the most-travelled route in the Ann Arbor Transportation Authority (AATA) system is often slowed by traffic conditions, particularly in the congested 4.5 miles between Stadium Boulevard in Ann Arbor and the Ypsilanti water tower. This study analyzes delay sources and national best practices to recommend measures for reducing transit delay along Washtenaw, including both immediate improvements and transformative long-term changes that can make the corridor a more accessible and prosperous place.
Current Conditions
Connecting the historic city centers of Ann Arbor and Ypsilanti, Washtenaw Avenue was the site of Michigan’s first interurban streetcar line. As the Michigan state trunkline M-17, it later formed a major axis for auto-oriented suburban development. It now suffers significant congestion during peak travel times, and lacks consistent pedestrian and bicycle facilities.
Executive Summary
Bus service along Washtenaw is the most frequent in the AATA system, buses alternate five and ten minute headways during peak hours. Ridership has grown significantly in recent years, due to rising bus commutes to Ann Arbor and the University of Michigan, and the AATA Countywide Master Plan marks Washtenaw for future high-capacity transit. However, on account of congestion, bus reliability has historically been poor, and the scheduled 45-minute Route 4 travel time between downtown Ann Arbor and downtown Ypsilanti is not competitive with travel time by automobile.
The study area of this report is a 4.5-mile segment of Washtenaw Avenue running from Stadium Avenue in Ann Arbor to Summit Street in Ypsilanti. This corridor is the target of the collaborative Re-Imagine Washtenaw initiative, which has brought together local governments to encourage transitoriented redevelopment.
Route 4 Delay Source Analysis
An analysis of specific delay sources was the first step in identifying appropriate measures for streamlining service along Washtenaw. This analysis found that Route 4 buses spend the majority of the typical 22-minute trip through the corridor out of motion, sitting at red lights and bus stops. Delay consisted of three primary types:
• Signal delay, time paused at traffic signals (49% total travel time during PM Peak)
• Dwell time delay, time paused at bus stops (26% total travel time during PM Peak)
• Moving delay, time moving at slow speeds in congested conditions (14% total travel time during PM Peak)
Delays are greatest during afternoon peak hours, particularly at major intersections and near US-23.
Transit Improvement Strategies
Transit delays of the kind observed on Washtenaw are not unusual in congested urban environments. National best practices for combating them generally fit into three broad, overlapping strategies.
• Intersection treatments, including transit signal priority and queue-jump lanes, can reduce delay around traffic signals.
• Roadway treatments, such as dedicated bus lanes, can reduce moving delay.
• Boarding treatments, such as consolidated stops and fare pre-payment, can reduce inconsistencies in dwell time.
Pedestrian amenities, sidewalks and crosswalks, must be built on Washtenaw Avenue for significant transit system improvement.
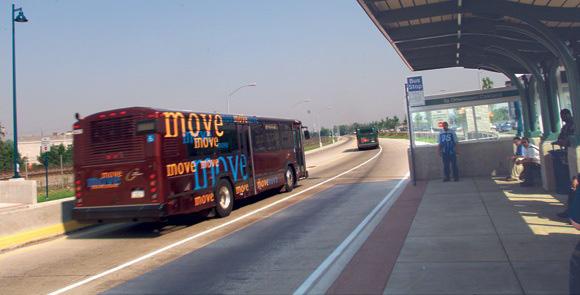
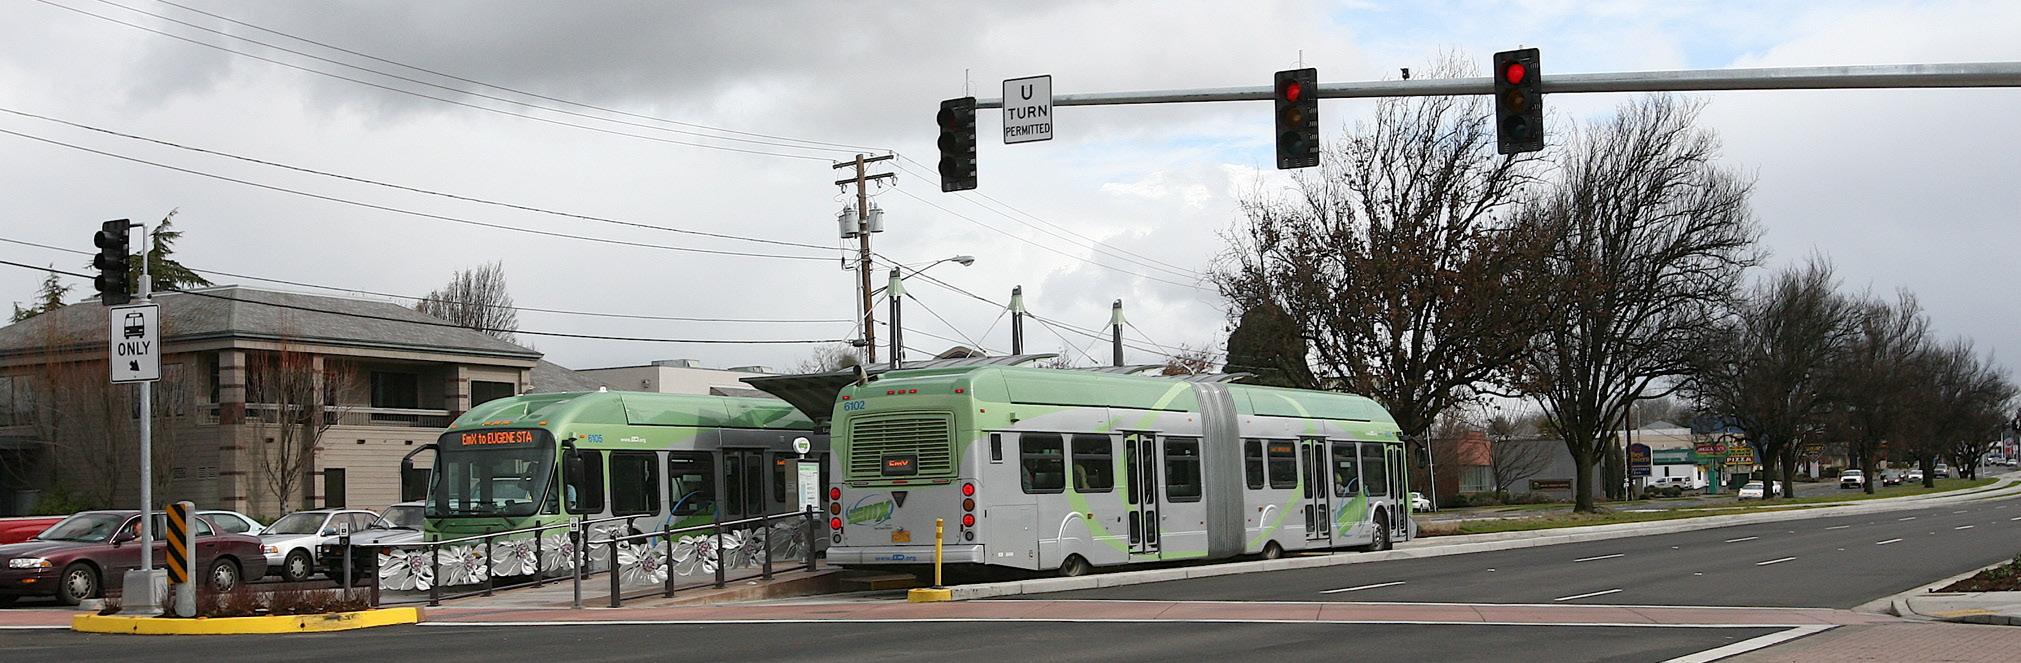
Over the past decade cities across the United States combined these treatments, forming a mode of high-quality service
termed Bus Rapid Transit (BRT). BRT also includes raillike stations, distinctive high-capacity vehicles, improved pedestrian accessibility, integration with other transportation modes, and enhanced branding and marketing to distinguish it from traditional local bus service.
Recommendations and Implementation
Based on the delay analysis, national best practices, and stakeholder interviews, this study recommends a range of transit improvement measures in the Washtenaw Corridor study area and provides a detailed description of opportunities by corridor segment (Chapter 4). These measures are grouped in three implementation phases that build cumulatively (Chapter 5).
Phase One: Enhanced Bus (years 1-3)
This phase includes measures that can be implemented at relatively low expense, including many already planned or underway. This first phase provides enhanced safety for riders while piloting selective use of delay reduction strategies.
Executive Summary
• Complete the pedestrian network
• Consolidate and improve stops, moving them to the far-side of intersections
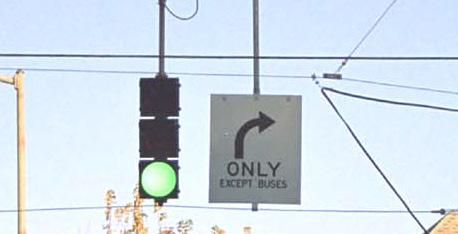
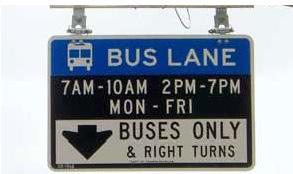
• Mark right-turn lanes as bus through lanes and implement transit signal priority
Phase Two: Bus Rapid Transit Lite (years 3-7)
This phase creates a distinctive, new, limited-stop service along Washtenaw Avenue that would substantially reduce delay at intersections, enhancing service on the corridor. Like “BRT lite” systems in other U.S. cities, it meets the Bus Rapid Transit criteria for federal Small Starts funding, allowing for capital assistance of up to $75 million.
Phase One, plus:
• Consolidate additional stops as distinct rail-like “super stops” with pre-board payment
• Provide transit signal priority (early or extended green) at peak hours
• Construct queue-jump lanes at key intersections, after acquiring right-of-way
Executive Summary
Phase Three: Bus Rapid Transit (years 7-15)
Phase Three establishes a dedicated busway along particular segments of the corridor, requiring major right-of-way acquisition, likely funded through a corridor improvement authority (CIA). These lanes would allows buses to bypass congestion along much of the route, bringing major reliability gains.
Phase One and Two, plus:
• Acquire right-of-way and construct new bus-only lanes as feasible
These recommendations require intensive, ongoing cooperation among Washtenaw’s diverse stakeholders. The challenge of reducing bus delay, using limited right-of-way without further delaying other traffic, can only be overcome through careful planning and long-term investments. Fortunately, the close working relationship established by the Re-Imagine Washtenaw Joint Technical Committee provides a strong institutional foundation for this process.
CHAPTER 1
The Washtenaw Corridor
Let’s Roll: Reimagining Transit on Washtenaw Avenue
Chapter 1 The Washtenaw Corridor
INTRODUCTION
Linking the city centers and universities in Ann Arbor and Ypsilanti, Washtenaw Avenues’ five lanes carry tens of thousands of travelers daily. Public transit ridership on the Ann Arbor Transpotation Authority’s Route 4-Washtenaw bus line, the most-used in the system, reached an all-time high of 885,490 riders in 2011,1 accounting for approximately seven percent of travelers in the corridor.2 In January 2012, AATA doubled peak-hour bus frequencies along the corridor in response to growing demand. This frequency increase, combined with AATA’s potential countywide expansion should further boost ridership in the coming years. However, vehicular congestion creates particular difficulties for transit riders. Route 4 reliability has historically been poor, adding delays to a trip which, at a total 45 minutes from end to end, cannot compete with driving on the basis of time alone.
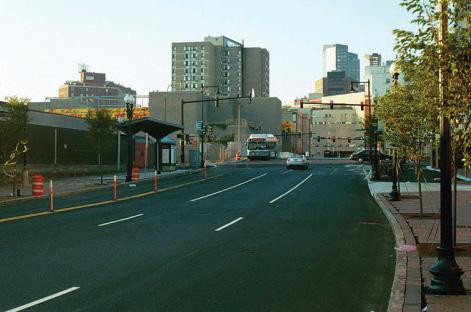
Figure 1.1: Heavy traffic on westbound Washtenaw, in Ann Arbor west of US-23, during the morning rush hour.
Accelerating transit along Washtenaw would be a priority on the basis of ridership alone, but plans for transit-oriented redevelopment make it especially imperative. The Re-Imagine Washtenaw initiative, a collaborative planning effort initiated by the County, seeks enhanced transit that will catalyze mixed-use redevelopment along the corridor, just as roadway investments helped transform Washtenaw from a rural road to a major commercial center over the previous century. As Ann Arbor’s service-oriented economy expands, the sustainability of the county at large relies on increasing transit access from points eastward.
Transforming Washtenaw transit, however, requires attention to a number of challenges. To reduce delay and make transit travel competitive with driving, transit vehicles must be able to bypass congestion. Yet the tightly limited existing rightof-way on Washtenaw makes this a difficult task without compounding congestion further by removing general traffic lanes on the busiest segments of the corridor. In addition, providing safe and comfortable access to transit will require a complete pedestrian and bicycle network on a road that frequently lacks basic sidewalks, adequate crossing facilities and bicycle infrastructure.
All of these challenges can be overcome with time, money, and the willingness to plan collaboratively. An increasing number of U.S. regions have implemented measures to reduce bus delay and improve overall service as part of a unified package of enhancements called Bus Rapid Transit, which can offer the quality transit typically associated with rail systems at a fraction of the cost. This study reviews these measures, outlines recommendations for the Washtenaw corridor, and sets forth a three-phase plan for implementing Bus Rapid Transit on Washtenaw over a period of years, based on an analysis of the Washtenaw study area and a detailed inquiry
Chapter 1 The Washtenaw Corridor
into the causes of bus delay. This chapter assesses the current state of the Washtenaw corridor to provide a foundation for this plan.
Chapter 1 The Washtenaw Corridor
CORRIDOR CONDITIONS
Corridor History
Until the mid-20th century, farmland lined most of Washtenaw Avenue’s eight miles between Ann Arbor and Ypsilanti.
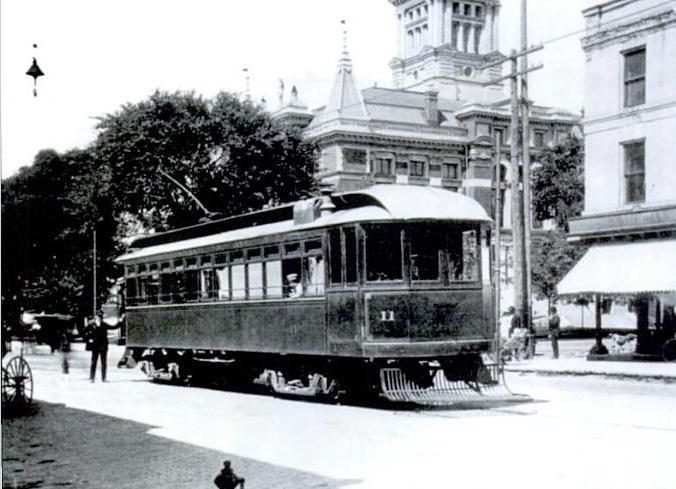
Interurban trolleys like the one shown in Figure 1.2, plied rails along Washtenaw from 1891 to 1963. However, as their name suggests, these served through traffic between Ann Arbor, Ypsilanti and cities east and west. They did not foster development along the corridor between them.
Figure 1.2: “Ypsi-Ann” Interurban trolley, Downtown Ann Arbor, 1901
Source: Hildebrandt and Churchill, 2009
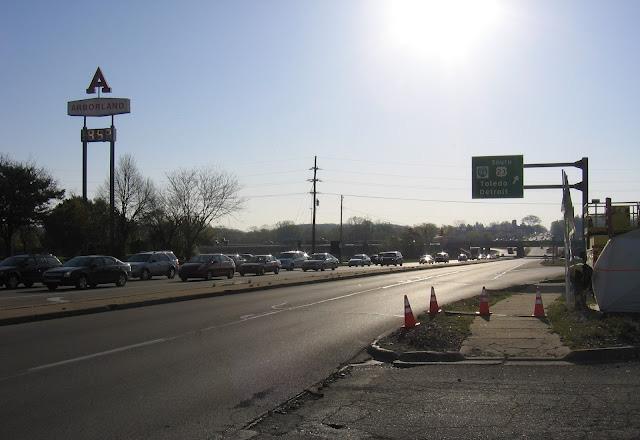
Postwar investment in automobile infrastructure catalyzed Washtenaw’s rapid development. Developer A. Alfred Taubman completed Arborland Center, the county’s first major mall, in 1961.3 As seen in Figure 1.3, its red “A” sign would beckon motorists along adjacent US-23, which opened a direct link between Washtenaw and the new I-94 expressway one year later. Smaller auto-oriented retail strips filled much of the corridor’s remaining length.
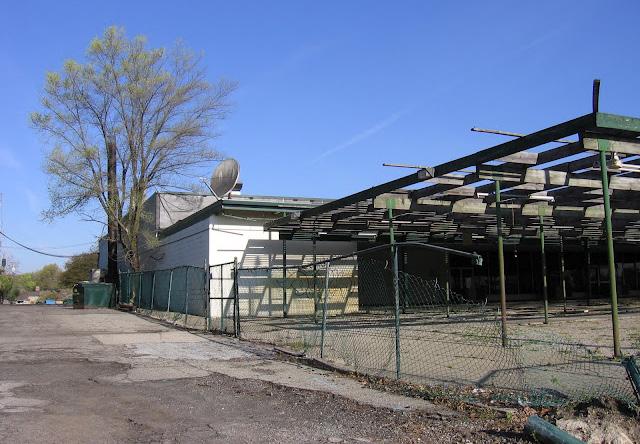
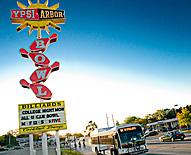
Over the last decades of the century, the area between Ann Arbor and Ypsilanti continued to gain more housing, but new commercial development elsewhere sapped Washtenaw’s former retail strength as demonstrated by Figure 1.4. Within Ann Arbor, the real estate market is robust, as demonstrated by the reconstruction of Arborland, the construction of Huron Village and the proposed Arbor Crossings. However, east of US-23, the real estate market is somewhat weaker. The 2011 closing of the iconic Ypsi-Arbor Lanes bowling alley, shown in Figure 1.5, symbolized the passing of the corridor’s first, postwar commercial phase.4
Chapter 1 The Washtenaw Corridor
Source: Concentratemedia.com, 2010
Figure 1.3: Washtenaw Avenue at US-23 and Arborland Mall
Figure 1.4: Underused Commercial Property on Washtenaw
Washtenaw Avenue connects the major employment and educational assets of the County. The campuses of the University of Michigan and Eastern Michigan University are situated adjacent to the historic downtown cores of Ann Arbor and Ypsilanti, respectively. The University of Michigan and the University of Michigan Health System, located along Route 4, employ the most people within Washtenaw County.5 Eastern Michigan University is also a top employer.6
The Washtenaw study area, from Stadium to Cross, consists primarily of late 20th-century auto-oriented development. Most development fronting the corridor is one-story strip commercial, including large centers like Arborland and smaller commercial properties, interspersed with some residential dwellings. Flanking the corridor are relatively dense residential neighborhoods, consisting primarily of single-family homes (Figure 1.6) and large apartment complexes (Figure 1.7) in the townships. Figure 1.8 shows this particular mix of land uses.
Figure 1.8: Land Uses along and near the Washtenaw Avenue
Land Use by Parcel, Washtenaw
Land Use by Parcel
Data source: City of Ann Arbor
Chapter 1 The Washtenaw Corridor
Typical Development along the Washtenaw Corridor
Despite relative consistency in design characteristics along its length, the Washtenaw corridor is highly diverse in other respects. Businesses range from big-box national retail chains to small independent businesses, and the population includes a wide spectrum of students, professionals and working families. Figures 1.9 and 1.10 illustrate the different types of commercial development along Washtenaw. The Ann Arbor portion of the corridor is higher-income, with an average median income of $64,437 in census tracts west of US-23.7
Meanwhile, census tracts east of US-23 have an average median income of $50,829.8 Municipal planners indicate that affordable real estate and housing makes the area an attractive home for immigrants, who own a number of local businesses,9 a number of which are shown in Figure 1.11.
Figure 1.9: Large Commercial Development, Ann Arbor.
Figure 1.10: Small Strip Commercial Development, Ann Arbor.
Chapter 1 The Washtenaw Corridor
Figure 1.11: Global Mix of Eateries
Chapter 1 The Washtenaw Corridor
CORRIDOR GOVERNANCE
Figure 1.12: Municipal Boundaries
Data source: Jurisdiction file from TIGER.
Pittsfield Charter Township
Pittsfield Charter Tow nship
Pittsfield Charter Township
Ypsilanti Charter Township
Ypsilanti Charter Township
Ypsilanti Charter Township
Chapter 1 The Washtenaw Corridor
Corridor Jurisdiction and Stakeholders
Public investments in transportation infrastructure helped transform Washtenaw from rural road to busy commercial strip, and have the potential to reshape the corridor once again. However, a wide variety of public actors have jurisdiction over its elements. The roadway itself is the property of the Michigan Department of Transportation (MDOT), which refers to Washtenaw as state trunkline M-17.
The cities of Ann Arbor and Ypsilanti maintain the road and its traffic signals under a Memorandum of Understanding with MDOT, while the Washtenaw County Road Commission (WCRC) does so within the Ypsilanti and Pittsfield townships.
The Ann Arbor Transportation Authority communicates regularly with these units of government, although it has no formal role in corridor management. Long-term transportation planning responsibilities for the corridor rest with the Washtenaw Area Transportation Study (WATS), the County’s transportation planning organization, while local governments hold zoning power.
The interests of these stakeholders vary. In general, MDOT prioritizes motor traffic flow more than local jurisdictions, which are more likely to seek improvements in pedestrian
and bicycle accessibility, as well as new development on the land they govern. However, all have worked closely for years, and they have cooperated more formally since MDOT’s initiation of the Washtenaw County Access Management Plan, completed in 2008. Like those prepared for other state trunklines, the plan focused on reducing the number of access points (commercial driveways) along Washtenaw. In response to local interest, it also noted potential transit, pedestrian, and bicycle improvements, and the potential for transit-oriented redevelopment at nodes such as the US-23 interchange.
Meanwhile, the 2008-9 preparation of the Ann Arbor Region Success Strategy by local public and private sector leaders stimulated County interest in redeveloping the Washtenaw corridor. Under the Re-Imagine Washtenaw initiative, the County convened the four municipalities, shown in Figure 1.12, and MDOT, as well as other public and private stakeholders, to discuss coordinated, transit-oriented corridor redevelopment.
The resulting 2009 Re-Imagine Washtenaw vision report established a Joint Technical Committee (JTC) to explore implementation options, including coordinated zoning and creation of a Corridor Improvement Authority (CIA). Legislation to establish a Corridor Improvement Authority, which would
Chapter 1 The Washtenaw Corridor
allow tax-increment financing (TIF) for redevelopment, was introduced in the 2011-2012 Michigan State Legislative Session but without crucial interest from lawmakers has languished in committee. The JTC continues to meet monthly. It provides a forum for inter-municipal cooperation, and has drawn significant federal attention, as recognized in major grants for more frequent bus service ($2.6M), from the Federal Transit Administration, and overall corridor sustainability ($3M), from the Department of Housing and Urban Development’s Sustainable Community Initiative.
All the major actors along the corridor agree that Washtenaw must do a better job accommodating all modes of transportation. At present, however, Washtenaw Avenue itself continues to reflect its history of planning for automobiles alone.
“Washtenaw Avenue is the primary transportation corridor linking the region’s job and education centers, the City of Ann Arbor and the City of Ypsilanti. Existing land use practices along this five-mile stretch have resulted in a sprawling and congested, auto-centric development pattern limiting the ability to provide the high quality of place residents and visitors expect. The City of Ann Arbor, Pittsfield Township, Ypsilanti Township and the City of Ypsilanti recognize that Washtenaw Avenue has potential to be transformed using smart growth and transit- oriented development (TOD) principles.”
Within the study area, Washtenaw Avenue has a standard fivelane cross-section, including four through lanes and a center turning lane. Raised concrete medians separate traffic along the segment near Arborland between Chalmers and US-23, as well as at either end of the study area, at Stadium and Cross. Posted speed limits vary from 35 to 45 mph, although MDOT and the Michigan State Police are proposing to increase speed limits on the lower-speed sections east of US-23.10 Table 1.1 shows the current characteristics of the roadway.
The corridor contains eleven signalized intersections, as well as a large number of intersecting streets and driveways. An additional signal may also be installed at Platt in the near term. The 2008 Washtenaw County Access Management Plan recommends gradual consolidation of commercial driveways along the corridor to reduce traffic conflicts from turning vehicles. Most do not meet its standard that driveways be placed at least 230 feet from intersections on 40 mph speedlimit roads.11
Table 1.1 : Roadway Segment Characteristics
Chapter 1 The Washtenaw Corridor
Automobile Traffic Conditions
Washtenaw Avenue is among the most-travelled and most congested roads in the Ann Arbor-Ypsilanti area. The chief bottleneck is the study area’s western segment, which provides access to Ann Arbor via the US-23 interchange.
Figure 1.13 illustrates the traffic volumes in the corridor. Carrying nearly 40,000 motor vehicles per day, several segments, particularly around US-23 currently receive a Level of Service (LOS) grade of “D” or “E” during peak time. These grades are shown in Figure 1.14 and indicate operation at full capacity. East of Carpenter, however, Washtenaw carries less than 30,000 vehicles per day, and receives an LOS grade of “A” or “B,” indicating reasonably free flow of traffic. The Washtenaw study area also includes some of the highest-crash intersections in the county, including Carpenter-Hogback and Golfside which average thirty-nine and forty-four crashes per year, respectively (see Figure 1.15).12
Chapter 1 The Washtenaw Corridor
Chapter 1 The Washtenaw Corridor
1.14(a): Peak Time Level of Service on the Corridor (Eastbound)
1.14(b): Peak Time Level of Service on the Corridor (Westbound)
Data source: Washtenaw Area Transportation Study, 2011.
Figure
Figure
Chapter 1 The Washtenaw Corridor
Figure 1.15: Average Annual Automobile Crashes in Study Area, 2006-10.
Data sources: Jurisdiction file from TIGER. Crash data from the Greenway Collaborative, Inc. Washtenaw Avenue Corridor Non-motorized Transportation Study. (2010).
City
City
Pittsfield Charter Township
Chapter 1 The Washtenaw Corridor
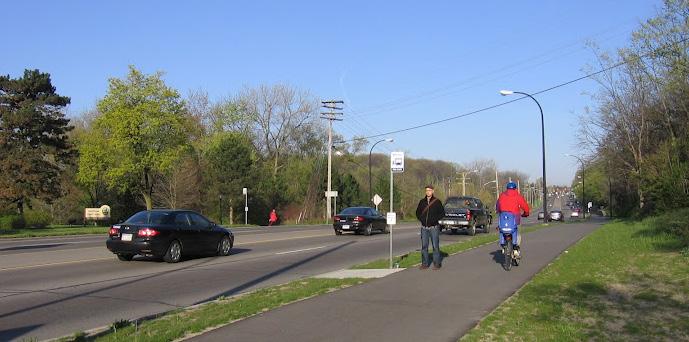
1.16: Bicyclist on Multi-use Path, Washtenaw and Platt Bicycle Facility and Traffic Conditions
Dedicated bikeways along Washtenaw within the study area are minimal. Asphalt shared-use paths now parallel the roadway on either side at the western end of the study area, between Stadium and Platt. Although the 2007 Ann Arbor
Non-Motorized Transportation Master Plan recommends instreet bicycle lanes along Washtenaw between Huron Parkway and Yost, the limited right-of-way bars implementation of preferred minimum-width 5’ bicycle lanes, which do not exist anywhere within the study area. Off-street paths along Huron Parkway and Hewitt (part of the County Border-to-Border Trail) provide connections to the north.
Limited data exists on bicycle traffic in the corridor. Although the Border-to-Border Trail provides a parallel northern route for long-distance bicycle travel between Ann Arbor and Ypsilanti, it is too distant to provide a convenient alternative route for travel within the corridor itself. To the south, Packard Road also lacks bicycle facilities. As a result, Washtenaw will continue to be the east-west route of choice for local bicycle traffic within the corridor, despite the poor level of service it currently provides.
Over the long term, additional protected bicycle infrastructure along the corridor, such as cycle tracks or extended off-street paths as shown in Figure 1.16 would greatly facilitate eastwest access in the area. This would require overcoming rightof-way issues and planning to avoid conflicts with turning motor traffic. Another future opportunity is the southwest extension of the existing rail trail between Hewitt and Oakwood, over the abandoned Ypsilanti-Saline railroad rightof-way, which crosses Washtenaw east of Golfside, adjacent to the Fountain Plaza mall. This trail would provide a valuable connection through Pittsfield Township to the Carpenter Road commercial corridor. Improved bicycle access to and along Washtenaw would also enhance transit.
Figure
Pedestrian Facilities
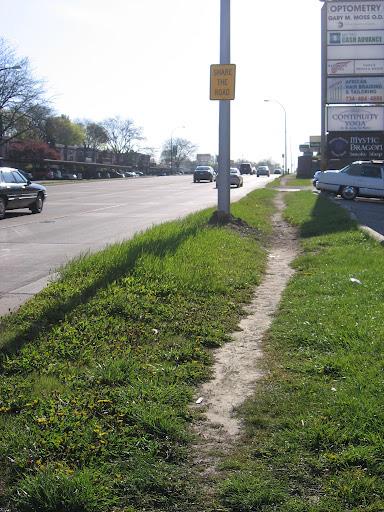
Despite the volume of transit and pedestrian activity on Washtenaw, the 2010 Washtenaw Avenue Corridor NonMotorized Transportation Study characterized the pedestrian facilities as poor.13 Sidewalks are intermittent in the more recently developed parts of the study area, especially on the south side of Washtenaw between Platt and Mansfield, although well-trodden trails testify to substantial pedestrian traffic, such as the informal trail in Ypsilanti seen in Figure 1.17. Sidewalk deficiencies in this area have resulted in closer bus stop spacing, as shown in Figure 1.18.
However, all local governments recognize the need for completing the sidewalk network. Pittsfield Township recently filled the sidewalk gaps on the north side of Washtenaw within its jurisdiction. MDOT will include new multi-use paths under US-23 in an upcoming interchange improvement project. The key task is identifying funding for the remaining gaps, since few local governments have a dedicated funding source for new sidewalk construction.
The American with Disabilities Act requires sidewalks to feature curb ramps with red “warning strips” or truncated domes to warn visually impaired people that they may encounter oncoming traffic.14 Many intersections on Washtenaw, however, especially east of Goldside, lack ramps as well as ADA warning strips, as shown in Figure 1.19. The well-worn ground demonstrates intensive pedestrian usage, often from the heavily used bus stop nearby yet neither sidewalks nor curb ramps are provided.
Figure 1.19: Intersection of Washtenaw and Golfside, Lacking Sidewalks and Curb Ramps
Chapter 1 The Washtenaw Corridor
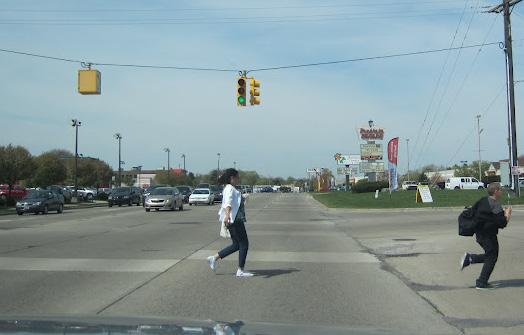
Crossing Washtenaw is a particularly dangerous endeavor for pedestrians, since marked crosswalks are few and far between. In Figure 1.20 pedestrians scramble across Washtenaw at the Fountain Square entrance drive, a signalized intersection lacking pedestrian crossing facilities. Along three segments of the study area, crosswalks are more than one-half mile apart, four times the one-eighth mile spacing required for convenient use.15 Most signalized crosswalks must also be activated by pedestrians, resulting in longer waiting periods for crossing.
Two signalized intersections on Washtenaw, at Yost (adjacent to Arborland) and Fountain Plaza, currently omit pedestrian crossing facilities altogether. Two others, at Pittsfield and the Glencoe Crossing entrance drive, include pedestrian crossings of Washtenaw on only one side of the intersection. This omission is particularly hazardous at Arborland, since it requires bus riders to wait at three different signalized crossings to reach the eastbound (south side) bus stop from Arborland, though the City of Ann Arbor plans to add a fourth crosswalk over the coming year. In practice, most bus riders simply cross against vehicle traffic.
Chapter 1 The Washtenaw Corridor
Finally, a mid-block crossing between Platt and Arlington shown in Figure 1.21, at the County Recreation Center, currently lacks a median island or lighting, making it an unusually difficult crossing, even for Washtenaw. It is likely to be removed if a new signal with pedestrian crossing is installed at Platt.
Figure 1.20: Washtenaw and Fountain Square Entrance Drive
Figure 1.21: Unsignalized Mid-block Crossing Near Platt.
Given the rate of informal crossing, serious pedestrian-vehicle crashes on Washtenaw are a virtual certainty as shown in Figure 1.22. The pedestrian injury rate in vehicle-pedestrian crashes at speeds of 36-45 mph is roughly 63%, and the fatality rate roughly 23%.16 The most recent pedestrian fatality on Washtenaw was a 54-year-old man struck and killed when crossing near the unsignalized Fountain Plaza intersection at midday.17 Thankfully, pedestrian and bicycle fatalities have been relatively rare on Washtenaw in recent years, but there is a clear imperative to improve facilities to prevent more such tragedies and provide a safe, comfortable environment for all road users. Pedestrian facilities are also a vital precondition for enhanced transit.
Chapter 1 The Washtenaw Corridor
Chapter 1 The Washtenaw Corridor
Figure 1.22 Pedestrian and Bicycle Crashes on Washtenaw, 2004-2009
Data source: The Greenway Collaborative.
Chapter 1 The Washtenaw Corridor
AATA Route 4 Conditions
The preceding descriptions provide context for the primary subject of this study, the Ann Arbor Transportation Authority’s Route 4-Washtenaw bus. Route 4 carries more people than any other AATA route (Figure 1.23), averaging nearly 4,000 riders per weekday.18
As shown in Figure 1.24, Route 4 provides the most direct connection between the AATA system’s two hubs, the Blake
Transit Center in downtown Ann Arbor and the Ypsilanti Transit Center in downtown Ypsilanti, as well as the “third hub” of the UM Central Campus Transit Center (CCTC). At present, the route has two variations: 4A, which spans 9 miles and serves the University of Michigan Medical Campus, and 4B, which provides a more direct 8-mile connection to downtown Ann Arbor through the Central Campus Transit Center. Both follow the same route through the study area.
Data source: AATA.
Figure 1.23: Average Weekday Ridership for Route 4 and Other AATA Routes
Chapter 1 The Washtenaw Corridor
Route 4 boasts the most frequent service in the AATA system. Since January 2012, thanks to a $1.7 million federal grant, Route 4 buses have run even more frequently, alternating between 5- and 10-minute headways (spacings) during weekday peak hours (6-9:30 AM and 3-5:30 PM). Weekend service is far less frequent, and as with the rest of the AATA system, does not extend past 5:30 pm.
Stops averaging higher numbers of boardings typically include shelters, benches and bus schedules, but in some cases, given the limited right-of-way and frequent sidewalk gaps, stops may consist simply of a freestanding sign, unattached to a concrete bus pad. Figure 1.25 shows the stop conditions along Route 4. A transfer station existed on the Arborland Mall property until the mall terminated its lease with AATA in 2009,19 forcing relocation of the stops to Washtenaw at Pittsfield. AATA constructed a new bus pullout there with federal stimulus funds, and plans future construction of a distinctive shelter, although the absence of a signalized pedestrian crossing of Washtenaw on the west side of Pittsfield impedes access to the mall.
Figure 1.25: Bus Stop Amenities on Route 4 Corridor
As with other major AATA routes, Route 4 primarily serves commuters to UM and downtown Ann Arbor. Nearly half of all 2011 riders were UM community members, whose MCards provide them with unlimited free access to AATA under a contract between the two organizations. Twelve percent of riders used a go!pass, which provides unlimited access subsidized by the Ann Arbor Downtown Development
Chapter 1 The Washtenaw Corridor
Authority and participating downtown employers. Seven percent of riders paid using a transfer from another bus, though the MCard and go!pass users may include transfers as well. Figure 1.26 summarizes the breakdown of payment methods.Because of the high proportion of student riders, ridership varies significantly according to academic schedules.
Figure 1.26: AATA Route 4 riders by Payment Method
Chapter 1 The Washtenaw Corridor
Due to the prevailing east-to-west commute pattern, westbound buses have high ridership; morning ridership on eastbound buses is sparse. The stops at Golfside and Pittsfield have the most daily boardings as shown in Figure 1.27.
1.27(a): Average Daily BoardingsRoute 4 (Westbound)
Passengers (getting on per day)
Passengers (getting on per day)
Passengers (getting on per day)
Figure
Figure 1.27(b): Average Daily BoardingsRoute 4 (Eastbound)
Data source: AATA.
Data source: AATA.
On-Time Performance
Like other vehicles, AATA buses frequently face delays due to congestion along Washtenaw. The buses are equipped with Automatic Vehicle Location (AVL) systems that enable communication between the bus and the dispatch center at AATA headquarters. AATA monitors on-time performance by evaluating arrival times at nine locations. A bus is defined as on-time if it arrives within five minutes of schedule.
Chapter 1 The Washtenaw Corridor
Figure 1.28: On-time Performance Percentage by time of dayRoute 4
Route 4 On Time Performance Percentage: Eastbound
Eastbound
Weekday AM peak travel experiences favorable on-time performance in both directions. However, performance is less reliable on mid-day and PM peak runs. The servicefrequency increase, effective January 2012 significantly increased on-time performance over the few months since its implementation as shown in Figure 1.28. With rush-hour riders distributed across more buses boarding and alighting is quicker. Over time, however, increased frequency could foster greater ridership and lead to crowded buses once again.
Among the highest ridership routes in the AATA system, Route 4 performs about average for on-time performance (Figure 1.29).
Westbound
Route 4 On Time Performance Percentage: Westbound
Data Source: AATA
Chapter 1 The Washtenaw Corridor
On Time Performance of AATA High Ridership Routes ( From Downtown)
Figure 1.29 AATA On-Time Performance by Percentage, Selected Routes
On Time Performance of AATA High Ridership Routes (To Downtown)
As stated in the Re-Imagine Washtenaw Implementation Strategy, a revitalized Washtenaw requires “increasing residential density, improving walkability, and supporting and providing a higher level of public transit service.” In effect, the corridor must be redesigned around the principle of transit access, rather than automobile access alone. Over time, more travelers can be expected to choose transit and other automobile modes, as many are already doing today.
This transition will take time. In the near term, automobile capacity on Washtenaw cannot be significantly reduced without worsening congestion, particularly west of US-23. The challenge before the area is improving transit along Washtenaw, as well as pedestrian and bicycle access, without adversely affecting automobile travel. To expedite AATA transit service, however, the sources of transit delay must first be understood.
Chapter 1 The Washtenaw Corridor
NOTES
1 Ann Arbor Transportation Authority.(2012)Ridership Data.
2 Washtenaw County and the Washtenaw Avenue Action Team. (2009). Re-imagining Washtenaw Avenue: A Vision for Corridor Redevelopment.
3 Lance, L. (2009, June 18). Arborland’s Bumpy Bus Ride. The Lucy Anne Lance Show. Retrieved from http://lucyannlance.com/?p=915.
4 Ochoa, W. (2011, April 25). Ypsi Arbor Lanes to Close after 47 Years. Washtenaw Voice. Retrieved from http://www.washtenawvoice.com
5 Crain’s Detroit Business. (2012, January 22). Crain’s List: Washtenaw County’s Largest Employers. Retrieved from http://www.crainsdetroit.com
6 Crain’s Detroit Business. (2012, January 22). Crain’s List: Washtenaw County’s Largest Employers. Retrieved from http://www.crainsdetroit.com
7 U.S. Bureau of the Census. (2010). Median Income in the Past Twelve Months (In 2010 Inflation-Adjusted Dollars) –ACS 5 Year Estimates [Data File]. Retrieved From http:// factfinder2.census.gov/faces/nav/jsf/pages/searchresults.xhtml
8 U.S. Bureau of the Census. (2010). Median Income in the Past Twelve Months (In 2010 Inflation-Adjusted Dollars) –ACS 5 Year Estimates [Data File]. Retrieved From http:// factfinder2.census.gov/faces/nav/jsf/pages/searchresults.xhtml
9 Gillotti, T. (2012). Personal Interview. March 20, 2012.
10 Lawson, J. (2012). Personal Interview. March 20, 2012.
11 Washtenaw Area Transportation Study. (2008). Washtenaw County Access Management Plan.
12 Southeast Michigan Council of Governments. (2012) SEMCOG Transportation Data Map. Retrieved from http://www.semcog.org/Data/Maps/roads.map.cfm.
13 The Greenway Collaborative. (2010). Washtenaw Avenue Corridor Non-Motorized Transportation Study. Retrieved from http://www.greenwaycollab.com
14 United States Department of Justice. (2010). ADA Standards for Accessible Design. Retrieved from http://www.ada.gov/regs2010/2010ADAStandards/2010ADAStandards.
15 AARP Policy Institute. (2009). Planning Complete Streets for an Aging America. Retrieved from http://assets.aarp.org/rgcenter/ppi/liv-com/2009-12-streets.pdf
16 Perkins, T. (2012, April 2). Speed limits to increase along several Ypsilanti area roads. AnnArbor.com. Retrieved from http://www.annarbor.com/news/
17 Lockwood, H. (2010, October 11). Pittsfield Police Investigate Crash that Killed Man Crossing Washtenaw Avenue. AnnArbor.com. Retrieved from http://www.annarbor.com/ news/.
18 Ann Arbor Transportation Authority.(2012). Ridership Data.
19 Baker, J. (2011, November 14). Construction Under Way for New AATA Bus Pullout on Washtenaw near Arborland. AnnArbor.com. Retrieved from http://www.annarbor.com/news/.
Options for reducing transit delay along Washtenaw depend on understanding the sources and locations of delay and their relative contribution to irregularity in on-time performance. Existing data proved insufficient to provide this understanding, so the project team conducted a study, using direct measurement and observation, to determine the primary causes and locations of delay. The results of the study inform the recommendations that follow this chapter.
METHODOLOGY
Between January 23 and February 15, 2012, the project team took a total of 12 round trips for delay data collection on Route 4. The team attempted to target different times of day to determine whether potential sources of bus inconsistency varied during different travel periods. Four of these trips occurred during the AM peak travel period, between 7:00 and 9:00 AM. Another four took place during the early afternoon, between 12:00 and 2:00 PM. The remaining four trips took place during the PM peak travel period, between 4:30 and 6:30. Six total trips were taken before AATA increased frequency of Route 4 service, and six after the change.
In order to collect data about the progress of the bus en route, the team used the smartphone global positioning system (GPS)-based application My Tracks™ for both Android and iPhone, which automatically recorded the speed and position of the bus every second. In addition, the team assessed delays at particular stops and traffic lights by manually adding points into the software when appropriate. From the software, quantitative data on schedule inconsistencies observed at particular points, and bus movement along different segments of the corridor, were obtained. These data reveal information on delays related to physical infrastructure for buses, as well as the volume and nature of other traffic on the road at a particular time.
The team also noted observations of passenger payment methods and loads, as well as any unusual circumstances encountered en route and at stops.
Chapter 2 Bus Delay Analysis
POINTS OF BUS DELAY
The study examined the delays at particular stops and intersections to determine potential sources of inconsistency and variation throughout the day. The goal was to determine the effect that time spent at stops and red lights might have in creating inconsistencies in travel time across different runs.
Red Lights
The bus spent a significant amount of time at red lights near key intersections. Red lights at Huron Parkway, Carpenter Road, Golfside Road, Hewitt Road, and Mansfield Road led to the highest average stopped time for buses during all three time periods (Figure 2.1, 2.2 and 2.3). In addition to demonstrating high red light stopping times, the intersections at Golfside, Huron, and Carpenter intersections are also areas of high dwell times, leading to long delays for the bus at these locations. During the afternoon peak, the stops at Arborland Mall (Yost) also faced a high average red light delay.
At both Golfside and Arborland (Yost), the presence of stop pullouts and traffic lights create further delays for the bus. On several occasions spanning the three time periods, the
team observed situations where the bus got caught at the same traffic light twice in one run because of the inability both to access and exit from this pullout. This was a problem in particular on the westbound route during the afternoon peak because these stops are on the nearside of the intersection. The bus is unable to clear the intersection and then make a stop, potentially keeping it out of motion for multiple signal cycles.
Traffic signals are a necessary part of controlling movements, particularly as the bus operates in mixed traffic. Traffic signals operate on designated cycles, and on their own are not sources of inconsistency. When added to more unpredictable events such as increased dwell times, construction or congestion, however, they can create a source of frustration for riders in the bus.
Multiple delays at these problematic points can compound to ensure that the bus faces potential inconsistencies along particular segments of the corridor. The next section addresses the performance of the bus along these segments.
Figure 2.2: PM Peak Bus Traffic Light Delay on the Corridor Data source: AATA.
Chapter 2 Bus Delay Analysis
Dwell Time at Stops
Dwell time is the amount of time that the bus spends out of motion at a particular stop. Delays may occur at stops due to boarding and alighting; in particular, people struggling to find exact change, malfunctioning fare cards, bicycle loading, wheelchair boarding, or confusion over route stops can lead to delays in getting the bus back into motion. In addition, despite a policy of rear door alighting, some passengers still alight from the front door, creating a jam and preventing the bus from continuing on the route. The team observed these issues with boarding and alighting frequently during the trips, and at numerous stops along the route.
As the maps of dwell times (Figures 2.4 and 2.5) depict, the longest average dwell times at stops on Route 4 occurred at Huron Parkway, Arborland Mall (Pittsfield Boulevard/Yost), Golfside, Carpenter, and Hewitt. This pattern showed little variation during different times of day. The long dwell times at Arborland and Golfside (in the westbound direction) result in part from the bus pullouts that require the bus to re-enter traffic upon completion of boarding and alighting. During peak times, the bus was often unable to reach these pullouts, and when it finally did, it was stalled in returning to traffic.
Not all dwell times constitute a source of schedule irregularity, and at certain points, a longer dwell time might help the bus maintain a consistent schedule. The Arborland Mall, Golfside, and Carpenter stops are all “time points”, where the bus waits to adjust to schedule if it finishes boarding and alighting prior to published departure time. Thus, long dwell times at these points could potentially augment customers’ perceptions of reliability, since they know that if they show up at the bus stop before or at the published time, they will not miss the bus. Nevertheless, delay reduction measures could ultimately allow AATA to establish new schedules for Route 4. These measures would anticipate reduced dwell time and allow customers to arrive at their destinations more quickly, with less potential inconsistency from one day to the next.
Chapter 2 Bus Delay Analysis
2.4: Peak Bus Dwell Time on the Corridor
Eastbound
Westbound
Figure
Figure 2.5: Off-peak Bus Dwell Time on the Corridor
Chapter 2 Bus Delay Analysis
Eastbound
Westbound
Chapter 2 Bus Delay Analysis
SPEED AND MOVING DELAY
This study also examined the speed of the Route 4 buses throughout the Washtenaw Avenue corridor to determine particular road segments that degrade reliability. The study seeks to show both the congestion delay and the variation in speed across the corridor during different times of day.
Inconsistencies in Motion
Beyond time stopped at traffic lights and bus stops, the Route 4 bus also encounters delays while in motion. Traffic congestion, emergency situations, and road work might force the buses to operate at speeds slower than planned, even away from intersections and stops. While traffic light cycles and boarding/alighting times might stay relatively constant, delays away from these points can be more unpredictable. In particular, slow-moving buses can be a source of frustration and perceived delay for riders on board, even in cases where the bus arrives at its next scheduled stop on time.
This delay study defined “moving delays” as any situation
where the bus is progressing at less than 20 miles per hour for more than 5 seconds at a time. This speed is less than 50% of the speed limit throughout much of the corridor, from Huron to Hewitt. The study then calculated moving time delay as the difference between travel time at the actual operating speed, and the time the bus would have taken to travel the distance had it moved at 20 miles per hour.
The study excluded the areas immediately around signalized intersections and bus stops to account for normal acceleration and deceleration, and also to avoid double-counting the “out of motion” time discussed in the previous section. During the rides in the study, the team did not encounter any roadway accidents or construction, so the study isolates vehicular congestion as the main determinant of the moving bus’s speed along Washtenaw Avenue.
Moving delay varies little across bus trips in a given direction (Tables 2.1, 2.2, and 2.3), though westbound delays are significantly greater than eastbound delays.
2.1:
Chapter 2 Bus Delay Analysis
Even during the AM Peak period in the direction of Ann Arbor, when workers and students were commuting to town, the variation in moving delay times was relatively small, less than one minute (Table 2.1).
The mid-day trips show higher variability in delay (Table 2.2), despite not taking place during the heaviest commuting periods. This situation may be due to the higher variability in the number of vehicles on the road during mid-day as compared with the AM and PM rush hours. Total vehicle trips during rush hour may be more predictable because of regular work commutes. During mid-day, however, drivers may take infrequent, as-needed trips to retail destinations or one of the two downtowns. From one day to the next, the bus may encounter different levels of congestion, making it difficult for the bus to establish a consistent travel time during these hours. Any measures to improve the reliability of Route 4 must take into account sources of inconsistency during these times, and not just peak periods, in order to improve the route’s overall reliability.
Table
Moving Delay for the AM Peak Period
Table 2.2: Moving Delay on Mid-Day Trips
Chapter 2 Bus Delay Analysis
While afternoon peak trips to Ann Arbor still faced significant moving delay, these delays had the smallest variations of all trip times (Table 2.3). Given that vehicular traffic during the afternoon peak is generally flowing towards Ypsilanti, the smaller volume of traffic headed towards Ann Arbor may create more predictable, if still problematic, moving delay for Route 4 from one day to the next. In addition, the high level of variability in the direction of Ypsilanti during the afternoon peak may be due to one run where moving delays were far longer than the other three.
2.3: Moving Delay for Afternoon Peak Trips
Though the areas immediately around intersections were removed from the analysis, the bus still experienced its largest areas of slow speed as it neared or departed from these points. As with traffic light delay, the bus saw slow speeds near Huron Parkway, Yost Boulevard, Carpenter Road, Golfside Road, and Hewitt Road. The team observed that during peak periods, the US-23 intersection was particularly problematic because the bus could get stuck behind traffic waiting to pull onto the congested US-23. Traffic beyond Washtenaw Avenue acted to slow down the bus on these occasions. The next section addresses these multiple sources of delay as speed segments.
Speed Segments
As the sections above illustrate, dwell times, traffic lights, and congestion can combine to slow down the buses and together create inconsistencies in travel time in the long run. The following analysis of average speed attempts to show the segments between bus stops that face particular vulnerabilities to delay en route.
Table
Chapter 2 Bus Delay Analysis
To Ypsilanti
Figures 2.6, 2.7, and 2.8, show the average bus speeds along segments from Ann Arbor to Ypsilanti during the three times of day, respectively. During the afternoon peak period, the bus traveled at speeds averaging less than 15 miles per hour on several stretches, including the areas around Arborland and Hewitt (Figure 2.8). This is not surprising, since most traffic would be headed in this direction as people leave their jobs. The bus may not be able to accelerate to optimal speed during this time of day due to congestion.
The morning peak-time bus was able to operate at average speeds of greater than 25 miles per hour for more segments than even the mid-day runs (Figure 2.6), due to the lower flows of traffic traveling from Ann Arbor to Ypsilanti. The morning runs were also, on average, able to operate at higher speeds at the US-23 intersection than during the other two time periods, again likely due to reduced traffic and passenger stop demand at these locations.
Still, during all times of day, the buses slowed down at certain segments, regardless of the absolute operating speed. In particular, at the segments near Arborland (Pittsfield and Yost), Golfside, and Hewitt intersections and stops the bus slowed down during all three time periods. These consistently problematic areas suggest that they could benefit from improvements to roadway infrastructure, as well as stop design, to improve boarding and alighting times.
To Ann Arbor
Figures 2.9, 2.10, and 2.11 show the average speed between stops for the Ypsilanti to Ann Arbor route. There were no segments where, on average, the buses were travelling at less than 15 miles per hour during any time of day. The buses moved at lower speeds at similar locations to the Ypsilantibound routes, with the segments around Golfside, Hewitt, and Arborland (Pittsfield) again producing the lowest speeds. Once the buses passed Huron River Parkway, they operated at speeds greater than 25 miles per hour during all times of day.
2.7: Off-peak Bus Speeds Between Stops on the Corridor (to Ypsilanti)
Figure 2.6: AM Peak Bus Speeds Between Stops on the Corridor (to Ypsilanti)
Figure
Chapter 2 Bus Delay Analysis
Figure 2.8: PM Peak Bus Speeds Between Stops on the Corridor (to Ypsilanti)
Figure 2.9: AM Peak Bus Speeds Between Stops on the Corridor (to Ann Arbor)
Chapter 2 Bus Delay Analysis
2.10: Off-peak Bus Speeds Between Stops on the Corridor (to Ann Arbor) Data source:
2.11: PM Peak Bus Speeds Between Stops on the Corridor (to Ann Arbor)
Figure
Figure
Chapter 2 Bus Delay Analysis
Figure 2.12: Total Route 4 Travel Time on Corridor, by Bus Activity (both directions) PM Peak
AM Peak
(total time in corridor: 17 minutes)
(total time in corridor: 24 minutes)
(total time in corridor: 22 minutes)
Legend
Bus moving above 20 mph
Bus moving below 20 mph
Dwell time at bus stops
Traffic signal delay at stop lights
Bus waiting ahead of schedule
Intersections(stop light/stop
Chapter 2 Bus Delay Analysis
A SNAPSHOT OF BUS
TRAVEL
The pie charts in Figure 2.12 summarize the share of the total time that the bus spent in delays and in motion for each of the three travel periods. During both the off-peak and PM peak periods, the bus spent 11 minutes at traffic lights. In the afternoon peak, this amounted to half the total time the bus spent on the corridor. The second most significant source of delay in all three time periods was dwell time, and dwell time was higher for the peak period. In addition, the bus was only able to move at speeds above 20 mph for a miniscule portion of its time on route during the afternoon peak period, indicating that it encountered significant congestion and other delays. During the afternoon peak, the bus actually spent more time in “moving delay” than it did operating above 20 mph. The multiple delays encountered by the bus require both on- and off- roadway treatments in order to improve service reliability.
CONCLUSION
This bus delay analysis has shown how multiple factors can compromise the ability of Route 4 to establish reliable travel times along the corridor. Red lights contribute to the greatest share of the time that the bus spends en route, but fare payment and route orientation issues also lead to increased dwell times at stops. Due to congestion at peak travel times, the bus also encounters significant “moving delay”, and operates at less than 20 miles per hour for the majority of time that it is actually in motion. This analysis has identified key points and segments that could benefit from transit-related improvements at all times of day. Particularly problematic areas of the corridor include, but are not limited to:
• Huron Parkway
• Pittsfield Boulevard and Yost Boulevard (both intersections adjacent to Arborland Mall)
• US-23 and Carpenter Road
• Golfside Road
• Hewitt Road
Chapter 3 outlines potential treatments that could improve the physical mobility of the bus along Washtenaw Avenue, particularly during periods of vehicular congestion. The chapter also examines treatments that could increase perceptions of reliability, and emphasize Route 4 as a key transportation element on Washtenaw County’s busiest traffic corridor.
Chapter 2 Bus Delay Analysis
CHAPTER 3 Transit Improvement Toolkit
Let’s Roll: Reimagining Transit on Washtenaw Avenue
Chapter 3 Transit Improvement Toolkit
As the bus delay analysis in Chapter 2 discussed, the Route 4 bus spends nearly half its time in the corridor during the PM peak stopped at traffic lights. Slow movements due to congestion and inconsistent dwell times also degrade the reliability of the bus. These conditions are by no means unique to Washtenaw Avenue, and communities across the United States have developed measures to mitigate them. This chapter discusses transit improvement treatments in three broad categories:
• Intersection treatments reduce transit delays at traffic signals.
• Roadway treatments provide a clear path through congestion along larger stretches of the corridor.
• Expedited boarding treatments reduce inconsistencies in dwell times at transit stops.
Cities in the United States have implemented these measures on their own, or as part of broader packages to enhance transit and promote redevelopment in particular corridors. This chapter describes these treatments and experiences with them in other cities.
INTERSECTION TREATMENTS
Intersection treatments serve primarily to reduce the time transit vehicles spend at red lights. One means of doing so is reducing the red light delay through coordination of traffic signals with transit vehicles, or transit signal priority (TSP). An even more ambitious measure allows transit vehicles to “cut to the front of the line” at an intersection through a small separate lane, known as a queue jump or queue bypass lane.
Transit Signal Priority How it works
Transit signal priority (TSP) allows a transit vehicle approaching an intersection to reduce the amount of time it spends at the intersection by changing the traffic signal timings. Passive TSP reprograms traffic signal cycles according to scheduled times when a transit vehicle should pass the intersection. Cities in the United States, however, have so far primarily implemented active TSP.1
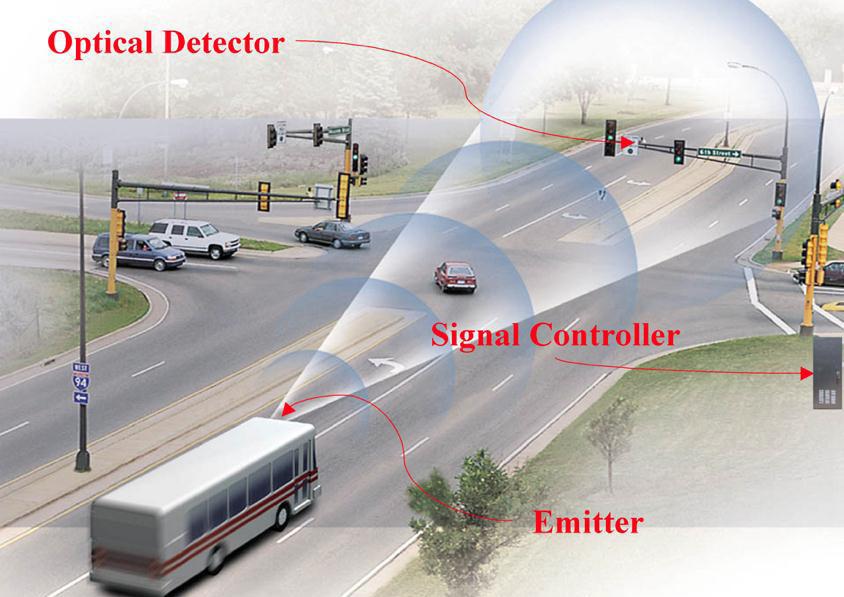
Under active TSP, a transmitter on the transit vehicle relays a signal to the traffic light at the intersection in one of three ways:
• to the traffic light directly through an optical detector.
• to a controller on the side of the road, which then passes on the priority request to the computerized traffic management system.
• to ‘smart loop’ sensors in the pavement near the intersection ahead, which then pass on the priority request to the computerized traffic management system.2
This signal will either tell the traffic light to hold a green phase for a few extra seconds to allow the bus to pass, or to reduce the time of the red phase to make sure that the bus does not spend a long time at the intersection. These mechanisms are known as green extension and red truncation, respectively.3
Figure 3.1 illustrates one configuration for active TSP at an intersection, with an optical detector and wayside controller.
Within an active TSP system, two methods exist for sending the signal to the detector. One is for the vehicle operator to push a button on the control panel to trigger the on-board transmitter to send the signal. This method adds an element
Chapter 3 Transit Improvement Toolkit
of unpredictability and creates an additional task as drivers navigate congested traffic, making it less favorable among transit operators. The approach that most transit operators in the United States have used so far is automatic vehicle location (AVL) technology, where the emitter sends the signal automatically as the bus approaches an intersection. This approach reduces concerns about human error possibly altering traffic signal cycles. 4
Figure 3.1: A configuration for Active TSP
Source: Transport Canada, 2012.
Chapter 3 Transit Improvement Toolkit
Conditions for TSP
Some jurisdictions, including Los Angeles and Berkeley, have applied TSP only when the transit vehicle is behind schedule.5
Most of the 40 US urban areas with a TSP system, however, have implemented it for buses approaching intersections regardless of on-time performance.6 Many areas restrict TSP to peak travel times, when transit vehicles operate with higher passenger loads and the most passengers will benefit. Jurisdictions that already grant signal priority to emergency vehicles can extend this technology to transit vehicles. Authorities can implement TSP throughout a particular corridor, or only at a few problematic intersections.7
TSP works best at locations with far-side stops, so that the bus can move through the intersection, pick up passengers, and progress without being stopped at the light again. Still, TSP does operate in areas with near-side stops, where the request for priority comes after the bus has finished boarding and alighting passengers.8
When implementing TSP, authorities have had to consider the impact that priority for buses will have on traffic flow at all intersections. At intersections with a level-of-service (LOS) grade “F”, TSP could exacerbate the extreme level of congestion, and the complete failure of the intersection to handle traffic flow. TSP can maximize benefits for buses, however, at intersections with LOS grades of “D” or “E”, indicating slightly lower, but still very high levels of congestion.9 Transit vehicles can still benefit at intersections with higher LOS grades, but questions arise at these points as to whether the benefits to transit vehicles outweigh the costs of installation.
Chapter 3 Transit Improvement Toolkit
Costs of Implementing TSP
The costs of implementing TSP vary depending on whether existing traffic lights can already receive signals from transit vehicles. The replacement of traffic signals can add a substantial expense to any TSP installation. In addition, the type of detection technology chosen for TSP can determine both its capital and operating costs. For example, installing optical detectors on traffic lights can cost less than wayside readers, but operating costs of the optical detectors are likely to be much higher.10 Smart Loops have the lowest costs overall. Table 3.1 shows the possible costs of TSP.
Table 3.1: The Capital and Operating Costs of Transit Signal Priority
Source: TCRP 2007, Report 118.
Chapter 3 Transit Improvement Toolkit
Benefits and Concerns
The benefits of TSP vary based on bus travel speeds, the number of intersections involved, and local monitoring practices. For example, Seattle applied TSP to just three intersections along Rainier Avenue and achieved a 34% reduction in average intersection delay experienced by buses. On the other hand, Los Angeles applied TSP to 211 intersections along its Metro Rapid line, and found a 7% decrease in overall running time on route as a result.11
Some transit systems have also found that implementing TSP led to reduced travel time variability, and increased schedule adherence. Strategic location of TSP at particularly problematic intersections, rather than sheer numbers, may help to maximize benefits in this way. With just three TSP-capable intersections, Seattle managed to reduce travel time variability for buses by 35%. Portland’s Tri-Met similarly applied TSP at 14 intersections, and found a 19% reduction in variability, which was enough to remove one bus from service.12 TSP may also help to reduce “bus bunching”, where buses operating on high frequency routes end up catching one another near
intersections. The Chicago Transit Authority observed a marked improvement in the ability to maintain adequate bus spacing during peak operations as a result of TSP.13 Table 3.2 summarizes the types of benefits to buses that certain US transit systems with TSP have observed.
San Francisco
Anne Arundel County, MD
Bremerton, WA
Table 3.2: Types of Benefits Observed with TSP, United States
Source: TCRP 2007, Report 118.
At the same time, TSP can lead to frustrations for drivers on cross-streets where signal phases are shortened or even skipped, creating traffic delay. Most jurisdictions with TSP have mitigated this delay by compensating shortened signal phases with a longer phase on the next signal cycle. The Michigan Manual on Uniform Traffic Control Devices (MMUTCD) mandates that when a signal grants a transit vehicle’s request for priority, it must compensate shortened phases in the next cycle.14 With compensation in its system, Los Angeles observed an average delay to cross-street drivers of less than one second per vehicle.15
The time savings from TSP allow passengers to arrive at their destinations faster, reducing frustrations over stopped time on the roadway while in the vehicle. Where TSP has reduced travel time variability, it can also lead to increased perceptions of reliability in the transit system.16 The use of stops at the far side of intersections can also maximize these benefits by allowing a bus to board passengers after clearing the traffic signal, ensuring that the transit vehicle can access the stop.
Chapter 3 Transit Improvement Toolkit
During highly congested travel periods, TSP might not do nearly enough to help a transit vehicle move through an intersection. If a transit vehicle activates TSP while stuck behind slow moving traffic, the extended green or shorter red signal may have no effect on travel time. A measure to allow the transit vehicle to maneuver around congestion would complement TSP and further reduce time spent at intersections. One measure that would achieve this goal is the queue jump or queue bypass lane.
Queue Jump Lanes
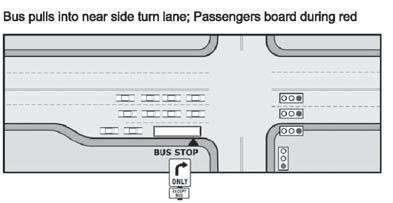
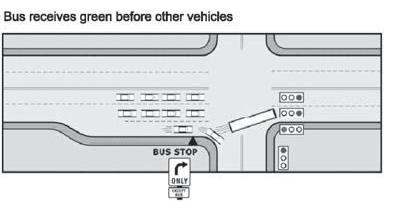
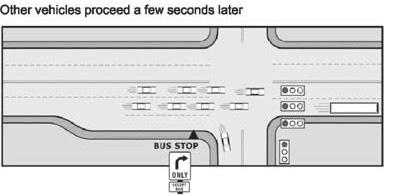
How they work
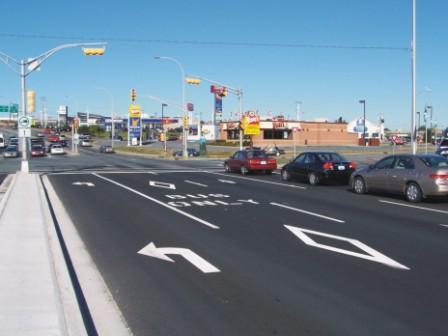
A queue jump lane is a small lane reserved for buses near signalized intersections. These lanes allow the bus to pass general traffic and proceed ahead of this traffic through an intersection, reducing time spent at congested intersections. Queue jumps for buses can share space with turn lanes, with buses being the only vehicles allowed to go through the intersection rather than turn. In other situations, jurisdictions can acquire new right-of-way for a bus only lane. The majority of jurisdictions that have implemented queue jumps have used the right-turn lane to create the space for buses.17
Chapter 3 Transit Improvement Toolkit
Figure 3.2 illustrates one possible queue jump scenario, with a separate traffic signal. Under this system, the bus moves into the right-turn lane just ahead of the intersection. Where necessary, a special right-turn signal at this point clears the lane of vehicular traffic, allowing the bus to proceed directly up to the intersection. An early green phase then allows the bus to move past the intersection and proceed on its way, jumping ahead of general traffic which receives a green phase a few seconds later.18 Authorities may also choose to employ queue jumps without TSP, in which case the bus would still gain an advantage over general traffic because it is at the front of the line at the intersection.
Source: Transit Cooperative Research Program, 2010.
Figure 3.2: Bus Queue Jump Illustration
Chapter 3 Transit Improvement Toolkit
Conditions for Queue Jumps
Much like TSP, queue jumps will bring the most benefit to buses at highly congested intersections with LOS grades of “D” or “E.” Authorities usually only employ queue jumps at a few problematic points. At these intersections, the length of the queue jump lane has to be greater than the length of the typical queue of cars in the general traffic.19 Otherwise, buses would not be able to enter the lanes, and they would continue to be stuck in vehicular congestion.
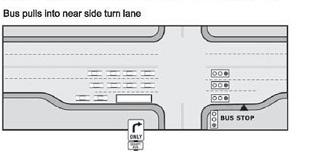
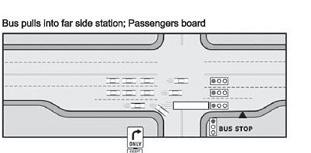
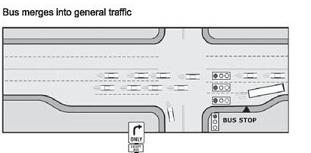
Queue jumps may conflict with standard TSP in terms of stop location. Many jurisdictions implement TSP at intersections with stops on the far-side of the intersection. Yet authorities may install queue jump lanes with TSP at points where stops are located on the near side, as Figure 3.2 shows. The nearside stop allows people to board the bus while it is in the queue jump lane waiting at the red light.20 When it receives the early green signal phase, the bus then proceeds through the intersection and merges ahead of other traffic without stopping immediately after.
A variant of a queue jump lane, known as a queue bypass lane, does favor far-side stops by extending the bus-only lane slightly beyond the intersection. Figure 3.3 depicts a queue bypass lane. The bus progresses to the front of the queue on the near side, and when the light changes to green, moves to the far side to board passengers without impedance from other vehicles.21
While many jurisdictions do not grant TSP for queue bypass lanes, doing so could reduce this impedance even further. Even where bus-only lanes do not extend beyond the intersection, the addition of a queue jump lane to a TSP system can still allow a bus to arrive at a far-side stop more quickly.22 With configurations for both near- and far-side stops, queue jump lanes offer very flexible arrangements for a variety of traffic situations. Authorities can use queue jump lanes in combination with TSP to address specific traffic conditions at a given intersection.
Chapter 3 Transit Improvement Toolkit
Source: Transit Cooperative Research Program, 2010.
Costs of Implementing Queue Jumps
The cost of queue jump lanes varies greatly based on whether transit will share an existing turn lane, or require new right-ofway. Where buses use existing lanes, the costs of the actual striping and installation of new “Right Turn Except for Buses” or “Bus Only” signs will cost anywhere from $500 to $2,000. In addition, if TSP systems are not already available on site, they could cost between $5,000 and $20,000.23
Where queue jumps require new road right-of-way, the overall costs of installing the lanes could be substantial depending on the local context. For example, on Nashville’s Gallatin Road corridor, few right turn lanes exist. In addition, right-of-way ownership is in private hands all the way to the on-street edge of pavement, making new acquisition expensive. Due to the high cost of right-of-way acquisition, Nashville’s plan to speed up bus transit on Gallatin Road estimated that throughout most of the corridor, queue jump lane installation would cost more than $1 million. 24 On certain segments of Gallatin Road where public entities already own right-of-way, the plan estimated that queue jump installation costs would be much lower.
Figure 3.3: Bus Queue Bypass Lane Illustration
Benefits and Concerns
Roadway authorities have implemented queue jumps widely in a variety of roadway settings to allow transit vehicles to maneuver around congested intersections. As with TSP, the benefits of queue jumps depend on the number of intersections involved and their strategic location at the most congested areas. Queue jumps typically generate 5-15% in additional time savings over TSP, through reduced time spent at intersections. When authorities implemented queue jumps at a single problematic intersection, Denver saw a 7-10 second reduction in intersection delay for buses, and Seattle saw a 27 second delay reduction during the morning peak.25
Figure 3.4 illustrates some examples of queue jump lanes in (a) Portland , (b) Chandler, Arizona, and (c) Oakland, as part of a proposed improvement to RapidBART’s airport service.
Figure 3.5 shows typical signage associated with queue jumps in shared turn lanes in Portland.
Chapter 3 Transit Improvement Toolkit
The addition of queue jump lanes to TSP can create an unfamiliar situation for pedestrians and other motorists where the bus proceeds before general traffic. Pedestrians and right-turning traffic from cross streets may not expect a bus
Figure 3.4(a): Queue jump lane in Portland, OR
Source: Transport Canada, 2012.
Figure 3.4(b): Queue jump lane in Chandler, AZ
Source: City of Chandler, 2009.
Chapter 3 Transit Improvement Toolkit
to proceed ahead of them. In addition, where queue jumps require new right-of-way, they usually take away space from pedestrians and create longer crossing distances.26 On the AC Transit system in the Oakland area, authorities installed medians to ease concerns that pedestrians would not be able to cross the widened road safely, especially if a bus is approaching.27 For drivers on cross streets, restrictions on right turns on red signals could help reduce conflicts with buses. In situations where buses use queue jumps less frequently, clear signage alerting cross-street drivers to watch for buses when turning could be adequate to address these safety concerns.28
Queue jumps create spaces where buses have priority around intersections, reducing delay. Yet queue jumps might simply be the end points of larger road spaces where buses can operate without interference from other traffic. Roadway treatments that give the bus more designated space can help generate even more travel time savings for transit vehicles, and an increased sense of reliability in the system for passengers. The next section outlines the treatments that give buses even greater roadway priority.
Figure 3.4 (c): Queue jump lane in Oakland, CA
Source: Living in the O, 2011.
Figure 3.5: Queue jump sign in Portland, Oregon
Source: Kittelson and Associates, 2007.
Chapter 3 Transit Improvement Toolkit
ROADWAY TREATMENTS
Roadway treatments within a particular corridor reduce the amount of time the bus spends on a route overall, especially in congested traffic. Where roadway space for transit is extensive enough, passengers could find significant time savings, in many cases enough to induce new ridership.
Three different levels of dedicated lanes for transit could help buses avoid congestion:
• Priority lanes keep buses operating on streets with mixed traffic and allow them to travel faster by removing some or all of the vehicular competition for the lanes, usually only during peak travel periods.
• Exclusive lanes reserve space for transit vehicles alone, often through physical barriers, ensuring that they encounter no congestion while traveling at any hours.
• Transitways devote extensive new right-of-way to transit, with platforms, running way, and stops contained in an area that is clearly separated from general traffic.
Priority Lanes
How They Work
Priority lanes remain a part of the existing street, and all traffic is physically able to enter the lanes. Over the course of the day, transit vehicles usually share these lanes with other traffic. Traffic authorities may designate an existing lane as “bus only” or add a new lane, and place the designation there. Signage usually designates the hours that the lane operates as “bus only,” or the types of other vehicles that may use the lane during bus operating hours.29 Figure 3.6 shows an example of signage for priority lanes in New York City. Traffic authorities may also paint or stripe the lane to make clear the restrictions on use. Figure 3.7 shows examples of (a) a painted lane from Albany, New York, (b) a marked bus and bike lane in Seattle.
Priority lanes allow transit vehicles to bypass congestion over longer stretches of roadway than do queue jumps. At times when the transit system is not in operation, the lane reverts to general traffic usage. In most urban areas of the United States, authorities limit the exclusive use of the lane by buses to peak travel periods, usually a maximum of five hours per day. Even during these peak periods, buses often must share the lane with other vehicles in order to avoid exacerbating congestion
Chapter 3 Transit Improvement Toolkit
in the remaining road space. Authorities have addressed this issue by granting essential vehicles, such as municipal and utility vehicles, access to these spaces to better spread out travel across all lanes.30
While any lane on the road could serve as a priority lane, the majority of jurisdictions in the United States have implemented them curbside. Due to this alignment, priority lanes have in most cases allowed right-turning traffic to enter at all times of day.31 In order to facilitate movement of buses and other traffic in these lanes, authorities have also had to restrict other curbside activities, such as on-street parking and unloading.
Figure 3.6: Bus Lane Sign in New York City
Source: City of New York, 2012.
Figure 3.7 (a): Bus Priority Lane in Albany New, York
Source: Streetsblog, 2010.
Figure 3.7 (b): Bus and Bike Priority Lane in Seattle
Source: Beyond DC, 2011.
Chapter 3 Transit Improvement Toolkit
Conditions for Priority Lanes
To designate a lane for exclusive use by buses, standards from the National Cooperative Highway Research Program (NCHRP) suggest that the corridor of application ought to have 20-30 buses passing through every hour during peak time, or one bus per signal cycle.32 When other designated vehicles are able to use priority lanes, frequency requirements may not be as stringent. In transit systems that do not have high levels of bus frequency, authorities have implemented priority lanes when two conditions exist:
• the corridor in question has the highest, or very high, ridership compared with the rest of the system, AND
•
• peak period congestion substantially degrades ontime performance and the ability of the bus to access stops.
33
Some jurisdictions have applied priority lanes as part of an express bus service, with hopes of eventually developing grade-separated facilities for exclusive use by transit vehicles. For example, the Valley Transit Authority (VTA) in Santa Clara
includes transit priority lanes as part of its strategy for initial upgrades.34 As figure 3.8 shows, VTA buses currently operate in unrestricted lanes, and may encounter significant congestion. The VTA hopes that by offering a rapid service, they can eventually generate the ridership required to justify purchase of new right of way or barriers for transit use.
In other cases, rapid transit operators may use priority lanes rather than dedicated running ways in order to maximize service area. For example, the Metro Rapid line in Los Angeles currently operates in unrestricted traffic lanes, and achieves travel time savings through limited, spread-out stops. By operating in unrestricted traffic lanes, the Metro Rapid is able to spend more of its money on service expansion of its 450-mile, 26-line network. Given the prohibitive costs of purchasing new right-of-way in highly built-up corridors, Metro Rapid’s next phase involves moving towards priority lanes on particularly congested stretches. By saving money on running ways, Metro Rapid hopes to expand its limited-stop network even further. 35
Where TSP and queue jump lanes already exist, the addition of transit priority lanes over longer stretches can help increase perceptions that the bus will not be caught in congestion,
Chapter 3 Transit Improvement Toolkit
and generate new ridership through time savings. Similarly, authorities can install queue jump lanes at the end of priority lanes where these lanes do not extend over the whole corridor, allowing the bus to merge more easily with general traffic at intersections.36
Costs of Implementing Priority Lanes
Like queue jump lanes, the costs of transit priority lanes will vary depending on whether traffic agencies create it by purchasing new right-of-way, or restricting use of an existing lane. When retrofitting an existing lane, capital costs are likely to be low. Striping and signage for transit priority lanes generally costs $50,000 to $100,000 per lane mile.37 Where agencies require new right-of-way, the overall per-mile cost will depend on local ownership conditions. Enforcement of the restrictions on priority lanes creates an additional cost.
Benefits and Concerns
In a city like New York, where transit operates nearly around the clock, public buses only maintain exclusive use of the priority lanes during four peak hours of the day.38 Even during peak times, there are no restrictions as to which agency’s buses may use the lanes. Tour bus operators and other private bus transportation groups may still use the lanes during peak hours. In San Francisco, restrictions allow taxis almost universal use of transit priority lanes during peak times. In Los Angeles, municipal vehicles can use these lanes at all times. All three cities debated whether to extend use of their lanes to bikes. Los Angeles formally allows bicycles to use the lane.39
Figure 3.8: VTA Bus Operating in Mixed Traffic Lanes
Source: Valley Transit Authority, 2007.
Cities in the United States have not attempted to extend the use of transit priority lanes in urban areas to all highoccupancy vehicles. Buses have most commonly shared space in high-occupancy vehicle (HOV) lanes on freeways and expressways. Still, Nashville is currently considering implementation of HOV lanes to speed up transit in its congested Gallatin Road corridor.40
One of the main reasons that use of transit priority lanes may not extend to HOVs currently is the general difficulty of keeping illegally encroaching traffic out of the lanes. Cities with transit priority lanes have relied on ground patrols to keep illegally parked cars and vehicles unloading deliveries out of transit priority lanes.41 In settings with little on-street parking or curbside loading, patrol enforcement may yield little result in terms of actual time savings for the bus.
Chapter 3 Transit Improvement Toolkit
photograph vehicles illegally moving within the lane. The City then tickets these vehicles in the same manner as a speeding violation.42
Authorities have focused relatively little on enforcing laws that restrict the type of moving vehicles in priority lanes. Recently, New York and San Francisco have begun to use camerabased enforcement to discourage violations. San Francisco, for example, mounts cameras on the back of its buses to
Another enforcement issue appears when poor signage leads drivers to inadvertently encroach on priority lanes.
Figure 3.9 shows an older sign in San Francisco, with too much information for drivers to process in a few seconds. San Francisco is in the midst of a major overhaul of its lanemarking signage in order to reduce confusion and make restrictions more visible.43
Authorities have so far allowed right turns from priority lanes in dense urban settings, where blocks are small and the amount of time a right-turning vehicle would travel in a particular lane is low. In less dense settings with fewer right turns, the amount of time non-transit vehicles spend in the lanes could increase, negating some of the benefits that priority lanes would provide the bus in terms of bypassing congestion.44
Despite issues with encroachment on transit priority lanes,
Chapter 3 Transit Improvement Toolkit
on certain corridors,transit systems have seen marked improvements in performance. Buses on New York’s Madison Avenue and San Francisco’s First Street each saw running time improvements of over 30% in peak time when authorities converted lanes to allow transit priority. New York similarly observed a 50% reduction in travel time variation on its Madison Avenue line.45
Priority lanes can provide a low-cost option to speed up buses where new right-of-way is prohibitively expensive or ridership levels do not yet justify a completely exclusive lane. Proper enforcement could allow buses to realize the full potential of a priority lane in congested situations. Still, some authorities have turned to the more expensive dedicated lanes and transitways as self-enforcing methods of ensuring faster travel times and fewer instances of unpredictable congestion.
Exclusive Lanes
How they Work
Exclusive lanes are roadway spaces reserved completely for the movement of transit vehicles. Exclusive lanes are usually located in the lane closest to the curbside. With curbside exclusive lanes, only transit vehicles from designated agencies
can use the lanes at any time. Authorities may install obstacles to completely block other vehicles from entering the transit lane, including bollards or concrete barriers.46 Figure 3.10 shows an exclusive lane on Boston’s Silver Line route, with yellow bollards keeping all other vehicles out of the curbside lane along one stretch of the Washington Street corridor. Figure 3.11 shows that on the Las Vegas MAX system, buses operate in an exclusive painted lane without barriers for much of the route outside the City’s famous Strip. Since
Figure 3.9: Confusing Bus Lane Sign in San Francisco
Source: Mineta Transportation Institute, 2012.
other vehicles cannot use these lanes during any time period, enforcement becomes much simpler than with priority lanes. Traffic cameras can easily detect violating vehicles at intersections.47
Chapter 3 Transit Improvement Toolkit
Conditions for Implementation
Occasionally, exclusive lanes can be located in more central areas away from the curb, and might only allow buses to move in the direction of peak flow. Concrete barriers usually separate these lanes from mainstream traffic. These exclusive lanes usually run only for short stretches of a route in order to preserve access to stops along the curbside.48 Figure 3.12 shows a stretch on the Las Vegas “Strip&Downtown Express” (SDX) that uses a separated central lane. The lane reverses based on peak flow.
Since exclusive lanes create completely separate running ways, the bus does not usually encounter any congestion while in motion. Barriers and clearly marked running ways can help create a sense of distinct identity for a particular transit route as a rapid service.49
To justify exclusive lanes, NCHRP standards suggest that the lanes should carry at least as many people as the adjacent general traffic lane during peak travel hours, usually 20-30 buses per hour. In addition, exclusive lanes should be on roadway segments where the bus would otherwise encounter enough congestion to significantly degrade service reliability. With the provision of an exclusive lane for buses, the NCHRP standards state that there should still be two lanes available to general traffic.50
Figure 3.10: Exclusive Bus Lane with Bollards in Boston
Source: Mineta Transportation Institute, 2012.
Chapter 3 Transit Improvement Toolkit
Where exclusive lanes run the entire length of a particular route, queue jumps will no longer be necessary, as buses will not operate in competition with any other traffic. If exclusive lanes only run part of the way, however, queue jumps can help buses pass through intersections without difficulty. Since buses in exclusive lanes must still interact with other forms of traffic at intersections, TSP can certainly improve the overall travel time of buses at these points. Indeed, a separate signal phase for the bus may be necessary with dedicated lanes in order to avoid conflicts with right-turning traffic adjacent to the bus lane.
51
Cost of Exclusive Lanes
As with transit priority lanes, the cost of re-striping and painting of the roadway can cost $50,000 to $100,000 per lane mile. Exclusive lanes, however, usually require construction of a new lane because they completely close off space for general traffic. These reconstruction costs range from $2-4 million per lane-mile, depending on whether authorities decide to install barriers in curbside lanes. These costs do not include right of way purchases, which are highly dependent on the local land ownership context.52
Figure 3.11: Las Vegas MAX Bus Exclusive Lane
Source: Valley Transit Authority, 2007.
Figure 3.12: Las Vegas SDX Bus in Median Bus Only Lane
Source: Mario Ortiz, 2010.
Chapter 3 Transit Improvement Toolkit
Benefits and Concerns
The time savings associated with exclusive lanes have proven significant because transit vehicles do not encounter any congestion while in the lanes. Time savings of over five minutes on any given route have usually induced modal changes and increased ridership. Smaller time savings can still benefit current passengers and reinforce their desire to use transit.53 The actual travel time savings from exclusive lanes will depend on the previous speed of bus travel and number of stops on the route. For example, Dallas’ two exclusive bus lanes operate in areas with few stops, and travel time savings have ranged from 1-2 minutes per mile. In contrast, installation of bus lanes on Wilshire Boulevard in Los Angeles led to travel time savings of less than one minute per mile. Travel time reliability did increase on Wilshire Boulevard routes by between 12% and 27% after the installation of bus-only lanes.54
Exclusive lanes can increase crossing distances for pedestrians when these lanes come from new curbside right-of-way. Many jurisdictions have compensated for these issues by installing medians and extending the length of the pedestrian signal.55
Where stops are far apart, use of curbside lanes can generate concerns among businesses and residents about negative impacts on intensive land activity adjacent to the curb. Specifically, curbside exclusive lanes may limit driveway access to destinations by barring turning vehicles from the lane.56 Sidewalk activity in these segments could diminish to the point that only transit users attempting to access a stop wish to use them. Where these concerns persist, and service levels are high enough, authorities may implement transitways to completely separate transit running area and stop infrastructure from all other street activity.
Transitways
Like exclusive lanes in some settings, transitways create space for exclusive transit use by placing barriers between transit running ways and the remainder of the street. Transitways go a step further than exclusive lanes by also placing the stop infrastructure within these barriers, creating a distinct space for all transit-related activity. Transitways remove all such activity from at least one curbside to minimize interference with activities there.57 Figure 3.13 shows one alignment of a transitway on a particularly wide road.
Chapter 3 Transit Improvement Toolkit
When taken away from the curbside, stop infrastructure could expand to include wider shelter and seating space. Authorities can use transitways to ensure that transit vehicles will have access to their designated stops. The vehicles can potentially achieve higher speeds due to the inability of traffic to encroach on the lane.58 Stops are typically located near intersections to facilitate pedestrians crossing at crosswalks. In a transitway, buses still have to interact with mixed traffic at intersections.59
maintain a highly exclusive space. The Lane Transit District in Eugene-Springfield, Oregon, and the City of Cleveland have implemented transitways in the median to minimize interference with curbside activity on either side. (The plan profiles these areas in case studies in Appendix A.) Figure 3.16 shows a median transitway on the Eugene-Springfield corridor. The median transitway allows buses operating in both directions to share a single platform and stop infrastructure. 60
Conditions for Median Transitways
Several US cities have experimented with transitways in different forms. Figure 3.14 shows a transitway in Miami-Dade County, completely fenced off from the remainder of the road. Pittsburgh has built entirely new roads for its East and West Busways, reducing the number of intersections where the bus has to interact with mixed traffic. Figure 3.15 shows Pittsburgh’s East Busway, completely separating transit from the main street.
More popular among urban areas in the United States is the median transitway, where barriers to vehicular access come from raised platforms. With median transitways, riders still have access to their destinations, while transit can
NCHRP standards suggest that to justify construction of a median transitway, traffic authorities should only implement median transitways in corridors where more than 60 buses operate during peak hours.61 Yet areas that operate transit at such high frequency may be in dense settings where purchasing the required right of way is impossible. Transit authorities in Eugene-Springfield and Cleveland do not operate buses with such high frequency, but they have still invested in median transitways on specific corridors with high-speed bus service. 62 Since buses on median transitways must still interact with mixed traffic at intersections, a separate signal phase with TSP
may be necessary to avoid conflicts with left-turning traffic from all directions. Where median transitways run the full length of a corridor, they would not require additional queue jumps.63 Where buses have to merge back into mixed traffic or into curbside dedicated lanes, queue jumps could still help add
Chapter 3 Transit Improvement Toolkit
additional time savings.
Light rail systems have previously used median transitways, and some jurisdictions may treat the investment in median transitways as a major step towards light rail transit. In other
Source:
Table 3.14: South Miami-Dade Busway
Source: Valley Transit Authority, 2007.
Figure 3.13: Median Transitway Alignment
Valley Transit Authority, 2007.
Figure 3.15: Pittsburgh’s East Busway
Source: Metropolitan Planning Council, 2009.
Chapter 3 Transit Improvement Toolkit
cases, the similar platform and running way infrastructure of light rail has helped transit agencies provide a rapid, highlyreliable transit system that induces new ridership.64
Costs of Median Transitways
Median transitways are the most expensive of the roadway treatments that this chapter describes. Median transitways
cost $5-10 million dollars per lane mile, mostly related to landscaping, platforms, and barriers.65 Transitways require at least 32-feet of new ROW, and these costs can be prohibitively expensive in most settings.66
Benefits and Concerns
Due in large part to the high costs of new right-of-way, the
Figure 3.16: Median Transitway, Eugene, Oregon
Source: Wikimedia Commons, 2011.
time savings benefits of median transitways specifically are not yet clear. The off-road busways in Miami-Dade County and Pittsburgh saw travel time reductions of over 50%. So far, it is not certain that this level of time savings applies in settings such as Cleveland or Eugene-Springfield, where buses have to interact with general traffic much more frequently. Yet in both cities, travel speeds and ridership have increased with the installation of the median transitways.
67 Transitways potentially represent the highest-cost option to help buses bypass congestion and also the option with the highest potential level of time savings. Roadway improvements alone, however, do not address delays that the bus encounters, nor are they only means to achieve travel time benefits. The next section addresses the role of changing fare payment practices in reducing dwell times for buses.
EXPEDITED BOARDING PRACTICES
Transit operators throughout the United States have expressed concern about increased bus dwell times due to swipe-cards that demagnetize over time and customers struggling to find exact change.
68 Payment issues are certainly frustrating for passengers waiting to queue, but also for passengers already
Chapter 3 Transit Improvement Toolkit
aboard, increasing their in-vehicle travel time without getting them any closer to their destination. In addition, transit vehicle drivers may have to respond to passenger confusion about fare payment, creating delays in getting the bus back into motion after stops. Cities elsewhere have attempted several strategies to reduce delays related to fare payment and boarding.
69
Contactless Cards
How they Work
Cards with a built-in antenna and microchip, also known as smart cards, have found increased acceptance among transit agencies as a method of payment. Riders do not have to swipe these cards, and must only wave them in proximity to a card reader. They therefore do not have to take time to remove cards from a wallet, purse or backpack, as they can often remain in a transparent compartment and still read accurately. Smart cards can reduce time the customer spends searching for, and swiping a traditional card, speeding up the boarding process.
70
Conditions for Implementation
Authorities can implement contactless cards anywhere
Chapter 3 Transit Improvement Toolkit
that they have concerns about boarding and fare payment potentially preventing the on-time performance of the bus. In particular, contactless cards may help reduce dwell times along a system’s high-ridership routes, where queues form at the front of the bus. 71
Costs of Implementation
One of the main concerns that transit agencies have with contactless cards is the high costs incurred to implement contactless cards system-wide. While current magnetic swipe cards cost 5-10 cents each on average, proprietary contactless cards cost 90 cents each on average to produce. In highridership systems, these new costs can be prohibitive. Transit systems that accept riders’ smart cards from other sources may save on these production costs.72
In addition, the system-wide costs of new contactless farebox readers could potentially be prohibitively expensive. Table 3.3 compares the costs of three types of fareboxes. Installing a new farebox to read contactless cards could incur a high cost, particularly where systems have already made investments in magnetic strip cards. Installing fareboxes that can read a variety of smart cards could potentially raise these capital
costs further. With technologies for upgrading older systems to accept contactless cards, however, costs would diminish.73
Benefits and Concerns
Contactless smart cards have become a staple of subway and light rail systems in the United States, where machines at turnstiles determine whether a card has adequate fare. Recently, bus systems have also begun to use cards to speed boarding. For example, Metro Transit in Minneapolis-St. Paul in 2004 instituted GoTo™ cards that work on both the light rail and bus systems in the Twin Cities. Not only are GoTo™ cards contactless, but there are small, separate machines to the side of the farebox on board that allow GoTo™ customers to finish paying at the same time as those customers using cash and other types of farecards pay their fares.74 This dual system
Table 3.3: Capital Costs of Fareboxes
Source: Transit Cooperative Research Program 2007, Report 118.
can lead to reduced dwell times for all passengers aboard and those boarding the bus, regardless of payment method.75
Figure 3.17 shows the separate contactless card machine for GoTo™. A 2010 study of a route in the University Avenue corridor in Minneapolis isolated fare payment’s contribution to overall dwell time. The study found that converting all cash users to GoTo™ card users would save almost six seconds per passenger on-board. 76
The Minneapolis-St. Paul example demonstrates the benefits that contactless cards create in terms of ease-of- transfer between different modes or routes. San Francisco similarly has separate smart card readers on some of its MUNI buses, speeding up the boarding process.
San Francisco’s MUNI goes a step further with its Clipper Card™, which users can wave in other settings to pay for parking, or retail purchases at certain businesses.77 Contactless cards can demonstrate that use of the transit system is convenient.
Chapter 3 Transit Improvement Toolkit
in implementation, eventually eliminating paper transfers on buses and replacing them with transfers encoded on the smartcard. If this phased implementation comes without adequate outreach to customers, it can create fears among customers that they will no longer be able to pay their fare.78 In addition, contactless cards may disadvantage those riders who have no choice but to pay by cash.79 Transit agencies can carefully install contactless card machines system-wide, yet still allow cash boarding to alleviate these fears.
To properly allow for all methods of payment, and realize even larger time savings, transit systems can move fare payment out of the vehicle entirely.
Agencies such as WMATA in Washington, DC have attempted to spread out the costs of a contactless system by phasing
Figure 3.17: Twin Cities Go-To Card
Source: Met Council, 2009.
Chapter 3 Transit Improvement Toolkit
Off-board Fare Payment
How it Works
In an off-board fare payment system, passengers pay their fare at the stop before boarding, usually at a designated vending machine. Figure 3.18 shows a vending machine on Las Vegas’ SDX route. The passengers then receive proof of payment, often in the form of a receipt or stamp on a pass, to take aboard. With prepayment, transit agencies conduct enforcement mainly through random inspections, either on board the vehicle or at stops. Customers without proper proofof-payment would be subject to fines and other penalties.80
Some systems only integrate prepayment for certain types of payment or at particular stops. For example, on King County, WA’s RapidRide route, only a limited number of stops have card readers. Customers with the local contactless card may wave their card in front of these readers to pay their fare, and they may then board through either door. Other customers board through the front of the bus. 81
Most systems with prepayment remove fareboxes from the vehicle entirely. Customers pay with the medium of their choice, and must present a receipt or stamped pass to transit
officers upon random inspections. On Minneapolis-St.Paul’s light rail system, inspectors have handheld devices that receive information from the local transit payment database, so that those paying by the system’s smart card do not require a receipt.82
Conditions for Implementation
Transit agencies can introduce fare prepayment anywhere concerns arise that dwell times are slowing down bus travel. In particular, transit systems may wish to implement prepayment on express routes to convey an image of a rapid, convenient system.83
Figure 3.18: Las Vegas SDX Vending Machine
Source: Erik Weber, 2010.
Chapter 3 Transit Improvement Toolkit
Cost
The main cost of fare prepayment comes in the purchase of vending machines. Generally, transit agencies have to install all vending machines along a particular route at the same time to avoid confusing payment structure. Las Vegas spent a total of $1.9 million to install 22 vending machines in its initial effort to develop the MAX system.84 Costs will vary depending on the number of different types of media that the vending machine employs.85 Enforcement costs will also depend on the number of inspections that a particular agency conducts, and how many new personnel are necessary to conduct the inspections.
Benefits and Concerns
Complete fare prepayment allows for boarding at both doors, reducing crowding at the front of the bus and speeding up boarding times. Figure 3.19 shows both doors open for boarding on a Metro Orange Line vehicle. In Las Vegas, the elimination of fareboxes and the use of all doors on its limitedstop MAX System generated substantial time savings over a parallel route that still had on-board fareboxes. The MAX system in 2007 had an average dwell time of 14.8 seconds per stop, compared to an average of 11 seconds per person on the local route in the same corridor. 86
Fare evasion concerns increase where parallel routes do not have fare prepayment, or when only some vehicles still have fareboxes. Figure 3.20 shows illegal back-door boarding in San Francisco, even with signs clearly marked with “BOARD THROUGH THE FRONT DOOR.” New York has resolved this issue on its Selectbus express service by accepting proof-of-
Figure 3.19: Both Doors Open on Metro Orange
Source: Light Rail Now, 2009.
Chapter 3 Transit Improvement Toolkit
payment on local routes, although still keeping front door boarding.87 This arrangement helps customers who are waiting for the express bus, but are willing to take the first bus that arrives. In this way, local routes can realize some time savings benefits of an express bus system.
Authorities can also mitigate fare evasion concerns through “fare sweeps” when they first introduce the proof-ofpayment system. The Phoenix LRT System and New York’s Selectbus enforced fare payment by conducting more random inspections. This initial enforcement has led these two cities to have lower rates of fare evasion than other systems with fare prepayment.
88
Since off-board fare payment is a signature feature of light rail and subway systems, fare prepayment represents one way to show that a bus system can also offer higher quality service. Where fare prepayment does significantly reduce total travel times, it can induce new ridership. This new ridership could potentially justify roadway improvements or new vehicle purchases.89
Fare prepayment allows riders to use a variety of fare media, and does not disadvantage users of cash and day passes. When transit agencies remove fare prepayment from the vehicle, they may actually increase the number of people who can use transit to meet their needs. Since transit vehicles no longer have to rush payment at the farebox, they can allow riders to pay using a method that is convenient for them.
90
Fare prepayment also reduces or eliminates the driver’s duty of monitoring the farebox and dealing with payment issues. With fare prepayment, drivers can focus on getting the bus back into motion after stops, rather than devoting attention to fare concerns. Fare prepayment minimizes travel time variability, and can complement other improvements in the system.
91
Many transit systems in the United States, such as Las Vegas MAX and King County RapidRide, have combined these fare prepayment measures with the roadway improvements described above to create a transit route or system with a distinct identity known as Bus Rapid Transit, or BRT.
Chapter 3 Transit Improvement Toolkit
PUTTING TOGETHER THE TRANSIT
IMPROVEMENT PUZZLE: BRT
Bus Rapid Transit, or BRT, is a rubber-tired, high speed transit system that offers features traditionally associated with light rail, such as level platforms and pre-paid ticketing. BRT integrates roadway improvements discussed here with comfortable stations and other service enhancements to create a fast and reliable system. BRT achieves its high speeds through limited stops spaced further apart in order to serve key destinations.
92
Many express bus services and routes brand themselves as BRT, while some BRT systems offer a higher level of amenities.
Generally, BRT takes two forms:
• BRT-Lite, where transit vehicles still operate in mixed traffic for all or most of their route. In this chapter, examples of BRT-Lite systems included Metro Rapid (Los Angeles), Valley Transit Authority, New York’s Selectbus, AC Transit, and King County RapidRide.
• Full BRT, where transit vehicles operate mostly or entirely in dedicated space. In this chapter, examples of
full BRT have included Metro Orange (Los Angeles), Boston’s Silver Line, Las Vegas’ Metropolitan Area Express (MAX) system, Cleveland’s HealthLine, and Eugene-Springfield’s Emerald Express (EmX). 93
In both BRT-Lite and full BRT systems, there are three key elements aside from roadway improvements that usually set BRT apart from regular bus service: high-amenity stations, stop location changes, and vehicles with distinct branding.
Figure 3.20: Illegal Back Door Boarding
Source: Transit Cooperative Research Program, 2012.
Chapter 3 Transit Improvement Toolkit
High-amenity stations
As discussed in the section detailing median transitways, BRT systems typically provide a host of amenities beyond regular bus stops. These features include more seating space, distinctive shelters, and often vending facilities for fare prepayment.94 Figure 3.21 shows a BRT station from Community Transit’s Swift service in Washington. Two other features of these stations aim to make the BRT experience similar to rail transit: real-time information and boarding platforms.
Real-time information screens are generally key components of light rail and commuter rail systems across the country. These screens can increase perceptions of reliability among customers by showing that bus transit operators provide the same level of control and precision as rail systems.95 The real-time information screens can make passengers more comfortable with out-of-vehicle travel time because they know when a bus will arrive. Figure 3.22 shows a real- time information screen from a station on the Metro Orange Line in Los Angeles.
Figure 3.22: Real Time Information Screen
Source: Transit Cooperative Research Program, 2010.
Figure 3.21: BRT Station, Community Transit
Source: Metro Magazine, 2009.
In addition, boarding platforms may be more extensive than traditional bus stops. Platforms are constructed at grade- level to allow for easy boarding of vehicles, particularly for disabled passengers. Stations with this high level of amenities can cost from $250,000 to $5 million each.96 By locating these stops at key locations, however, transit operators can maximize the benefits they grant to transit riders.
Stop Location Decisions
One of the key decisions for BRT providers is where to locate stops. While the typical local bus has a spacing of 800-1200 feet, BRT providers usually place stops 0.5 to one mile apart in order to speed up service.97 BRT providers must also decide whether to place new infrastructure at the same locations as local stops where appropriate. AC Transit in Oakland,California decided to place BRT stops on its Line 1R at separate locations from existing local stops, in order to avoid conflict with regular bus service. Specifically, they placed BRT stops on the far side of intersections to take advantage of transit signal priority.98 In other jurisdictions, transit providers move local stops to BRT locations to allow local buses to take advantage of some features of the upgrade to BRT.
Chapter 3 Transit Improvement Toolkit
In order to compensate for the increased walking distances to BRT stops, some transit providers have improved access to their stops. Figure 3.23 illustrates a bike path directly behind a station on the Metro Orange Line. Transit systems can complement this increased convenience with distinctive vehicles that convey the rapid nature of the new transit system.
Figure 3.23: Bike Path Near Metro Orange Station
Source: Source: LA DOT Bike Blog 2011.
Chapter 3 Transit Improvement Toolkit
Distinctive Vehicles
BRT systems throughout the country have chosen to convey the high-quality nature of their service along specific routes through branding and unique design of their vehicles. In King County, WA, this involved naming the system “RapidRide” (Figure 3.24), and including more vehicle doors to allow for faster boarding and alighting. Other systems have instituted more elaborate changes to their vehicles. Los Angeles’ Metro Rapid, as seen in Figure 3.25, introduced articulated vehicles, and also covered the back wheels to de-emphasize the negative qualities that people might associate with rubbertired transit. 99
The Cleveland Healthline system went a step further to include automatic precision docking that allows vehicles to pull directly next to a platform. Figure 3.26 shows a Cleveland Healthline bus docking at a platform, simulating the boarding experience that customers have when they ride light rail. The flexibility of BRT offers significant opportunities for transit systems to rebrand themselves as they attempt to offer a higher-speed service to riders. 100
Figure 3.24: RapidRide Bus With Three Doors
Source: Metro Magazine, 2009.
Figure 3.25: Metro Rapid Bus With Covered Wheels
Source: LA Public Transportation Association, 2009.
Chapter 3 Transit Improvement Toolkit
Defining BRT
For funding purposes, the Federal Transit Administration (FTA) established certain minimum standards for a project to gain BRT designation (See Discussion of Funding Options in Chapter 5).
For a corridor-based BRT project, standards demand:
• Substantial transit stations (with adequate shelter, prepayment machines, plenty of seating, level platforms, and possibly real time information).
• Transit Signal Priority
• Low-floor/level boarding of buses
• Distinct Branding
• Frequent service (10 minute peak/15 minute off peak)
• 14 Hours of Service per day101
BRT vehicles can further mimic traditional light rail transit (LRT) service in locations where they operate in their own running way. For those agencies who seek federal funding, dedicated running way can reduce the stringency of other requirements.
Figure 3.26: Docking BRT Vehicle in Cleveland
Source: Regional Transit Authority, 2010.
Chapter 3 Transit Improvement Toolkit
CONCLUSION
BRT features represent permanent investments that still offer the flexibility associated with buses. BRT can add stops and expand beyond an existing corridor more easily than a fixedrail system. BRT features allow transit providers to cater to a wider variety of public transportation needs on established routes, while also potentially spurring new development.
The plan presents four case studies of corridor-level BRT projects in the United States in Appendix A. Cleveland’s Healthline and Eugene-Springfield’s EmX routes illustrate existing full BRT systems. The Grand Rapids Silver Line represents a BRT system is not yet under construction, while Lansing’s BRT plans are in even earlier stages. Each example has required strong coordination between stakeholders along the corridor to gain acceptance.
This chapter has described treatments to speed up buses and enhance service reliability. Chapter 4 outlines the ways that the improvement measures discussed here can reduce transit delays, and promote a rapid, high amenity transit service along Washtenaw Avenue.
Chapter 3 Transit Improvement Toolkit
NOTES
1. Transit Cooperative Research Program. (2010). Bus and Rail Preferential Treatments in Mixed Traffic (TCRP Synthesis 83). Washington, DC: Transportation Research Board. Retrieved April 13, 2012 from <http://onlinepubs.trb.org/onlinepubs/tcrp/tcrp_syn_83.pdf>. 12.
2. Transit Cooperative Research Program. (2010). 12.
3. Transit Cooperative Research Program. (2010). 12.
4. Valley Transit Authority. (2007). “Bus Rapid Transit Service Design Guidelines.” In VTA Sustainability Policy. Retrieved January 28, 2012 from <http://www.vta.org/projects/tsp/pdf/6_ brt_service_design_guidelines.pdf>. 53.
5. Valley Transit Authority. (2007). 51.
6. Transit Cooperative Research Program. (2010). 11.
7. Transit Cooperative Research Program. (2010). 14.
8. Transit Cooperative Research Program. (2007). Bus Rapid Transit Practitioner’s Guide (TCRP Report 118). Washington , DC: Transportation Research Board. Retrieved April 14, 2012 from 4-28.
9. Transit Cooperative Research Program. (2007). 4-27.
10. Transit Cooperative Research Program. (2007). 4-30.
11. Transit Cooperative Research Program. (2007). 4-31.
12. Transit Cooperative Research Program. (2007). 4-32.
13. McKone, T., E. Partridge, and J. Martin. (2011). “Eliminating Bus Bunching- Building a process, information source, and toolbox for improving service.” Chicago Transit Authority. Retrieved April 20, 2012 from < http://www.ccachicago.org/sites/default/files/tom_mckone_eliminating_bus_bunching. pdf>. 2.
14. Michigan Department of Transportation. (2011). Michigan Manual on Uniform Traffic Control Devices. Retrieved February 6, 2012 from <http://mdotwas1.mdot.state.mi.us/public/ tands/Details_Web/mmutcdcoverintrotoc.pdf>. 489.
15. Transit Cooperative Research Program. (2007). 4-32.
16. Valley Transit Authority. (2007). 52.
17. Transit Cooperative Research Program. (2010). 13.
18. Transit Cooperative Research Program. (2010). 14.
19. Valley Transit Authority. (2007). 45.
20. Transit Cooperative Research Program. (2010). 13.
21. Transit Cooperative Research Program. (2010). 15.
22. Valley Transit Authority. (2007). 45.
23. Transit Cooperative Research Program. (2007). 4-39.
24. City of Nashville. (2009). “BRT for Gallatin Road.” Nashville Strategic Master Plan. Retrieved April 20, 2012 from <http://www.nashville.gov/mta/docs/StrategicTransitMasterPlan/
09Ch7BRT.pdf>.
25. Transit Cooperative Research Program. (2007). 4-40.
26. Transit Cooperative Research Program. (2010). 67.
27. City of Berkeley.(2011). 6.
28. Transit Cooperative Research Program. (2010). 67.
29. Agrawal, A., T. Goldman, and N. Hannaford. (2012). Shared-Use Bus Priority Lanes On City Streets: Case Studies in Design and Management (MTI Report 11-10). San Jose, CA: Mineta Transportation Institute. Retrieved April 15, 2012 from < http://transweb.sjsu.edu/PDFs/ research/2606-shared-use-bus-priority-lanes-city-streets.pdf>. 24.
30. Agrawal et al. (2012). 30.
31. Transit Cooperative Research Program. (2010). 6.
32. Transit Cooperative Research Program. (2010). 60.
33. Transit Cooperative Research Program. (2010). 60.
34. Valley Transit Authority. (2009). BRT Strategic Plan Final Report. Retrieved April 20, 2012 from <http://www.vta.org/brt/pdf/brt_strategic_plan_final_report.pdf>. 33.
35. Niles, J. and L. Jerram. (2010). Case Studies of Incremental BRT Projects in North America (MTI Report 09-13). San Jose, CA: Mineta Transportation Institute. 30.
36. Valley Transit Authority. (2007). 45.
37. Transit Cooperative Research Program. (2007). 4-19.
38. Agrawal et al. (2012). 86.
39. Agrawal et al. (2012). 25.
40. City of Nashville. (2009). 7-6.
41. Agrawal et al. (2012). 30.
42. Agrawal et al. (2012). 34.
43. Transit Cooperative Research Program. (2010). 4-17.
44. Agrawal et al. (2012). 8.
45. Transit Cooperative Research Program. (2007). 4-21.
46. Transit Cooperative Research Program. (2010). 6.
47. Federal Transit Administration. (2005). Las Vegas Metropolitan Area Express BRT Demonstration Project: Final Report. Washington DC: Federal Transit Administration. 2-1.
48. Valley Transit Authority. (2007). 28.
49. Transit Cooperative Research Program. (2007). 4-20.
50. Transit Cooperative Research Program. (2007). 4-17.
51. Valley Transit Authority. (2007). 26.
52. Transit Cooperative Research Program. (2007). 4-19.
53. Transit Cooperative Research Program. (2007). 4-21.
54. Transit Cooperative Research Program. (2007). 4-21.
55. Valley Transit Authority. (2007). 26.
56. Agrawal et al. (2012). 87.
Chapter 3 Transit Improvement Toolkit
57. Transit Cooperative Research Program. (2010). 5.
58. Valley Transit Authority. (2007). 29.
59. Niles, J. and L. Jerram. (2010). 24.
60. Transit Cooperative Research Program. (2010). 5.
61. Transit Cooperative Research Program. (2010). 60.
62. Niles, J. and L. Jerram. (2010). 24.
63. Valley Transit Authority. (2007). 32.
64. Institute for Sustainable Communities (2011). “The Cleveland Healthline: Transforming an Historic Corridor.” BRT Case Studies. Retrieved April 16, 2012 from < http://sustainablecommunitiesleadershipacademy.org/resource_files/documents/thecleveland-healthline.pdf.> 4.
65. Transit Cooperative Research Program. (2010). 60.
66. Valley Transit Authority. (2007). 36.
67. Transit Cooperative Research Program. (2010). 5.
68. Quibria, N. (2008). “The Contactless Wave: A Case Study in Transit Payments.” Federal Reserve Bank of Boston. Retrieved February 3, 2012 from < http://www.bos.frb.org/economic/ cprc/publications/briefings/transit.pdf>. 2.
69. Niles, J. and L. Jerram. (2010). 34.
70. Quibria, N. (2008). 3.
71. Valley Transit Authority. (2007). 89.
72. Quibria, N. (2008). 11.
73. Transit Cooperative Research Program. (2007). 4-103.
74. Transit Cooperative Research Program. (2012). Off-Board Fare Payment Using Proof-ofPayment Verification (TCRP Synthesis 96). Washington DC: Transportation Research Board. 50.
75. Transit Cooperative Research Program. (2012). 48.
76. Rabban, S. (2010). “Different Payment Methods Impact on Transit Speed and Performance: A Case Study of Metro Transit.” North Carolina Section of Institute of Transportation Engineers. Retrieved January 29, 2012 from <http://www.ncite.org/images/files/Different%20 Payment%20Methods%20Impact%20on%20Transit%20Speed%22and%20Performance.pdf>.
77. Transit Cooperative Research Program. (2012). 67.
78. Quibria, N. (2008). 16.
79. Quibria, N. (2008). 17.
80. Transit Cooperative Research Program. (2012). 5.
81. Rozenweig, Karen. (2011). Personal Correspondance. King County Transit Authority Transportation Planner. Correspondance Received: February 15, 2012.
82. Transit Cooperative Research Program. (2012). 13.
83. Valley Transit Authority. (2007). 89.
84. Federal Transit Administration. (2005). 3-1.
85. Transit Cooperative Research Program. (2007). 4-103.
86. Federal Transit Administration. (2005). 5-4.
87. Transit Cooperative Research Program. (2012). 55.
88. Transit Cooperative Research Program. (2012). 73.
89. Valley Transit Authority. (2007). 89.
90. Federal Transit Administration. (2005). 5-4.
91. Valley Transit Authority. (2007). 89.
92. Transit Cooperative Research Program. (2007). 1-2.
93. Federal Transit Administration. (2008). Advanced Network Planning for Bus Rapid Transit (USDOT Report FL-26-7104-4). Washington DC: Federal Transit Administration. Retrieved March 20, 2012 from <http://www.fta.dot.gov/documents/BRT_Network_Planning_Study_-_ Final_Report.pdf>.5.
96. Transit Cooperative Research Program (2007). 4-55.
97. Transit Cooperative Research Program. (2010). 15.
98. Alameda-Contra Costa County Transit. (2011). AC Transit Line 1R Final Report. Retrieved January 23, 2012 from <http://www.actransit.org/wp-content/uploads/Line-1R-Task-ForceFinal-Report-Fall-10.pdf>.
99. Transit Cooperative Research Program. (2010). 12.
100. Valley Transit Authority. (2007). 22.
101. Federal Transit Administration. (2011). “Small Starts Funding Guidelines.” Washington DC: Federal Transit Adminstration. Retrieved April 20, 2012 from <http://www. http://www.fta.dot.gov/documents/tpeNewStarts_20070720_smallStartsGuidanceAndInstructions.pdf>.
CHAPTER 4
Recommendations
Let’s Roll: Reimagining Transit on Washtenaw Avenue
Chapter 4 Recommendations
The treatments discussed in the previous chapter provide a variety of options to reduce travel inconsistencies on AATA’s Route 4 service along Washtenaw Avenue, which can be applied to specific segments of the corridor. Route 4 is the most heavily used service in the AATA system, and the doubling of frequency in January has already improved ontime performance. Application of transit priority treatments will further improve service, both by reducing in-vehicle travel time and creating a more inviting, convenient out-of-vehicle experience than currently exists. This chapter addresses the team’s recommendations for the Washtenaw Corridor.
The chapter begins with a summary of the plan’s vision for transit improvements. It then progresses to a discussion of corridor-wide transit improvements, some of which are already underway. Finally, it illustrates recommendations that apply to specific segments of the corridor, and the actors involved in each measure.
VISION
Potential improvements to AATA’s Route 4 service extend far beyond the vehicles themselves to include changes to stops, roadways, and connections to key destinations. Where transit improvement measures address all of these elements, passengers will experience more dependable travel and greater comfort in reaching their destinations.
The transit improvement measures this plan proposes speed up travel times, increase service reliability, enhance access, and create a distinct sense of identity for transit on Washtenaw. Key improvements that the plan proposes include:
Chapter 4 Recommendations
• Complete pedestrian and bicycle connections
• High-amenity stations at key destinations
• A limited-stop bus rapid transit service
• Fare prepayment
• Distinct marketing and branding
• Transit signal priority during peak periods
• Queue jump lanes to allow buses to bypass congestion at intersections
• Dedicated lanes for bus travel unimpeded by other traffic
Table 4.1, on the following pages, summarizes the locations of the recommendations by jurisdictional segment. While elements such as sidewalk completion, queue jump lanes, and stop positioning changes apply only to certain points along the corridor, the installation of bus rapid transit stations and fare prepayment apply across jurisdictions.
Chapter 4 Recommendations
Table 4.1
(a): Types of Transit Recommendations by Segment on Washtenaw Avenue
Jurisdiction City of Ann Arbor City of Ann Arbor Pittsfield Township Ypsilanti Township City of Ypsilanti
Segment
Ped-Bike Integration
Pathway connections; marked crossing at Platt; transition from shared-pathways to bike lanes; bike rack at Huron Pkwy and Manchester
Bike lanes; sidewalks on the south side; move crosswalk to the east side of Yost; bike racks at Arborland
Bike lanes/shared pathways; connect border-to-border trail on the southside between Carpenter and Golfside; add crosswalk at light W of Foster; bike racks at Carpenter and Golfside
Bike lanes; sidewalk connections; bike racks at Hewitt
Bike lanes; complete crossings and sidewalk connections; bike racks at Berkeley and Oakwood
Stop Enhancements
Bus schedules/ real-time; shelters at Platt (E and W stops)
Bus schedules/ real-time; eliminate pullout E of Pittsfield (across from Arborland); bench at stop E of Huron Pkwy
Bus schedules/ real-time; bench and shelter E of Carpenter (south side) and between Foster and Maple (south side)
Bus schedules/realtime; shelter at Fountain Plaza, Eof Welman and W of Hewitt
Bus schedules/ real-time; bench W of Mansfield, at Berkeley (both sides, and E of Oakwood; remove stop at Roosevelt)
#1: Manchester to Huron Parkway
#2:Huron Parkway to US-23
#3: US-23 to Golfside
#4: Golfside to Hewitt
#5: Hewitt to Summit
Chapter 4 Recommendations
Table 4.1 (b): Types of Transit Recommendations by Segment on Washtenaw Avenue (2 of 3)
Jurisdiction City of Ann Arbor City of Ann Arbor Pittsfield Township Ypsilanti Township City of Ypsilanti
Segment
Stop Placement
#1: Manchester to Huron Parkway
#2: Huron Parkway to US-23
US-23 to Golfside
Consolidate stops east of Glenwood and Arlington; BRT node at Manchester and Huron Pkwy
Remove stop west of Chalmers; BRT node at East of Pittsfield (Arborland)
Consolidate Deake and Foster stops; move north side stop and shelter east of Golfside to the far side (west side); BRT node at Carpenter and Golfside
Move north side stop west of Brookside to east of Boston (Squire's Plaza); move north side stop opposite Welman to Fountain Plaza; move south side stop west of Welman to the far side on the east
Consolidate north side stops east and move shelter to west of Hewitt at the northwest corner of the intersection.;BRT node at Hewitt
Roadway Improvements
Transit Signal Priority
Bus through lane at Manchester and queue jump at Huron Pkwy
Peak-period TSP at Huron
Queue jump at Huron Pkwy and Yost
Peak-period TSP at Yost Boulevard
Queue jump at Carpenter Queue jump at Golfside and Hewitt
Queue jump at Hewitt
Peak-period TSP at Golfside and Carpenter
Peak-period TSP at Hewitt
Peak-period TSP at Oakwood and Mansfield
#3:
#4: Golfside to Hewitt
#5: Hewitt to Summit
Chapter 4 Recommendations
Table 4.1 (c): Types of Transit Recommendations by Segment on Washtenaw Avenue
Jurisdiction City of Ann Arbor City of Ann Arbor Pittsfield Township Ypsilanti Township City of Ypsilanti
Segment
Payment Method
#1: Manchester to Huron Parkway #2: Huron Parkway to US-23
#3: US-23 to Golfside
#4: Golfside to Hewitt
#5: Hewitt to Summit
Vending machine at Manchester (south side first) and east of Platt (north side first)
Vending machine east of Huron Pkwy (south side) and East of Pittsfield (north side first)
Vending machine at County Service Center (north side first) and at Golfside (both sides)
Vending machine at Hewitt (north side first)
Vending machine at Oakwood (north side)
Marketing Gateway to the corridor (signage)
Gateway to the corridor (signage)
CORRIDOR-WIDE APPLICATIONS
Corridor-wide, boarding improvements paired with station and technology upgrades prepare Route 4 for bus rapid transit. These improvements reduce dwell time, increase passenger comfort and decrease travel time.
On-Board Changes for AATA
In the near term, AATA can reduce dwell time and improve service reliability by implementing contactless cards and encouraging rear-door alighting more clearly.
Implement contactless cards for on-board fare payment.
Reduction in dwell times along Route 4 would involve minimal changes to passenger payment behavior with the use of contactless cards as a near-term strategy. While the time savings of a contactless card system would average about two seconds per passenger compared with the current swipe-card system (see Appendix C for calculation factors), implementing a contactless card system emphasizes convenience and increases perceptions of reliability. If some cash-paying riders find contactless cards attractive and switch payment modes, further time savings can be realized.
Chapter 4 Recommendations
Encourage rear-door alighting more clearly.
As observed in Chapter 2, passengers often exit buses through the front door, forcing boarding passengers to wait and increasing dwell time at stops. AATA already has a policy of rear-door alighting, but signs or ceiling decals reading “Please
Exit through the Rear Door” and occasional announcements would reduce front-door crowding. Greater encouragement of rear-door alighting would allow the bus to get back into motion more quickly.
Chapter 4 Recommendations
Bus Rapid Transit Stations
Creating BRT-ready stations would involve equipping major stops with real-time information, more shelter and seating space, and greater multi-modal access. Adding fare prepayment to these measures would help reduce dwell times.
Transform planned super-stops into BRT-ready stations (AATA).
In the 2010 Washtenaw Avenue Corridor Redevelopment Strategy, AATA identified locations for potential “super-stops”, which would feature increased shelter and seating space, bus pullouts, and real-time bus information screens.1 These stops align with major intersections and areas with high levels of boarding, identified in Chapter 2. Figures 4.1 (a) and 4.1 (b) show the proposed location of these BRT stations. These would be stations on a BRT route that would serve eight stops in the corridor rather than the current seventeen. Limited-stop BRT service would run parallel to continued local bus service.
Chapter 2 identified the problems that bus pullouts present in preventing the bus from accessing the stop and pulling back into traffic. With BRT stations, adding further bus pullouts might not be necessary to mark exclusive space for transit. Instead, real-time information screens and distinctive shelters could help to promote Route 4 as a rapid, reliable service.
4.2 shows a potential design of a high-amenity station from Los Angeles.
Figure
Figure 4.2: Los Angeles Bus Rapid Transit Station
Source: Compass Blueprint,2010
Chapter 4 Recommendations
Develop mobile phone application for real-time information (AATA).
Real-time information screens at stations can be a signature component of creating a rail-like experience for BRT riders, informing them when the next bus will arrive. Still, actual realtime information provided via mobile phone may be more important at minor local stops, where passengers might miss their bus if they are not at the stop at the exact time of arrival.
The October 2011 Ridership Survey can help AATA determine potential use of a mobile phone real-time arrival application.
This feedback may affect the number of screens that AATA needs to deploy to improve reliability perceptions on Route 4.
Install bike racks at BRT-ready stations (AATA).
The installation of bike racks can help integrate the provision of a signature Route 4 service with other improvements underway, such as the completion of shared use paths and potential bike lanes. The presence of bike racks might increase accessibility among riders who currently lock their bikes at stops, despite the lack of formal infrastructure.
Switch to a proof-of-payment system for Route 4 (AATA). The addition of fare vending machines would allow AATA to operate on a proof-of-payment system for its BRT route, thereby decreasing dwell time associated with the fare box on board. The machine could resemble the one shown in Figure 4.3. Those paying with a contactless card could simply touch their cards to the machine, receive a receipt, and then board through either door. Those paying with cash would receive a receipt from the machine as their proof of payment, and could also board through either the front or rear door.
This way, faster boarding and alighting would not exclude cash-paying passengers in any way. Entering the BRT vehicles themselves would require that people have already paid at the station platform. Off-board fare payment will reduce demand on the drivers to be fare box monitors, allowing them to get the bus back into motion more quickly after a stop.
Uniformed officers would enforce payment by conducting random inspections aboard vehicles, or when passengers disembark at their destinations.
Chapter 4 Recommendations
For the BRT route, the proof-of-payment system would apply to key Route 4 stops outside the corridor. If prepayment reduces dwell times on Washtenaw, AATA could implement fare prepayment on its other high ridership routes, and ultimately on all routes.
With the continued operation of local, full-service routes in parallel with a Route 4 BRT service, the possibility exists that people who have obtained proof of payment at a BRT station will simply take the first bus that arrives at the stop, even if it happens to be a local route. AATA can honor proof of payment on the local routes when passengers board at BRT stops. The local routes would still only allow front door boarding.
Figure 4.3: Fare Vending Machine at BRT Station
Source: Next St. Louis, 2009
Transit Signal Priority (TSP)
As discussed in Chapter 2, red lights made up the greatest share of total time the bus spends on Route 4. Giving transit vehicles priority at these intersections would reduce the amount of time they would have to spend at lights, resulting
in decreased in-vehicle transit time for passengers. Figure 4.4 illustrates intersections where transit signal priority might reduce bus delay the most, as these are the locations where the team observed the greatest traffic light delay.
Figure 4.4: Intersections with High Need for Transit Signal Priority
Give buses TSP when they are operating behind schedule (Washtenaw County Road Commission)
The Washtenaw County Road Commission (WCRC) is already planning to implement transit signal priority at all signalized intersections along Washtenaw using Congestion Mitigation and Air Quality (CMAQ) funds by 2013 or 2014. TSP would apply only when the bus is late.2 A bus arriving at an intersection would receive an early green signal if it were running behind schedule. The system would employ automatic vehicle location (AVL) technology, so that drivers do not have to manually trigger a signal change.
The Cities of Ann Arbor and Ypsilanti have control over the traffic signals in their jurisdictions. These jurisdictions would need to coordinate with WCRC to ensure that the same automatic vehicle technology is in place at all intersections.
Implement TSP on an experimental basis at one or two intersections with Level-of-Service (LOS) grades of A or B (WCRC).
Given Route 4’s strong schedule adherence, particularly after service frequency increases in January 2012, implementing TSP only when the bus is late may not maximize potential time
Chapter 4 Recommendations
savings. Where concerns about traffic impacts exist, however, implementing TSP on a simply experimental basis can help ease fears that TSP will induce greater congestion.
Therefore, implementing TSP for transit vehicles, regardless of on-time performance, on an experimental basis at two intersections with “A” or “B” LOS grades during peak times would be beneficial. These are intersections that already do not suffer from congestion during peak times, so the implementation of TSP is unlikely to degrade level of service to a failing grade.
In addition, data on traffic signal timings at three intersections within the Ann Arbor portion of Washtenaw suggest that a maximum of 5 buses per hour during the AM peak would require TSP. In the PM peak period, the number of buses that might require TSP is even smaller because traffic on Washtenaw receives longer green signals. Not every bus would require TSP, so the number of signal cycles that TSP would disrupt per hour would be small. On the other hand, the analysis in Chapter 2 revealed that intersection delay for Route 4 was highest during the PM peak period. Those buses that do experience delay en route would gain substantial benefits.3
If unconditional TSP does not degrade LOS grades in the experiment, TSP could be extended to all signalized intersections during peak periods, and buses could achieve the maximum possible benefits from the new technology. Extensive TSP would also help Route 4 transit improvements qualify for federal BRT funding.
Queue Jump
Jump Lane (westbound)
Figure 4.5: Proposed Locations for Queue Jump Lanes
RECOMMENDATIONS BY SEGMENT
As Chapter 3 discussed, TSP alone might not help speed up travel times where the bus is caught behind significant congestion. Queue jump lanes are one solution to help buses bypass congestion where specific conditions allow for the creation of small bus-only lanes. Figure 4.5 shows the proposed location of queue jumps in the corridor.
This section discusses the unique conditions that warrant queue jump lanes and other transit improvement measures along specific segments of the corridor. The segments correspond to key intersections that also serve as municipal boundaries.
Segment 1: Ann Arbor---
Split with Stadium to Huron Parkway
Convert existing stops to BRT-ready stations Eastbound at Manchester and Westbound at Sheridan (AATA). This point serves as both an entry and exit point to the corridor, and offers significant opportunities for AATA to introduce branding of the new signature service to customers. The addition of vending machines could help reduce dwell
Chapter 4 Recommendations
time as the bus enters and exits the corridor. Also, the presence of adequate shelter and seating space could induce more residents of the homes north and south of Washtenaw at these points to use BRT as a means of reaching destinations on the corridor or the two downtowns.
Install a sign in the right-turn lane at Manchester Road that designates the lane as “Right Turn Only Except for Buses” (MDOT).
Currently, eastbound buses have to move into the rightmost lane on Washtenaw to stop at the Manchester location, and then quickly move into the middle lane to avoid encroaching on the right-turn lane. Particularly during congested times, this could potentially keep the bus stalled at the stop as it waits to re-enter traffic. Figure 4.6 illustrates the turn lane at Manchester, as well as the proposed change that would allow the buses to continue straight within the right-turn lane. While Chapter 2 did not identify this stretch as one where the bus experienced slow speeds, avoiding conflicts in re-entering traffic allows the bus to operate with more consistent speed as it enters the corridor.
Buses Continue Through, Cars Must Still Turn Right
Establish priority lanes between Manchester and Platt Roads (MDOT, AATA, and the City of Ann Arbor).
Figure 4.7 illustrates a potentially underused center left-turn lane between Manchester and Platt. The turn-lane is present throughout this stretch, but there are few driveways onto which people could turn directly from Washtenaw.
As Chapter 3 outlined, authorities nationwide have implemented priority lanes on routes with the highest ridership where congestion also substantially degrades ontime performance.
In the short-term, MDOT could mark this stretch as a highoccupancy vehicle (HOV) lane. In the long-term, MDOT may be able to acquire the right-of-way necessary to create an exclusive transit lane. As Figure 4.7 shows, the right-of-way south of Washtenaw is currently in the hands of a single owner: Washtenaw County. The single owner could facilitate easier purchasing of right-of-way when funds are available.
Figure 4.6: Bus Through Lane between Manchester and Platt
Data Source: Esri, 2012
After installation of a traffic signal, clearly mark the pedestrian crosswalk at Platt Road (MDOT and City of Ann Arbor).
Currently, an unsignalized crosswalk exists at the County Recreation Center stop. Given the high speeds and volume of traffic along Washtenaw Avenue, transit users may feel unsafe crossing at this particular point. Improvements on the crosswalk at Platt can encourage people to cross the street safely. The presence of a crosswalk could enhance reliability around Route 4 by assuring riders that they can reach their destination at the County Recreation Center, the planned
The areas adjacent to Huron Parkway already have major commercial establishments that attract clientele from throughout the region, including the Whole Foods complex and the Arlington Square Mall. In addition, Huron Parkway is a transfer point to Routes 7 and 22 in the eastbound direction, and a BRT station here would ensure that those making
Figure 4.7: Potential Transit Priority Lane between Manchester and Platt
Potentiall y Underused Center Turn Lane
Conti nuous Parcel Under Cou nty Ownership
Data source: Esri, 2012
Chapter 4 Recommendations
transfers still enjoy the benefits of the rapid transit service.
The establishment of signature transit service at these points can highlight their significance. Seeing permanent, highamenity stops could motivate these businesses to emphasize their location along the corridor, only increasing the popularity of the destinations and the Route 4 BRT service.
Huron and Washtenaw: Queue Jump Lanes with TSP
Install queue jump lanes with unconditional transit signal priority in both directions at Huron Parkway (MDOT).
Chapter 2 identified Huron Parkway as a major point of red
light delay, and an intersection where the bus encountered significant congestion during peak periods. In particular, at the southwest corner of Huron Parkway, MDOT could purchase the necessary right-of-way from the Shell gas station, which currently has four entrances. Creating a queue-jump lane at this point, as shown in Figure 4.8, would not compromise the ability of auto drivers to access this gas station. Queue-jump lanes shown with separate priority signals would allow the bus to get ahead of other vehicular traffic at this point, and reduce times spent at red lights. Figure 4.8 shows queue jump lanes at Washtenaw and Huron.
Figure 4.8: Proposed Queue Jump Lanes with Transit Signal Priority at Huron Parkway
Convert Gas Stati on ROW to Q ueue Jump
Convert Si de R OW to Queue Jum p
Data source: Esri, 2012
Chapter 4 Recommendations
Segment 2: Ann Arbor--
Huron Parkway to US-23
Convert both stops east of Pittsfield at Arborland into BRTready stations (AATA).
Arborland Mall is a major landmark for the corridor and a key shopping destination. Chapter 2 delay analysis showed that, particularly during the AM peak and mid-day periods, the bus was stopped here to ensure schedule adherence, indicating ahead-of-schedule performance. During the PM peak period, however, delays here were due to significant boarding and alighting times or congestion getting back into traffic. Since the stop is highly popular with shoppers, fare prepayment would reduce these dwell times and allow the bus to get back into motion more quickly.
BRT stations at the stops east of Pittsfield would complement the efforts underway by MDOT to allow pedestrian crossings in all directions at the Pittsfield and Washtenaw Avenue intersection. Transit passengers will no longer have to cross a street three times to reach stops on the opposite side of the street. The added amenities of a BRT station will augment attempts to make Arborland into a friendlier destination for users of non-automobile transportation modes.
Install queue jump lanes with TSP in both directions at Washtenaw Avenue and Yost Boulevard (MDOT).
In the eastbound direction, the Yost Boulevard intersection is directly prior to the on-ramp to US-23. As discussed in Chapter 2, during periods of congestion on either Washtenaw Avenue or US 23, the Route 4 bus would get stuck behind traffic waiting to pull onto the on-ramp, slowing down the bus. A queue jump lane with a separate priority signal at Yost Boulevard could allow the Route 4 vehicle to get ahead of this traffic and continue en route without impedance. Figure 4.9 illustrates the potential arrangement of queue jump lanes at Yost Boulevard. In particular, the privately owned service drive could provide the right-of-way necessary to both install a queue jump lane and maintain adequate sidewalks.
In the westbound direction, the team observed that in several instances, the bus was unable to reach the stop east of Pittsfield due to congestion at peak periods. The addition of a queue jump lane could allow the Route 4 vehicle to get ahead of other vehicles at the prior intersection and reach the stop with fewer impediments. To avoid re-rerouting the driveway
entry to Arborland Mall, MDOT could post clear signage that indicates that the rightmost lane on Washtenaw is “Right-Turn
Only Except for Buses”.
Segment 3: Pittsfield Township---
US-23 to Golfside Road
Dr Yost and Washtenaw: Queue Jump Lanes with TSP
Service Dri ve can provide Additional ROW for queue jump
Install queue jump lanes with TSP in both directions at Carpenter Road (MDOT and WCRC).
Arborland Parking Lot
Reroute Driveway to C reate ROW for Queue Jump
Figure 4.9: Proposed Queue Jump Lanes with Transit Signal Priority at Yost Boulevard
Data source: Esri,2012
The bus delay analysis identified the Carpenter intersection as a major contributor to red light delay, and part of a larger segment where the bus was traveling at low speeds. Similar to the US-23 on-ramp near Yost, congestion on both Washtenaw and US-23 during peak travel periods can keep the bus stuck behind traffic waiting to enter US-23. Similar to the southwest corner of Huron Parkway, MDOT could purchase right-ofway at the gas station in the northwest corner of Carpenter, and close one entrance to the gas station. In the eastbound
Chapter 4 Recommendations
direction, a queue jump lane from purchased right-of-way at the parking lot could allow the bus to avoid potential bottlenecks as three lanes of traffic turns into two. Figure 4.10 illustrates the location of queue jump lanes at Carpenter.
Carpenter and Washtenaw: Queue Jump Lanes with TSP
Extend the length of the pedestrian walk signal in all directions at Carpenter (WCRC).
Currently, the walk signal length at Carpenter is too short to allow pedestrians to cross before the signal switches.
Figure 4.10: Proposed Queue Jump Lanes with Transit Signal Priority at Carpenter/Hogback Road
Ramp
Map source: Esri,2012
Chapter 4 Recommendations
Combined with the lack of completed sidewalks, the pedestrian conditions at this intersection make crossing Washtenaw dangerous. Ensuring adequate timing for the walk signal can create increase pedestrian friendliness.
Convert the existing stops east of Carpenter and at the County Service Center into BRT-ready stations (AATA).
Carpenter Road is already a major commercial arterial, albeit one with large setbacks and parking lots. Higher-amenity, visible transit stations can emphasize the presence of Route 4 on this stretch to customers and businesses alike. The added comforts of a signature rapid transit service can help demonstrate the convenience of transit in reaching destinations on Carpenter.
Complete sidewalks along Washtenaw Avenue and in adjacent areas (Pittsfield Township).
In the visioning document for Reimagine Washtenaw, Pittsfield Township prioritizes sidewalk completion. This completion is vital to transit improvements, particularly along Washtenaw Avenue and areas immediately adjacent. Currently, pedestrians on this segment face uneven walking surfaces, and unclear directions of where to walk after crossing.
Regardless of infrastructure upgrades at the actual transit stops, Pittsfield Township must simultaneously complete its sidewalks in order to assure Route 4 users that they will consistently be able to reach or depart from the stops without danger or impediment.
Consolidate the stop in the eastbound direction at Foster Road, and relocate the stop at Foster Road in the westbound direction to Deake Road (AATA).
While bus stops on this stretch are currently spaced less than ¼ mile apart, the distance between the stops at Deake and Foster on the Eastbound Route is about ⅛ mile. Glencoe
Crossing shopping mall, shown in Figure 4.11, is already an important commercial destination at Deake Road, so the stop at Foster is a prime candidate for consolidation in the near term.
Chapter 4 Recommendations
Install a queue jump lane with TSP in the westbound direction at the Golfside intersection (MDOT and WCRC).
Convert the AATA stops at Deake to BRT-ready stations (AATA).
Creating BRT stations would emphasize Glencoe Crossing as a major destination, and showcase the viability of transit in helping customers reach it comfortably. The development of bus rapid transit would motivate new commericial investment, filling the current vacancies at Glencoe Crossing.
The stop at Deake is an important transfer point to Routes 7 and 22. Upgrading this stop with BRT-ready infrastructure would allow transferring passengers to utilize BRT service.
Chapter 2 identified the westbound, near-side stop at Golfside as a particularly problematic point because buses are often stuck behind traffic stopped at the light ahead, preventing them from reaching the stop. Figure 4.12 illustrates the stop location at Golfside. After reaching the stop and boarding or alighting passengers, the bus may have to stop at the red light for a second time in the same run, creating a frustrating source of inconsistency. A queue jump lane in the westbound direction only with separate signal priority would ensure that a bus that had finished boarding and alighting passengers would not have to spend two complete traffic signal cycles at this intersection. Figure 4.13 illustrates the queue jump lane configuration at Golfside.
Figure 4.11: Glencoe Crossing shopping mall at Deake Road
Golfside: Westbound Queue Jum p Lane with TSP (Pr eferred Option) 11' of New ROW Required
Washtenaw Avenue
Figure 4.12: Stop Location at Golfside Road
Figure 4.13: Proposed Queue Jump with Transit Signal Priority at Golfside Road
Kmart Parking Lot
Data source: Esri,2012
The Reimagine Washtenaw Joint Technical Committee has already formulated a preliminary vision for the redevelopment of the northeast corner of the intersection between Golfside and Washtenaw.4 The vision calls for denser development with an internal street system, a mix of uses, green spaces, and a multimodal transportation hub. In addition, AATA has plans for a park-and-ride facility at this site in the near-term. Keeping the stop in its current location and adding a queue jump lane would allow Route 4 to integrate with existing plans.
Convert the existing stops east of Golfside into BRT-ready stations (AATA).
The plans for new, denser development at Golfside center around improved transit and the creation of a multimodal hub.
Providing high-amenity AATA stations at this location would assure customers that they can reach this new, vibrant location through Route 4, with a high level of comfort. The distinct branding of BRT service can help highlight the accessibility of the new development to potential investors and business owners.
Chapter 4 Recommendations
Segment 4: Ypsilanti Township----
Golfside Road to Hewitt
Complete sidewalks along Washtenaw Avenue and in adjacent areas (Ypsilanti Township).
Incomplete sidewalks in this area create a lack of clear direction that pedestrians can walk to access transit stops, and also their destinations. On this segment, pedestrians have often have to cross over driveways and grass islands with no marked pedestrian space whatsoever, particularly on the north side of Washtenaw. Ypsilanti Township can help highlight transit-related upgrades through sidewalk completion. Sidewalk completion could also increase perception that the improved rapid transit system will actually deliver people to their destinations on this segment.
Relocate the westbound stop west of Brookside to east of Boston directly in front of Squire’s Plaza. Move the westbound stop opposite Welman to the east, Fountain Plaza (AATA).
Squire’s Plaza and Fountain Plaza are already key retail destinations, but currently, transit stops on the westbound route are located east of these major landmarks. Figure 4.14 shows the current positioning of the stop at Fountain Plaza.
Chapter 4 Recommendations
Re-aligning the stops directly in front of Squire’s Plaza and Fountain Plaza would ensure riders they can reach these points with transit. The installation of shelter infrastructure and information can further emphasize the accessibility of Route 4 local service to these commercial centers.
Install a signalized and clearly marked crosswalk at Fountain Plaza to complement the new stop infrastructure on the westbound route (MDOT and WCRC).
A signalized and marked crosswalk at this point will allow transit riders to more safely access Fountain Plaza in either direction. Currently, there is no walk signal or marked crossing area, and pedestrians may feel that Route 4 will not deliver them to their destinations.
Consolidate the westbound stop at Hewitt. Move the stop east of Hewitt to the far side of the intersection. Convert AATA stops at Hewitt to BRT-ready stations. (AATA)
The analysis in Chapter 2 found that the westbound Hewitt stop was a point where the bus could get stuck behind traffic which blocks the stop. As a result, the bus might have to wait through two signal cycles to clear the intersection, adding to delay. Moving the westbound AATA stop directly to the west side of the intersection would help resolve this issue. The close proximity of the current stop west of Hewitt would make it a prime candidate for elimination.
Figure 4.14 Current Stop Location at Fountain Plaza
Converting the newly aligned AATA stops at Hewitt to BRTready stations would be the next step. With large areas of asphalt and vacant land, the Hewitt intersection appears poised for major new development. High-amenity stations on a rapid transit service can serve as an incentive for business owners looking to move into the area, as they will be able to promote the access of their facilities.
Chapter 4 Recommendations
Install queue-jump lanes with TSP in both directions at Hewitt Road (MDOT and WCRC).
Hewitt and Washtenaw: Consolidate Stops and Implement Queue Jumps with TSP
Queue-jump lanes with separate signal priority at Hewitt will help to mitigate some of the red light delay discussed in Chapter 2, as the transit vehicle would clear the intersection before boarding and alighting passengers at the far-side stops. Figure 4.15 shows the stop configuration at Hewitt. Implementation would require MDOT to acquire the necessary right-of-way. In particular, MDOT would have to acquire right of way at the parking lot on the northwest corner of the intersection, which goes right up to the road.
Figure 4.15: Proposed Queue Jump with Transit Signal Priority at Hewitt Road
Queue Jumps at Intersection
Remove Stop West of Hewitt
Remove Stop East of Hewitt
New Hewitt Stop
Data source: Esri,2012
Chapter 4 Recommendations
Segment 5: City of Ypsilanti---
Hewitt Road to Summit
Convert the existing stops at Oakwood in both directions into BRT-ready stations (AATA).
In the westbound direction, this is an entryway to the corridor, so high-amenity stops can convey a distinct identity for the corridor and Route 4 service. BRT-ready stations allow for branding opportunities for AATA. This is also the entry to Eastern Michigan University, a key Washtenaw Avenue institution. High-amenity stops would increase perceptions of quality of transit service within the EMU community, a key ridership group for Route 4.
CONCLUSION: A COMPLETE APPROACH
This chapter has discussed the range of improvements that can enhance transit on Washtenaw. Providing a high-quality BRT service will require a two-pronged approach that both increases access to destinations from transit, and gives transit vehicles priority on the roadway. The limited existing right-ofway remains a significant challenge. Yet stakeholders in the
corridor are already making coordinated efforts to institute transit improvements. Current initiatives, such as transit signal priority and “super stop” construction, can build momentum for rapid, reliable transit on Washtenaw in the future. The next chapter provides an implementation strategy to guide a coordinated approach for long-term transformation of the corridor.
NOTES
1. Reimagine Washtenaw Joint Technical Committee. (2010). Washtenaw Avenue Corridor Redevelopment Strategy. Retrieved April 20, 2012 from <http://www.washtenawavenue.org>. 29.
2. Schlack, B. (2012). Personal Interview. March 30, 2012.
3. City of Ann Arbor. (2012). “Traffic Signal Timings.” Traffic Engineering Department Obtained from Pat Cawley.
4. Reimagine Washtenaw Joint Technical Committee. (2011). Reimagining Washtenaw Avenue: A Vision for Corridor Redevelopment. Retrieved April 20, 2012 from <http://www. washtenawavenue.org>. 17.
CHAPTER 5
Let’s Roll: Reimagining Transit on Washtenaw Avenue Implementation
Chapter 5 Implementation
PHASED IMPROVEMENTS FOR WASHTENAW TRANSIT
Washtenaw Avenue transit enhancements require significant time and planning for implementation. The planning efforts of Re-imagine Washtenaw demonstrated the public desire and municipal support for high-quality transit serving a safe and accessible environment. However, implementation depends upon close coordination between stakeholders, particularly when implementing transit signal priority, acquiring right-of-way (ROW), and constructing queue-jump and dedicated lanes. This chapter describes three phases for implementing the recommendations described previously, moving from less intensive to more intensive treatments. The phases advance cumulatively: early improvements, particularly those involving right-of-way, make the transition to later phases more efficient. For example, the acquisition of right-ofway needed for queue jump lanes will substantially reduce the right-of-way acquisition needed for transitways. World-class transit on Washtenaw would begin with Phase One: Enhanced Bus, progress toward Phase Two: BRT Lite, and end with Phase Three: Bus Rapid Transit, as AATA and the municipalities identify and allocate additional resources.
PHASE ONE: ENHANCED BUS
Time Frame: Years 1-3
Improvements: Enhanced Bus includes implementation of many currently planned or already underway corridor improvements, such as improved bus stop facilities and a complete pedestrian network. These improvements increase the security of pedestrians and transit riders while also slightly enhancing bus speed and reliability through inexpensive means, including minor stop relocation and right-turn lane designation for buses. Transit signal priority will require the largest financial and technological investments. The Washtenaw County Road Commission is currently leading the signal prioritization project. They recently submitted an application for CMAQ funding and aim to have transit signal priority operational within the next two years. Simple marketing and education measures can also capture additional riders and decrease dwell times. Table 5.1 details components of this phase, together with the institutions responsible for their implementation.
Table 5.1: Enhanced Bus Improvements
Organization
AATA
City of Ypsilanti, Ypsilanti Township, Pittsfield Township, City of Ann Arbor
City of Ypsilanti, Ypsilanti Township, Pittsfield Township, City of Ann Arbor
AATA
Washtenaw County Road Commission
Chapter 5 Implementation
Measure
Install bus schedules at all stops
Highlight Route 4 as a “frequent service” route in maps and marketing
Implement contactless card fare collection
Strengthen rear alighting policy
Relocate stops to “far side” locations
Complete sidewalk network
Install Pedestrian Crossings at key stops
Install Transit Signal Priority at all signalized intersections
Funding: Phase One improvements can be funded entirely through existing resources. Completing the sidewalk network and installing pedestrian crossings will require additional grants, but municipalities have experience implementing these improvements at other locations.
Impacts: None of the measures would significantly affect traffic levels on Washtenaw. Phase One marginally mitigates
Route 4 bus delay, with the most time savings coming from transit signal priority. The Transit Cooperative Research
Program (TCRP) provides formulas enabling a more precise calculation of time savings. Table 5.2 displays the estimated time savings derived from Transit Signal Priority.
Table 5.2: Average Time Savings in Seconds Per Run for Transit Signal Priority
Chapter 5 Implementation
PHASE TWO: BUS RAPID TRANSIT LITE
Time Frame: Years 4-7
Improvements: BRT Lite, a common description for enhanced bus service operating in mixed traffic while relying on queue jumps and transit signal priority, represents a dynamic increase beyond Phase One. Installation of queue jump lanes requires modest right-of-way acquisition. In addition to queue jumps, construction of super stops will form the principal components of BRT Lite, as these will later become BRT stations. The establishment of a Corridor Improvement Authority (CIA) by this point would allow municipalities to pool together their resources to make the significant improvements to transit service in Phase Two. Table 5.3 details components of this phase and the institutions responsible.
Funding: Due to its scope and expense, AATA and other entities can best approach BRT Lite as a single project drawing from Federal Transit Administration (FTA) Small Starts
Funding. Established by Congress in 2005, the FTA periodically introduces improvements which streamline the application requirements. Small Starts, a subcategory of the New Starts Program, provides a maximum of $75 million in funding. As an applicant, AATA would need to complete two phases. In
the first phase, AATA would complete an alternatives analysis, which “evaluates the costs, benefits and impacts of a range of transportation alternatives designed to address mobility problems and other locally-identified objectives in a defined transportation corridor and [determines] which particular investment strategy should be advanced for more focused study and development.”1 After completion of an Alternatives Analysis, the project would move into project development phase, in which AATA would complete preliminary engineering and final design work. Upon completion of both phases, FTA releases a funding recommendation.2 In addition to the $75 M funding ceiling, other criteria include improvements already present on the corridor and other planned enhancements. These requirements are listed below.
Small Starts Requirements: Planned Enhancements
• Total project costs under $250 Million
• Substantial Transit Stations
• Special Branding of Service
• Transit Signal Priority
Small Starts Requirements: Current Corridor Characteristics
• Low Floor/Level Boarding Vehicles
• Frequent Service (10 minute peak/15 minute off peak)
• Service offered 14 hours per day
Chapter 5 Implementation
Impact: Once implemented, queue-jump lanes and transit signal priority will ameliorate the sizable current delay directly attributable to dwell time and congestion at red lights. This will significantly increase reliability. Permanent stations and distinctive branding not only increase rider satisfaction but also catalyze real estate development. Table 5.4 lists the average time savings queue jump lanes would provide.
Construct “super stops” with ticketing machines for pre-board fare payment
Apply distinct “signature” branding to stations and transit vehicles
City of Ypsilanti, Ypsilanti Township, Pittsfield Township, City of Ann Arbor
County Road Commission
Provide unconditional transit signal priority at peak hours
Table 5.3: Bus Rapid Transit Lite Improvements
Table 5.4: Average Time Savings in Seconds Per Run of Queue Jump Lanes
Chapter 5 Implementation
PHASE THREE: BUS RAPID TRANSIT
Time Frame: Years 8-15
Improvements: Bus Rapid Transit introduces full BRT along Washtenaw Avenue by constructing dedicated lanes. BRT will be a main feature of Washtenaw Avenue, and riders will enjoy frequent, reliable service uninhibited by congestion. Table 5.5 details the improvements and the organization responsible.
Impact: The construction of a transitway using dedicated lanes will result in the largest increase in reliability as well as time savings. The creation of a transitway will have a positive effect on traffic levels on the corridor. Elimination of bus operation in mixed traffic improves automobile traffic flows by removing delays caused by bus dwell time at stops. Dedicated lanes will result in an average time savings of 6.5 minutes on the corridor. This represents a 30% reduction in travel time. 3
Table 5.6 shows the relative costs and benefits of the improvements outlined in this chapter, and the actors involved at each phase.
Table 5.6: Cost-Benefit Matrix of Transit Improvements
Chapter 5
BUS RAPID TRANSIT IMPLEMENTATION IN MICHIGAN
Three major Michigan regions - metropolitan Detroit, Grand Rapids, and Lansing - are already planning for Bus Rapid Transit implementation. Each is at a different stage of the process, and has confronted different implementation challenges. The Detroit project is in its infancy, and envisions a multi-county system on a much greater scale than a potential Washtenaw BRT line. However, the latter two projects are comparable to a potential Washtenaw proposal, and their progress through the transit planning process provides useful lessons for future application.
Grand Rapids
The Grand Rapids Silver Line project is the more advanced of the two, and shows the potential duration of a BRT implementation process. The region’s Interurban Transit Partnership, known as The Rapid, completed the required Alternatives Analysis and selected BRT as the locally preferred alternative for the Division Avenue corridor in January 2007. It was approved into federal project development in December 2007, but federal confidence alone would not suffice to move the project forward.
Figure 5.1: Transit Master Plan Meeting
Source: LSL Planning
Figure 5.2: Flyer for Rapid Millage Campaign
Source: GRPundit.com
In May 2009, after winning several millage increases over the previous decade, The Rapid was narrowly defeated when it asked voters in participating cities to fund an additional 0.12 millage increase to provide local funds for the Silver Line BRT project. The Rapid then conducted a Transit Master Plan process, with extensive public outreach, so citizens could inform its strategic direction and, in consequence, take greater ownership of the agency. In May 2011, in the face of organized opposition, voters narrowly approved a millage increase for The Rapid, including the Silver Line, which is scheduled for groundbreaking in 2013 and operation in 2014, seven years after Alternatives Analysis completion.
Chapter 5 Implementation
As the Grand Rapids case indicates, time and effort are required for navigating the federal process and building local public support for enhanced transit. Strong support in central city public and private sector leadership was insufficient without public outreach to counter opposition in outlying areas skeptical of the project’s benefits. Citizens may also be more receptive to funding rapid transit lines as components of an overall service expansion package, rather than as stand-alone elements. The recently completed AATA Transit Master Plan visioning process strongly resembled The Rapid’s, so AATA may already be on track to repeat its success.
Figure 5.3: CATA Route 1 Bus on Wide Michigan Avenue Right-of-way in Downtown East Lansing
Source: Capitol Area Transportation Authority
Chapter 5 Implementation
The Lansing area is at an earlier stage of BRT planning for the Michigan/Grand River corridor, and is still yet to receive federal clearance for the Small Starts project development process. After initiating its Alternatives Analysis in 2009, with an initial appetite for light rail, the Capitol Area Transportation Authority (CATA) selected BRT as the locally preferred, higherridership, more cost-effective alternative in February 2011. In many respects, the corridor for which BRT is proposed closely resembles Washtenaw. More than the Grand Rapids case, Lansing demonstrates potential institutional arrangements for BRT implementation on Washtenaw, since both a Corridor Improvement Authority and the Michigan Department of Transportation (MDOT) are involved.
Like Washtenaw, Michigan/Grand River Avenue is a partially MDOT-controlled corridor including two urban cores (Lansing and East Lansing) and educational institutions (Lansing Community College and Michigan State University). The Capital Area Transportation Authority (CATA) Route 1 bus carries over 6000 riders per weekday. High-capacity articulated buses already serve the route.
The cities of Lansing and East Lansing approved a Michigan Avenue Corridor Improvement Authority (CIA), like the one envisioned between the four municipalities on Washtenaw. In general, the Washtenaw Avenue Joint Technical Committee is the more active body today, despite its more limited formal authority.4 On Michigan/Grand River, the major advocate for bus rapid transit is CATA, not any municipal government actor. Michigan State University has also participated.
Another important institutional actor, MDOT, owns the majority of the proposed BRT corridor. As a result, the agency’s role in the process provides an important example for Washtenaw, particularly since both corridors lie within MDOT’s University Region. CATA’s attempt to secure MDOT funding for its Alternatives Analysis was unsuccessful, but MDOT could still provide assistance to the project from its dedicated transit fund.
To date, MDOT has cooperated closely with CATA as an interested partner, and assumes that transit signal priority will be part of the project. Decisions on what priority measures can be implemented, without unduly impeding general traffic flow, await more formal modeling. Most conveniently, the section of the corridor through East Lansing includes a wide median
and a total 120’ right-of-way, nearly twice that of Washtenaw, so bus-only lanes could be added without constraining current roadway capacity.
Chapter 5 Implementation
CONCLUSION
While each corridor and project has unique attributes, the Michigan/Grand River case underlines the prospective roles that different actors might play in a Washtenaw Avenue BRT implementation process. Municipalities and local governments could have an important supporting role, through a Corridor Improvement Authority or otherwise, and MDOT would retain decision-making power over the roadway itself. As in Lansing, however, the responsibility for driving the process will ultimately rest with the transit agency itself.
The phased implementation plan provided in this chapter would require extensive coordination among Washtenaw Avenue stakeholders. Fortunately, the Re-imagine Washtenaw Joint Technical Committee has established a sound foundation for municipal cooperation in the study area. MDOT and AATA are already engaged in that effort as well, and would take on a much larger role in the process outlined above.
In the near term, enhanced transit on Washtenaw faces two major contingencies. First is the formation of a Washtenaw Avenue Corridor Improvement Authority (CIA), which has been delayed while the Michigan Legislature considers authorizing CIAs consisting of more than three municipalities. If a CIA is formed on Washtenaw, and given revenue collection ability, it would accelerate the work of the existing Joint Technical Committee, and possibly fund corridor improvements up to and including right-of-way acquisition. Second is the potential expansion of AATA as a new Washtenaw Area Transportation Authority. Besides increasing the eastern communities’ financial stake in the transit system, creation of WATA would boost the transit agency’s capacity to undertake projects,
Chapter 5 Implementation
and incentivize the transit agency to invest new resources in routes extending beyond US-23. As central axis of the County’s urbanized area, Washtenaw is a natural starting point for enhanced high-capacity transit, as described in the AATA Transit Master Plan.
NOTES
1 Federal Transit Administration. (2012). FTA Major Capital Transit Investment Fact Sheet: Alternatives Analysis. Retrieved from www.fta.dot. gov%2Fdocuments%2FAA_Fact_Sheet.doc.
2 BRT Policy Center. (2009). Funding BRT in the US. Retrieved from http://www. gobrt.org/funding3.html.
3 Calculations based on: Transit Cooperative Research Program.(2007). Report 118.
4 Murphy, R. (2012). Personal Interview. March 25, 2012.
As Grand Rapids, Lansing and other Michigan regions implement bus rapid transit, their progress can provide important insights for BRT implementation on Washtenaw, and also familiarize citizens with this rapid transit model. While any transportation project of this scale requires time and resources to bring to fruition, world-class transit on Washtenaw is no distant dream. BRT planning responds to immediate needs for greater speed, reliability and safety on AATA Route 4, as well as the long-term imperative for making Washtenaw a sustainable, accessible backbone for the Ann Arbor-Ypsilanti region. The great advantage of BRT is that strategic, incremental enhancements of existing service can roll the process forward today.
5 Interurban Transit Partnership. (2010). Transit Master Plan Final Report. Retrieved April 16, 2012 from http://www.ridetherapid.org/assets/files/8b/ transitmasterplanfinalreport_071210.pdf.
Let’s Roll: Reimagining Transit on Washtenaw Avenue
Appendix A: Case Studies
Emerald Express Phase 1: Eugene-Springfield, Or-
egon
Status: In Operation since 2007
Length: 4 miles
Stations: 10
Cost: $25 M ($6.25 M per mile)
Current Average Weekday Corridor Ridership: 6600
Jurisdictions: City of Eugene, City of Springfield
Lane Transit District (LTD), the transit agency that serves the Oregon cities of Springfield and Eugene, originally considered enhancing its bus system with a light rail system, similar to that pioneered in Portland, but ultimately determined that the expense was too great to sustain. Instead, this college town became the first smaller city in the United States to implement bus rapid transit, following the example set by other international cities.
(earmark) funded the majority of the project.
Like the Ann Arbor area, Eugene-Springfield is a mid-sized region with major downtown service job centers including a hospital (Sacred Heart Medical Center) and a state university (University of Oregon). The EmX’s weekday ridership was 2,667 prior to the implementation of BRT, just a bit smaller than Route 4’s ridership. Unlike Washtenaw, however, the corridor is not lined with strip commercial areas. Much of it had contained a large median, which LTD adapted for use as a median transit way. The transit way is narrow on many stretches, and buses in both direction share stop infrastructure on the route. The ten stops featured covered shelters with seating, trash receptacles, lighting, maps, information displays, real-time information, and bike racks.
The initial EmX bus rapid transit project consisted of a fourmile link between downtown Eugene and Springfield. The project did not qualify for New Starts funding; the Small Starts program category where most Bus Rapid Transit projects seek funding did not exist. A $9.8 million discretionary grant
The transit way runs along 60% of the route, with curbside bus lanes making up the remainder. The BRT system runs on exclusive lanes for 60% of the corridor. For the other 40 percent, the buses operate in mixed traffic but gain priority through queue jump lanes and transit signal priority.2 Transit Signal Priority was installed at 16 of the 23 signalized intersections along the route, and EmX uses ground loop
Appendix A: Case Studies
signaling to grant vehicle priority. All signals equipped with TSP are located within and maintained by the city of Eugene.
Gathering political and financial support for this system faced the challenges of public concern over the smaller size of the city as compared to other cities that use BRT, and worries over how the system would affect the flow of traffic in certain sections. Business owners feared that the system would reduce access for their customers. Concerns about disruption of traffic initially stopped LTD’s plans for dedicated running way on the EmX service. LTD was unable to remove parking or travel lanes in many cases, and it could not relocate property along the route for dedicated lanes. A final issue for implementing the system was making sure that both cities would receive equal expansion, that is, expansion projects would need to be alternated among cities so that one is not getting more attention than the other.1
The new service reduced travel time by 1 minute, a 4 percent reduction. However, over 80 percent of users perceived the time savings to be significantly greater. In a survey, users indicated that they believed the service was at least 15 minutes faster than the former service. Lane Transit District
attributes the travel time changes to reductions in signal delay (28%), dwell time (10%) and time spent in transit (18%).2
The EmX also decreased the level of travel dispersion times indicating increased reliability. In 2010, LTD added 10 more hybrid buses to the EmX fleet, and ridership for the service exceeded 4 million since its beginning in 2008. Ridership gains were substantial and far outpaced LTD projections. The EmX grew from 4,000 riders per day in February 2007 to over 6600 riders per day in 2008.3 An expansion of the system, called West Eugene EmX Extension, is awaiting FTA funding approval and is scheduled to undergo an environmental analysis. 4
Eugene: EmX Station with amenities
Source:Skyscraper, 2008
Appendix A: Case Studies
Lessons from EmX:
• BRT can be highly successful in medium-sized cities.
• Transit authorities can adapt to limited right-of-way conditions and roadway restrictions to implement BRT.
• Distinct branding can induce new ridership and greater perceptions of reliability.
• Reducing stops from 18 to 10, creating an average stop spacing of ½ mile, reduced dwell time delay.
• Placing all stops at the far side of the intersection maximized the effectiveness of TSP.
Source: TheAntiplanner.com, 2010
Source:Kezi 9 News, 2011
Eugene: EmX Running Way
Eugene: EmX Level Platforms
The Silver Line: Grand Rapids, Michigan
Status: Scheduled to operate in 2014
Length: 9.6 miles
Stations: 33
Cost: $39.9 M ($4.15 M per mile)
Current Average Weekday Corridor Ridership: 2300
Jurisdictions: City of Grand Rapids, City of Wyoming, City of Kentwood
Appendix A: Case Studies
The main flows of commuter traffic into downtown Grand Rapids use US-131, which runs parallel to Division Avenue, a historic corridor spanning three municipalities. Since peak-period congestion creates varying delays for driving commuters on US-131, the Interurban Transportation Partnership (ITP), which manages the bus system of Grand Rapids, called The Rapid, proposed a Bus Rapid Transit line to run from 60th Street in Kentwood, Michigan, to the heart of downtown Grand Rapids. Added benefits, as asserted by advocates and leaders supporting the proposed Silver Line, involve spurring redevelopment along the corridor, which has many vacant properties, and increased access to the downtown that does not require construction of more parking structures.
Planning the Silver Line Rapid Transit along Division Avenue in Grand Rapids, Michigan took the cooperation of three municipalities (Wyoming, Kentwood, and Grand Rapids) as well as MDOT. The project started in 2001, and cooperation among the stakeholders has fosterd the process. The proposed 9.6 mile route with 33 stations narrowly passed the millage vote in 2011, winning by 136 votes as a proposal bundled with the first phase of the Long-Range Transportation Plan. The $39.87 million project was covered by federal and state funds, with 80% federal funds through Very Small Starts. The project is slated to begin construction in 2013, and will begin operation in 2014.5
Division Avenue is a city-owned road with five lanes throughout most of the corridor. Dedicated bus lanes run through most of the proposed route, with some exceptions in the downtown area. They will be marked with diamond symbols and stripes, and will only be enforced during peak hours, meaning that during off-peak hours, general traffic may use the lanes. Enforcement relies on the consistency of local police in ticketing.
Appendix A: Case Studies
Twenty-three of the 26 intersections will cooperate in transit signal priority, with Vehicle Detection for Early Green and Green Extensions. The remaining three intersections (Burton, 44th Street, and 28th Street) are without TSP because it would have a significant and negative effect on the cross-traffic level of service.6
• The 9-mile route cost $39.9 million to transition from an ordinary bus line to BRT, and the process took 10 years. (The Washtenaw corridor is about 4 miles in length.)
• Intersections with low levels of service (high congestion) may not be able to accommodate TSP.
Most of the 33 stations will have 60 foot wide platforms, and all will have vending machines. Fare collection will switch to prepaid service, with the honor system and random checks enforcing ride payment. The stations are spaced within a range of 0.19 to 1.75 miles apart, with the largest spacing between the southernmost stations of the route, which are surrounded by less dense development. The project does not include park-and-ride lots, but ITP planners expect developers to take responsibility for these.
Lessons from the Silver Line:
• BRT can function with intermittent HOV lanes, only enforced during peak hours. However, Washtenaw has much higher congestion than Division, since Division traffic often opts for the parallel US-131.
BRT station with emergency phone, vending kiosk, real-time information, and raised platform.
Source: The Rapid, 2011
Appendix A: Case Studies
The HealthLine: Cleveland, Ohio
Status: In Operation since 2008
Length: 9.4 miles, (5.7-mile section is an exclusive, two-lane median transitway)
Stations: 36
Cost: $168.4 M ($17.9 M per mile)
Current Average Weekday Corridor Ridership: 21,000 (increased from 15,000)
Jurisdictions: City of Cleveland and East Cleveland
Prior to World War II, Euclid Avenue in Cleveland was known as “millionaire’s row”, due to its expensive housing stock and thriving businesses. After the war, the crucial corridor fell into long term decline. The City turned to a series of subway, rail, and trolley proposals to catalyze redevelopment in this area and connect the city’s two major employment centers: University Circle and Public Square. All of these initiatives failed due to inability to garner appropriate funds. In the 1980s, Mayor George Voinovich proposed the idea of an upgraded bus system. This desire to use bus transit to promote economic viability gave birth to the idea of the HealthLine.
Source: Sam Bobko, 2011
Source: Center for Neighborhood Technology, 2011
Cleveland: HealthLine Station
Cleveland: HealthLine Level Platform
Appendix A: Case Studies
Changing Federal Transit Administration funding standards halted the initial attempts of the Cleveland Regional Transit Authority (RTA) to develop a BRT system. Yet RTA officials remained persistent, and managed to obtain Congestion Mitigation and Air Quality (CMAQ) funding for transit improvements in the late 1990s.
In addition, Mayor Voinovich maintained strong oversight in the BRT development process when he became Governor of Ohio. Successive Cleveland mayors continued to push for FTA funding until they received it. The jurisdictions of Cleveland and East Cleveland also gained the backing of many officials in the Cuyahoga County government, increasing their access to funding sources.
Beyond government officials, however, the most critical support for the project came from the local community development corporation, MidTown Cleveland. In the early 1990s, MidTown Cleveland developed a master plan to reduce blight in the neighborhood by promoting high density development. MidTown Cleveland supported the BRT system because of the conscious effort by the RTA to use BRT as a tool for redevelopment. Due to the promise of BRT facilities,
MidTown Cleveland was able to create a HUD Empowerment Zone to spur economic revitalization.
The RTA was also able to integrate its plans for the HealthLine with the interests of the two key institutions on the corridor: Cleveland State University and the Cleveland Clinic. In the early 2000s, both institutions were enacting plans to reduce automobile use on their campuses. Cleveland State University saw BRT infrastructure as an opportunity to re-orient campus buildings to the street. The Cleveland Clinic was so excited by the new rapid service that they bought the naming rights to the system. The HealthLine has provided a unique branding opportunity for both the transit service and the institutions that it serves.8
Like AATA’s Route 4 on Washtenaw, RTA’s Route 6 previously experienced slow speeds due to congestion on Euclid Avenue, frustrating many commuters. In addition, HealthLine travel speeds improved 34% over the previous bus route running along Euclid. In order to offer a more rapid, reliable, highamenity service, the RTA implemented specialized 62-foot hybrid buses, transit signal priority, off-board payment, ADAcompliant platforms, exclusive bus lanes, and 24-hour service.
In addition, for a 5.7-mile portion of the corridor, Euclid Avenue operates within a median transit way, with a shared passenger platform for both directions of travel.9
Since opening in 2008, ridership on the HealthLine has exceeded that of Cleveland’s light rail service. Ridership increased by 60% in the first three years of operation. RTA officials credit the HealthLine’s offering of rail-like features for this high level of ridership. Cleveland’s HealthLine played a central role in attracting over $4.2 billion in new development along the Euclid Corridor.10
Lessons from the HealthLine:
• Sustaining interest among successive administrations is necessary to realizing a full BRT system.
• BRT upgrades with an explicit land use objective can generate support from community institutions. Community support can offset operating costs.
• Investment in rail-like features for a BRT system can generate ridership gains: a system built for everyone that is still a choice system is an equitable and feasible way to implement transit.
Appendix A: Case Studies
Michigan-Grand River Ave. Rapid TransitLansing, Michigan
Status: Locally Preferred Alternative selected February 2011
Length: 8.45 miles
Stations: 28
Cost: $197.0 M ($23.3 M per mile)
Current Average Weekday Corridor Ridership: 6,288 (2008)
Jurisdiction: MDOT, Lansing, East Lansing, Lansing Township
The Michigan-Grand River Avenue corridor in greater Lansing, like Washtenaw Avenue, is a MDOT-controlled corridor connecting two urban cores, each with a significant university campus, and it is lined with aging auto-oriented commercial centers and moderately dense neighborhoods of varying income levels. Its existing bus routes also carry the highest ridership of any non-University bus route in the area’s transit system. The corridor is currently the only one in Michigan featuring frequent service from articulated buses.
Planning for bus rapid transit along the corridor began earlier than it did in Ann Arbor, perhaps because of the leadership of the area’s award-winning Capitol Area Transit Authority (CATA) or the cities of Lansing and East Lansing, which have
Appendix A: Case Studies
historically faced a somewhat weaker real estate market. An alternatives analysis process that began in 2009 ended in February 2011 with CATA selecting bus rapid transit over light rail and streetcar, as the locally preferred alternative for the corridor. At that time, Lansing, East Lansing and East Lansing Township had already formed a Corridor Improvement Authority to rehabilitate properties along it.
The proposed bus rapid transit line represents a hybrid of sorts, with stations spaced more closely than in a typical BRT project. With greater station spacing, the line did not generate sufficient ridership to meet FTA funding criteria, according to computer models. Adding stations resolved that obstacle, and CATA is now seeking federal Small Starts funding for the line.7
The section of the corridor through East Lansing is currently a boulevard with a 120-foot right-of-way, allowing exclusive bus lanes to be positioned in the median without eliminating lanes for general traffic. The remainder of the corridor generally has a five-lane cross-section. However, a final design is yet to be selected.
NOTES
1. Community Planning Workshop at University of Oregon. Bus Rapid Transit Case Studies. [pdf]. Retrieved April 13, 2012 from: https://scholarsbank.uoregon.edu/xmlui/bitstream/ handle/1794/10504/LTD_Bus_Rapid_Transit_Case%20Studies.pdf?sequence=1
2. Federal Transit Administration. (2009). The EmX Franklin Corridor BRT Project Evaluation. Retrieved April 23, 2012 from: http://www.nbrti.org/docs/pdf/EmX_%20Evaluation_09_508. pdf
3. United States Department of Transportation. (2009). Characteristics of Bus Rapid Transit for Decision Making. Retrieved April 14, 2012 from: http://www.nbrti.org/CBRT.html
4. Lane Transit District. (2012). Retrieved April 23, 2012 from: http://www.ltd.org/index.html? SESSIONID=90b3762e2067461a97339d0b3bdc4479
5. C. Venema (personal communication, February 27, 2011)
6. Interurban Transportation Partnership. (2011). Task I Visioning Report. Retrieved April 24, 2012 from http://www.ridetherapid.org/assets/files/6t/final%20task%20i%20vision%20report.pdf
7. Michigan/Grand River Avenue Transportation Study. (2010). “Results of the Detailed Evaluation of Alternatives.” [pdf]. Retrieved March 24, 2012 from: http://www.migrtrans.org/documents/onepagers/10_URS_104_no7_LR.pdf
8. Climate Leadership Academy. (2012). Accelerating Bus Rapid Transit. [pdf]. Montpelier, VT. Retrieved April 24, 2012 from: http://www.iscvt.org/who_we_are/publications/ResourceGuide-Bus-Rapid-Transit-v1.pdf
9. Breakthrough Technologies Institute. (2008). Bus Rapid Transit and Transit Oriented Development:
Case Studies on Transit Oriented Development around Bus Rapid Transit Systems in North America and Australia. [pdf]. Retrieved April 22, 2012 from: http://www.crcog.org/publications/TransportationDocs/NBHBusway/2010/BRT-TOD-Report. pdf
10. Community Planning Workshop at University of Oregon. Bus Rapid Transit Case Studies. [pdf]. Retrieved April 20, 2012 from: https://scholarsbank.uoregon.edu/xmlui/bitstream/ handle/1794/10504/LTD_Bus_Rapid_Transit_Case%20Studies.pdf?sequence=1
Map of Bus Rapid Transit in the USA
Appendix B: BRT in the US
Cincinnati, OH
Sarasota, FL
Gainesville, FL
Studying Santa Clara, CA
Studying San Francisco, CA
Studying Montgomery County, MD
Oakland, CA
Chicago, IL
Vancouver, WA
San Diego, CA
Richmond, VA
Jacksonville, FL
Fresno, CA
Des Moines, IA
El Paso, TX
Nashville, TN
Planning Twin Cities, MN
Planning San Bernardino, CA
Planning San Antonio, TX
Planning Roaring Fork, CO
Planning Hartford, CT
Planning Grand Rapids, MI
Planning Fort Collins, CO
Planning Austin, TX
Construction Albuquerque, NM Operation
Construction Boston, MA Operation
Construction Eugene, OR Operation
Construction Miami, FL Operation
Construction Orlando, FL Operation
Construction Pittsburgh, PA Operation
Construction Kansas City, MO Operation
Construction Cleveland, OH Operation
Planning Phoenix, AZ Operation
Planning
Snohomish County, WA Operation
Planning Los Angeles, CA Operation
Planning Seattle, WA Operation
Planning
Charlotte, NC Operation
Atlanta, GA Operation
Albany, NY Operation
Las Vegas, NV Operation
Studying: These communities are considering whether BRT would be a good addition to their transportation system. Discussions are happening as part of a comprehensive planning process or a BRT Feasibility Study is being performed.
Planning: These communities made the decision to pursue BRT. They are now currently engaged in engineering studies and alternative analyses.
Construction: These communities have secured funding, many through FTA’s Small Starts program and are acquiring right-of-way to dedicate roadway to transit as well as constructing stations along purposed routes.
Operation: These communities currently operate Bus Rapid Transit systems.
Status of Bus Rapid Transit in the USA
TIME SAVINGS
To calculate time savings to transit vehicles of various intersection and roadway treatments, this study relied on case studies provided by Transit Cooperative Research Program (TCRP) reports. Each jurisdiction reported a range of time savings from the treatments. For example, New York reported a 34-43% reduction in travel time due to implementation of dedicated lanes.1 The plan only obtained these ranges from urban areas that reported percentages of savings, rather than minutes. These ranges were used to estimate minimum and maximum time savings scenarios for AATA buses, using the mean of these figures. This study calculated time savings using average observed delay and travel times from the Bus Delay Analysis. The observed conditions represent the baseline situation, and any time savings are reductions in travel time or delay at those intersections.
Using AATA’s operating cost per bus per hour of $112.30, the study was also able to estimate operating cost savings from treatments. Eighty percent of AATA’s operating costs go towards items other than human resources, and this figure of $89.84 was used to estimate the cost of fuel and other
expenses of actually keeping a bus on the roadway each hour.2
Any time savings reduced these costs.
The study calculated time and cost savings for transit signal priority, queue jump lanes, and dedicated lanes.
Transit Signal Priority (TSP)
To determine delay reduction benefits scenarios from TSP for AATA buses, the study used percentage reductions noted in a 2007 TCRP report for the following cities:
• Portland
• Toronto
• Seattle
• Los Angeles
• San Francisco
Although these areas have much denser development and higher populations than the Washtenaw Corridor, they were the only cities that reported percentage reductions rather than minute reductions in the TCRP studies on TSP.
Appendix C: Benefit Calculation Methodology
The table below reports the minimum and maximum time savings scenarios on AATA’s Route 4 from TSP for the two peak periods, in both directions:
Not surprisingly, the greatest time savings per hour came during the PM Peak. While time savings of 90 seconds or less on a single trip may seem small, Route 4 has the highest ridership in the system, meaning that potentially thousands of passengers gain these benefits. Additionally, passengers may find reduced frustration from less time stopped at red lights. With eight buses operating each hour in each direction, the study calculated total time saved per hour on the route. The study then translated the hourly savings into operating costs, based on AATA’s operating costs per bus per hour. These cost savings are presented in the table below.
With AATA’s operating costs at $112.30 per bus per hour, the maximum savings scenario would be the equivalent of AATA taking a bus out of service during these times. AATA could potentially invest the saved money in stop enhancements or other upgrades on Route 4. Operating cost savings could over time offset the costs of new BRT features.
Queue Jumps
To calculate the benefits of queue jump treatments, this study used TCRP’s estimate of intersection delay reductions for urban areas that have implemented queue jumps. The typical reduction is 5-15% in time savings beyond the benefits of TSP. The percentage figures served as the parameters for the minimum and maximum time savings scenarios.3
The table on the right presents the estimated time savings from Route 4 from queue jumps at locations that this plan recommends, in both directions during both peak travel periods.
Appendix C: Benefit Calculation
Queue jumps add relatively little in terms of additional time savings. The visual benefit of getting ahead of traffic could confirm passengers’ decision to use transit. As discussed in the plan in the Golfside intersection example, seemingly small time savings from queue jumps could ensure that buses do not get caught at the same traffic light twice.
Estimated Time Savings from Queue Jumps for AATA Route 4
Appendix C: Benefit Calculation Methodology
Dedicated Lanes
To calculate the time savings benefits of dedicated lanes on Washtenaw, the study used the experiences reported in the TCRP reports from the following areas:
• Cleveland-Euclid Avenue
• Los Angeles-Wilshire Blvd
• Dallas-Harry Times Boulevard
• Dallas-Fort Worth Boulevard
• New York
• San Francisco
• Honolulu
• Vancouver
The study took the arithmetic mean of the time savings benefits in each of these cities, based on the range of values provided. Under a minimum scenario, time savings were about 1.2 minutes per mile, while under a maximum scenario they were about 1.4 minutes.4
From the bus delay analysis, the study found that the AATA bus currently spends 22 minutes on the 5-mile Washtenaw Corridor for a one-way trip. Using the per-mile time savings estimates from the TCRP reports, a Route 4 bus would save anywhere from 6-7 minutes per one-way trip. During peak hours, a 6-7 minute time savings is almost the length of the eight-minute headway between buses.
Time savings can also generate new ridership. According to the TCRP reports, time savings of five minutes are enough to spur new ridership.5 Dedicated lanes create a tremendous opportunity to bring new riders into the transit system and potentially spur modal shifts away from the automobile.6
PASSENGER SERVICE TIMES FOR DIFFERENT PAYMENT METHODS
The TCRP report uses the multipliers in the table below to calculate passenger service times for different payment methods. Swipe cards actually have a higher service time than cash payments. Contactless cards can reduce the time associated with swiping, but taking fare payment out of the vehicle entirely will likely reduce dwell times the most.
NOTES
1 Transit Cooperative Research Program. (2007). Bus Rapid Transit Practitioner’s Guide (TCRP Report 118). Washington DC: Transportation Research Board: 4-31.
2 Ann Arbor Transportation Authority. (2012). Personal Interview, Chris White. March 20, 2012.
3 Transit Cooperative Research Program. (2007). 4-19.
4 Transit Cooperative Research Program. (2007). 4-19.
5 Transit Cooperative Research Program. (2007). 4-18.
6 Transit Cooperative Research Program. (2007). 4-18.
7 Transit Cooperative Research Program. (2007). 4-103.
Passenger Service Times For Different Payment Methods