


This report would not be possible without the time, effort, and kind advice of the following people:
Mr. Eric Dueweke, University of Michigan
Ms. Larissa Larsen, Ph.D., University of Michigan
Mr. George Davis
Ms. Kimberly Hill-Knott
Ms. Corinne Kisner
Mr. Kevin Mulder
Ms. Dominic Smith
Ms. Sandra Turner-Handy
Ms. Rachel Wells
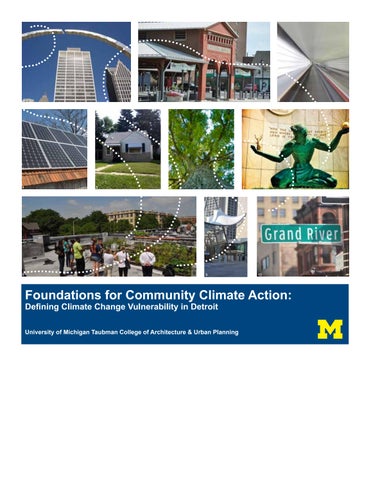
Climate
University of Michigan Taubman College of Architecture & Urban Planning
Kelly Gregg, Peter McGrath, Sarah Nowaczyk, Andrew Perry, Karen Spangler, Taylor Traub, & Ben VanGessel
Advisors: Larissa Larsen & Eric Dueweke
December 2012

Source: By Michigan Municipal League

Source: By Lowell Boileau detroityes.com
According to projections, the average annual temperature in Detroit is expected to increase 1.5-5.4°F by 2050. In the wake of increasing temperatures and changing climate conditions, many cities across the world recognize the need for climate action planning. This style of planning provides a proactive approach to climate change.
Comprehensive climate action planning involves both mitigation and adaptation. Mitigation aims to decrease the extent of climate change by reducing greenhouse gas emissions. Conducting a greenhouse gas inventory informs which mitigation strategies are needed and in which sectors. Adaptation aims to decrease the impacts from climate change by identifying distinct places and groups of people that may be disproportionately affected by a changing climate. Conducting a vulnerability assessment informs which adaptation strategies are needed, and where to implement them.
Literature often defnes climate ‘vulnerability’ as ‘exposure plus sensitivity.’ Exposure refers to the presence of biophysical hazards in the current environment, and sensitivity refers to the degree to which a community is harmed by a given exposure. We conducted an initial vulnerability assessment in order to provide a foundation for future climate action planning.
Community-based non-profts, environmental organizations, universities, state agencies, private organizations and the City of Detroit comprise the DCAC. The DCAC is a grassroots effort, led by Detroiters Working for Environmental Justice (DWEJ). The primary goals of the DCAC include:
1. Reduce greenhouse gas emissions for the sustainability and well-being of Detroit
2. Increase the resilience of Detroit’s social, built and natural environments
Eight ‘Work Groups’ encompass the DCAC in order to ensure fair representation. These eight Work Groups include transportation, solid waste, homes and neighborhoods, businesses and institutions, community public health impacts, energy, research, and parks, public space and water infrastructure. Once assembled, the Work Groups will determine indicators, strategies and goals in order to monitor progress. We compiled a list of potential indicators, strategies and goals that serve to aid these Work Groups.
Our vulnerability assessments focus on two issues: extreme heat and fooding. We selected these two issues because local climatologists have identifed extreme heat and increased precipitation as key concerns for Detroit.
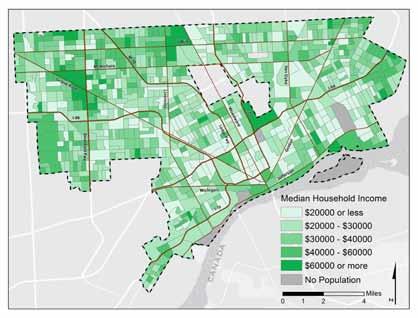
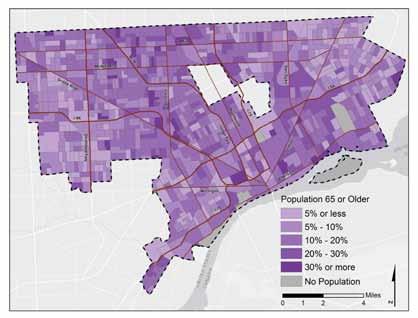
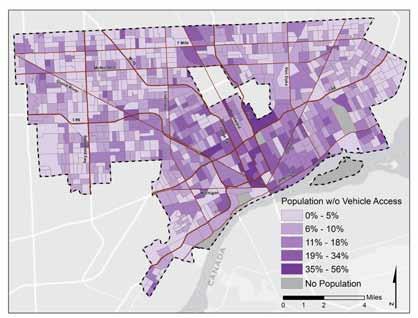
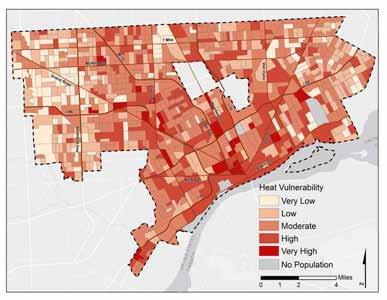
With regard to extreme heat vulnerability, our assessment combines exposure and sensitivity. Exposure factors include areas with high percentages of impervious surfaces relative to pervious surfaces and low tree coverage. Sensitivity factors include the number of people over the age of 65, the number of households without access to a vehicle, household income, and educational attainment.
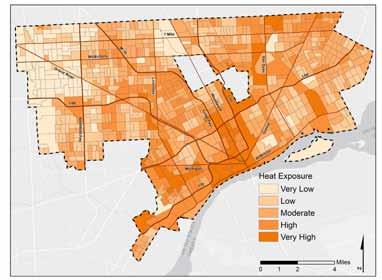
The heat assessment indicates that the greatest areas of vulnerability include the downtown core, along with the adjacent neighborhoods northwest of downtown. In addition, only 29% of the population is within a 15-minute walking distance of designated cooling centers, which the City of Detroit designates on an annual basis.
The fooding vulnerability assessment examines the vulnerability of current infrastructure systems, as well as household level vulnerability.
With regard to infrastructure, the analysis focuses solely on exposure factors. The primary exposure factor includes the runoff burden created during intense storm events. Land cover, soil type, and slope are the three factors that determine runoff burden. Data pertaining to the age, size, capacity and technology of existing infrastructure is necessary to determine the sensitivity of the City’s nine sewersheds. Additional information from Detroit Water and Sewerage Department is necessary for a more comprehensive analysis.
At the household level, the exposure factor is determined from foodplain designations (100 and 500 year). Age of housing stock (pre-1940) and median household income constitute household sensitivity.
Similar to the heat assessment, system food vulnerability concentrates around the downtown core and extends northward. Household food vulnerability is seen in southeast Detroit and in the northwest fashion along the Rouge River.
The results of the vulnerability assessment informed a set of fnal recommendations. These fnal recommendations include:
• Reconsider distribution and location of designated cooling centers
• Reduce impervious surfaces in identifed ‘hotspots’
• Increase tree planting in identifed ‘hotspots’
• Acquire additional information from DWSD for further food vulnerability analysis
• Ground-truth the most vulnerable heat and food areas to further target efforts at the neighborhood scale
Global climate change threatens to disrupt the function and livability of our cities. Although Detroit, Michigan, will not face the drastic effects of rising sea levels, the city is projected to experience higher temperatures, more frequent and intense precipitation events, and fuctuating lake levels. All of these effects will place further strain on the City of Detroit’s ability to provide services and keep it’s most vulnerable residents safe. With this in mind, the Detroit Climate Action Coalition (DCAC) has partnered with the University of Michigan in order to assess how Detroit can lower it’s current impact on the environment to mitigate efforts and prepare itself for the effects of climate change through adaptation.
Traditionally, municipal-level climate action plans have focused on mitigation— actions that reduce Greenhouse Gas (GHG) emissions that aim to prevent climate change. Common recommendations included increasing mass transit options and increasing building energy effciency. Although these mitigation policies generate positive outcomes, increasingly, recent climate action plans recognize that mitigation at the global scale must be coupled with adaptation at the local level.
While not a comprehensive document, this report from the University of Michigan intends to positively contribute to the DCAC’s planning process. We begin ith a brief history and current context section that addresses the relevant Detroit-specifc information, and summari es the current trends in climate science. Our Vulnerability Assessment applies current climate science pro ections to Detroit, and identifes places and populations in Detroit that are at risk from specifc effects of climate change. This Vulnerability Assessment ill form the basis for the Work Group reports, hich ill allo DCAC stakeholders to gain an accurate snapshot of where the city of Detroit currently stands, survey other plans and best practices from other cities, and show how stakeholders can measure progress. ased around the DCAC’s ork groups, e ill suggest a set of area specifc indicators from scholarly research, best practices from other climate plans, and feedback from DCAC orkgroup members. Finally, our conclusions section will summarize our fndings, and present our planning priorities to the DCAC.

Strategies that focus on reducing GHG emissions from human activity and promote the use and development of non-fossil fuel energy sources
The adjustment of human or natural systems in response to actual and/or anticipated climate change to lessen the potential negative impacts.
Detroit’s previous triumphs and current struggles are well documented. Once a symbol of American industrial might, the city’s name is now a synonym for urban blight, abandonment, and uncertainty. Today Detroit is a minority-majority city that has lost population at an alarming rate— the city suffered a 25% drop in population from the 2000 to 2010 census, and the city’s current population of 713,777 is 38.5% of its 1950 peak.1 Despite the decline in population, the city is still forced to pay for the infrastructure and legacy costs of a city of 1.8 million people. This creates a tremendous strain on the city’s remaining tax-base, and the city departments charged with providing basic services.
In 1701, the French explorer, Antoine Laumet de La Mothe, sieur de Cadillac recognized the Straits of Detroit as a strategic location on the Great Lakes, and founded the city as Fort Ponchartrain du Detroit. Founded as a military installation to protect the lucrative fur trade, French settlers soon noticed that Detroit had excellent soil for farming. The French Crown offered free land to settlers, who developed ribbon farms—long and narrow farms that allowed every settler to have access to the Detroit River. Detroit became an important agricultural center, and the ribbon farms formed the basis of the city’s unique and often overbuilt street pattern. The fort became one of the largest trading centers in North America by 1760.
From the early 1800s through the turn of the century, while the fur trade declined, Detroit continued to grow as a manufacturing and trading center. Detroit enjoyed a diverse economy, well-known for making stoves, train cars, shipbuilding, cigars, and pharmaceuticals.2 The city expanded in population, from just 1,650 in 1810 to 285,704 in 1900.3 The city itself also grew
in territory, annexing neighboring townships, building over the former farmland, and covering rivers to create sewers. While the city grew, compared to its Midwestern peers of St. Louis, Buffalo, Cincinnati, Cleveland, or Chicago, Detroit was still a relatively small city—a small manufacturing outpost.4 In fact, when the Detroit Tigers baseball franchise began play in 1901, some even wondered how long the Major League team would last in Detroit.5
This perception changed with the advent of the automobile. Following the turn of the century, Detroiters began to apply their expertise in manufacturing, machining, forging, and metallurgy garnered from other industries and applied this knowledge to automobile manufacturing. Within twenty years, Detroit became the undisputed center of the nation’s booming and lucrative auto industry. By 1930, the industry consolidated into an oligopoly of Ford, GM, and Chrysler - the “Big Three” - all of which centered their operations in or around Detroit. Detroit’s economic fortunes have been closely linked to the domestic auto industry ever since.
In many ways, Detroit is the quintessential twentieth century city, mostly due to the rapid, unplanned growth encouraged by the auto industry. The city’s built environment and territory expanded rapidly, from just a small loop located within Grand Boulevard in 1900, to its current borders of 139 square miles by 1926.6 This expansion of territory was not possible without a meteoric rise in population. From 1900 to 1930, the city’s population exploded from 285,704 to 1,568,662. While Detroit is widely known as a blue-collar, manufacturing town, the auto industry created massive fortunes for auto barons such as Henry Ford, John and Horace Dodge, and the Fisher Brothers, and employed thousands in managerial, engineering, and professional ranks.
Also, from 1900 to 1930, Detroit attracted hundreds of thousands of unskilled laborers from Central and Eastern Europe, and from the American South.7 By the roaring twenties,
the former sleepy outpost on the Detroit River became a booming metropolis, fo ing in money from the prosperous auto industry and the prohibition-era illegal alcohol trade with Canada. However, the Great Depression hit Detroit hard, as many factories cut shifts or closed their doors altogether. Production of war material in World War II brought Detroit out of the depression, and Detroit became known as the “Arsenal of Democracy. The city experienced another infux of white and black migrants from the American south to fll the factories that ran on three shifts, but Detroit’s wartime era of full employment was short-lived.8
Following the end of World War II, while the metro area of Detroit continued to grow, the city of Detroit began to decline. A confuence of federal subsidies, structural change in the auto industry, changing tastes, and poor race relations encouraged many whites to leave the city. For many years, Detroit’s population loss was commonly perceived as the classic example of “White Flight.” Indeed, Detroit became the manifestation of the Kerner Commission’s worst fears—a wealthy ring of predominantly white suburbs surrounding an impoverished, underemployed, and majority African American city core.9 However, as the years have gone by, many black residents have left for the suburbs as well. Indeed the decline in services and an increasing tax burden has created a vicious cycle. Today, the city has fe er fnancial resources to serve its most vulnerable residents.
Detroit’s meteoric rise and decline has created unique challenges for the urban environment. The city’s prosperous industrial economy allowed blue-collar autoworkers to purchase their own single-family homes, and Detroit became well known as a city of “house and yard” people.10 Once a symbol of prosperity, many of Detroit’s homes today lack insulation and modern, energy effcient H AC systems. Also, Detroit was built at a time when auto-ownership was on the rise, and the city’s planning professionals favored an auto-dependent urban form. In 1958, the city shut down the last of its streetcars, while highways were constructed throughout the city. Today, Detroit faces the
challenge of large areas of vacant land and an auto-dependent transportation system. Moreover, during the late 1800s, to make way for development, many of the city’s creeks and streams were paved over, or turned into sewers—decreasing pervious surface for storm water management. Much of the city’s infrastructure is technologically out of date and has suffered from years of deferred maintenance. Climate change threatens to increase the pressure on this fragile infrastructure system, and the city’s ability to cope is currently limited.
1. U.S. Census Bureau
2. Hyde, Charles K. Detroit: An Industrial History Guide. Detroit: Detroit Historical Society, 1980.
3. U.S. Census Bureau
4. U.S. Census Bureau
5. Bak, Richard. A Place for Summer: A Narrative History of Tiger Stadium. Detroit, Mich: Wayne State University Press, 1998.
6. City of Detroit Annexation Map, 1932, Detroit City Planning Commission Collection, Roll 4, Burton Historical Collection, Detroit Public Library, Detroit, MI.
7. Zunz, Olivier. The Changing Face of Inequality: Urbanization, Industrial Development, and Im migrants in Detroit, 1880-1920. Chicago: University of Chicago Press, 1982.
8. Gregory, James N. The Southern Diaspora: How the Great Migrations of Black and White Southerners Transformed America. Chapel Hill: University of North Carolina Press, 2005.
9. United States. Report of the National Advisory Commission on Civil Disorders. Washington: For sale by the Supt. of Docs., U.S. Govt. Print. Off, 1968.
10. Young, Coleman A., and Lonnie Wheeler. Hard Stuff: The Autobiography of Coleman Young. New ork: iking, .
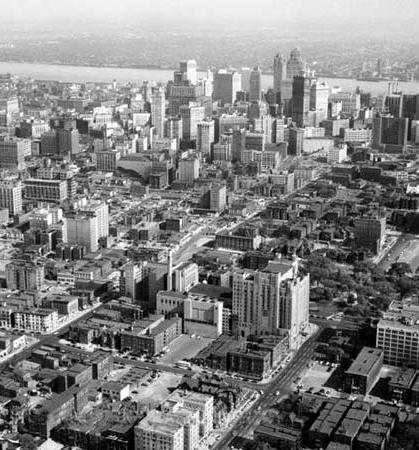
Source: Detroit Skyline 1954. Wayne State Historical Image
Michigan’s current landscape was shaped predominantly during the last ice age. The movement of the last ice sheet, known as the Wisconsin Glacier, left the most direct impact with its retreat occuring 14,000 years ago. When the planet warmed and the ice melted, the water would carry the scoured soil and rocks away from the retreating glacier, ith fner-grained particles able to travel farther.1 The Great Lakes themselves are a product of this retreating glacier—large basins that became the repository for much of the melted ice.2 These historic processes determined many of the characteristics of the current landscape, from soil types to hydrologic fo s, and in some regards, the historic forest composition as well.
Understanding the soil types is crucial in the face of changing climate. Particle size determines the amount of water and nutrients that soil can hold, which affects agricultural viability, forest and plant dynamics, and stormwater management. Generally, larger particles (sand and gravel) have higher rates of drainage due to the greater amount of space between particles, whereas fner soils silts and clays retain ater for longer periods, and can become saturated quickly. For agricultural purposes, silt soils are ideal for growing crops—they hold water and nutrients, but do not become dense, hard, and brittle like dried clay.3
A key impact of these historic geologic processes is Detroit’s most common current soil types—soils produced from glacial outwash, and soils derived from deposited lake sediments.
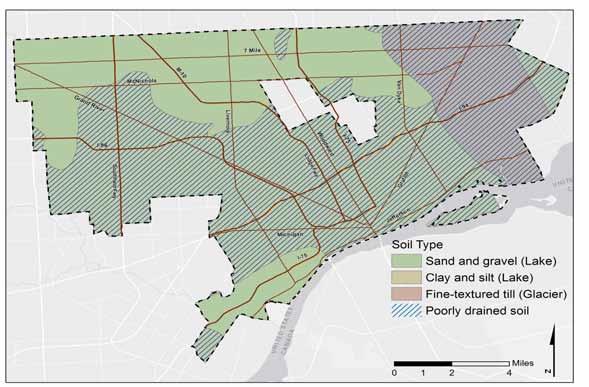
Touching briefy on glacial out ash, e see an accumulation of fne-grained material, or till, into ridges that delineate the farthest extent of glaciation. The subtle ridges of accumulated glacial till have over time defned the area’s watersheds, dictating the course of rivers and streams, and infuence drainage dynamics.4
The other surface type that is apparent is derived from the deposition of lake sediments. As the Great Lakes began to fll, they ere not always the shape that we know today. In fact one in particular, Lake Maumee, encompassed an area that included part of present-day Lake Erie, Lake St. Clair, the Detroit river, and inland parts of Canada and Michigan. Lake dynamics are such that sediments will accumulate over time, carried by rivers, wind, and erosion to the lake. Sand and gravel tends to accumulate along the outer portion of the lake, hile fner silt and clay sediments will settle in the inner, deeper lake areas.5 Detroit and the surrounding area has a presence of both types, though silt and clay predominate in the sections closer to the Detroit River.
The historic glacial processes played a role in the creation of present day watersheds. The deposited sediments created ridges, essentially boundaries, which charted the course for water to follow. Detroit is placed within the greater context of the Great Lakes watershed, a massive process that moves water, in order, through Lake Superior, Lake Michigan, Lake Huron, the St. Clair River, Lake St. Clair, the Detroit River, Lake Erie, Lake Ontario, and out the St. Lawrence River to the Atlantic Ocean. Locally, however, there are three watersheds falling within the boundary of Detroit, two emptying directly into Lake St. Clair (Lake St. Clair and Clinton watersheds) and the other into the Detroit River (Detroit watershed). Additionally, the Huron watershed to the west of Detroit, plays an important drainage role in the region, passing through Wayne County and emptying into Lake Erie, south of Detroit.6 Each watershed is further
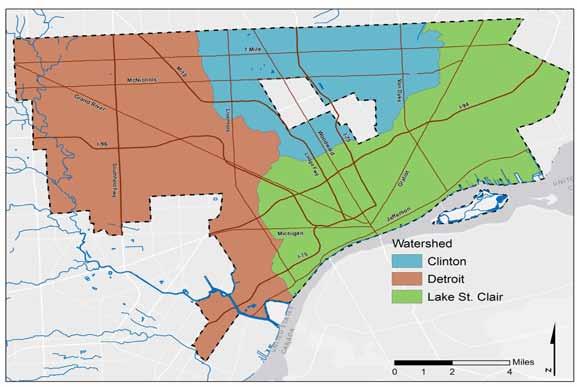
broken down into subwatersheds, which can be useful scales when analyzing the impacts of impervious surfaces and stormwater management practices.
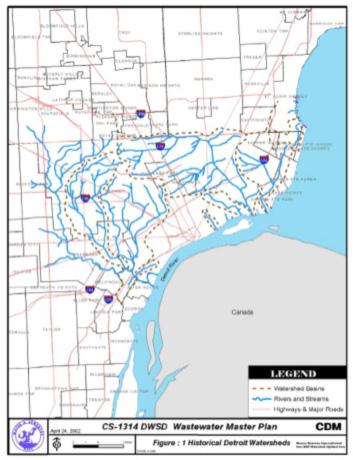
Within Detroit itself, there were a number of streams and rivers that served to drain the area. Many of these streams were subsequently routed into culverts and underground pipes as the city expanded, trying to conceal its stormwater system. Understanding the hydrologic processes of the city will be important as we move forward facing climate change because of the stresses that will be put on the system from increased storm events. With a combined se er overfo system, additional stress on or relief from the natural drainage system will have impacts on sewage discharges into the Detroit River. One innovative suggestion looks at “daylighting” these streams that have been enclosed by pavement. Opening these waterways could restore some of the historic fo s, landscape, and habitat, while also diverting urban stormwater runoff, lessening the chance for a system- ide overfo .7
The glacial and soil deposition processes, along with broader climate characteristics, also played a role in determining the vegetation makeup of the region. Categorized as the mesic southern forest, pre-settlement Detroit experienced the presence of beech and sugar maple dominant communities. These species do especially ell on fne-textured glacial till and sandy lake plains that are well drained, conditions that were previously established in this area. Soils are generally fertile with high nutrient content and soil organism content, due to the decomposition of deciduous leaves and branches. Where drainage is poorer and seasonal pools are common, a wetter habitat was formed, favoring beech and an oak-hickory mix.8 Along the eastern border of the city, as well as in the southwest, there were historically much wetter, swamp and marsh conditions. To this day, these areas remain more prone to fooding than other parts of the city.
Today, the U.S. Forest Service undertakes a Forestry Inventory and Analysis (FIA) Program to periodically assess the current forest composition as well as develop predictive models. While there is no direct data for the urbanized Detroit metro region, the surrounding areas indicate a fairly high diversity of species, characterized by the historic beech, sugar maple, birch, oak, and hickory, but also a heavy elm and cottonwood presence. Looking into the future, the predictive models tend to emphasize the likelihood for elm and cottonwood to become dominant, with a minor role for oak and hickory. This is largely based on climate modeling processes, where shifting climates may limit a species’ range.9 For local communities, it will become important to take broader predictions on regional or national forest types. In addition, coupled with knowledge about local topography and hydrology, develop a working list of species that can thrive in different biophysical circumstances.

Source: By Sombraala
1. Michigan’s Geological Landscape. Michigan Department of Natural Resources. 3 October 2012 http://www.michigan.gov/ dnr/0,4570,7-153-10370_22664-60296--,00.html.
2. Larson, Grahame; Schaetzl, R. (2001). “Origin and evolution of the Great Lakes”. Journal of Great Lakes Research (Internat. Assoc. Great Lakes Res.) 27 (4): 518–546.
3. http://soil.gsfc.nasa.gov/index.php?section=78
4. http://www.hrwc.org/the-watershed/features/geology/
5. City of Detroit Annexation Map, 1932, Detroit City Planning Commission Collection, Roll 4, Burton Historical Collection, Detroit Public Library, Detroit, MI.
6. http: cfpub.epa.gov surf county.cfm fps code
7. Detroit Water and Sewerage Department Wastewater Master Plan
8. Mesic Southern Forests. Michigan Natural Features Inventory
9. http://www.nrs.fs.fed.us/atlas/tree/ft_summary.html
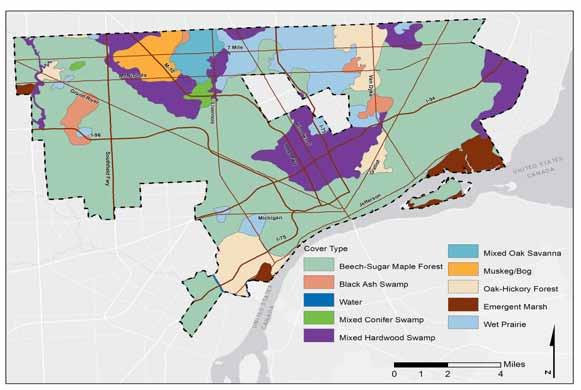
Detroit Historic egetation
Source: SE C G, egetation Circa Southeast ichigan
Map Prepared By: University of Michigan Detroit Climate Capstone
Although climate and weather are directly related, they are not the same. Weather describes the day-to-day conditions in a specifc place, hile climate is the accumulation of recorded weather trends in a region over a longer period of time. The distinction between weather and climate is important because it differentiates temporary weather variability from long-term projected trends measured over decades.
While the terms “global warming” and “climate change” are often used interchangeably, climate change more accurately conveys the multitude of impacts caused by the trend of higher global temperatures: increased duration and frequency of drought, increased number of extreme precipitation events, rising sea levels, and ocean acidifcation.1 The global climate is sensitive to a number of natural and human caused activities. Natural events that affect the climate include variations in the Earth’s orbit, changes in the intensity of solar radiation, the circulation of the oceanic and atmospheric currents, and volcanic activity. Human activities contribute to climate change through GHG emissions. However, other activities such as deforestation and rapid changes in land cover contribute to global climate change.2
In the United States, climate scientists at the National Climatic Data center use climate divisions as a baseline geography for analysis. Generally, climate divisions are areas that share uniform climate characteristics, and are housed within the boundary of one state. Detroit is located within the Southeast Lower Climatic Division of ichigan see fgure belo . This region is bounded by the Ohio border to the south, Lake Huron, Lake St Clair, and Lake Erie to the east, and extends west to include the cities of Flint and Ann Arbor.3 To predict climate change impacts for a specifc region or city, scientists utilize the technique of downscaling. Climate downscaling connects global-scale predictions, such as Atmosphere-Ocean General Circulation Models (GCMs), with regional dynamics to estimate local- or regional-scale information.4

Detroit and the rest of the Southeast Lower Climatic Division of Michigan are categorized as a humid continental climate. Humid Continental climates are known for great variances in seasonal temperatures—warm to hot and humid summers, and cold winters. Historically, Detroit’s temperatures were generally moderate. In the past, the region rarely experienced prolonged periods of hot, humid weather in the summer or extreme cold during the winter. During the summer months, temperatures from the mid 60s°F through 80s°F were the norm, and occasional easterly winds and local lake breezes from Lake St. Clair moderated temperatures. In the winter, the average daily high temperature range was 23°F to 35°F with an average winter temperature of 27°F. The proximity to Lake Erie and Lake St. Clair as also refected in inter temperatures.
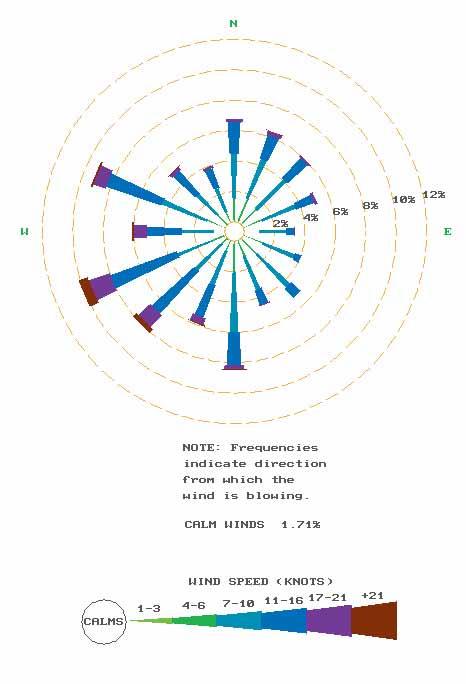
Wind Speed and Direction in Detroit
Source: http://climate.geo.msu.edu/Stations/2102/NARRAT.txt
September-November57.1
Annual Seasonal Temperature (1958-2012)
Source: Station 202103 National Climate Data Center
Hottest Day on RecordJune 25th, 1988104.3 °F
Hottest Month on RecordJuly 2011Ave. Temp. 79.3 °F
Coldest Day on RecordJanuary 21, 1984-21.1 °F
Coldest Mnth on RecordJanuary 1977Ave. Temp. 12.8 °F
Detroit Temperature Extremes (1958-2012) (Detroit Proper, not DTW)
Source: Station 202103 National Climate Data Center

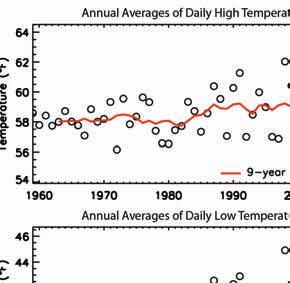
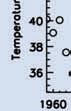
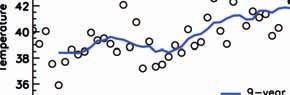


Annual Averages of Daily Temperatures
Source: GLISA The Potential Impacts of Climate Change on Detroit, MI
Detroit’s annual precipitation averaged 33.58 inches, and was fairly evenly distributed throughout the year. The driest month for Detroit is February, with 1.85 inches of precipitation, and June was the wettest month, with 3.51 inches of precipitation. Summer precipitation came mainly in the form of afternoon showers and thundershowers. Annually, thunderstorms occurred on an average of 36 days. Winter precipitation was generally a mix of sleet and snow, and January was the snowiest month—averaging 11.29 inches of snowfall, for an average snow depth of 6.38 inches.
In terms of extreme weather, while Michigan is shielded from the worst effects of hurricanes, it is located on the northeast fringe of the Midwest tornado belt.5 Wayne County experienced 27 tornadoes since 1950 while only 4 have crossed into Detroit city limits.5 The lower frequency of tornadoes occurring in Michigan may be, in part, the result of the colder water of Lake Michigan during the spring and early summer months—the national prime period of tornado activity.
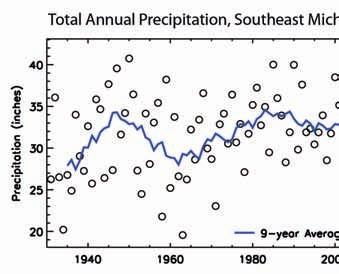
Total Annual Precipitation, Southeast Michigan
DETROIT PRECIPITATION EXTREMES
Greatest Single Day TotalJuly 28, 19764.90 inches
Greatest Monthly Total July 18788.76 inches
Driest Month Frebruary 18770.00 inches
Detroit Precipitation Extremes
Source: Station 202103 National Climate Data Center
In Detroit, between 1960 and 2010, average annual temperatures have increased by 1.4°F. This warming trend is expected to continue throughout the 21st Century. Although 1.4°F seems like a modest change, small increases in average annual temperature drastically increase the probability of extreme weather, such as heat waves, excessive heat events, droughts, and torrential rains. In particular, excessive heat events, the number of days per year with a high temperature above 90°F, will likely increase. Between 1960 and 1980, Detroit averaged 11 days exceeding the 90°F mark per year. During the later quarter of the century, the number of days exceeding 90°F rose slightly to 12 and to in the frst decade of the s. Ho ever, by the end of 21st Century, Detroit is projected to experience 36 to 72 days exceeding 90°F per year.

Source: GLISA The Potential Impacts of Climate Change on Detroit, MI
Similar warming trends will affect winter temperatures. Between 1960 and 1980, an average of 50 days had a daytime high of 32°F or lower, an average of 7 days was 0°F or lower, and only 3 years stayed above 0°F. Generally, average winter temperatures are slowly increasing nearer to the freeze-thaw point hich poses signifcant risks to surface and subterranean infrastructure.

The increase in temperatures is expected to bring a rise in precipitation. In the last half century, Michigan experienced an 11% increase in total annual precipitation, and increases in annual precipitation are expected to continue. Precipitation in the summer months is expected to increase slightly, while spring, fall, and winter are expected to see a noticeable increase. While winters will have less snowfalls, they will experience more precipitation in the form of rain. The average number of snowfalls is projected to decrease by 50%. Much like the rise in temperatures, in addition to experiencing more precipitation, Michigan is also expected to experience more frequent and more intense storms, increasing the likelihood of foods.
On the ground, the increases in temperature and precipitation will create a diverse set of challenges for the City of Detroit’s municipal departments and its residents. The large number of excessive heat events can exacerbate the symptoms of other diseases, and increase the risk of heat exhaustion, heatstroke, or death. Because of Detroit’s combined sewer system, more frequent and more intense precipitation can increase the amount
of untreated sewage released into the Detroit and Rouge Rivers. This increases Detroiters’ risk and exposure to waterborne diseases. Also, increased precipitation and fooding can cause severe damage to private property and public infrastructure. These and other adverse effects, of climate change will be discussed further in our ulnerability Assessment section.
SOURCES
1. Pew Center on Global Climate Change, “The Causes of Climate Change,” Science Brief 1 (August 2008) at 2, available at http://www.pewclimate.org/docUploads/globalwarming-science-brief-august08.pdf
2. EPA, “Frequently Asked Questions About Global Warming and Climate Change: Back to Basics,” available at: <http://www.epa.gov/climatechange/downloads/Climate_ Basics.pdf.
3. Great Lakes Integrated Science Assessment, “Historical Climatology: Southeast Lower Michigan”.
4. Bader, D.C., et al. 2008. Climate models: An assessment of strengths and limitations.A Report by the U.S. Climate Change Science Program and the Subcommittee on Global Change Research. Department of Energy, ffce of Biological and Environmental Research, Washington, D.C.
5. http://www.crh.noaa.gov/grr/education/tornado/
The following section summarizes a few of the major weather-related events in Southeast Michigan since the start of the 20th Century. Often, extreme weather events and shifting weather patterns result in catastrophic blows to economic systems and local infrastructure, as well as outbreaks in health-related issues.
“SNOWIEST WEEK”
Roughly 30 inches of snow fell over a 6 day period — the 3rd & 4th biggest snowfalls in the 20th century.
This winter ranked as the coldest winter in southern Michigan’s history. The average temperature from December to February was 18.7 degrees.
Considered to be one of the worst in history, this storm included nearly 5 inches in snowfall and wind gusts over 70 mph. More than 235 sailors lost their lives on the Great Lakes and dozens of ships, including large freighters, sunk.
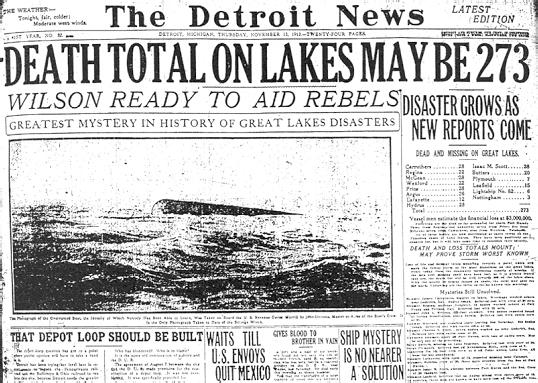
Source: The Paragraph.com
“DUST BOWL” & “HEAT WA E
The 1930s represent one of the dryest periods in Michigan, referred to as the ‘Dust Bowl.’ This deade includes the driest year in recorded history (1936). The continual, long-standing droughts placed extreme economic pressures on farmers during The Great Depression. In addition, the ‘Heat Wave’ of 1936 included 7 straight days of extreme heat, resulting in nearly 400 deaths in Detroit.

Source: HourDetroit.com; Illustrated by Arthur E. Giron
THA SGI I G WEEKEND SNOWSTORM”
Recorded as the largest snowstorm of the 20th century, more than 19 inches of snow fell on Southeast Michigan during Thanksgiving weekend.
1976-1977
“COLDEST WINTER E ER
The Winter of 19761977 marks the coldest in Detroit history. Detroit failed to reach 32 °F for 45 consecutive days, resulting in an average January temperature of 12.4 °F (normal averages exceed 24 °F).
EXTREME HEAT AND DRYNESS
This summer included 39 days in which temperatures exceeded 90 °F, along with 5 days that exceeded 100 °F. In addition, some Michigan cities recorded less than oneinch of rainfall from May through June.
This massive cold outbreak resulted in roughly 57 straight hours of sub-zero temperatures, including the coldest day in Detroit history.
Roughly 2.5 inches of freezing rain, snow & sleet fell in Southeast Michigan, resulting in the 3rd largest blackout in history — roughtly 425,000 homes lost power.
JULY 7, 1997
More than 15 tornadoes were reported across the state — the most in Michigan history. Seven deaths and more than 100 injuries occurred, and total damage to property and crops exceeded $140 million.
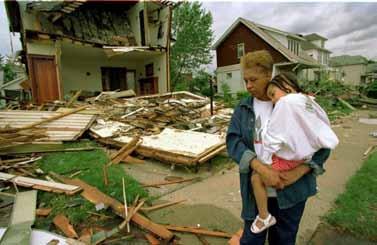
Source: UPI.com
WINTER, 1997-1998
The average temperature in Detroit during this winter was nearly nine degrees above normal, resulting in only 14.5 inches of snowfall (17.5 inches below normal).
More than 115 cases of West Nile occurred in Wayne County, resulting in three deaths. Elderly populations proved to be most vulnerable to the outbreak. As a result, Wayne County granted $200,000 to city and township governments to eradicate the spread of West Nile.
As a result of poor regulation and reliability standards, 50 million Americans —l ranging from Michigan to the eastern seaboard — lost power for multiple days. Municipalities rallied in order to cater to vulnerable populations and ensure the safety of its citizens.

Source: Pasty.com

Source: Examiner.com
FLOODING & SEWAGE ER L WS
Extreme weather events resulted in more than 37 billion gallons of se age overfo ing into Southeast Michigan waterways — an increase of 11 billion gallons from the previous year.
Nearly 48 inches of rain fell in 2011. A majority of the rainfall occurred as a result of intense May and September thunderstorms. One storm in May resulted in fooding, as Detroit’s infrastructure could not handle the excess downpour.
WEST NILE OUTBREAK & LYME DISEASE
Michigan recorded roughly 170 cases of West Nile, including 10 fatalities (all of which were elderly patients). Local authorities are also paying attention to a sizable increase in black-legged deer ticks — these ticks are often the primary source of Lyme Disease.
Source: By JWhiting360
Based on the projected changes from the Great Lakes Integrated Science Assessment (GLISA), extreme heat and precipitation are the biggest risks for Detroit. Air pollution, specifcally elevated ground-level o one, ill also be a concern ith increasing temperatures, but e ere not able to uantify air pollution for this assessment. In this section, e ill identify areas of high vulnerability pertaining to heat and fooding by uantifying concentrations of exposure and sensitivity in Detroit.
A vulnerability assessment is used to understand and uantify vulnerability. Vulnerability is the combination of biophysical exposures, such as the actual temperature or rainfall change, and sensitivity of a population or system. Sensitivity factors are often human variables such as population demographics. This vulnerability assessment is a geographic overvie of concentrations of vulnerability in Detroit. ur assessment used data from the American Community Survey, an ongoing national survey by the .S. Census ureau that collects detailed information on housing, income, education, and other population characteristics. We obtained data at the block group level, an area that contains bet een and , individuals. This is the smallest geographic level for hich demographic data is published. y mapping areas of high exposure and high sensitivity, these assessments can identify areas of high vulnerability. ur methodology ill explain the process of ho e identifed and combined exposure and sensitivity.
Source:Heat ap by ichael Ho e ap repared y: niversity of ichigan Detroit Climate Capstone
Geographic location ithin a region can drastically infuence the exposure to heat. In Detroit, the average annual temperature from - has increased by . , hereas the average annual temperature for Ann Arbor has only increased by . over the same period.1 Although . seems like a modest change, a small increase in average annual temperature drastically increases the probability of extreme heat events and droughts. y , Detroit is estimated to experience extreme heat event days per summer, up from days on average bet een - 2

Source: SGS Glo is LandSat ET American Community Survey S Census ap repared y: niversity of ichigan Detroit Climate Capstone
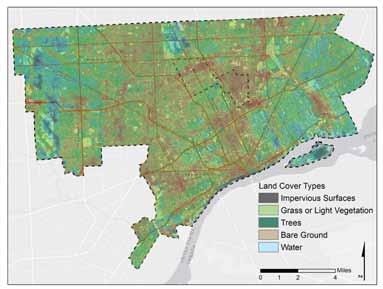
ur analysis included t o land cover variables that impact effects of extreme heat events: impervious surfaces and tree canopy. Impervious surfaces, such as asphalt and concrete, absorb high amounts of heat and radiate it back into the air, increasing the surface temperatures. Tree canopy and other vegetation exert a cooling infuence on the surrounding area. Land use decisions, resulting in the high concentration of impervious surfaces, coupled ith disparities in the distribution of tree cover, interact to make certain areas of the city much armer in summer months thus, more vulnerable to extreme heat events 3. This effect is termed the Urban Heat Island effect (UHI effect) , .
igure sho s the surface temperatures in Detroit. 6 This map demonstrates the temperature variation throughout the city, the dispersed character of the UHIs, and highlights ho different surface materials absorb and reradiate solar energy. or example, roads tend to be hotter and therefore create visible lines on the map. The average annual temperatures of HI areas of Detroit can be . . armer than surrounding areas . Ho ever, vegetation cover reduces surface and air temperatures through evapotranspiration and shading, thereby decreasing vulnerability to extreme heat8 . To analy e local variations in HI effect e obtained land cover data from the nited States Geological Survey Global isuali ation ie er Glo is available at usgs.glovis.gov.
As the above maps demonstrate, impervious surface and lo tree canopy correspond to location of HIs ithin the city. To understand the relative importance of impervious surface and tree canopy, e calculated the percent of each census block group’s land cover covered by impervious surface and by tree canopy. Based on research by Coseo and Larsen, areas of impervious surface ere eighted by a factor of and areas of tree canopy ere eighted by a factor of - .9 The t o layers ere combined to create cumulative heat exposure scores at the block group level, as sho n in igure .
Our analysis used four primary factors that contribute to increased risk of heat-related illness: residents and older, lo er educational attainment, poverty and household access to a vehicle. These four demographic variables measure human sensitivity to extreme heat. The literature used to derive these variables revealed the importance of neighborhood socio-economic positions, or group-level factors, in predicting risk of illness, independent of the infuence of the same variable measured at the individual level10. or this reason, and due to the diffculty in obtaining individual-level income or health data, e conducted our vulnerability analysis at the census block group level.
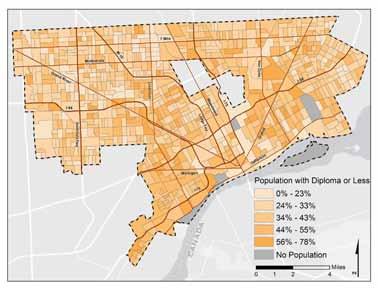
T o indicators of community level socioeconomic status are associated ith increased heat-related mortality these indicators include the percentage of the population ithout a high school diploma, and the percentage of the population living in poverty.11 Research demonstrates a link bet een lo educational attainment and poor health.12 oreover, specifc studies of heat-related deaths in cities across the .S. fnd greater mortality rates among individuals ith lo er levels of education because educational attainment is often a measure of uality of life, occupation and living conditions.13 Using U.S. Census data obtained from Social Explorer, e calculated the percentage of each census block group holding no more than a high school diploma, as sho n in igure .
ap
American Community Survey - S
ap repared y: niversity of ichigan Detroit Climate
Source: American Community Survey - S Census ap repared y: niversity of ichigan Detroit Climate Capstone
Similarly, ealth mitigates the risk of heatrelated death by increasing access to air conditioning and other opportunities to avoid heat. n an individual level, there is little doubt that poverty leads to ill health, and community levels of poverty have also been demonstrated to play a role in heat-related mortality. Therefore, using census data obtained from Social Explorer, e calculated the median income of each census block group and stratifed the census block groups by income level in order to identify the poorest neighborhoods, sho n in igure .
A signifcant body of literature has found old age to be a prominent vulnerability factor during extreme heat, effecting both hospital admission rates and mortality. Since e could not access individual-level age data by household, e calculated the percentage of each census block group over age , as sho n in igure .
inally, e included household access to vehicles as a contributing factor in the sensitivity index, since individuals ithout a vehicle are less able to drive to an airconditioned cooling center or alternative refuge during extreme heat events. sing census data, e mapped the percentage of households in each census block group that
had no vehicle access, as sho n in igure
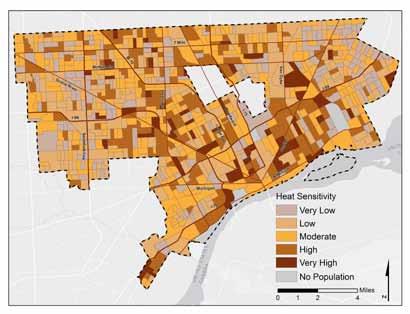
In order to understand the cumulative sensitivity, e calculated a sensitivity index. To do so, e converted the four variables to compatible scales so they could be combined to produce a single index. In order to normali e the variables, e computed the -scores for each individual variable by subtracting the mean of the sample from each block group’s score and then dividing the result by the standard deviation of the sample. This ensures that each of the rescaled variables has a mean of ero and a standard deviation of , allo ing them to be combined directly. Areas of high sensitivity to extreme heat ere geographically dispersed throughout the city, ith small clusters in the do nto n, south est, and east sides of the city. The four socioeconomic factors ere e ually eighted.
American Community Survey - S
ap repared y: niversity of ichigan Detroit Climate
Source: American Community Survey S Census ap repared y: niversity of ichigan Detroit Climate Capstone

Source: SGS
is
ET American Community Survey US Census 2010 ap repared y: niversity of ichigan Detroit Climate Capstone
To identify areas of vulnerability, e created an index to combine our exposure and sensitivity indices.
This vulnerability index identifes the areas of the city here concentrations of exposure and sensitivity create higher risk for residents. ased on this methodology, vulnerability is distributed fairly randomly ith notably lo er levels in the orth est portion of Detroit. In general, the most vulnerable census block groups are clustered roughly in the do nto n area and the least vulnerable are in the north est area of the city. ecause this is a relative index, the vulnerability index does not represent any sort of absolute risk. Rather, the index identifes the block groups that are more vulnerable in comparison to other block groups in the city.
The City of Detroit opens facilities such as libraries and recreation centers to serve as cooling centers here residents can seek refuge during extreme heat events. To evaluate ho residents are served by Detroit’s cooling center net ork, e determined service areas. We used national orking safety standards to determine the appropriate range of cooling center service areas. The ccupational Safety & Health Administration (OSHA) has determined threshold limit values TL for external orking conditions. The TL s are designed to prevent body temperatures from exceeding . hen experiencing light to moderate exertion. They recommend that during heat events, each minute period of light activity should be matched by minutes of rest. Therefore, e used minutes of outdoor exposure, hile alking, in order to determine each service
area. or pedestrians, minutes translates into . miles, using an average speed of . mph16. We used the Buffer tool, a GIS function, to defne an appropriate alking distance. We found that . of Detroit’s land area is ithin a minute alk of a cooling station. Calculations of the population served by each cooling center reveal that roughly . of Detroit’s population is ithin a -minute alk of a cooling station.
We did not calculate automobile or transit service to cooling centers. While automobiles can often provide the most immediate source of relief, hether by air conditioning in the vehicle or uickest transport to a cooling center, percent of Detroit households do not o n a vehicle . Transit also offers an air-conditioned mode of travel, but service times and coverage are limited, an issue further exacerbated by recent spending cuts 18 .
Combining the cooling center service areas ith the vulnerability map allo ed us to determine hat percent of Detroit’s most vulnerable residents are ade uately served. igure sho s the alking service areas overlaid on the vulnerability index map. y selecting the top percent of most vulnerable census block groups, e calculated that only . percent of the most vulnerable residents are ithin a -minute alk of a cooling station. This service area captures only . percent of the city.
According to these fndings, the city’s offcial response to extreme heat events cooling centers is not suffciently addressing Detroit’s needs. Since cooling centers are co-located ith existing libraries and recreation centers, and are therefore likely to be a cost-effcient service, e ould need to conduct further cost-beneft analysis to determine a recommended relocation strategy. We can, ho ever, recommend opening additional cooling centers to serve more of Detroit’s vulnerable population, especially those reliant on alking.
Compared to lo -lying coastal cities such as e ork or e rleans, Detroit is not at risk from sea level rise or hurricaneinduced fooding. either is it at risk for landslides of the type that can occur after heavy rainfalls in mountainous areas. Ho ever, the pro ected high volume of precipitation has the ability to over helm Detroit’s combined se er system and cause outfalls of untreated sanitary se age into the ater ays. At frst glance this appears to be a problem completely for the Detroit Water and Se erage Department DWSD . Ho ever, after further analysis, our land use decisions are linked to, and have signifcant impacts on, se er infrastructure.
When the se er infrastructure cannot manage the storm ater runoff, excess stormater and se age is directly discarded into the Rouge and Detroit Rivers. ecause the city is serviced by a combined se er and aste ater system, these discharges also contain untreated sanitary se age. In , Detroit discharged billion gallons of untreated se age into the Great Lakes system, making it one of the largest sources of pollution in the Great Lakes system19 While DWSD has embarked on signifcant grey infrastructure projects to address the discharge issue, the DWSD has not pursued green infrastructure projects that seek to deal ith onsite storm ater before it reaches pipes. or this reason, our vulnerability assessment has focused on the burden of runoff into the se er system as the main exposure to fooding.
This vulnerability assessment only considered the exposure element of se er system vulnerability, because e did not have information on the se ersheds’ sensitivity factors. Se ershed information is important to obtain for future research and perhaps represents an important future
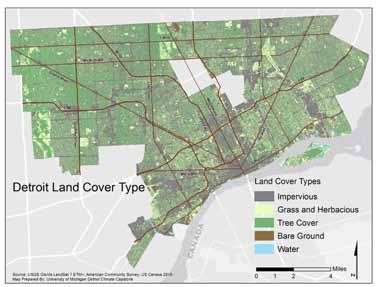
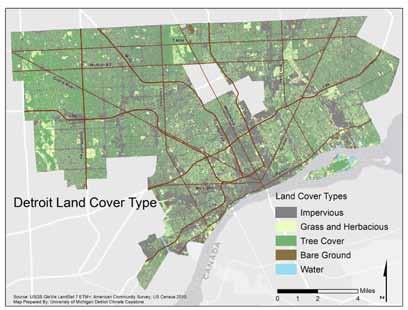
:Detroit Land Cover Type
partnership for the DCAC and DWSD. Ho ever, exposure alone provides an excellent idea of hat relative levels of burden ill be imposed on the system by increased rain events and ho these vary across the city by se er district.

Source: SGS Glo is LandSat ET American Community Survey S Census ap repared y: niversity of ichigan Detroit Climate Capstone
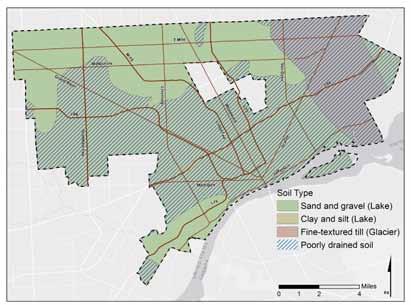
igure : nderlying Soil Type and Soil Drainage
Source: Michigan Geographic Data Library, Michigan Quarternary Geology ap repared y: niversity of ichigan Detroit Climate Capstone
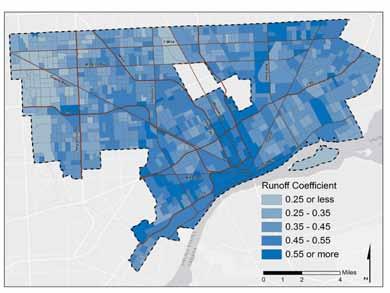
In this instance, exposure is the volume of the runoff from the surface that fo s into the se er system. The manner in hich rain ater moves through the combined storm ater sanity se er system is highly dependent upon here it falls. Impervious surfaces by their nature do not readily absorb ater, and instead channel ater into the se er infrastructure. To uantify this exposure, called runoff burden, e considered three factors: land cover type, soil drainage type, and slope. The combination of these factors creates a runoff coeffcient. This is a score ranging bet een ero and one that represents the amount of runoff that is generated at a particular site. Zero represents a site that generates no runoff and deals ith all rain ater on site hile a value of one represents a site that does not retain any ater on site.
As ith the assessment of heat, e utili ed a land cover map obtained from the nited States Geological Survey Global isuali ation ie er Glo is available at usgs.glovis.gov. Land cover as categori ed into one of four categories: tree canopy, herbaceous cover, bare ground, or impervious surface. Areas covered by tree canopy contributed the least to runoff and areas covered ith impervious surface contributed the most. While grassy and sparsely vegetated areas also have a lo er runoff coeffcient than tree canopy, bare ground and impervious surfaces contribute heavily ith respect to runoff coeffcients. These landcover runoff values are based upon standardi ed engineering tables.
Soil type impacts runoff volumes. In Detroit, three major soil types dominate. These different soil types have different percolation rates. oorly drained soils the clays, silts, and fne matter are unable to remove ater uickly, thus giving runoff more opportunity to go some here else. Therefore, poorly drained soils have higher coeffcients than ell drained sandy soils that uickly absorb ater. Silt and clay soils are found to ards the river and in the east side of the city. Sandy soil, that drains uickly and contributes less to runoff burden, is found primarily in the north and north est areas of the city.
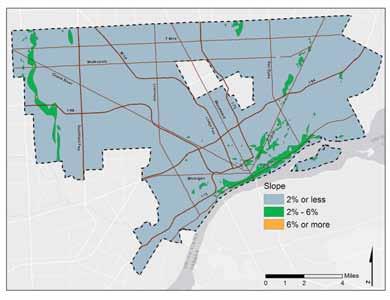
Slope is another factor that impacts runoff volumes. Areas ith higher slopes shed ater more uickly. Detroit has relatively little elevation change and therefore minimal slopes. We categori ed the minimal slopes into three distinct categories: less than 2 percent, 2 to 6 percent, and greater than six percent. Only a fe small areas of the city near the Rouge River in the north est contain slopes of greater than six percent. The map illustrates ho Detroit is a fat city ith a gently sloping topography. The highest elevation points occur near - and Eight ile Road. rom these high point, there it a gently slope south ard to ard do nto n and the Detroit River. ost of the city then falls in an area of less than 2 percent slope.
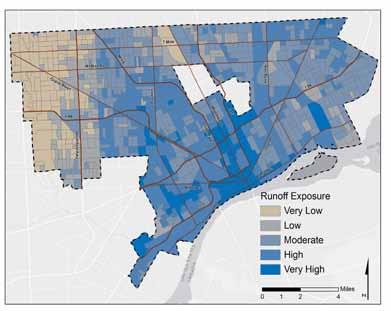
We generated uni ue land cover combinations based on the three factors land cover, soil and slope and determined each combination’s relative abundance ithin each census block group. ased on the relative abundance and associated runoff coeffcient for each combination, e created an aggregate runoff coeffcient for the each census block group. The highest scores (areas of greatest runoff concern) tended to cluster around the do nto n core and in areas of ma or impervious cover.
Michigan Geographic Data Library, ichigan Digital Elevation odel ap repared y: niversity of ichigan
Source: ichigan Geographic Data Library ichigan Digital Elevation odel Glo is Landsat ET S Census ap repared y: niversity of ichigan Detroit Climate Capstone
Ho ever, block groups do not exist in isolation. Each block group’s se ershed is part of a larger se er district. Therefore, it is also useful to analy e the system at the se er district level.
or instance, if a block group contributes a great deal to runoff burden, but the surrounding block groups do not, then the se er district ill be less likely to become overloaded. Ho ever, if that block group is surrounded by block groups that generate large volumes of runoff, then the reference block group is more likely to contribute to fooding.
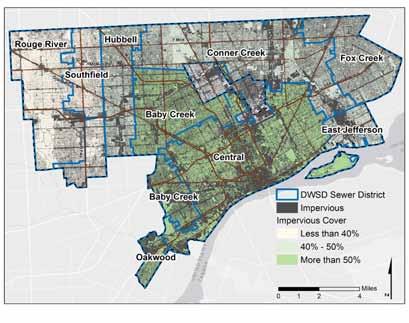
There are nine se ersheds ithin the city. Impervious cover is the most predictive variable, due to its si eable impact on runoff coeffcients. ormali ing by the si e of the individual se er districts, e found that the percentage of land cover that is impervious ithin each se er district varies idely. The percentage that exists as impervious surface ranges mainly bet een and percent, ith only the Rouge River district in the north est falling ell outside the range . We added the se ershed- ide value to the individual block group score in an effort to understand the cumulative impact. In general, the most vulnerable areas cluster around the do nto n core and around large areas of impervious cover note SW Detroit . This assessment illustrates the importance of prioriti ing on-site storm ater management in se ersheds ith higher levels of impervious surfaces.
lood risk also exists at the household level. There are certain areas of the city that are more prone to the effects of fooding, and certain citi ens ould be impacted disproportionately. The household level analysis comprises the second component of our vulnerability assessment. The household food risk exposure correlates highly to the household’s relative location to foodplains. Household food risk sensitivity refers to ho ell a household is prepared for or able to respond to that food exposure.
ur exposure assessment used E A’s maps of -year and -year food plains to determine hether a household as in an area of food exposure. E A uses the food plain maps to denote areas of special ha ard and risk in terms of fooding. The terminology of -
year and -year foods refers to the probability in a given year that is, an area in a -year food plain has a percent in probability of fooding in any given year. Ho ever, many cities are fnding that these designated areas are fooding ith increased fre uency. If this trend persists, the larger -year food plain may in effect become a more relevant area in addition to other lo -lying areas. oreover, areas along the Detroit River may be at increased risk in future years. As igure sho s, areas of food plain exposure are limited predominantly to t o geographic areas: one along the Rouge River in the est, and the other in the southeast alongside Grosse Pointe Park and across from, and on, Belle Isle.
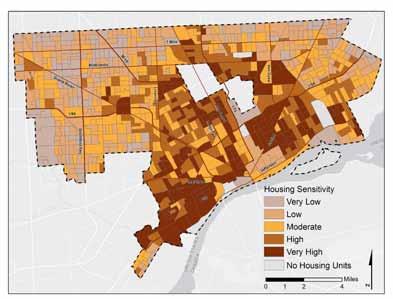
Sensitivity to a given food exposure as determined by the age of the housing stock and the median household income. Homes built before used a more porous concrete material for basement construction. Water fo s easily and more rapidly into these foundations relative to foundations that ere constructed in later years. Additionally, homes that are older may be sensitive in other ays if residents have not had the fnancial resources to make signifcant upgrades. y incorporating median household income, e can distinguish older, ell-maintained homes from older, at-risk homes. Residents ith higher incomes are more likely to renovate their homes to prevent fooding or to repair food damage. Additionally, fooding that displaces residents from their homes ill have a disproportionate effect on lo -income households. These households may not be able to afford to miss ork or rent a hotel room.
This map of the older housing stock and median household income may also be useful for other DCAC Work Groups that target lo er-income housing
ap
igure : lood Risk Ha ard
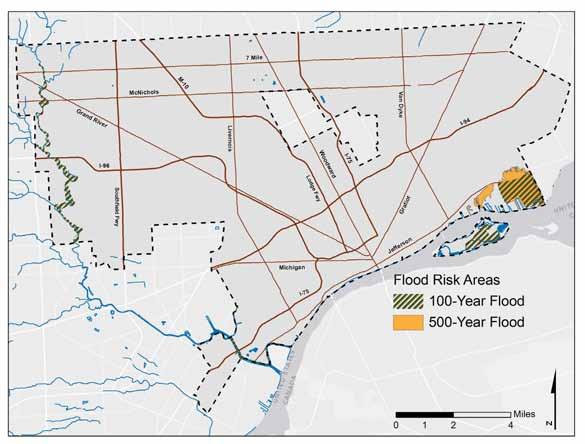
Source: ichigan Geographic Data Library, Hydrology E A lood aps ap repared y: niversity of ichigan Detroit Climate Capstone
igure : Household Sensitivity and lood otential
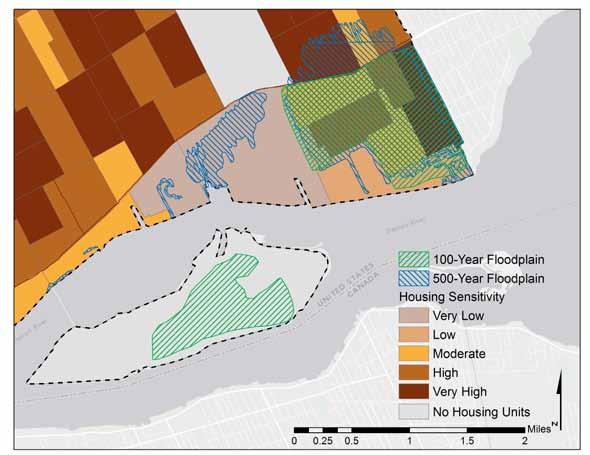
Source: American Community Survey - S Census ap repared y: niversity of ichigan Detroit Climate Capstone
: Household
and lood otential Source: American Community Survey - S
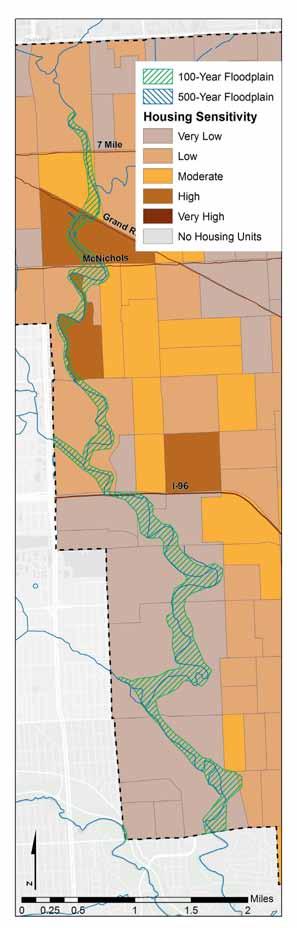
y observing the overlap of the food exposure areas and housing sensitivity, e can identify several block groups that are vulnerable to household fooding risk. We identifed t o areas of exposure concern. igure sho s the efferson-Chalmers area in the east alongside Grosse ointe ark, and igure sho s the area on the city’s est side near the Rouge River. nderlying the foodplain designation in these maps is a map of housing sensitivity using t o variables, median household income and the percent of the housing stock built before these variables ere analy ed at the block group level. This comparison is a relative measure, but it sho s that even ithin the small geographic extents of these t o maps, some census block groups tare more vulnerable than other nearby census block groups.
When examining the maps of heat vulnerability and system fooding vulnerability, there are clear similarities. Because large areas of impervious surfaces ith lo er areas of tree canopy are more vulnerable to both extreme heat and runoff burden, many of the same areas of the city appear in both vulnerability assessments. Ho ever, this also presents the possibility of strategically locating interventions that address both problems.
1. Great Lakes Integrated Science Assessment, Great Lakes Station Climatologies. http://glisa.msu.edu/ great_lakes_climate/climatologies.php
2. Altman, Peter, et al. Killer Summer Heat: Projected Death Toll from Rising Temperatures in America Due to Climate Change. Natural Resources De fense Council issue brief, May 2012. http://www. nrdc.org global arming killer-heat fles killer-sum mer-heat-report.pdf Accessed October 10, 2012.
3. Landsberg, H. (Ed.), 1981. The Urban Climate. Academic Press, New York.
4. Bornstein R. D. Observations of the urban heat island effect in New York City. Journal of Applied Meteorology. 7(1968):575-582.
5. Oke T. R. (1973) Review of Urban Climatology 1968-1973. W.M.O. Report No. 383, TN No. 134, 132 pp.
6. Van Hove, Michael, 2011. Satellite Band Thermal Image. City University of Hong Kong. Contact: vanhove@cityu.edu.hk
7. Great Lakes Integrated Science Assessment, Great Lakes Station Climatologies. http://glisa.msu.edu/ great_lakes_climate/climatologies.php
8. Serrano, SM Vicente, JM Cuadrat Prats, and Miguel A. Saz Sánchez. “Topography and vegetation cover infuence on urban heat island of arago a Spain . Fifth International Conference on Urban Climate 1-5 September, d , oland: proceedings. ol. . Department of Meteorology and Climatology Faculty of Geographical Sciences niversity of d , .
9. Coseo, Paul & Larissa Larsen (2012). How Factors of Land Cover, uilding Confguration, and Ad acent Heat Sources and Sinks Differentially Contribute to Urban Heat Islands in Eight Chicago Neighbor hoods. Unpublished Manscript.
10. Diez Roux AV. The study of group-level factors in epidemiology: rethinking variables, study designs, and analytical approaches. Epidemiology Review. 26 (2004):104–111; Harlan, S. L., Brazil, A.J., Prashad, L.*, Stefanov, W. & Larsen, L. (2006) “Neighborhood Microclimates and Vulnerability to Heat Stress , Social Science and edicine. 63 (2006): 2847-2863; Reid CE, et al. Mapping community determinants of heat vulnerability. Environ Health Perspectives. 117(2009):1730–1736.
11. Smoyer KE. Putting risk in its place: methodological considerations for investigating extreme event health risk. Social Science and Medicine. 47: 11 (1998):1809–1824.
12. Curriero FC, Heiner KS, Samet JM, et al. Tem perature and mortality in 11 cities of the eastern United States. American Journal of Epidemiology. 155 (2002):80–7.
13. Brunner E. Commentary: education, education, education. International Journal of Epidemiology. : . edina-Ramon , anobetti
A, Cavanagh DP, Schwartz J. Extreme temperatures and mortality: assessing effect modifcation by personal characteristics and specifc cause of death in a multi-city case-only analysis. Environmental Health Perspectives. 114 (2006):1331–1336.
14. O’Neill MS, Jackman DK, Wyman M, Manarolla X, Gronlund CJ, Brown DG, et al. U.S. local action on heat and health: are we prepared for climate change? Interna tional Journal of Public Health. 55:2 (2010):105–112; hipps, Shelley. The impact of poverty on health. ro ceedings of the CPHI National Roundtable on Poverty and Health (2002).
15. Curriero FC, Heiner KS, Samet JM, et al. Temperature and mortality in 11 cities of the eastern United States. American Journal of Epidemiology 155 (2002):80–87.; Knowlton K, Rotkin-Ellman M, King G, Margolis HG, Smith D, Solomon G, et al. The 2006 California heat wave: impacts on hospitalizations and emergency department visits. Environmental Health Perspectives. 117 (2009):61–67.; Semenza JC, McCullough JE, Flanders D, McGeehin MA, Lumpkin JR. Excess hospital admissions during the July 1995 heat wave in Chicago. American Journal of Preventative Medicine. 16:4 (1999):269–277.; Conti S, Meli P, Minelli G, Solimini R, Toccaceli V, Vichi M, et al. Epidemiologic study of mortality during the summer 2003 heat wave in Italy. Environmental Research. 2005; 98:3 (2005):390–399.; Fouillet A, Rey G, Laurent F, Pavillon G, Bellec S, Ghihenneuc-Jouyaux C, et al. Excess mortality related to the August 2003 heat wave in France International Archives of Occupational Environmental Health. 80(2006): 16-24.; Hutter HP, Moshammer H, Wallner P, Leitner B, Kundi M. Heatwaves in Vienna: effects on mortality. Wien Klin Wochenschr. 119:7(2007): 223–227.Naughton MP, Henderson A, Mirabelli MC, Kaiser R, Wilhelm JL, Kieszak SM, et al. Heat-related mortality during a 1999 heat wave in Chicago. American Journal of Preventive Medicine. 22:4(2002):221–227.; Stafoggia M, Forastiere F, Agostini D, Caranci N, de’Donato F, Demaria M, et al. Factors affecting inhospital heat-related mortality: a multi-city case-cross over analysis. Journal of Epidemiology and Community Health. 62:3(2008):209–215.
16. Levine R, Norenzayan, A. “The Pace of Life in Countries . ournal of Cross-Cultural sychology. 30:2(1999):178–205.
17. U.S. Census Bureau; American Community Survey, 2006-2010, Detailed Tables; generated by Social Ex plore; www.socialexplorer.com; November 15, 2012
18. Kleinfelter, Quinn. Commuters Suffer As Detroit Cuts Bus Service. National Public Radio Online, March 2012. http://www.npr.org/2012/03/08/148225070/commuterssuffer-as-detroit-cuts-bus-service. Accessed November 10, 2012.
19. Lyandres, Olga, and L. C. Welch. “Reducing Combined Se er verfo s in the Great Lakes: Why Investing in Infrastructure is Critical to Improving Water uality. Alli ance for the Great Lakes. (19 June 2012).
This chapter discusses each Work Group in a detailed fashion. This section outlines specifc Detroit-related issues pertaining to each Work Group, as well as a list of possible guidance strategies and indicators. As mentioned, these guidance strategies and indicators serve as a potential foundation for future action. Lastly, each Work Group section provides a list of resources; these resources cite works used in our analysis and provide a basis for further research.
The following encompass the seven Work Groups discussed in this chapter:
• SI ESSES I STIT TI S
• C IT LIC HEALTH I ACTS
• E ERG
• H ES EIGH RH DS
• AR S, LIC S ACE WATER I RASTR CT RE
• S LID WASTE
• TRA S RTATI

Because of the varying size and scope of Detroit’s businesses and institutions, the defnition of vulnerability as it pertains to these organizations) focuses on risk. Climate change often intensifes the risks normally associated with business operations, such as market, fnancial and supply-chain risk. Therefore businesses and institutions must address vulnerability and implement adaptation strategies, not just because of reputational gains, but because climate change can drastically affect consumption, operations and logistics. The following chart illustrates climate change’s impact on risk factors for local businesses and institutions:
The two primary guidance strategies pertaining to Businesses and Institutions include:
1. Review and improve current business practices
2. Create sustainable green markets
Reviewing and improving current business practices ranks as a primary focus because it’s effects are immediate and easily transformed. In order to make gains in eco-effciency, frms and organizations must evaluate and catalogue

This section focuses on guidance strategies for Businesses and Institutions. These guidance strategies serve as an aid for the Work Group chair and members as they address vulnerabilities and risk factors associated with climate change. Moreover, these guidance strategies engage a wide range of businesses and institutions ranging from grass roots organizations and “momand-pop stores to large conglomerates. This section provides options and avenues for Work Group members to explore ideas in an effort to mitigate the impact of climate change. In addition, this section outlines a few actions that will ensure the long-term sustainability of the project.
ongoing practices. Upon the completion of this internal evaluation, frms and organi ations can institute green programs. This strategy targets a broad array of frms and organizations, ranging from large-scale manufacturers to momand-pop retail stores and restaurants.
Secondly, creating sustainable green markets is crucial to the long-term sustainability of this Work Group. This strategy focuses on policy reform, regulatory action, capital attraction and capital investment. This guidance strategy focuses on the review and update of current environmental policy in order to determine areas of opportunity for capital investment. In addition, this strategy focuses on leveraging local incubators and accelerators as key assets in attracting venture capital and seed funding. The combination of these two guidance strategies address current vulnerabilities and build the foundation for future progress.
This guidance strategy focuses on engaging current market movers within Detroit, as well as providing the foundation for future climate adaptation efforts. This section discusses potential actions and programs that ill enhance current systems. Moreover, the indicators provide a framework for measuring the success of each action.
The following actions provide the foundation for the frst guidance strategy:
1. Identify market movers and environment-oriented organizations
2. Engage and contact businesses and organizations
3. Partner with colleges and universities
4. Develop website for businesses and institutions to learn about green practices
5. Formulate and distribute “Green checklist and survey for broad range of businesses
6. Create and distribute ‘preparedness’ checklist for climate emergencies
7. Leverage checklist and survey data for Green Certifcation program
The frst three actions focus on building a strong coalition around climate action. By identifying and engaging key organizations and institutions, this Work Group can move forward in a cohesive, sustained fashion. The fourth action step builds upon the community engagement process by leveraging technology. ore specifcally, an internet presence provides a platform for awareness, education and consensus building with regard to businesses, institutions and climate action.
Actions fve and six motivate businesses and institutions to analyze existing practices. Step fve deals specifcally ith outlining a guide for organi ations to refect upon current behaviors upon completion of this checklist and survey process, companies will have a heightened

roduce supply goods or services that result in: generating and storing renewable energy, recycling existing materials, energy effcient product manufacturing, distribution, construction, installation, and maintenance, education, compliance, and awareness, and natural and sustainable product manufacturing
Vulnerable aspects of organizations that are exacerbated by climate change; Factors of production and capital fo s are infuenced dramatically by extreme weather events and changing climate conditions

Source: By Michigan Municipal League
sense of awareness with regard to company practices and climate action. Step six focuses on extreme weather events and the preparedness of businesses and institutions. As the propensity for extreme weather events increases, organizations must prepare for these events by developing thorough game plans.
The last action deals specifcally ith leveraging data compiled through steps fve and six in order to create an independent agency. This agency would monitor businesses and institutions in their pursuit of green practices and adaptation policies. In some examples, cities created an independent entity that monitors these business practices and rewards environmentally conscious organizations
ith specifc certifcations. The primary goal of this type of program focuses on the idea of creating a strong social contract between the organizations and the community.
As mentioned, the actions for the frst guidance strategy re uires indicators — these indicators serve as metrics with which we can measure success. Some key indicators for the frst guidance strategy are listed below:
1. Number of program participants
2. Website hits and social media presence
3. Receipt of grant money and philanthropic donations
4. Presence of coalition in community
The frst indicator measures the number of program participants, especially with regard to businesses partaking in the checklist process for existing practices and climate preparedness. Although this indicator is basic in nature, it provides a good sense of momentum associated with the Work Group’s efforts.
The second indicator resembles the frst, as it uantifes activity related to the Work Group’s internet presence. Similarly to the frst indicator, an increase in unique visitors to the Work Group’s internet platforms indicate an increase in community interest.
The third and fourth indicators deal with the Work Group’s ability to generate capital and infuence. The receipt of grant funding and philanthropic donations allows for greater investment into the Work Group’s efforts, as well as recognition amongst community members. In addition to funding, the DCAC’s presence within the community further indicates the success of the Work Group’s efforts. Measuring the Work Group’s presence within the community may simply include the DCAC’s ability to meet with City offcials and other leaders ith regard to business development and land use decisions.
AS THE PROPENSITY FOR EXTREME WEATHER EVENTS INCREASES, RGA I ATI S ST RE ARE FOR THESE EVENTS BY DEVELOPING TH R GH GA E LA S.
The guidance strategy centers on the identifcation and pursuit of market opportunities pertaining to green ventures. This guidance strategy focuses on a two-prong approach. The two prongs of this guidance strategy include:
1. Implement “Green rocurement process
2. Attract green social ventures and promote entrepreneurship
The frst prong deals specifcally ith procurement. Procurement processes refer to rules and regulations pertaining to the acquiring of goods and services. Typically, procurement processes focus on the manufacturing and distribution components of the supply-chain. A prime example of a local green procurement process involves Detroit Diesel’s voluntary participation with the Environmental Protection Agency (EPA) in order to improve energy effciency. Detroit Diesel’s initial investment into property, equipment and manufacturing processes led to long-term gains. The company is currently a market leader in green manufacturing and continually receives recognition for their efforts.
Implementing green procurement practices involves conducting a Strengths/Weaknesses/ Opportunities/Threats (SWOT) analysis and determining the key market opportunities. The identifcation of these market opportunities is crucial with regard to the pursuit of policy reform as well as the encouragement of green procurement.
The following indicators pertain to green procurement:
1. Identify a market opportunities with regard to green procurement
2. Complete independent study on economic impact of green procurement implementation
3. Complete study describing capital requirement for green procurement process
The frst step refers to the necessary analysis required for identifying market opportunities and outlining potential strategies for implementation. Although this indicator is not measured quantitatively, it requires thorough discussion and continual engagement. Once market opportunities are identifed, the second indicator serves to support the pursuit of such opportunities. An economic and fscal impact study informs whether the pursuit of such market opportunities results in a positive outcomes for local employment. Such outcomes are often a key selling point with regard to receiving funding, incentives and political support. Lastly, the third indicator refers to capital requirements necessary for green procurement. Studies explaining the costs and benefts of green procurement aim to further encourage the involvement of the business community.
Similarly to the frst strategy, the second strategy — attracting green social ventures and promoting social entrepreneurship — employs a t o-prong approach. The frst prong focuses on attracting green venture capital groups. Organizations such as the Green Garage already exist within Detroit in order to foster incubation. This particular strategy seeks to attract capital in order to aid in the launch and scaling of these businesses.

Source: By Kevin.Ward
The second prong relates to the establishment of social entrepreneurship programs within Detroit. Through leveraging partnerships with institutions of higher learning and local businesses, the Work Group can create an environment that promotes talent attraction and development.
The following indicators pertain to attraction of green venture capital and promotion of social entrepreneurship:
1. Monitor total venture capital investment
2. Measure number of environmentallyoriented start-ups
3. Monitor venture-backed jobs in Detroit
4. Ensure ventures stay in Detroit and do not relocate
The frst three indicators provide a simple, effective measure with regard to the attraction and sustainability of venture capital. The Work Group can identify venture capital groups investing in green business by the number of groups that have already invested in green ventures (or in the process of). Moreover, the number of start-ups and jobs associated with these green ventures provides a way in which the Work Group can measure the sustainability of these pursuits.
Lastly, the creation of a sustainable, fourishing green economy must focus on the retention of green ventures. By collaborating with start-ups and economic development agencies, the Work Group can create an environment conducive to the long-term success of the green economy. Examples of such collaboration include creating a network for green businesses within Detroit, as well as streamlining regulatory processes for green businesses.
Bizdom. <bizdom.com>
Bizdom is an entrepreneurship accelerator that helps entrepreneurs launch, fund, and grow innovative, tech-based startups in Detroit and Cleveland.
Detroit Creative Corridor Center. <detroitcreativecorridorcenter.com>
The Detroit Creative Corridor Center is designed to support the growth of Detroit’s creative economy by delivering business acceleration and attraction services and developing signature programming tailored specifcally to creative professionals’ needs.
Detroit Diesel. May 6 2009. “Detroit Diesel Launches e Green Initiatives. http: . demanddetroit.com/pdf/press/pr-2009-05-06a. pdf>
Detroit Venture Partners. <detroitventurepartners.com>
Detroit-based venture capital frm that invests in early-stage technology companies.
Green Garage Detroit. <greengaragedetroit. com>
Mid-town based business enterprise that is committed to the sustainability of Detroit.
Greening of Detroit. <greeningofdetroit.com>
The Greening of Detroit is a c not for proft organi ation established in to guide and inspire the reforestation of Detroit. In 2006, a new vision was established, expanding The Greening’s mission to guide and inspire others to create a ‘greener’ Detroit through planting and educational programs environmental leadership, advocacy, and by building community capacity.
United Kingdom Climate Impact Programme. Climate Adaptation Wi ard. http: .ukcip. org.uk/wizard/>


Public health works to prevent disease, injury and death, and promote well being for individuals and communities. Because the effects of climate change will worsen many existing health problems, and create potential ne ones, the feld of public health is orking to identify factors that make people more sensitive to these negative effects.
Not all negative effects of climate change will manifest in Detroit, nor will all be equally dramatic. The leading causes of death in Detroit in 2007-2008 were heart diseases, cancers, cerebrovascular diseases, assault, and accidents.1 While climate change does not directly cause cardiovascular or respiratory diseases, heat and poor air quality exacerbate them.2 Additionally, severe weather that displaces people from their homes, jobs, and communities can have negative secondary effects and even cause problems of mental health or chronic stress.3 Each of these issues affects children; additionally, children suffer disproportionately from environmental pollution, such as air pollution or lead paint in the home.4 Because the city has a high proportion of low-income residents, any change in food prices due to shortages will have a disproportionately negative impact on the community.
“Public health works to prevent disease, injury and death, and promote well being for individuals and communities. Source: American ublic Health Association)
Refers to unusually hot temperatures and/or high humidity readings compared to the typical regional average for that season.An EHE occurs when the daytime high is above 90*F and the nighttime low temperature remains high limiting relief from the heat. (Source: EPA)
The main biophysical exposures that infuence public health are extreme heat, extreme cold, air uality, ater uality, fooding or extreme weather events, insect-borne disease, and increase in food prices. Since vulnerability is comprised of biophysical exposures and sensitivity, public health efforts should target its emergency and preventive strategies at the most sensitive population. There are two main groups of factors that increase sensitivity. Physical factors include age (such as the very young or very old), disease, and physical mobility or disability. Social factors that increase vulnerability include poverty, language barriers, social isolation, lack of education, and transportation access, such as having access to a vehicle.
The main danger from increased heat is not an increase in temperature but the frequency of extreme heat events (EHEs)5, sustained high temperatures over a period of days. Cities with low-density land use spread over large areas, such as Detroit, “have been associated with enhanced surface temperatures 6, intensifying the risk of EHEs. The projected increase in EHE days will cause Detroit to experience a four-fold increase by the end of the 21st century, from 9 to 36 days7. According to the National Oceanic and Atmospheric Agency, “Cities in the northeastern and midwestern United States have the strongest weather mortality relationships, because weather variability, rather than heat intensity, is the single important factor in defning human sensitivity to heat 8. This may occur because people don’t know how to cope with temperature extremes they are unfamiliar with or do not perceive themselves as vulnerable to this risk9.
Extreme heat is dangerous to those who are very old, very young, homebound, lack air conditioning, are socially isolated, or who suffer
from chronic physical or mental illness10. With an increase in extreme heat events, there will be an increased risk of heat-related deaths and exacerbation of illnesses11. Additionally, the high electricity demand for air-conditioning during a heat event increases the risk of brownouts and power outages, further isolating potentially vulnerable groups. People who suffer health effects as a result of heat may survive the EHE itself but succumb in the two-week period following the event.
Greenhouse gas emissions also have chemicals (NOCs and VOCs) that are ozone precursors, meaning that they interact with heat and chemically transform into harmful ozone particles. “Higher temperatures hasten the chemical reactions that lead to ozone and secondary particle formation 12. With higher ground-level temperatures, these reactions will happen more, leading to a decrease in air quality and an increase in harmful effects on people’s respiratory function.
reathing o one can cause infammation in the deep lung as well as…decreases in lung function .13 Exposure to ozone and other airborne pollution can increase respiratory illness, asthma attacks, asthma-related hospital visits, and even premature death. People who spend more time outdoors, such as children and laborers, will have greater exposure and therefore greater risk.
There may be fewer deaths from exposure, because winter temperatures overall will be warmer. However, there may be more frequent extreme winter precipitation events, such as blizzards and ice storms. While everyone may suffer the same exposure to a severe weather event, not all people are vulnerable in the same way. Blizzards and other storms that block roads and isolate people pose a specifc hazard to older people and those with chronic health conditions who will be cut off from help. Homeless individuals will be at greater risk of death from exposure when an event comes on suddenly. Additionally, low-income people may suffer damage to their homes or lose income
“Volatile organic compounds (VOCs) and nitrogen oxide (NOx) are emitted as gases from certain solids or liquids. VOCs include a variety of chemicals, some of which may have short- and long-term adverse health effects. Emissions from industrial facilities and electric utilities, motor vehicle exhaust, gasoline vapors, and chemical solvents are some of the major sources of NOx and C. Source: E A
Ground level ozone is not emitted directly into the air, but is created by chemical reactions between oxides of nitrogen (NOx) and volatile organic compounds (VOC). These chemical reactions are accelerated by heat.
Calculation of what people perceive as the temperature in hot and humid conditions. (Source: National Oceanic and Atmospheric Administration)

Source: By josephhleenovak
from missing work. Potential power outages associated with storms may compound these diffculties.
Extreme precipitation events can food the sewer system with a high volume of ater in a short period of time. verfo of the combined sewer system can release untreated sewage into local rivers and streams, causing a hazard to human health. The current combined sewer system may have inadequate capacity to absorb and process the volume of water runoff from an extreme precipitation event. This could lead to se er overfo , ater contamination ith
sewage, and water contamination from surface runoff. Children, the elderly, pregnant women, and those with compromised immune systems are especially at risk for waterborne diseases 14 .
While Detroit will likely not experience the type of fooding seen in coastal cities such as New York, extreme precipitation could nevertheless have negative effects on residents. Flooding of homes and neighborhoods could be costly for homeowners and displace residents, causing homelessness and disrupting the fabric of the community.
Changing temperatures ill push back frst frosts later in the fall and last frosts earlier in the spring, lengthening the season for insects. Since 2002, Michigan has seen the emergence of insect-borne diseases such as West Nile, Lyme disease, and Equine Encephaly. Additionally, fooding or heavy rainfall can create breeding grounds for these insects. Resulting in an increase in infected insects and an increased risk of human exposure. Nearly all individuals in Michigan who have died from West Nile virus have been sixty-fve or older.
While Michigan is better positioned to withstand drought than other regions of the country, food shortages caused by droughts
during the growing season increase the price of food. Such price increases, even small ones, disproportionately impact low-income people. If drought increases the price of fresh foods, residents may turn to less healthy, processed foods to stretch their budgets. ne fnal factor to consider is the extreme vulnerability of homeless people to all of these impacts. They have the least fnancial resources to deal ith any effects of heat and fooding, and because they spend more time outdoors, they are extremely sensitive to physical exposures to heat, air uality, and fooding.
Michigan’s Syndromic Surveillance System facilitates rapid public health response to outbreaks of illness and other public health threats by using real-time detection through automatic data collection and other tools. (Source: Michigan Department of Community Health)
HI is defned as increased surface and air temperatures in urban areas relative to surrounding suburban and exurban areas. UHI patterns vary by region, occur in more dispersed pattern than once thought, may increase or decrease over time, and are most problematic during warm weather.
Plan to address all aspects of emergency preparedness, from security to natural disasters. Detroit’s ffce of ublic Health Emergency Preparedness coordinates its All-Hazards Plan.
Tool developed by National Oceanic and Atmospheric Administration for statistical analysis of heat threats for specifc regions to allo for better forecasting of extreme heat and improve the public health response.
The following provides indicators, potential strategies, and potential goals for each public health issue.
Heat
Indicators
• umber of heat-related deaths
Work with Medical Examiner to explore how ICD codes used to indicate cause of death could be used as a tool to track heat-related deaths
• umber of potentially heat-related deaths
Track deaths relative to baseline in the two-week period after an extreme heat event
• umber of cooling centers open during an extreme heat event
• Ground-level apparent temperatures heat index) throughout the city and in known heat islands
• ercent of tree canopy coverage in kno n heat islands
• umber of heat-related hospitali ations and emergency room visits during extreme heat events
• Average distance to refuge cooling station for residents
• umbers of people using refuge cooling stations
Potential Strategies and Goals
• Goal: Reduce heat-related deaths and illnesses
• In the short term, public health strategies use cooling centers to prevent heat-related deaths and illnesses. However, while use of air conditioning saves lives now, it increases greenhouse gas emissions and thus worsens climate change in the long term. Long-term strategies that actually cool the built environment and mitigate the urban heat island effect should be the ultimate goal.
• Create or update the City’s heat ave response plan, based on other municipal

response plans15
• Increase number of residents ith orking air conditioning (in conjunction with energy-effciency measures
• Improve access to cooling centers, both in terms of number of stations and geographic distribution
• Improve residents’ a areness of cooling centers through outreach strategy
• Increase a areness of vulnerable populations about risks of heat illness
• Work ith state Syndromic Surveillance to better track heat-related hospitalizations and deaths
• Decrease ground-level temperatures in known urban heat islands (UHI) by increasing tree coverage and converting impervious materials to vegetative coverage
• Implement green-roof or hite-roof initiative to refect instead of absorb heat
• Incorporate climate pro ections into All Hazards Plan
• Reach out to home services such as Meals on Wheels, other senior services, to contact isolated or homebound individuals
• Work ith apartment buildings and neighborhoods organizations to institute block or foor captains to check on residents
• Implement Heat Health Warning System when possible, based on NOAA Heat/ Health Warning System, to forecast excessive heat
Air Quality
Indicators
• re uency of o one action days
• Ground level o one and particulate matter in kno n hot spots
• re uency of respiratory illness during ozone action days or heat days as measured in hospital/emergency room admissions
Potential Goals and Strategies
• Work ith industry to reduce toxic release of ozone precursors
• Identify proximity of po er plants, incinerator, toxic release facilities to dense residential areas or school
• Aggressively prevent truck and other heavy traffc from residential areas
• Create vegetative buffers or other flters between residential and highway
• Track admissions for respiratory illness for early warning and action
• Many other strategies to address climate change in other areas (such as switching to renewable sources of energy, encouraging biking rather than driving) will also have positive effects on public health.
Days that ground-level ozone exceeds acceptable levels for human health. Breathing in ground level ozone can harm our health. Even relatively low levels of ozone can cause health effects. People with lung disease, children, older adults, and people who are active outdoors may be particularly sensitive to ozone. (Source: EPA)
Exposure and Cold-Related Deaths
Indicators
• umber of cold-related deaths
• umber of people taking advantage of warming shelters
• umber and duration of inter po er outages
Potential Goals and Strategies
• utreach to homeless population, homebound and elderly in anticipation of a severe storm and immediately after
• Increase a areness of arming shelters or other resources
Water Quality
Indicators
• Capacity of ater treatment systems
• Instances of combined se er outfo release
• Coverage of absorptive vegetation
• Instances of ater-borne illness
Potential Goals and Strategies
• Increase public information on fre uency and location of se er outfo s
• Increase techni ues to absorb ater and reduce runoff into sewer—swales, vegetation.
• Incentivi e homeo ners to reduce runoff by crediting their sewer bill when they implement rain barrels, other on-site collection and absorption techniques
• Work ith hospitals to better track admission for possible water-borne illnesses
• Additional techni ues from the arks, pen Spaces and Water Infrastructure group will also beneft human health by improving ater quality
Flooding
Indicators
• umber of roads impassable from fooding
• umber of homes damaged from fooding
• umber of people displaced from fooding
Potential Goals and Strategies
• Work ith arks, pen Spaces, and Water Infrastructure to prevent fooding
• Work to increase a areness of food insurance in areas with high water table or low elevation
• Collaborate ith Homes and eighborhoods work group to change landscaping and other techniques to divert water from homes
Indicators
• umber of infected insects tested relative to same time previous year
• umber of people admitted for insectborne diseases over same time previous year
• easure public a areness of symptoms and how to detect
• easure medical community a areness of symptoms
Potential Goals and Strategies
• Continue education to medical community about recognizing symptoms
• Continue education to vulnerable populations about recognizing symptoms
• Drain fooded areas
• Employ larval insecticide in heavily infested areas
• Secure homes ith screens, bed nets to keep out insects
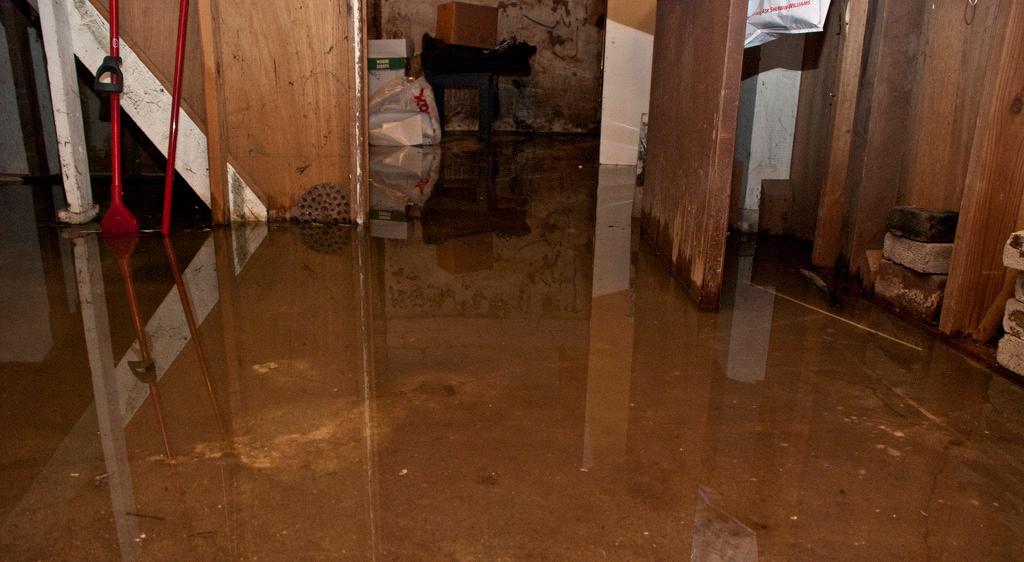
Source:By CR Artist
Indicators
• ercent change in price of staple foods, normali ed for infation
• ercent change in price of fruits and vegetables, normali ed for infation
• ercent change in residents using food pantries
• ercent change in residents ho report greater food insecurity
Potential Goals and Strategies
• Support access to community gardens, urban farms, and other sources of food for residents
• ublici e food pantries and similar resources during times of high food prices
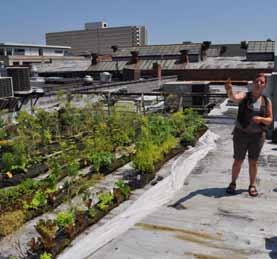
Source: Michigan Municipal League
SOURCES
1. Detroit Department of Health and Wellness Promotion. “Combined Data Book: 2007 and . ffce of Health Information, lanning, olicy Evaluation, and Research, City of Detroit, Detroit.
2. ) Kjellstrom, Tord, Ainslie J. Butler, Robyn M. Lucas, and Ruth Bonita. “Public health impact of global heating due to climate change: potential effects on chronic non-communicable diseases. International Journal of Public Health 55 (2010): 97-103.
3. The Interagency Working Group on Climate Change and Health. A Human Health Perspective On Climate Change: A Report Outlining the Research Needs on the Human Health Effects of Climate Change. National Institute of Environmental Health Sciences/ Environmental Health Perspectives, 2010.
4. Kinney, Patrick L. “Climate Change, Air Quality, and Human Health. American Journal of Preventive Medicine (Elsevier, Inc.) 35, no. 5 (2008): 459-467.
5. Altman, Peter, Dan Lashof, Kim Knowlton, Ed Chen, Laurie Johnson, and Larry Kalkstein. Killer Summer Heat: Projected Death Toll from Rising Temperatures in America Due to Climate Change. Issue Breif, Natural Resources Defense Council, 2012.
6. Stone, Brian, Jeremy J. Hess, and Howard Frumkin. “Urban Form and Extreme Heat Events: Are Sprawling Cities More Vulnerable to Climate Change Than Compact Cities Environmental Health Perspectives 118, no. 10 (2010): 1425-1428.
7. Altman, Peter, Dan Lashof, Kim Knowlton, Ed Chen, Laurie Johnson, and Larry Kalkstein. Killer Summer Heat: Projected Death Toll from Rising Temperatures in America Due to Climate Change. Issue Breif, Natural Resources Defense Council, 2012.
8. National Oceanic and Atmospheric Administration. NOAA Heat/Health Watch Warning System Improving Forecasts and Warnings for Excessive Heat. January 11, 2005. http://www.noaanews.noaa.gov/stories2005/s2366.htm (accessed December 16, 2012).
9. Bassil, Kate L., and Donald C. Cole. “Effectiveness of Public Health Interventions in Reducing Morbidity and Mortality during Heat Episodes: a Structured Revie . International Journal of Environmental Research and Public Health 7 (2010): 991-1001.
10. Stone, Brian, Jeremy J. Hess, and Howard Frumkin. “Urban Form and Extreme Heat Events: Are Sprawling Cities More Vulnerable to Climate Change Than Compact Cities Environmental Health Perspectives 118, no. 10 (2010): 1425-1428.
11. Altman, Peter, Dan Lashof, Kim Knowlton, Ed Chen, Laurie Johnson, and Larry Kalkstein. Killer Summer Heat: Projected Death Toll from Rising Temperatures in America Due to Climate Change. Issue Breif, Natural Resources Defense Council, 2012: 29.
12. Kinney, Patrick L. “Climate Change, Air Quality, and Human Health. American Journal of Preventive Medicine (Elsevier, Inc.) 35, no. 5 (2008): 460.
13. Kinney, Patrick L. “Climate Change, Air Quality, and Human Health. American Journal of Preventive Medicine (Elsevier, Inc.) 35, no. 5 (2008): 461.
14. Altman, Peter, Dan Lashof, Kim Knowlton, Ed Chen, Laurie Johnson, and Larry Kalkstein. Killer Summer Heat: Projected Death Toll from Rising Temperatures in America Due to Climate Change. Issue Breif, Natural Resources Defense Council, 2012, p. 51.
15. Bernard, Susan M., and Michael A. McGeehin. unicipal Heat Wave Response lans. American Journal of Public Health 94, no. 9 (2004): 1520-1522.
City of Windsor Climate Change Action Plan. The City of Windsor. September 2012. Windsor Environmental Master Plan.
California Natural Resources Agency. 2009 California Climate Adaptation Strategy: A Report to the Governor of the State of California in Response to Executive Order S-13-2008. 2009.
Ancillary human health benefts of improved air uality resulting from climate change mitigation. Michelle L Bell, Devra L Davis, Luis A Cifuentes, Alan J Krupnick, Richard D Morgenstern and George D Thurston. 31 July 2008. Environmental Health: 2008: 7:41.
Community-Based Adaptation to the Health Impacts of Climate Change. Kristie L. Ebi, PhD, Jan C. Semenza, PhD. American Journal of Preventive Medicine 2008: 35 (5). P. 501.
Environmental Health Indicators of Climate Change for the United States: Findings from the State Environmental Health Indicator Collaborative. aul . English, Amber H. Sinclair, ev Ross, Henry Anderson, Vicki Boothe, Christine Davis, Kristie Ebi, Betsy Kagey, Kristen Malecki, Rebecca Shultz, and Erin Simms. Environmental Health Perspectives. Volume 117, Number 11, November 2009 p. 1673
Climate Change: The Public Health Response. Howard Frumkin, MD, DrPH, Jeremy Hess, MD, MPH, George Luber, PhD, Josephine Malilay, PhD, MPH, and Michael McGeehin, PhD, MSPH. March 2008, Vol 98, No. 3 | American Journal of Public Health. P. 435.
Health of the Homeless and Climate Change. Brodie Ramin and Tomislav Svoboda. 2009. Journal of Urban Health: Bulletin of the New York Academy of Medicine, Vol. 86, No. 4.
Environmental Health Indicators of Climate Change for the United States: Findings from the State Environmental Health Indicator Collaborative. aul . English, Amber H. Sinclair, ev Ross, Henry Anderson, Vicki Boothe, Christine Davis, Kristie Ebi, Betsy Kagey, Kristen Malecki, Rebecca Shultz, and Erin Simms. Environmental Health Perspectives. Volume 117, Number 11, November 2009. P 1673.
Temperature Extremes and Health: Impacts of Climate Variability and Change in the United States. Marie S. O’Neill, PhD, Kristie L. Ebi, PhD, MPH. Journal of Occupational and Environmental Medicine, Volume 51, Number 1, January 2009.
Summer temperature variability and long-term survival among elderly people with chronic disease. Antonella anobetti, arie S. ’ eill, Carina . Gronlund, and oel D. Sch art . Proceedings of the National Academy of Sciences. April 25, 2012. Volume 109, Number 17, pp. 6608–6613.
odifers of the Temperature and ortality Association in Seven S Cities. arie S. ’ eill, Antonella anobetti, and oel Sch art . American ournal of Epidemiology. : 1082.

Energy consumption pervades every aspect of our modern world and is a major hurdle toward building a more sustainable and resilient community. The U.S. Department of Energy divides energy use into fve sectors: residential, commercial, industrial, transportation and utilities. The DCAC can operationalize these sectors as (1) built environment energy consumption, and (2) energy supply and distribution. A serious effort to impact the DCAC’s stated goals to reduce greenhouse gas emissions for the sustainability and well-being of the City of Detroit, and increase the resilience of the city’s social, built and natural environments, must cast a broad net. Strategies and indicators for each sector encompass aspects of both climate mitigation and adaptation. To approach the tasks as outlined by the DCAC Workgroup Guide, the following general approach should inform and guide the process:
1. Coordinate with other work groups (Neighborhoods, Transportation, Parks, etc.) to develop cross-linked indicators that impact energy use.
2. Seek mitigation strategies to reduce overall energy consumption per capita or per unit of economic activity
3. Approach climate adaptation by minimizing energy distribution vulnerabilities.
In a warming climate, reliable energy delivery becomes crucial as Detroiters use more electricity for air conditioning. If the region’s average annual climate warming trends continue by the predicted 1.4°F, the associated demand for energy used for cooling will increase by about 5-20 percent. 1,2 Meeting increases in this peak demand could require investments in new energy infrastructure. For example, based on a 6°F to 9°F temperature increase in summer, climate change could increase the need for
additional electric generating capacity by roughly 10-20 percent by 2050 in the region.3 This would re uire a signifcant additional investment to upgrade and repair infrastructure. Likewise, the age of housing stock affects the effciency of home energy use, re uiring signifcant upgrades to weatherize houses and decrease unnecessary home energy use.
Energy vulnerability focuses on threats posed by extreme weather events associated with climate change that can disrupt infrastructure services. These disruptions often cascade across energy infrastructure, compounding both the geographic extent and complications of restoring service. For example, the 2003 Northeast blackouts were compounded due to infrastructure failures at multiple points throughout the Northeast and Midwest. As successive systems failed, the increased burden overwhelmed associated infrastructure. Such events threaten public health and local economies, especially in areas where human populations and economic activities are concentrated in urban areas. Implications of climate change for energy infrastructure vulnerability in Detroit include:
1. Extreme eather events fooding, severe weather, etc.) associated with climate change will increase disruptions of energy delivery.4
2. Less extreme weather events associated with climate change such as extended warm weather, freeze-thaw cycles, or freezing rain, occurring in rapid succession can also damage or overwhelm energy delivery infrastructure.5
3. Disruptions of services in one infrastructure will almost always result in disruptions in one or more other infrastructures, especially in urban areas, triggering serious cascading infrastructure failures. For example, if electricity supply is disrupted, storm water systems ithout suffcient backup systems will consequently fail.6
4. These risks are greater for infrastructure that is already stressed by age or by demand levels that exceed what they were designed to deliver.
This document identifes fve potential goals concerning Detroit’s energy operational areas. Subsequently, this report provides a mitigation or adaptation rationale for each goal, as well as some potential strategies, and indicators that might be used to measure progress toward the goal.
1. Reduce the energy consumption of residential dwellings by 25 percent per household per unit of Gross Metropolitan Product (GMP), a measure of regional economic activity.
2. Reduce the total energy use of all commercial and industrial buildings by 10 percent per unit of GMP.
3. Develop local policies to ensure that new buildings and major renovations can adapt to the changing climate.
4. Produce 5 percent of the total energy used within Detroit from local (<50 miles) renewable sources and district (distributed) energy systems
5. Increase the capacity factor of cleaner fossil fuel energy generation such as natural gas.
Mitigating energy vulnerability will require a multifaceted approach that impacts both energy generation (supply-side) and energy use (demand-side). Supply-side strategies seek to increase the reliability of energy supply by focusing on production, transmission, or distribution of energy. Demand-side policies manage the demand for energy in various ways. ost important are effciency improvements that keep end-use demand levels constant
while minimizing the energy lost during generation and transmission. For example, energy effcient retrofts and appliances such as refrigerators with more insulation and smaller, more effcient motors, and compact fuorescent light bulbs that displace incandescent bulbs are two common examples of ways to reduce energy consumption. Also important are conservation efforts that encourage users to accept lowered-use service levels, especially when they do not diminish quality of life. Examples include turning thermostats slightly lower during the winter and slightly higher during the summer, and turning off lights or using timers when possible.
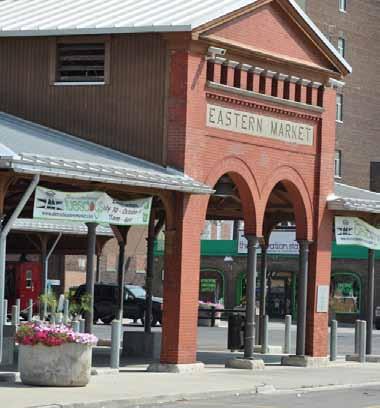
Buildings are the single largest contributor to carbon emissions in the United States. The commercial and residential building sector accounts for 39 percent of carbon dioxide (CO2) emissions in the United States per year, more than any other sector.7 Similarly, over the next 25 years, CO2 emissions from buildings are projected to grow faster than any other sector, with emissions from commercial buildings projected to grow the fastest at 1.8% per year through 2030.8 Reducing carbon emissions from building energy use requires two approaches: improve energy effciency of existing structures and improve energy effciency of new construction.
Energy conservation can improve carbon mitigation, comfort and cost of living. A study on Federal Energy Management practices details that American households could save 46.4 quadrillion British Thermal Units (BTUs) of energy and over $56 billion in consumer energy bills annually in the year 2020 by implementing energy conservation techniques, such as weatherization, and effcient technologies.9 Due to the high share of natural gas and electricity use in the building sector, percentage reductions in consumption of these energy resources could be even greater. The report’s policy recommendations could reduce total projected electric generating capacity and natural gas consumption (including gas consumed for electricity consumed in buildings) by well over 10 percent per year. Deploying energy-effcient technologies in end-use facilities and minimizing losses in power generation, transmission and distribution can help counteract the increased demand on and decreased output of power plants due to higher temperatures. This will eliminate the need for approximately 320 average-sized (400 MW) power plants.
New building construction and renovation is another key area of prioritization. Buildings have a design life ranging from 50-100 years during which they continually consume energy and produce CO2 emissions. If half of new commercial buildings were built to use 50 percent less energy, it would save over 6 million metric tons of CO2 annually for the life of the buildings.10 The U.S. Green Building Council projects demand for new construction to be approximately 1.5 million new buildings annually through . Energy effciency in ne construction standards could protect buildings against predicted changes in weather patterns by ensuring that site orientation, insulation and windows are appropriate for expected climate conditions. Similarly, other strategies such as reducing impervious surface cover on sites and using light-colored materials on fat surfaces such as parking lots and rooftops can help reduce ambient air temperature, further reducing energy use for cooling.
4) Renewable and Distributed Energy Generation
A fnal area to impact energy consumption is to reduce the carbon intensity of energy generation, primarily by increasing distribution of electricity from alternative sources such as solar and wind power and minimizing transmission loss by decreasing the distance between energy production and consumption. Utilities can minimize energy loss during distribution by siting po er sources closer to their fnal end use. This reduces the distance that current must travel before it reaches its fnal destination, and thus decreases the energy lost during transmission.
Similarly, generating energy from many small sources, called distributed generation can provide secure electricity for large consumers

and reduce vulnerability to grid outages in extreme weather. In general terms, district energy systems provide for the heating and hot water needs of a community of buildings, which are connected through a network of pipes under the streets that carry hot water from a centralized energy plant. District energy can also provide cooling services, through the use of a similar piping infrastructure with chilled water. Combined heat and power (CHP) plants capture and use the heat created during electricity generation, making them much more effcient. Rather than being released into the air above the plant, this captured energy can heat nearby buildings.
Capacity factor is a measure of how often an electric generator runs for a specifc period of time. It compares how much electricity a generator actually produces with the maximum it could produce at continuous full power operation during the same period. Increasing capacity factor of natural gas and decreasing that of coal is a viable strategy for reducing
the environmental footprint of energy generation. Utilities can utilize lowemission fossil fuels, such as natural gas, to satisfy constant base-level demand and supplement with renewable sources to meet periods of higher, or peak-level, demand. Some renewable sources generate power in a highly variable way. Utilities have no control over whether the sun shines or the wind blows, so it is not feasible to rely solely on these modes of generation to satisfy the base-level energy use that exists 24 hours a day. For instance, there will be some level of electricity demand throughout the night, but it will increase sharply early in the morning as residents awake and start their day.
No.Indicator
E-1Energy Use by Sector: Residential
E-2Energy Use by Sector: Commercial
Description
Total GJ of energy consumed annually for residential use per household.
Total GJ of energy consumed annually for commercial use per commercial property.
E-3Energy Use by Sector: IndustrialTotal GJ of energy consumed annually for commercial use per inducstrail property.
E-4Energy Use by Sector: Transportation
E-5Energy Mix
E-6Local Energy Sources
Total G of energy consumer annually for feet and grounds vehicles and equipment per VMT.
Percent of total enrgy production by production type (Coal, Natural Gas, Nuclear, Renewables, etc.)
Total GJ of energy (for same uses as E-1, E-2, E-3) consumed annually by city produced within the city limits.
E-7Energy Use-Buildings (GJ/Sq ft.)Total GJ or energy (for same uses as E-1, E-2, E-3) consumer annually produced by renewable sources within 100 miles of city limits.
E-8Reduction in Energy consumption (% Change)
E-9Energy Use- Commuter transport (GJ/capita)
E-10Reduction in energy consumption (% Change)
E-11CO2 Equivalent: All energy uses (Tons/capita)
Total GJ of energy (of all types) consumed annually per gross square ft.
Total energy (of all types) consumed in GJ each year for commuter transportation/ Total number population in that year
Total change in energy consumption in GJ for buliding, commuting, and feet grounds vehicle uses in current year over previous year.
Total CO2 equivalent (in tons of CO2) emitted annually by the campus for building, commuting, and feet grounds vehicle uses .Total population.
1. Great Lakes Integrated Science Assessment, Great Lakes Station Climatologies. http://glisa.msu.edu/great_lakes_ climate/climatologies.php
2. USGCRP. Global Climate Change Impacts in the United States. United States Global Change Research Program. Cambridge University Press, New York, NY, USA.
3. Ibid
4. Wilbanks, Tom, et. al, Climate Change and Infrastructure, Urban Systems, and Vulnerabilities: Technical Report For The U.S. Department of Energy in Support of the National Climate Assessment (Oak Ridge, TN: Oak Ridge National Laboratory, 2012).
5. Albert, R., Albert, I. & Nakarado, G. L. Structural vulnerability of the North American power grid. Physical Review E 69 025103(R) (2004). p. 1-4.
6. Ibid
7. U.S. Energy Information Administration, Annual Energy Review (AER), Table 12.2 Carbon Dioxide Emissions From Energy Consumption by Sector, 1980-2008; http://www.eia.doe.gov/emeu/aer/envir.html.
8. Ibid
9. Loper, Joe, Lowell Unger, David Weitz, and Harry Misuriello. “Building on Success: Policies to Redue Energy Waste in uildings. Alliance to Save Energy. http: .cee .org eval db pdf .pdf.
10. Ibid
Alliance to Save Energy: Building on Success - Policies to Reduce Energy Waste in Buildings (http://www.cee1.org/eval/db_pdf/964.pdf)
Climate Change and Infrastructure, Urban Systems, and Vulnerabilities: Technical Report for the U.S. Department of Energy (http://www.esd.ornl.gov/eess/Infrastructure.pdf)
Commercial Building Energy Consumption Survey (CBECS) (http://www.eia.gov/consumption/commercial/)
Energy Information Administration: State of ichigan rofle-Energy Consumption by Sector (http://www.eia.gov/beta/state/?sid=MI)
Energy Information Administration: State of ichigan rofle - Environment rofle Consumption rofle
(http://www.eia.gov/beta/state/data.cfm?sid=MI#Environment)
Energy Information Administration: Electricity Detailed Data Files (http://www.eia.gov/cneaf/electricity/page/data.html)
Energy Information Administration: Consumption and Effciency Data iles (http://www.eia.gov/consumption/data.cfm#rec)
EPA Greenhouse Gas Equivalencies Calculator (http://www.epa.gov/cleanenergy/energy-resources/calculator.html)
National Renewable Energy Lab – Dynamic Maps, GIS Data, and Analysis Tools for Energy Siting (http://www.nrel.gov/gis/)
United States Bureau of Economic Analysis – Regional Gross Domestic Product (GMP) (http://www.bea.gov/iTable/iTable.cfm?ReqID=70&step=1&isuri=1&acrdn=2)
US Department of Transportation – State Facts and Figures (http://gis.rita.dot.gov/StateFacts/)
Source:

The development of community-based initiatives and climate education within Detroit can reduce the direct impacts of climate change on homes and neighborhoods. By bringing the community together to decrease utility bills and increase sustainability, residents can reduce vulnerability while improving quality of life.
We defne vulnerability as exposure to biophysical hazards paired with sensitivity. Sensitivity refers to the degree to which a community is harmed by the given exposure. The biophysical ha ards that infuence homes and neighborhoods include extreme heat, extreme cold, fooding, eakening infrastructure, low neighborhood density, and low tree canopy. In order to reduce vulnerability, homes and neighborhoods should target strategies towards sensitive populations such as elderly residents and low-income families.
DCAC is a grassroots effort that requires community involvement in order to be successful. Community involvement is of particular importance for the Homes and Neighborhoods Work Group. One method to make climate change concerns interesting to residents is through potential energy savings. With approximately 44% of Detroit residents living beneath the poverty level, energy effciency can save money and increase comfort. Such strategies, could address multiple issues of housing quality and poverty.
According to the U.S. E.P.A., most buildings waste up to 30% of the energy they consume due to ineffciencies. The likelihood of ineffcient heat and cooling systems, older, ineffcient appliances, and drafty indo s and doors ith insuffcient insulation is greatest among older homes in lower-income areas. While some programs in Detroit approach this issue, these programs target specifc areas of the city, leaving many residents without access to the benefts of these programs.
1. Empower residents to take action and utilize existing programs by increasing awareness of programs and action steps
2. Decrease energy usage in residences through energy effciency and eatheri ation programs
3. Reduce UHI
1. Promote alternative uses of failing structures
2. Promote compact development
Goal: Empower residents to take action and utilize existing programs by increasing awareness of programs and action steps
Strategy: Create community involvement through educational programs that are affordable, accessible and empowering.
Educational programs have been shown to have a positive infuence on youth, empo ering them to contribute to their community while building leadership and team building skills. School systems can foster programs run by volunteers and parents during after school hours. The Climate Change outh Action Guide is a resource that can start informing youth on issues around climate action and help empower them to make a change. In addition to youth programs, leadership positions for residents within the community should be developed and provided with basic resources to initiate community projects. Additionally, programs should encourage participation between the different neighborhoods in Detroit.
Actions:
1. Identify partnership organizations around youth education and programming
2. Develop school and community based educational programs throughout the City for youth
3. Initiate development of neighborhood based climate alliances
4. Establish a Community Recognition Program which will include small project grants
5. Develop Detroit Climate Website with information on available programs and blog space to promote neighborhood projects
Potential Indicators:
• Number of programs developed in schools
• Number of youth in these programs
• Number of views on website and those posting on website
• Number of communities applying to Community Recognition Program
The practice of protecting a building and its interior from the elements, particularly from sunlight, precipitation, and wind, and of modifying a building to reduce energy consumption and optimi e energy effciency.
Building in a more compact way to reduce development costs and provides density that can be effciently served by transit. There are several forms of compact development including mixedused development, where by integrating different uses such as residential, offce, and shopping daily vehicle trips can be reduced.

Source: By Ellenm1
Goal: Reduce Residential Energy Bills
Strategy: Combine with existing programs to weatherize residences, decrease energy consumption, and use energy effciently.
While many smaller programs exist in the City of Detroit, the lack of public awareness and communication between programs prevents full participation. While reducing energy consumption in homes reduces the amount of greenhouse gases in the atmosphere, it more importantly reduces residents’ energy bills. Many residents are below the national poverty level and excessive energy bills can lead to utility shut offs. Residents need assistance in long-term solutions in order to reduce utility bills.
Actions:
1. Develop programs to reduce energy leakage and promote energy effcient systems in buildings
2. Weatherization of existing residences to resist sunlight, wind and precipitation to reduce heating and cooling costs
3. Improve air quality in residences through lead paint abatement
4. Work with Detroit energy companies to enhance comprehensive home energy assessments programs and subsidize installation of energy saving appliances and light bulbs.
5. Developa Green Lease program to promote energy saving renovations of rental units.
6. Develop website and create a toolbox of existing programs
Potential Indicators:
• Number of homes utilizing programs developed
• Amount of reduction in energy bills
• Number of green leases in the city
• Service area of programs
Goal: Decrease Urban Heat Island effect in neighborhoods
Strategy: Increase refective and pervious surfaces in neighborhoods and minimize rainwater runoff into stormwater system
Through the vulnerability assessment conducted, we saw that temperatures varied throughout the city by up to 7°F. This variation is mainly due to large areas of impervious surfaces and insuffcient tree canopy. Warmer temperatures in homes decrease human comfort and increase utility costs due to increased water and air conditioner usage. As temperatures rise, it can have negative effects on vegetation as well, further increasing the vulnerability of the area. y utili ing strategies such as refective roofs, tree canopies and pervious surfaces, we are able to reduce CO2 in the air, allowing for cooler temperatures and greater human comfort.
Actions:
1. Establish building codes for future developments to increase refectivity of roofs (cool roofs)
2. Subsidi e costs of refective shingles for home owners
3. Develop neighborhood tree canopy plans through partnerships with Greening of Detroit and other community-based organizations
4. Promote pervious driveway surfaces throughout the city
5. Promote rain barrel usage in residential areas for outdoor watering purposes
6. Remove unused impervious surfaces on former industrial sites.
Potential Indicators:
• umber of residences ith refective shingles
• Number of trees planted
• Number of driveways changed to pervious surfacing
• Amount reduction of storm water
• Removal of impervious - percent impervious
Goal: Promote alternative uses for failing structures
Strategy: Decrease the amount of abandoned failing structures to increase public safety, community involvement and prepare for dense, sustainable living in the future.
Actions:
1. Deconstruct unstable structures
2. Incentivize community involvement through neighborhood community development grants
3. Establish protocol for cleaning site after building removal
Indicator:
• Number of buildings deconstructed
• Number of buildings redeveloped
• Number of neighborhood proposals for developments
A lease that incorporates ecologically sustainable development principles to ensure that the use and operation of a building minimizes the impact on the environment.
A roof ith refective hite or light-colored surface off of which sunlight will bounce. A cool roof also has high emissivity, which means it easily releases heat.
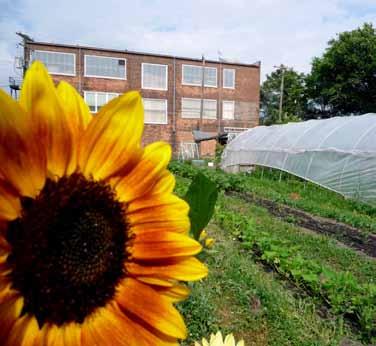
Source: By jessicareeder
Goal: Establish future neighborhood development as compact, effcient, and community based
Strategy: Establish new policies and rezone neighborhoods for mixed-use residences and compact design.
Through the development of compact community development, we are able to reduce GHG emissions by reducing vehicle dependency and energy consumption. By increasing density we are able to improve public safety, promote sustainable living and develop community initiatives.
Actions:
1. Working with neighborhood leaders and cityoffcials and determine areas to be rezoned for mixed use and compact development
2. Develop incentives for developers to build mixed use structures
3. Develop neighborhood infll strategies to maximize livability
Indicators:
• Number of new projects with neighborhoods
• Number of empty housing units in neighborhood
Greening of Detroit’s mission is to guide and inspire others to create a ‘greener’ Detroit through planting and educational programs environmental leadership, advocacy, and by building community capacity.
Website: www.greeningofdetroit.com
Warming Training Center
WAR Training Center is a non-proft organization that promotes the development of resources effcient, affordable, healthy homes and communities through education, training, and technical assistance. WARM’s services include: education, technical assistance, green jobs training, and resources.
Website: www.warmtraining.org
The DTE Energy website offers many resources and tips for reducing energy in residences along with information on rebates for energy saving appliances. For those eligible, DTE offers home energy consultations free of charge. This includes installing fuorescent light bulbs, atersaving faucets and water heater pipe wrap.
Website: www.DTEEnergy.com
Creating healthy homes in Detroit through four main programs. Healthy Homes Detroit addresses asthma, lead, and home safety issues through products, education, and repairs. The Lead Safe Homes Program abates lead hazards from homes in Detroit. Lead Talk educates on lead poisoning prevention, and targets families whose children have low to mid lead levels. The Education and Outreach program works with health fairs, Head Starts, and schools to bring information and resources about lead poisoning to both parents and children.
Website: http://clearcorpsdetroit.org/
Climate Change Youth Guide to Action.
A resource guide for youth to take action in climate change.
Website: www.climate.takingitglobal.org
Free program that introduces climate change to k-8 students and is run by parental volunteers over a 2 month period for a total of 12-16 hours.
Website: www.cooltheearth.org
A pledge for youth to be dedicated to climate change and have their actions in home, school, community and country refect it.
Website: www.thepeoplespeak.org/activities/ youth-leadership-summit/youthclimatepledge. html
The plan discusses goals and strategies for engaging youth. It includes many programs initiated but also the Verde Youth Ambassador Program, after school enrichment classes, and the Green Jobs Corps. As the city itself has a population of approximately 70,000 people, many of the initiatives are community based programs.
Website: http://www.redwoodcity.org/manager/ initiatives/climate%20protection/Verde/Final%20 CCAP%20Documents/CCAP_Final_3-25-10.pdf
This coalition helped to write and pass some of the boldest plans in the country and had unprecedented community participation. It has shown how youth took a role in community meetings, including dancing and acting to promote their message.
Website: http://ellabakercenter.org/toolkitcreate-climate-action-in-your-city


The effects of climate change will have direct implications for how Detroit’s natural systems function, and how we choose to manage them. Increased temperatures and changing precipitation patterns are two elements that are consistently identifed by Great Lakes climate scientists.1 Even with this knowledge, some actions can be taken that will immediately help improve the functioning of our natural systems. These actions should seek to mitigate emission totals and increase the adaptive capacity of city environments. Finally, it will be important to forge collaborative relationships among residents, businesses, and organizations to track progress and build momentum.
oth the heat and food vulnerability assessments have direct impacts for the Parks, Public Space, and Water Infrastructure Work Group, which should consider the following:
• How climate change impacts the quantity and quality of Detroit’s natural resource systems
• How Detroit’s natural resource systems can be utilized to combat the vulnerabilities that arise due to climate change
While Detroit may face many challenges from climate change, the city also is uniquely poised to increase its resiliency. Abundant open space and largely vacant areas can be assets to be used to mitigate climate and its effects. Taking an expansive view of the workgroup, large open spaces in the city should be incorporated into the larger parks and public space picture.
To complete the workgroup tasks as outlined by the DCAC Workgroup Guide, the following approach should inform and guide the process.
1. Build understanding: Continue to identify how climate change is impacting Detroit’s natural systems, especially noting the spatial patterns that emerge.
2. Focus on mitigation and adaptation: Mitigation strategies are often easier to ustify fnancially, and have built-in adaptation benefts ho ever, this orkgroup is especially suited to pursue aggressive adaptation-related goals and strategies.
3. Build collaborative relationships: Existing data gathering and outreach efforts can help maximize the workgroup’s effectiveness. Residents, businesses and organizations should be involved and help to implement strategies. Additionally, DCAC can be more productive when workgroups come together around a common issue.
4. Focus on “no regret” actions in the short term: Certain actions ill be benefcial regardless of the level of change that Detroit will eventually experience. Similarly, actions that have cross-cutting benefts ith other workgroups, and should be higher priority. Long-term actions and strategies should be periodically reevaluated as climate impacts become better understood.
This report identifes fve goals, covering fve topic areas concerning Detroit’s parks, public space, and water infrastructure. Subsequently, this report provides a mitigation and adaptation rationale for each goal, as well as some potential strategies, and indicators that might be used to measure progress toward the goal.
1. Maximize the urban tree canopy, with special consideration for urban heat islands and changing precipitation patterns.
2. inimi e Combined Se er verfo CS events and food insurance claims.
3. Encourage production of local agriculture on publicly owned land as well as on vacant open space within existing neighborhoods.
4. Ensure an adequate water supply for city residents and services.
5. Expand access to Detroit’s parks, public space and water resources.
This is by no means an exhaustive list of orkgroup goals, but represents fve areas that are especially well-suited given Detroit’s characteristics and anticipated climate impacts.
1. Maximize the urban tree canopy, with special consideration for urban heat islands and changing precipitation patterns.
From the mitigation perspective, trees take up CO2. Which lessens the city’s overall emissions. Trees also play an important adaptive role through the provision of shade. Trees signifcantly lessen the urban heat island HI effect, and this same canopy also intercepts rainwater, reducing the amount of runoff.2
For trees to have the greatest mitigating effect on carbon emissions, strategies should maximize coverage. The organization American Forests recommends cities achieve a 40% urban forest cover. Detroit is currently at about 31% canopy cover, and lost about 3% cover between 2005 and 2009.3 The DCAC should prioritize increasing tree canopy percentage. Some potential locations for increasing this percentage ere identifed through the Detroit Works Project.4 These carbon forests and industrial buffers concentrate trees around high ays and industry in order to absorb CO2 and other air pollutants. In the long term, stakeholders should consider programs that incentivize residents and business owners to plant and maintain trees. Trees are especially effective along buildings’ southern faces, which receive the most direct sunlight, and would therefore have the most impact on cooling costs and energy use.5
HI is defned as increased surface and air temperatures in urban areas relative to surrounding suburban and exurban areas. UHI patterns vary by region, occur in more dispersed pattern than once thought, may increase or decrease over time, and are most problematic during warm weather.
The layer of leaves, branches and stems of trees that cover the ground when viewed from above. The urban forest includes trees on both public and private land.
An impervious surface is any surface that does not allow water to soak into the ground. When water from rain and snowmelt washes off a piece of property, it fo s into a storm drain system and eventually into the Huron River. Impervious or hard surfaces on the property such as roofs, driveways, and patios, do not absorb the water and contribute to stormwater runoff.
Adaptation strategies should use trees to alleviate urban heat island and stormwater effects caused by climate change. Increasing Detroit’s urban canopy ill provide benefts, ho ever, certain locations may warrant prioritization. The workgroup should likely consider the following characteristics when prioritizing, as highlighted in this report’s Vulnerability Assessment:
• Land Use Type: Distinguishing between residential, commercial, industrial, and institutional land uses
• Impervious Surface Cover: A factor that contributes to UHI, the workgroup could use trees to lessen the heat impacts in especially susceptible areas
• Demographic Characteristics of Concern: Elderly and youth populations, poverty, education levels, housing without air-conditioning, chronic health problems
• Current Park Locations: Parks themselves could be targets for
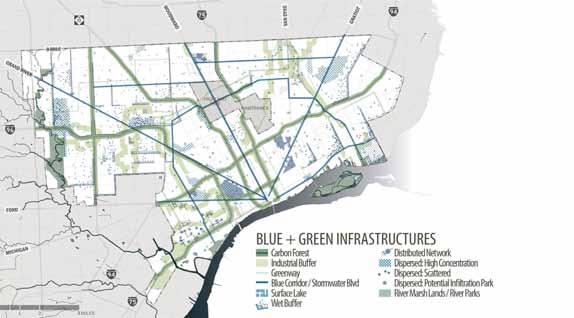
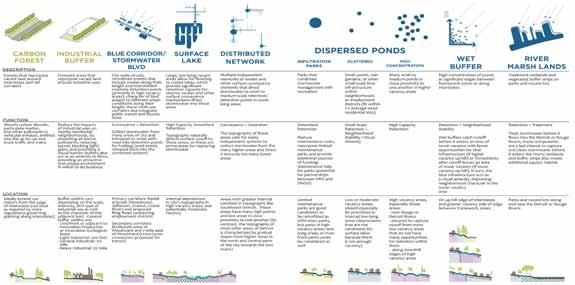
The Detroit Works ro ect has identifed a number of blue-green infrastructure strategies and potential locations for these projects throughout the city. Source: City Systems Detroit Works ro ect: Long-term planning. http: detroitworksproject.com/planning/strategies/city-systems/
increased tree cover, in addition to the streets within a certain radius, for example a tenth-mile
• Se er District: There may be foodprone areas or overburdened sewer districts that ould beneft from increased stormwater retention
Additionally, changing climates will also result in changing species composition, as many trees expand their ranges north ard. With natural systems in fux, Detroit will want to position their resources to be well equipped for this change. Some considerations include:
• Preferred Species List: Certain trees may do better in this region in the future, these species could be promoted.
• Maintaining a Level of Diversity: Systems in fux can be especially vulnerable to invasive species and diseases. Ensuring a diversity of plant life will help to minimize negative impacts should a certain species fall into decline.
• Urban Tree Canopy percentage to go further: public vs. private cover, cover by species, cover by land use type, canopy
coverage in especially highly impervious/ high heat areas (Extent/Minimizing vulnerability/Access)
• Number of Trees Planted per Year (Extent)
• Number of Citizen Volunteer Pruners (Maintenance/Community Engagement)
2. Minimize Combined Sewer Overfow (CSO) events and food insurance claims.
Detroit has a combined sewer system, sending both wastewater and stormwater through the same retention and processing facilities. During periods of intensive rainfall the system often reaches its full capacity, and the city is forced to release untreated water into the Rouge and Detroit Rivers. During 2011, Detroit discharged around 7 billion gallons of untreated wastewater through outfalls located on the rivers, and while 2011 was a particularly wet year, it may be representative of future conditions.6 The Detroit Water and Sewerage Department (DWSD) has embarked on an extensive capital improvements plan to address the shortcomings of the system and expand its capacity, which have certainly helped to reduce Combined Se er verfo (CSO) discharges in the last two decades.7 Ho ever, the system needs to fnd other means to address the precipitation volumes that come with intense storms.
Mitigation
For mitigation reasons the workgroup will want to examine how to minimize the volume of water that must be processed by wastewater treatment plants. This will allow the DWSD to save energy. The workgroup should then prioritize strategies that lessen the volumes of stormwater runoff, dealing with rainwater on-site, rather than allowing it to contribute additional volume to the system. Other cities have focused on strategies that minimize the amount of paved, impervious surface, and instead provide areas where rain ater can collect and naturally flter back into groundwater.
Used, dirty water that goes through the drains and toilets of homes, businesses, industry, and institutions; also known as sewage.
Water from rain, sno , sleet, hail, that fo s across the ground and pavement or when snow and ice melt.
The point, location, or structure where wastewater or drainage discharges from a sewer, drain, or other conduit.
A sewer system discharge (and major pollution concern) containing not only stormwater but also untreated human and industrial waste, toxic materials, and debris.
Secondly, Detroit currently incinerates its sludge waste in old, outdated incinerators that contribute to poor air quality and produce GHGs. The workgroup should investigate utilizing the waste as a source of energy, or turning the waste into an input for larger scale composting operations. Also, the workgroup should investigate increased pollution controls for the current incinerator.
Adaptation strategies would seek to use existing open space to alleviate the stormwater runoff burden from climate change. Discharge events are undesirable from public health and riverfront development perspectives. Some factors to consider when looking to minimize impervious surface cover and maximize the functional effciency of the storm ater system may include:
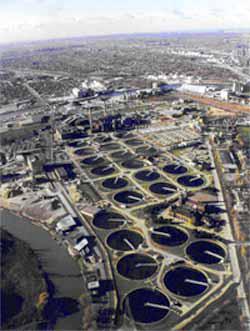
In general, a facility designed to treat wastewater before discharging back into a water body. The Detroit facility is the largest single-site wastewater treatment facilities in the United States. Originally, it was only intended to provide primary treatment, which screens out solids and chlorinates the wastewater. However, the plant was upgraded in the 1960s to provide secondary treatment, which is a more rigorous screening and treatment process that disinfects biodegradable solids, producing an even cleaner product. Currently, the plant serves about 35% of Michigan’s total population, with a service area of 946 square miles, extending far beyond just Detroit’s boundary.8
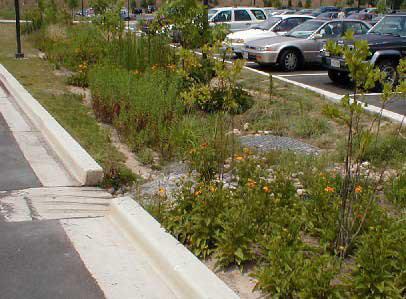
An example of Low Impact Design, which incorporates bioretention swales into otherwise impervious parking lots. Source: http://www.water-research.net/images/ biorentionparking.jpg
An approach to land development (or redevelopment) that works with nature to manage stormwater as close to its source as possible. LID employs principles such as preserving and recreating natural landscape features, minimizing effective imperviousness to create functional and appealing site drainage that treat stormwater as a resource rather than a waste product. (Also Low Impact Development.)
• Spatial, demographic, and geographic characteristics—identify patterns within the city, and seek to promote a healthy balance of impervious and pervious surfaces that is consistent ith underlying food and population characteristics. Similarly, especially food-prone areas may demand prioritized attention, to develop strategies that alleviate some of this potential.
• New development: whether it is new construction or development on an existing facility, the city may look to incorporate recommended or minimum Low Impact Design guidelines into project development.
• Concentrations of impervious surfaces: there may be some facilities that have a large impervious surface footprint, and are thus contributing more heavily to the stormwater burden. Programs could incentivize these users to minimize the impervious cover on their property.
• Historic hydrologic fo s: While Detroit had a number of creeks historically, these have largely been incorporated into the sewer drainage system of pipes and culverts. Daylighting is a technique that reverses this process, and subsequently converts a large portion of the land immediately adjacent to the creek back to natural land cover, helping to minimize the amount of total runoff.
• umber of Combined Se er verfo (CSO) events or volume discharged
• Number of Low Impact Design projects
• Incidence of fooding or food-insurance claims
• Percent or square footage of impervious surface removed or converted
3. Encourage production of local agriculture on publicly owned land as well as on vacant open space within existing neighborhoods.
Although estimates vary, and have at times been exaggerated, there is a reasonable assumption that there are around 20 square miles of vacant land in Detroit.9 This open space resource can be apportioned in a variety of ways, and local agriculture could represent one potential use that also serves to address some climate change planning concerns.
There are two relevant factors that connect the food we eat to carbon emissions. First, the energy expended in the transport of food from grower to table is substantial and can be lessened by connecting the city to a local agriculture base. However, research shows that transportation only represents about 11% of total associated emissions.10 The remainder is attributed to production itself, with red meat and dairy being more carbon-intensive than grains, chicken, eggs, fsh, and vegetables.11 Where possible, promotion of certain dietary alternatives can result in both fewer carbon emissions and a healthier population.
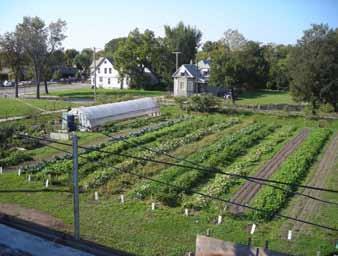
The impacts of climate change will affect the world’s food producers, and periodic food shortages and price increases may become more frequent. Michigan has a very suitable agricultural climate, and Detroit in particular has a suitable amount of land in which to cultivate crops. The city can use this resource base as a way to insulate itself from the changing pressures of a global market.
Strategies to consider may look to:
• Expand the level of local production: Identify suitable areas in the city for agriculture and create networks of support for local growers
• Connect growers to healthy compost and soil, seed suppliers, fnding unaddressed niches in the market, and local markets, churches, and institutions, and fnally to consumers, making sure residents have access to locally produced food.
• Amend city policies and ordinances to allow for a wider range of agricultural activity, perhaps placing a limit on carbon-intensive practices such as raising livestock for meat or dairy
• Local grower representation at farmer’s markets (Extent of industry)
• Acreage dedicated to local agriculture or tonnage of food produced (Extent of industry)
• Number of local food-to-school or –business, etc. programs (Connectivity)
• Number of local markets or duration of time residents have access within new council districts, or census tracts (Access/Connectivity)
4. Ensure an adequate water supply for city residents and services.
Ensuring the availability of a clean and plentiful water supply will become more diffcult facing climate change. Ho ever, proximity to the Great Lakes benefts Detroit, and there is no danger from sea level rise. However, a recent report from the U.S. Army Corps of Engineers indicates that the Great Lakes system has the potential to hit a record low depth this year.12 The implications of water level change could extend beyond municipal water users, also impacting ship ports and navigation, and property owners
along the river and lakeshore, where newly exposed vegetation could lead to increased property maintenance or undesirable decaying plant material.
Energy inputs are required at several important stages in the life cycle of water. Initially, water must be pumped from the source location to the treatment facility. Once there, these facilities use energy to pump water through the system and treat it. It then requires energy to transport the water to the end users, who also use energy in heating, cooling, fltering, pressuri ing, and circulating processes.13 Ineffciencies at any point in the system present opportunities for improvement and a lessening of carbon emissions. Some areas that the workgroup may want to explore further include:

• Source water quality: Detroit discharges treated wastewater, and has sewer outfalls, along the Detroit River, one of the water source intakes. To ensure higher quality water for the entire system, however, a regional approach should be encouraged among all DWSD communities to lessen runoff pollution.
• Distribution effciency: A report on drinking water in Detroit indicated that aging infrastructure in the city costs residents 35 billion gallons and $23 million each year.14 DWSD initiated a capital improvement plan to address these concerns, and the workgroup may want to develop strategies and partnerships that help the city achieve their goals identifed in the plan.
• End user conservation: Crossing into the realm of the Homes and Neighborhoods orkgroup, effciency can be promoted through appliance and technological fxes, but this workgroup could also look to promote conservation behaviors among residents and businesses.
Increased variability in precipitation and potentially lower lake levels could negatively impact many users. The workgroup should seek to identify strategies that both identify these user groups and make them better prepared for variable conditions. Some groups that might warrant further exploration include:
• Large quantity non-human users: Whether a parks department or school needs to water a feld, or local agriculture gro ers depend on a fairly high level of water use, drought conditions could impact their ability to maintain their product. Helping these groups maintain reserve water supplies in onsite rain barrels or tanks can help to insulate them from the fuctuations of variable ater supply.
• River/Lake-level dependent users: Shipping, industry, and recreational boat users need to be adequately informed about the potential threats to their activities imposed by lower lake levels. In addition to public awareness, there may be programs or activities that will help make boat facilities better suited to lower water levels. As a second group, property owners along the lake should understand the changes that may occur to their property, what their responsibilities are, and if there are maintenance activities that help or damage the ecological functioning of the river system.
• Per capita water use
• Energy used to treat drinking water
• Percent of Water Conservation outreach programs
• Percent of installed onsite water storage systems, like barrels/tanks
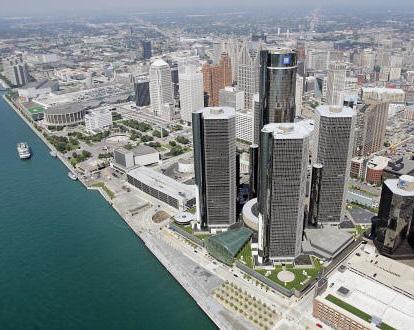
Source: eff Haynes A Getty Images via http: cbsdetroit.fles. wordpress.com/2011/05/detroit-riverfront.jpg
5. Expand access to Detroit’s parks, public space and water resources.
Detroit has a huge asset in its abundant open space and riverfront, however access to these resources varies throughout the city. There are several functioning greenways with plans to increase connectivity throughout the city. Likewise, Detroit has taken steps to reclaim its riverfront, developing it for recreational and pedestrian access. The workgroup should seek ways to support these efforts.
Mitigation
Improving access and connectivity among parks and open space areas of the city will help to reduce vehicle miles. A natural ally in this effort will be the transportation workgroup.
Adaptation
Having a large and well-connected park and open space system will help residents fnd respite on extreme heat days. In this manner, the workgroup can seek to increase canopy cover along greenways and trails to maximize their adaptive potential.
Indicators to Track Progress
• Miles of trail (total and/or connected)
• Tree canopy cover along trails and riverfront
Detroit Works Project: Blue-Green Infrastructure Overview (http://detroitworksproject.com/planning/ strategies/city-systems/)
Detroit Water and Sewerage District: Wastewater Master Plan (http://www.dwsd.org/pages_n/system_ plans.html)
EPA: Climate Change Vulnerability Assessments: Four Case Studies of Water Utility Practices (http://cfpub.epa.gov/ncea/global/ recordisplay.cfm?deid=233808)
EPA: Green Infrastructure (http://water.epa.gov/infrastructure/ greeninfrastructure/index.cfm)
EPA: National Water Program 2012 Strategy: Response to Climate Change (Public Draft) (http://water.epa.gov/scitech/ climatechange/2012-National-WaterProgram-Strategy.cfm)
EPA: A Screening Assessment of the Potential Impacts of Climate Change on Combined Se er verfo CS itigation in the Great Lakes and New England Regions (http://cfpub.epa.gov/ncea/cfm/recordisplay. cfm?deid=188306)
Center for Clean Air Policy: The Value of Green Infrastructure for Urban Climate Adaptation (http://ccap.org/resource/the-value-of-greeninfrastructure-for-urban-climate-adaptation/)
SEMCOG:Low Impact Development Manual for Michigan (http://www.semcog.org/ lowimpactdevelopment.aspx)
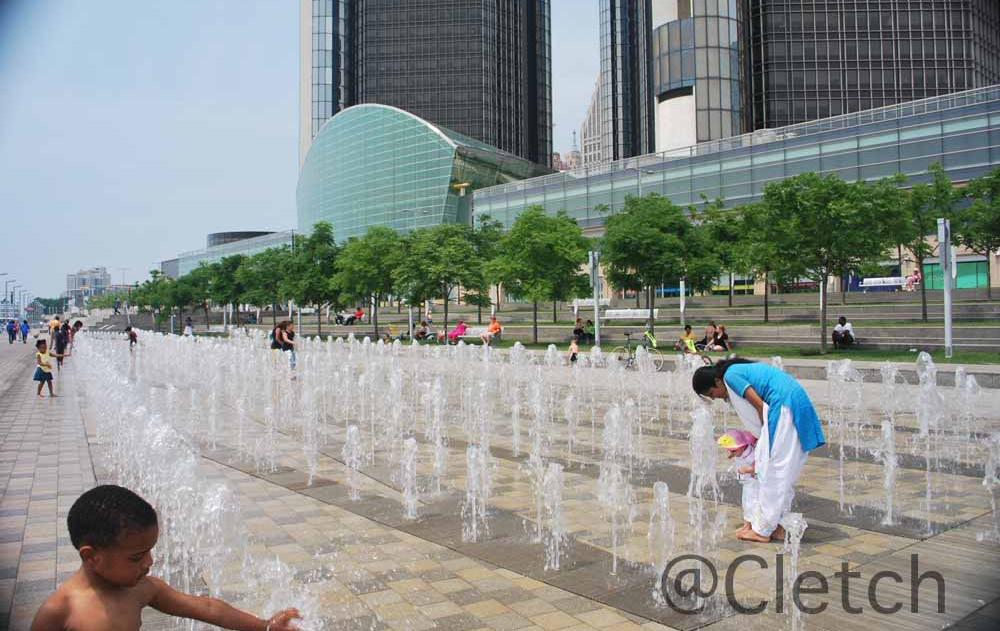
Source: By Cletch
1. “The Potential Impacts of Climate Change on Detroit, ichigan. Great Lakes Integrated Sciences + Assessments (GLISA). Draft from 27 November 2012.
2. “Forests, Health and Climate Change: Urban Green Spaces, Forests for Cooler Cities and Healthier eople. European Environment Agency. December 2011).
3. GloVis Landsat 7 ETM+, Tree Canopy Cover; o ak, David ., and E. . Greenfeld. Tree and impervious cover change in .S. cities. rban Forestry and Urban Greening 11(2012), 21-30.
4. City Systems Detroit Works ro ect: Long-term planning. http://detroitworksproject.com/planning/ strategies/city-systems/
5. McPherson, E. Gregory, D. J. Nowak, and R. A. Rowntree. “Chicago’s Urban Forest Ecosystem: Results of the Chicago Urban Forest Climate ro ect. .S. Department of Agriculture, orest Service, Northeastern Forest Experiment Station. (June 1994).
6. Lyandres, Olga, and L. C. Welch. “Reducing Combined Se er verfo s in the Great Lakes: Why Investing in Infrastructure is Critical to Improving Water uality. Alliance for the Great Lakes. (19 June 2012).
7. Tucker, Young, Jackson, Tull Inc. “Wastewater Master Plan: Capital Improvement Program. ro ect o. CS- . Detroit Water and Se erage Department. (September 2003). http://www.dwsd. org/downloads_n/about_dwsd/masterplan_ wastewater/volume4/Capital_Improvement_ Program.pdf ; “Detroit River-Western Lake Erie
asin Indicator ro ect. .S. Environmental rotection Agency. (26 August 2009). http://www.epa.gov/med/ grosseile_site/indicators/cso.html
8. DWSD
9. Davidson, Kate. “Detroit has tons of vacant land. ut forty s uare miles ichigan Radio. April 2012). http://www.michiganradio.org/post/detroithas-tons-vacant-land-forty-square-miles
10. Wakeland, Wayne, S. Cholette, and K. Venkat. “Food transportation issues and reducing carbon footprint. Chapter in Green Technologies in ood Production and Processing. J.I. Boye and Y. Arcand (eds.) (10 January 2012) pp. 211-236. http://www. cleanmetrics.com/pages/Ch9_0923.pdf
11. Whitty, ulia. ood iles our Carbon ootprint. Mother Jones. (21 April 2008). http://www. motherjones.com/blue-marble/2008/04/food-milesyour-carbon-footprint
12. Lawrence, Eric D. “Report: Great Lakes water levels may firt ith record lo s. Detroit ree ress. (6 September 2012). http://www.freep.com/ article/20120906/NEWS05/309060193/ReportGreat-Lakes- ater-levels-may-firt- ith-record-lo s
13. Water-Energy Connection. .S. Environmental Protection Agency. (15 December 2012). http:// www.epa.gov/region9/waterinfrastructure/ waterenergy.html
14. “What’s on tap? Grading drinking water in U.S. cities. atural Resources Defense Council. une 2003). pp. 131-138. http://www.nrdc.org/water/ drinking/uscities/pdf/detroit.pdf

A well-managed waste stream can generate economic development and improve the quality of life and livability of a city. Moreover, when managed a certain way, a solid aste stream can have a signifcant mitigation effect on GHGs—lowering GHGs in a direct and indirect manner.
Adaptation efforts will not affect the Solid Waste workgroup, as climate change does not increase Detroit’s vulnerability to solid waste issues. After all, the garbage is still picked up in warmer cities like Dallas, San Antonio, and Oklahoma City. This group will focus on mitigation and has a diffcult task ahead, as Detroit has not kept up with the latest trends in waste management. The city is home to the nation’s largest waste-toenergy incinerator, which a produces GHGs, decreases air quality, and places a negative incentive on the implementation of citywide recycling programs.1 Currently Detroit does not have a comprehensive curbside recycling program. Curbside recycling is conducted in three neighborhoods and dropoff stations run by community organizations such as Recycle Here are available throughout the city.
In reforming its solid waste practices, Detroit faces three key challenges. First, the fnancial position of the city makes any capital-intensive improvements a diffcult proposition. Second, the city’s continued population loss and lack of density make curbside pick-up for trash or recycling too expensive in certain neighborhoods. Finally, while many cities use enforcement programs and fnes to augment their recycling programs, a similar program in Detroit would be ineffective given the city’s high unemployment and poverty rates, and would place an unfair burden on the city’s most vulnerable residents. On the positive side, because Detroit is so far behind the rest of the feld, it also has the opportunity to learn from and avoid the mistakes of other cities.
Solid waste has two impacts on environmental mitigation—direct and indirect. Detroit’s incinerator is an example of a direct impact. Trash is trucked in and used as fuel to produce energy. Burning fuel for the trucks and burning trash in the incinerator produces GHGs. In sum, direct impacts are GHGs produced during the waste collection process. The solid waste stream has the opportunity to indirectly mitigate greenhouse gasses as well. For example, when paper is recycled, less energy and GHG’s are produced compared to manufacturing new paper, and less trees are cut down, augmenting the carbon cycle.2 With this multifaceted impact in mind, sound solid waste management can have a comprehensive effect on a society’s mitigation efforts. Finally, the best solid waste is the waste that never makes it into the waste stream in the frst place. When Detroiters compost at home, the city does not have to send trucks out to pick up bags of yard waste. All of these efforts combined, large or small, can mitigate GHGs.
Exactly how a solid waste strategy affects the environment is complex and diffcult to uantify, as each solution creates their own impacts, and can create its own environmental impacts beyond the production of GHGs. For example, hile landflls may produce less heavy metal air pollution than incinerators, landflls can emit methane gases, contaminate water supplies, and trucks to expend fuel when heading to and from the landfll. Incinerators, on the other hand, may generate energy, but their contributions to poor air quality and emissions of heavy metals can cast a pall over nearby neighborhoods, and their need for trash to burn can de-incentivize recycling programs. Consequently, it is important to consider each facet of solid waste in a broad lens to ensure that all issues are considered.
The DCAC should consider citywide, “top do n reforms in con unction ith bottom up grassroots, community based efforts to successfully mitigate the GHG effects of Detroit’s solid waste stream. Broadly, the suggested goals are to decrease GHGs produced directly by the waste stream during the collection and disposal process, and increase the opportunity for indirect mitigation effects through recycling, composting, education, and conservation efforts. Also, the DCAC should consider the economic development effects of recycling with an emphasis on creating jobs.
The Incinerator
Key Indicator: Percentage of City of Detroit waste incinerated
All discussions of solid waste policy in Detroit begin with the Greater Detroit Resource Recovery Authority’s incinerator. It is the largest waste-to-energy incinerator in the United States, and over twenty years after its construction, it remains controversial. For incinerator advocates, the facility is good the environment— itsaves landfll space, recycles heavy metals, and produces steam for the Downtown Detroit steam loop. Critics are quick to point out the high amount of carcinogens and heavy metals emitted through the facility’s smoke stack. The facility is also criticized for its high amount of CO2e emissions (over 414,064 metric tons of CO2e gasses for the year 2010 alone), and note that energy generated by burning trash is ineffcient compared to the energy saved by recycling. 3
Critics argue that the incinerator’s demand for fuel deemphasizes the need to recycle, and see a close connection to the city’s poor recycling efforts and the presence of the incinerator. Because the City of Detroit does not own

the facility, it cannot close the incinerator directly. However, if the City of Detroit reduces or eliminates its waste contribution, it could make operating the incinerator fnancially diffcult, and eventually force its owners to close the facility.
Key Indicators:Percentage of waste recycled; Percentage of city with curbside recycling;Revenue generated from sold recycled materials
Recycling in Detroit is in its nascent stages—just three neighborhoods offer curbside recycling. This needs to change. Today, many cities make it easy for residents to recycle. Instead of placing recyclables in a small bin that is sorted at the curb by a recycling truck operator, cities now are switching to a single-stream recycling policy. All recyclables (newspapers, soup cans, shampoo bottles, etc.) are placed in one large can, usually the same size as a trash can, and collected on the same day as the trash—then sorted at a large, central facility. Recycling efforts are also accompanied
by a concerted education effort, and sometimes reward programs. Programs like Recyclebank allow residents to accumulate points that are redeemed for coupons, or can be donated to charities for participating in recycling efforts.4
Some cites, such as New York, also levy fnes on residents that do not comply ith regulations, but given Detroit’s current state of affairs, this may not be a wise course of action. Other cities operate a “pay as you thro scheme, here residents pay a fee for trash collection, while recycling and composting is free, which encourages residents to recycle. Because Detroit already charges a fee for trash pick-up, the city could easily recalibrate the fee in a manner that encourages recycling— charging more for trash cans and less for recycle bins.
Key Indicators: Percentage of yard waste composted
One of the largest portions of the waste stream is actually yard waste—an estimated 13.4% nationwide.5 Detroit does collect yard waste separately from the rest of waste stream, and composts this yard waste through a contractor. This compost yield should be made available to Detroit residents and Detroit’s growing urban gardening movement. A simple education or marketing plan could help move this program forward. This is a positive step, but Detroit can and should do more to prevent yard waste from reaching the regular waste stream.
Outreach and education efforts, and measures that simplify yard waste collection, such as providing a separate different color waste can for residential yard waste can encourage residents to keep yard waste out of the normal waste stream. With Detroit’s single-family home build-out pattern,
stakeholders could easily develop an at home compost program. This is a real opportunity for Detroit to prevent yard waste from entering the aste stream in the frst place, and reduce waste collection costs for the long term. This also allo s the community to buy in to the community’s waste management program.
When analyzing Detroit’s solid waste stream, the DCAC should keep these indicators in mind:
• Pounds of solid waste per capita
• Percentage of waste collected recycled
• Percentage of waste collected incinerator or landflled
• Percentage of yard waste composted
• Revenue generated from sold recycled materials
1. Curt Guyette, “Looking for Green Horizons: In the shado of America’s largest aste incinerator, Metrotimes, May 28, 2008.
2. Alejandro Villanueva, Henrik Wenzel, “Paper waste— Recycling, incineration or landflling A revie of existing life cycle assessments, Waste anagement , no. (2007): 29-46
3. 2010 Greenhouse Gas Emissions from Large Facilities (Environmental Protection Agency, 2010), accessed from www. http://ghgdata.epa.gov/
4. See https://www.recyclebank.com/ for more details.
5. Rania Ghosn and El Hadi Jazairy, Research on the City: Geographies of Trash (University of Michigan, 2012).
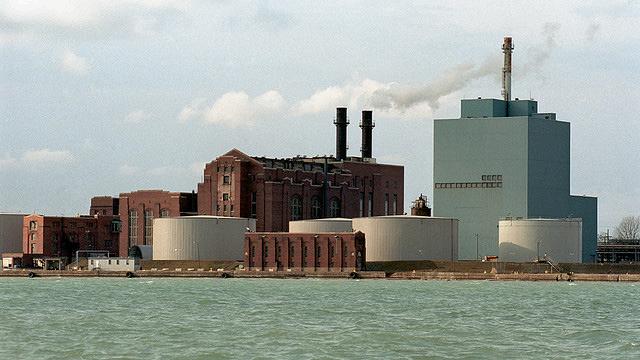
Source: Voice of Detroit
For the Solid Waste group, the best resources are the plans and actions of other cities.
One of the most comprehensive waste management policies belongs to the City of Edmonton, Alberta, Canada. Edmonton takes a comprehensive approach to waste management, recycling and composting a high percentage of its waste. The goal of their operation is to recover as much waste as possible through composting and recycling. Edmonton also provides recycling opportunities for more challenging materials such as electronic waste, operating drop off stations throughout the city.
See http://www.edmonton.ca/for_residents/ garbage_recycling/edmonton-wastemanagement-centre.aspx for details.
Despite the logistical challenges of high-rise buildings and high population density, the City of New York operates a comprehensive recycling program. New York also has a high population of renters, much like Detroit, and requires landlords to provide recycling space and
containers, and requires residents to keep recyclebles out of the standard garbage.
See http://www.nyc.gov/html/nycwasteless/ html/recycling/recycle_what.shtml for more information.
The Village of Western Springs, Illinois, operates a simple yet effective pay-as-you throw program. Residents pay a set fee for trash cans, and can trade up for t o or three if necessary. Also, if residents do not want to pay for an extra can year round, but have a week where they produce extra trash, they can place a pre-paid sticker on their trash bags, and the trash will be picked up. If trash is in excess of the pre-paid amount, residents are retroactively charged a fee. Recycling and yard waste pick-up is free.
See http://www.wsprings.com/living/ recycling.asp for more information.

Transportation is a critical system ithin Detroit that has signifcant implications for both climate mitigation and adaptation. Extreme weather events disrupt transportation systems as a result of fooding, do ned po er lines, power outages and icing on the roads. Consequently, extreme weather events make it diffcult for local economies to function properly and emergency response vehicles to service the city in times of need.
Vulnerability in terms of transportation is related to both the physical infrastructure system and the ability of residents in Detroit to access transportation modes. The physical infrastructure is vulnerable to fooding, increased free e-tha days as ell as the increased heat. Though the social aspects of transportation vulnerability are not directly related to climate change they are related to how residents are able to access the resources they need to cope with climate change. For example, an extreme weather event can make even the shortest walking or biking trip inhospitable.
Opportunities to mitigate the effects of climate change include diversifying transportation. This diversifcation requires lessening Detroit’s dependence on carbon-based modes such as gas and diesel consuming personal vehicles, trucks and public buses. More sustainable modes of transportation offer safe and comfortable alternatives to personal vehicle use. A few options of sustainable transportation include improved public transit and reliability, improved bicycle and
pedestrian infrastructure and neighborhoodbased car sharing. In addition, this diversity in transportation modes can help Detroiters lessen the economic burden associated with rising oil prices.
For the purposes of the DCAC, sustainable transportation can be defned as transportation options that decrease dependence on personal vehicle transportation and reduce the use of carbon-based fuels. The key to the DCAC’s future success relies on collaborating with existing sustainable transportation and community efforts across the city. This collaboration could become the foundation for the short-term efforts for promoting sustainable transportation. In addition to the short-term opportunities, the DCAC should simultaneously advocate for long-term sustainable transportation solutions that address land-use and economic challenges within the city’s fabric.
Many opportunities exist for transportation and climate adaptation in Detroit. Major opportunities exist with regard to collaborating with current neighborhood planning efforts. In addition, catalyzing and promoting Transit Oriented Development (TOD) is an exciting opportunity for the community; pursuing TOD can be done through a variety of methods discussed further on page 86. Lastly, many progressive climate action plans, such as The City of Grand Rapids and their Green Grand Rapids report, couple transportation and landuse planning. Though this integrated approach re uires ma or public sector infuence, the DCAC, as a long-term goal, can leverage existing community relationships in order to educate and advocate for an integrated approach.
For Detroit, developing a sustainable transportation system will be an ongoing challenge, due to the scale of the city, low population density across some areas, the strong status quo of the automobile and lack of regional participation in pubic transit.
As the DCAC looks toward the future and works toward developing a community based grass roots climate action plan, some primary challenges for the long and short term include:
1. Accessibility, connectivity and diversity of transit options
2. Reliability of existing transit options
3. Safety and comfort of non-motorized transportation
4. Air quality concerns for non-motorized transportation users
5. Automobile dependency
6. Volatile oil prices in the long-run
The DCAC’s priority for short-term development of sustainable transportation goals in Detroit should connect with existing efforts. This collaboration reduces any potential duplication of existing programs or services such as working with existing Safe Routes to Schools initiatives or TOD advocacy. Simultaneously the DCAC can identify and promote long-term sustainable transportation goals based on community needs and the vulnerability assessment; long-term efforts may require development of additional initiatives, programs and capital for successful implementation.
Transportation options that decrease dependence on personal vehicle transportation and reduce the use of carbon-based fuels.
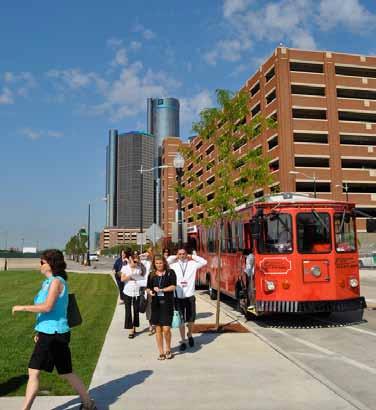
The following are short-term priorities for transportation advocates in Detroit:
1. Improve reliability of existing transit options in Detroit
2. Improve safety and comfort of nonmotorized transportation
3. Identify opportunities for synergies and improvements
The following are long-term priorities for transportation advocates in Detroit:
1. Improve accessibility, connectivity and diversity of transit options in Detroit
2. Address air quality issues for nonmotorized transportation users
3. Promote a culture of sustainable transportation in Detroit
. romote infll development along established transit corridors
CAN HELP DETROITERS LESSEN THE ECONOMIC BURDEN ASSOCIATED WITH RISING OIL PRICES.
The suggested goals and strategies discussed in this section were derived from review and research of other successful climate action plans across the U.S. and Canada. These suggested goals and strategies supplement the aforementioned short-term and long-term priorities. Recognizing the unique position of the DCAC as a community grassroots planning effort, the following goals were chosen with consideration for Detroit’s physical and social structures:
1. Decrease vehicle miles traveled (VMT)
2. Increase safety & comfort of non-motorized transportation
3. Increase connectivity, accessibility and ridership (when operational) of the bus rapid transit system
. Increase alternative fuel use in feet vehicles
. Increase effciency of feet vehicles routes
6. Promote TOD
Each goal includes strategies and indicator(s). The strategies help guide stakeholders with regard to the achievement of the aforementioned goals. The indicator(s) gauge progress with regard to each goal by offering measurable data points.
“Moderate and high-density housing, along with complementary public uses, jobs, retail and services, [that] are concentrated in mixed-use developments at strategic points along the regional transit systems. source: eter Calthorpe)
Goal #1: Decrease Vehicle Miles Traveled (VMT)
Strategy: Combine with existing organizational efforts to promote the Woodward Corridor BRT and develop additional multi-modal transit opportunities within the BRT service area.
Strategy: Promote non-motorized transportation opportunities.
The following indicators help monitor reductions in VMT:
1. Decrease per-capita VMT
2. Increase transit ridership
Goal #2: Increase safety and comfort of nonmotorized transportation
Strategy: Combine with existing organizational efforts to identify key nodes of concentration to maximize the impact of physical implementation. Advocate for reduced vehicle speeds on selected thoroughfares, as vehicle speed and pedestrian safety are linked, according to a report on walkability in urban thoroughfares by the Institute of Transportation Engineers.1
The following indicators relate to increasing the safety and comfort of non-motorized transportation:
. Increase foot traffc at key nodes.
2. Increase bicycle use/trips per capita
3. Increase implementation of complete streets in key areas.
4. Increase in the cooperation and implementation of safe routes schools in the City of Detroit.(27 participating schools currently)
5. Increase percentage of children per school that have access to safe routes.
Goal #3: Increase connectivity, accessibility and ridership (when operational) of the bus rapid transit system
Strategy: Support existing organizational efforts to coordinate key nodes of concentration to and improve the connectivity of the bus rapid transit system by improving the multi-modal connectivity.
The following indicator measures increasing productivity and effciency of a bus rapid transit system:
1. Increase ridership
articipating Detroit Safe Route to School rograms
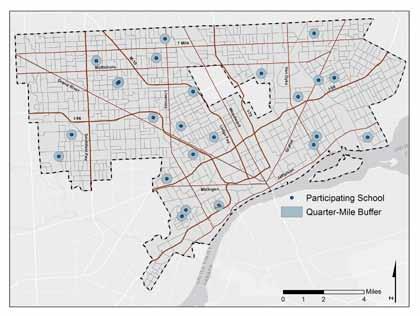
Source: Detroit Safe Routes Participating Schools <http://www.saferoutesinfo.org/> Prepared By: Univiersity of Michigan Detroit Climate Capstone
Goal #4: Increase alternative fuel use in feet vehicles
Strategy: Combine with existing organizational efforts to identify key users of feet vehicles and encourage the conversion of feet vehicles to alternative fuel sources, in addition to developing alternative refueling infrastructure.
The following indicator pertains to increasing the use of alternative fuels within vehicle feets:
. Increase percentage of feet vehicles using alternative fuels.
TRANSPORTATION AND SAFETY CURRENTLY EXIST, SOME ALREADY HAVE ADVOCACY IN DETROIT.
Goal #5: Increase effciency of feet vehicle routes
Strategy: Combine with existing organizational efforts to identify key users of feet vehicles and encourage the optimi ation of feet routes. rovide assistance in route analysis and streamlining routes for maximum effciency.
The following indicator pertains to increasing the effciency of feet vehicle routes:
. Increases effciency in feet vehicle routes. Effciency being measured in fuel gallons consumed/tons of cargo delivered or fuel gallons consumed/ hour of operation.)
Goal #6: Promote Transit Oriented Development (TOD)
Strategy: Combine with existing organizational efforts to identify key nodes of concentration to maximize the impact of physical implementation of TOD. Lobby the city to update zoning for TOD developments and decrease parking requirements for proposed TOD developments. Where applicable, engage landholders to consolidate properties and catalyze developers.
The following indicators pertain to the promotion of transit-oriented development:
1. Increase in TODs in the City of Detroit
2. Increase in areas zoned for TOD
As mentioned several programs and efforts pertaining to sustainable transportation and safety currently exist, some already have advocacy in Detroit. The programs listed below were highlighted because their relationship to transportation, climate change and sustainability. The programs can play an integral role in the strategic implementations of Work Group plans. A couple of the listed programs are established initiatives that have planning implementation funding available through various state and federal sources. Additional information on these programs is provided in the transportation resources list at the end of this section.
Safe Routes to Schools: Safe Routes can be a community-initiated effort to increase the number of students who walk or bicycle to school. As part of this effort the program also addresses safety concerns and initiatives for improving the overall walkability of the routes to schools. To assist in the planning and design of the program and the physical improvements to sidewalks and infrastructure that improve the access to schools federal funding is available and distributed through the state Safe Routes to School Coordinator. Detroit’s regional Coordinator is Linda atrick lpatrick michiganftness.org.
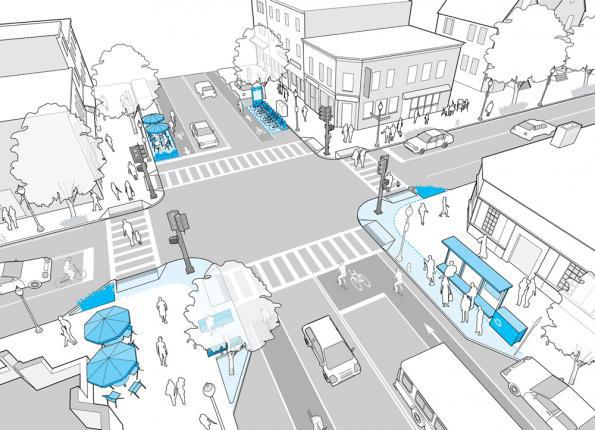
Source: Complete Streets from Toole Design Group
Complete Streets: As defned by Smart Gro th America, “the Complete Street movement aims to develop integrated, connected networks of streets that are safe and accessible for all people, regardless of age, ability, income, ethnicity, or chosen mode of travel. Complete Streets seeks to integrate walking and bicycling into the status quo of the transportation system and provide accessibility to employment opportunities and educational institutions, in addition to giving independence from carbonbased fuels and the economic benefts that can bring. Complete Street policies are encouraged by Michigan legislation and funding sources are available for a variety of programs.
Transit Oriented Development (TOD):
eter Calthorpe a leader in T D defnes it as: “moderate and high-density housing, along with complementary public uses, jobs, retail and services, [that] are concentrated in mixeduse developments at strategic points along the regional transit systems. Interest in T D has already been active in Detroit surrounding the Woodward Corridor planning efforts. The Downtown Detroit Partnership, Detroit Economic Growth Corporation and Midtown Detroit Inc. have formed a partnership that meets monthly to engage TOD planning issues.
Clean Cities: The Clean Cities program is a program developed through the U.S. Department of Energy (DOE). According to DOE Clean Cities is dedicated to “advancing the nation’s economic, environmental and energy security by supporting local actions to reduce petroleum consumption in transportation. The Clean Cities coalition “brings together stakeholders in the public and private sectors to deploy alternative and renewable fuels, idle-reduction measures and fuel economy improvements. unding for these supported initiatives is available and Detroit is already established as apart of the nearly 100 cities within the Clean City network. The Clean Cities Coordinator for Detroit is Matt Sandstorm matt@cec-mi.org.
Woodward Corridor Initiative: The Woodward Corridor Initiative is one of several organizations supporting the development transit and investment along the Woodward Corridor in Detroit. They are supportive of TOD strategies and are active in advocacy for the integration of mixed-use development at strategic points. As an organization they have propelled development efforts forward and aided in concentrating growth around midtown even when the transit proposals for the corridor have stalled.
1. Bochner, Brian, James M. Daisa P.E., and Beverly Storey. “Walkable Urban Thoroughfares: From Concept to Recommended ractice. Institute of Transportation Engineers.ITE ournal . : - .
Accelerating Bus Rapid Transit: A Resource Guide for Local Leaders
This resource guide was prepared for a workshop held in Cleveland, OH on March 24, 2012. The guide is a compilation of case studies for best practices for implementing Bus Rapid Transit (BRT) systems. It provides clear examples and references to tools for implementation including: making the case for BRT, fostering collaboration and fnding creative fnancing.
Webpage: http://sustainablecommunitiesleadershipacademy.org/workshops/accelerating-bus-rapid-transit
PDF Document: http: sustainablecommunitiesleadershipacademy.org resource fles documents Resource-GuideBus-Rapid-Transit-v1.pdf
Complete Streets: Local Policy Workbook
This is a guidebook that serves as a starting point to begin development of Complete Streets policies. The guide encourages local leaders to examine their own community’s needs, visionand goals and incorporate a broad group of local stakeholders.
PDF Document: http://www.smartgrowthamerica.org/documents/cs-local-policy-workbook.pdf
Funding in Michigan: http://library.michigantrails.org/wp/wp-content/uploads/Complete-Streets-Funding-forMichigan-2011.pdf
Webpage: http://www.smartgrowthamerica.org/guides/complete-streets-local-policy-workbook/
Safe Routes — Getting Results: Safe Routes To School (SRTS) Programs That Increase Walking and Bicycling to School
This is a guide to developing Safe Routes programs; it features communities across the U.S and identifes how they overcame their barriers to developing Safe Routes programs. It also includes a useful guide on how to measure student walking and bicycling numbers.
Document: http: .saferoutesinfo.org sites default fles resources srts gettingresults alkbike.pdf
Webpage: http://www.saferoutesinfo.org/
Designing Walkable Urban Thoroughfares; A Context Sensitive Approach
This report was developed to help improve mobility choices and community character through the commitment to creating and enhancing walkable communities. This report uses case studies and design options to guide the community through the urban planning and design process.
Journal Article:
Bochner, Brian, James M. Daisa P.E., and Beverly Storey. “Walkable Urban Thoroughfares: From Concept to Recommended ractice. Institute of Transportation Engineers.ITE ournal . (2011): 18-24.
Full Report:
Daisa, James. M. and Brian S. Bochner. “Designing Walkable Urban Thoroughfares; A Context Sensitive Approach Institute of Transportation Engineers.
Webpage: http://www.ite.org/emodules/scriptcontent/Orders/ProductDetail.cfm?pc=RP-036A-E
Livability Solutions: coalition helping communities succeed
Livability Solutions is a coalition of organizations across the country that provides communities assistance to achieve livability, sustainability, placemaking and smart growth goals. They have a verity of resources listed on their webpage as well as periodic grant opportunities.
Webpage: http://livabilitysolutions.org/?page_id=7
Sustainable Urbanism: Urban Design With Nature By Douglas Farr
This is a book off articles and case studies that address issues of sustainable urbanism The book gives structure to issues of leadership, implementation and advocacy for sustainable issues.
Farr, Douglas. Sustainable Urbanism: Urban Design With Nature. Hoboken, N.J.: Wiley, 2008.
Transportation and Climate Change Clearinghouse—Climate Change Impacts
This annotated list of resources on the impacts of climate change on transportation infrastructure is continually updated.
Department of Transportation, 2010
Webpage: http://climate.dot.gov/impacts-adaptations/forcasts.html
Regional Climate Change Effects: Useful information for transportation agencies
This report provides the transportation community (including highway engineers, planners, NEPA practitioners) with digestible, transparent, regional information on projected climate change effects that are most relevant to the U.S. highway system. This information informs assessments of the risks and vulnerabilities facing the current transportation system, and can inform planning and project development activities.
Federal Highway Administration, 2010
Webpage: http://www.fhwa.dot.gov/hep/climate/climate_effects/effects00.cfm
As of December, 2012, DCAC is in the early stages of developing a communityled climate action plan for Detroit. As part of this process, graduate students from the University of Michigan’s Urban and Regional Planning Program, in partnership with DCAC, developed a vulnerability assessment in late 2012 to identify the spatial distributions of social disadvantage and environmental hazards that may inform decision-makers how best to prioritize adaptive strategies.
Results of the vulnerability assessment can be used to identify key geographic areas and populations within the city that are recognized to be most vulnerable to the potential effects of climate change. However, the greatest strength of the vulnerability analysis will be when it is integrated with the expertise and contextual knowledge of the DCAC members and community residents. Then it can be used as a tool to carefully target further efforts including: additional research, ground-truthing, community outreach and ultimately prioritizing strategies for climate change adaptation efforts.
The vulnerability analysis focused on identifying the physical areas in the city that have the highest risk of negative impacts related to heat and rainfall events. These impacts were chosen based on GLISA’s identifcation that heat and rainfall ould have the greatest climate change effect on Detroit. Current scientifc literature also identifes that certain populations have a greater level of sensitivity to heat or fooding events. As a result of this research, an overlay of the socio-economic demographics was added to help prioritize the populations that may experience the greatest vulnerability.
The overall fndings sho that areas ith the highest heat intensity and potential for a sewer system overload during a rain event contain a high percentage of impervious surfaces and a low percent of tree coverage. To help prioritize adaptation strategies within the city, the results of the vulnerability analysis were mapped at a relative scale, meaning the areas that are identifed to have the highest vulnerability are relative only to those with lower vulnerability within Detroit, and are not compared to other cities.
Areas identifed as having very high levels of heat vulnerability are dispersed throughout the city. Downtown, Midtown and the Grand River and Gratiot corridors are predominantly identifed as moderate to very high vulnerability due to their generally low tree cover and impervious physical characteristics.
ur fooding vulnerability analysis has t o components: sewersheds and households. As climatologists warn that intensity and frequency of precipitation events will increase, it is important to identify what areas of the city have the most stormwater runoff. Similar to the heat analysis, the results showed that the areas most vulnerable to sewer systems overload are those with the highest percent of impervious surface and the lowest percent of tree cover. Again, these areas are concentrated predominantly in the Downtown and Midtown areas of Detroit. At the household level, the fooding vulnerability analysis focused on exposure according to location ithin the foodplain and sensitivity according to the age of the housing stock and the median household income. The results sho ed a limited fooding risk located only along areas adjacent to the Rouge and Detroit Rivers.
Moving forward in 2013, the DCAC and its work groups should identify both long-term and
short-term priorities for addressing vulnerabilities within the city. Short-term recommendations could include, for example: carefully considering the distribution of the city’s designated cooling center locations. ur fndings encourage increasing the number of offcial cooling centers, and adding mobile cooling centers when necessary.
Longer-term, DCAC should develop a strategy that prioritizes planting and pavement removal in the areas that have been identifed as the most vulnerable to heat events. Minimizing impervious surface cover and maximizing vegetative cover and tree canopy throughout the city will have
positive benefts for reducing the HI effect and reducing the likelyhood that overloaded sewer/stormwater systems will release untreated wastewater into the city’s receiving waters.
Climate change adaptation for Detroit will require collaboration among the city’s residents, organizations and institutions to effectively share knowledge, resources, and prioritize actions. The vulnerability assessment contained in this document serves as a starting point to begin a larger community conversation.

Source: By Maia C.
Adaptation: The “adjustment of human or natural systems in response to actual and/ or anticipated climate change” (Larsen et al, 2013; Blanco et al, 2009).
Albedo: Albedo is how much of the incoming solar radiation is refected as shortwave radiation. Measured from 0 - 1.0, 0 represents 100% complete absorption of all shortwave radiation and 1.0 represents complete refection of all short ave radiation
All Hazards Plan: Plan to address all aspects of emergency preparedness, from security to natural disasters. Detroit’s ffce of Public Health Emergency Preparedness coordinates its All-Hazards Plan. (Source: Detroit Department of Public Health)
American Community Survey: The American Community Survey (ACS) is an ongoing survey that provides data every year -- giving communities the current information they need to plan investments and services. Information from the survey generates data that help determine how more than $400 billion in federal and state funds are distributed each year. (Source: Census.gov)
Anaerobic Digestion: A biological process that produces a gas principally composed of methane (CH4) and carbon dioxide (CO2) otherwise known as biogas. These gases are produced from organic wastes such as livestock manure, food processing waste, etc. (Source: California Energy Commission)
Apparent Temperature: Calculation of what people perceive as the temperature in hot and humid conditions. (Source: National Oceanic and Atmospheric Administration, http://www.ncdc.noaa.gov/societal-impacts/ apparent-temp/)
Biophysical: The biological and physical elements that help characterize a place, specifcally underlying geology and soils, forest and vegetative cover types, climate, hydrology, and species diversity.
Blue-Green Infrastructure: Uses vegetation, soils, and natural processes to manage water and create healthier urban environments. At the scale of a city or county, blue-green infrastructure refers to the patchwork of natural areas that provides habitat, food protection, cleaner air, and cleaner water. At the scale of a neighborhood or site, blue-green infrastructure refers to stormwater management systems that mimic nature by soaking up and storing water. (Source: EPA Green Infrastructure http://water. epa.gov/infrastructure/greeninfrastructure/ gi_what.cfm)
Brownfeld: Real property, the expansion, redevelopment, or reuse of which may be complicated by the presence or potential presence of a hazardous substance, pollutant, or contaminant. (Source: EPA.gov)
Census Block Group: The smallest unit of Census geography in which the Census publishes household level data. A block group is smaller than a Census tract yet larger than a Census block and generally contains between 600 and 3,000 people. (Source: American Fact Finder Glossary)
Climate: Climate is the accumulation of recorded weather trends in a region over a long period of time.
Climate Change: The multitude of impacts caused by the trend of higher global temperatures: increased duration and frequency of drought, increased number of extreme precipitation events, rising sea levels, and ocean acidifcation. e Center
Climate Projection: A model of climate patterns combined with GHG emission scenarios that projects the expected climate change outcomes.
Coniferous: Mostly evergreen trees and shrubs having usually needle-shaped or scalelike leaves and including forms (as pines) with true cones and others (as yews) with an arillate fruit.
Cool Roof: Refects the sun’s heat and emits absorbed radiation back into the atmosphere. The two basic characteristics that determine the ‘coolness’ of a roof are solar refectance (SR) and thermal emittance (TE). (Source: CoolRoofs.org http://www.coolroofs.org/ HomeandBuildingOwnersInfo.html)
Cooling Center: A temporary air conditioned public space set up by local authorities to provide relief from the heat. (EPA, http://www. epa.gov/aging/resources/climatechange/ extremeheatevents.htm)
Combined Sewer Over ow CSO : A sewer system discharge (and major pollution concern) containing not only stormwater but also untreated human and industrial waste, toxic materials, and debris. During periods of heavy rainfall or snowmelt, the wastewater volume in a combined sewer system can exceed the capacity of the sewer system or treatment plant. For this reason, combined sewer systems are designed to overfo occasionally and discharge excess wastewater directly to nearby streams, rivers, or other water bodies. (Source: EPA http://cfpub.epa.gov/npdes/home.cfm?program_ id=5)
Combined Stormwater System: Sewers that are designed to collect rainwater runoff, domestic sewage, and industrial wastewater in the same pipe. (Source: EPA http://www.epa. gov/compliance/monitoring/programs/cwa/csos. html)
Compact Development: Building in a more compact way to reduce development costs and provides density that can be effciently served by transit. There are several forms of compact development including mixed-used development, where by integrating different uses such as residential, offce, and shopping daily vehicle trips can be reduced.
Compost: Decayed organic material used as a plant fertilizer.
Deciduous: Trees and shrubs that are wood plants and shed leaves annually,
Demand-Side Management: Manage the demand for energy in various ways that keep end-use demand levels constant.
Eco Effciency: Reducing the amount of resources, waste and pollution needed to provide the same good or level of service.
Ef uent: An outfo from a se er or sewage system.
Emissivity: Ratio from 0 - 1.0. An emissivity of 1.0 indicates that pavements are very effective at storing heat energy and releasing it slowly.
Environmental Risk: Vulnerable aspects of organizations that are exacerbated by climate change; Factors of production and capital fo s are infuenced dramatically by extreme weather events and changing climate conditions.
E treme eat Event E E : refers to unusually hot temperatures and/or high humidity readings compared to the typical regional average for that season. Generally, an EHE occurs when the daytime high is above 90*F and the nighttime low temperature remains high limiting relief from the heat. (EPA, http://www.epa.gov/ heatisland/about/heatguidebook.html)
Flood Plain: A land area immediately adjacent to a river, stream, or creek. It is an area that may be covered with water after heavy rainstorms. The foodplain collects and holds the excess water from storms, allowing it to be released slowly into the river system and to seep into groundwater aquifers, the underground layers of soil, gravel, or porous stone that yield and carry water. Floodplains, along with wetlands and shorelines, are considered to be critical areas for a river and its watershed. (Source: Huron River Watershed Council)
Flood Risk: Usually expressed through a map, highlights areas that are more likely to food and has a corresponding insurance rate. Risk is based on a number of factors: rainfall, river-fo and tidal-surge data, topography, food-control measures, and changes due to building and development. (Source: FloodSmart.gov http://www. foodsmart.gov foodsmart pages fooding food risks ffr overvie . sp
Geographic Information System: Software for analyzing and representing spatial data.
Greenhouse Gas G G : Gases that trap heat in the atmosphere often emitted as a byproduct of fossil fuel combustion. The most common are Carbon Dioxide (CO2), Methane (CH4), and Nitrous Oxide (N2O). (EPA, http://www.epa.gov/climatechange/ ghgemissions/gases.html)
Greenway: A network of open spaces and trails for walking, jogging, biking and roller-blading that links neighborhoods and destinations such as parks, schools, libraries and shopping areas. (Source: Conner Creek Greenway http://www.connercreekgreenway. org/conner-creek-greenway/)
Green Jobs: Green jobs produce (“supply”) goods or services that result in: generating and storing renewable energy, recycling existing materials, energy effcient product manufacturing, distribution, construction, installation, and maintenance, education, compliance, and awareness, and natural and sustainable product manufacturing. (Source: State of California, Employment Development Divisions & Labor Market Information Division)
Green Lease:A lease that incorporates ecologically sustainable development principles to ensure that the use and operation of a building minimizes the impact on the environment.
Green Procurement: Environmentally sustainable rules and regulations that focus on effciencies ith regard to the ac uisition of goods and services. (Ex: Detroit Diesel)
Heat/Health Warning System: Tool developed by National Oceanic and Atmospheric Administration for statistical analysis of heat threats for specifc regions to allo for better forecasting of extreme heat and improve the public health response.
HVAC: Heating, ventilation and air conditioning systems. Used to provide heating and cooling services to buildings.
Herbaceous: Having the texture, color, etc. of an ordinary foliage leaf. i.e. shrubs and other low-growing plants.
Impervious Surface: An impervious surface is any surface that does not allow water to soak into the ground. When water from rain and sno melt ashes off a piece of property, it fo s into a storm drain system and eventually into the Huron River. Impervious or hard surfaces on the property such as roofs, driveways, and patios, do not absorb the water and contribute to stormwater runoff. (Source: City of Ann Arbor, a2gov.org)
Incineration: The process of combusting waste material. Incineration is used to reduce the amount of aste headed to landflls, and or produce energy.
Indicator: An instrument to measure the direction and proportion of progress.
Lead Abatement: Lead abatement is an activity designed to permanently eliminate lead-based paint hazards. (Source: EPA.gov)
Low Impact Design: Approach to land development (or re-development) that works with nature to manage stormwater as close to its source as possible. LID employs principles such as preserving and recreating natural landscape features, minimizing effective imperviousness to create functional and appealing site drainage that treat stormwater as a resource rather than a waste product. (Also Low Impact Development.) (Source: EPA http://water.epa.gov/polwaste/ green/index.cfm)
Mitigation: Strategies that focus on reducing GHG emissions from human activity and promote the use and development of non-fossil fuel energy sources
Normalized: A method of accounting for changes in activity level such as population changes or changes in economic fo s.
Outfall: The point, location, or structure where wastewater or drainage discharges from a sewer, drain, or other conduit. (Source: http:// www.owp.csus.edu/glossary/outfall.php)
Ozone Precursors: Ground level ozone is not emitted directly into the air, but is created by chemical reactions between oxides of nitrogen (NOx) and volatile organic compounds (VOC). These chemical reactions are accelerated by heat.
Ozone Action Day: Days that ground-level ozone exceeds acceptable levels for human health. Even relatively low levels of ozone can cause health effects. People with lung disease, children, older adults, and people who are active outdoors may be particularly sensitive to ozone. (Source: EPA, http:// www.epa.gov/air/ozonepollution/basic.html)
Pay-As-You-Throw: A policy of charging residents for refuse collection based on amount.
Pervious Surface: Surfaces that allow rainwater to pass through them and soak into the ground instead of fo ing into storm drains. (Source: Oregonmetro.org)
Positive Drainage: Soil around building slopes away from building to move water away from building
Public Health: Public health is the practice of preventing disease and promoting good health within groups of people, from small communities to entire countries. (Source: American Public Health Association)
R-Value: Measure of the thermal resistance to heat fo of a given material. A high R-value indicates a good insulative property.
Runoff: The draining away of water (or substances carried in it) from the surface of an area of land, a building or structure, etc.
Sensitivity: Sensitivity is the degree to which a system is affected, either adversely or benefcially, by climate- related stimuli. The effect may be direct e.g., damages caused by an increase in the frequency of coastal fooding due to sea-level rise . I CC 3rd Assessment Report)
Service Area: A geographic zone based on access to particular amenity or service.
Sewer District: Sewer drainage areas defned as the city developed, ith no formal legal boundaries. Boundaries are determined in order to minimize the number of info points into the DWSD collection system. (Source: DWSD Wastewater Master Plan)
Single Stream Recycling: Policy of collecting recycling goods in one container and sorting at a central facility. This is in contrast to the previous method of requiring residents or collectors to sort recyclables on the side of the curb.
Social Entrepreneurs: Social entrepreneurs are individuals with innovative solutions to society’s most pressing social problems. (Source: Ashoka)
Stormwater: Water from rain, snow, sleet, hail, that fo s across the ground and pavement or when snow and ice melt. (Source: Stormwater Coalition http://www. stormwatercoalition.org/html/ti/index.html)
Supply Side Management: Increases the reliability of energy supply focusing on production, transmission, or distribution of energy.
Sustainable Transportation: Transportation options that decrease dependence on personal vehicle transportation and reduce the use of carbonbased fuels.
Syndromic Surveillance: Michigan’s Syndromic Surveillance System facilitates rapid public health response to outbreaks of illness and other public health threats by using real-time detection through automatic data collection and other tools. (Source: Michigan Department of Community Health, http://www.michigan.gov/mdch/0,4612,7132-2945_5104_31274-107091--,00.html)
Thermal Envelope: Parts of a building that enclose conditioned spaces, including exterior alls, roof, and foors.
Transit-Oriented Development: “Moderate and high-density housing, along with complementary public uses, jobs, retail and services, [that] are concentrated in mixed-use developments at strategic points along the regional transit systems.” (source: Peter Calthorpe)
Tree Canopy: The upper layer of deciduous trees that provide shade.
Urban Forest: The layer of leaves, branches and stems of trees that cover the ground when viewed from above. The urban forest includes trees on both public and private land. (Source: Center for Watershed Protection)
Read more: Defnition of rban Tree Canopy | eHow.com http://www.ehow.com/ about defnition-urban-tree-canopy. html#ixzz2Fd5UZfeh
Urban Heat Island - HI is defned as increased surface and air temperatures in urban areas relative to surrounding suburban and exurban areas. UHI patterns vary by region, occur in more dispersed pattern than once thought, may increase or decrease over time, and are most problematic during warm weather.
VOCs: “Volatile organic compounds (VOCs) and nitrogen oxide (NOx) are emitted as gases from certain solids or liquids. VOCs include a variety of chemicals, some of which may have short- and long-term adverse health effects. Emissions from industrial facilities and electric utilities, motor vehicle exhaust, gasoline vapors, and chemical solvents are some of the major sources of NOx and VOC.” (Source: EPA, http:// www.epa.gov/iaq/voc.html)
Vulnerability: The degree to which a system is susceptible to, and unable to cope with adverse effects of climate change, including climate variability and extremes. Vulnerability is a function of the character, magnitude, and rate of climate change and variation to which a system is exposed, its sensitivity, and its adaptive capacity. (Ontario Expert Panel on Climate Change Adaptation 2009)
Waste to Energy WtE :Process of creating energy in the form of electricity or heat from the incineration of waste source. WtE is a form of energy recovery. Most WtE processes produce electricity directly through combustion, or produce a combustible fuel commodity, such as methane, methanol, ethanol or synthetic fuels.
Waste Stream: Refers to total amount of waste produced by a particular area.
Wastewater: Used, dirty water that goes through the drains and toilets of homes, businesses, industry, and institutions; also known as sewage. (Source: WaterWise http:// www.waterwise.co.za/export/sites/waterwise/water/wastewater/posters/downloads/ Wastewater.pdf)
Wastewater Treatment Plant: In general, a facility designed to treat wastewater before discharging back into a water body. The Detroit facility, is the largest single-site wastewater treatment facilities in the United States. Originally, it was only intended to provide primary treatment, which screens out solids and chlorinates the wastewater. However, the plant was upgraded in the 1960s to provide secondary treatment, which is a more rigorous screening and treatment process that disinfects biodegradable solids, producing an even cleaner effuent. Currently, the plant serves about of Michigan’s total population, with a service area of 946 square miles, extending far beyond just Detroit’s boundary. (Source: DWSD http://www. dwsd.org/pages_n/facilities_wastewater.html)
Watershed: Region ithin hich ater fo s into a specifed body such as a sea, river, lake or ocean
Weather: Weather describes the day-to-day conditions in a specifc place, including the temperature, precipitation and cloud cover.
Weatherization: The practice of protecting a building and its interior from the elements, particularly from sunlight, precipitation, and wind, and of modifying a building to reduce energy consumption and optimize energy effciency. Source: http: . aptac.org
Whole House Fan: Type of fan, or exhaust system commonly venting into a building’s attic, designed to pull hot air out of the building.
Yard Waste: Biodegradable waste that stems directly from plant matter, such as grass clippings and leaves.
Source: Detroit Street Railways Map
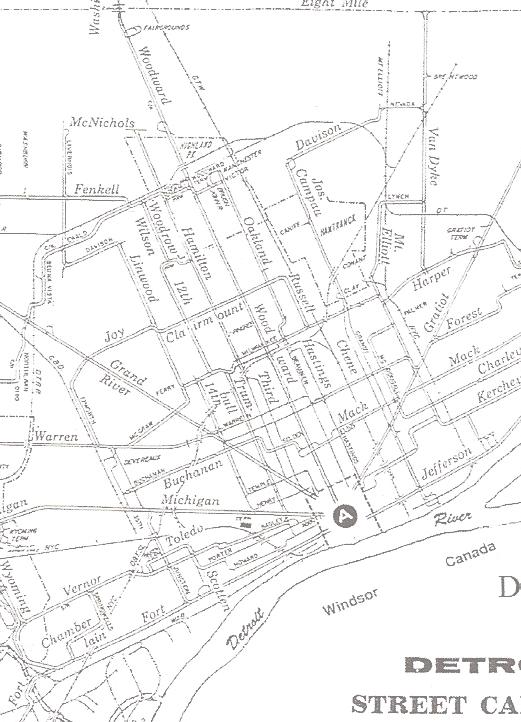
Figure 1: Surface Temperature Map
Figure 2: Detroit Land Cover Type
Figure 3: Detroit Exposure to Excessive Heat Based on Land Cover by Block Group 2010
Figure 4: High School Education or Less by Census Block Group
Figure 5: Medium Household Income by Census Block Group
Figure 6: Percent of Population 65 or Older by Census Block Group
Figure 7: Percent of Population without Vehicle Access by Census Block Group
Figure 8: Detroit Sensitivity to Excessive Heat by Block Group 2010
Figure 9: Detroit Heat Vulnerability by Census Block Group 2010
Figure 10: Detroit Heat Vulnerability and Cooling Center Access by Block Group 2010
Figure 11: Detroit Land Cover Type
Figure 12: Underlying Soil Type and Soil Drainage
Figure 13: Topographical Slope as Percent Change in Elevation
Figure 14: Aggregate Runoff Coeffcient by lock Group
Figure 15: Impervious Surgace Cover by DWSD Sewer District
Figure 16: Total Runoff Exposure by Block Group 2010
Figure 17: Housing Sensitivity Based on Income and Housing Age by Block Group 2010
Figure 18: Flood Risk Hazard
Figure 19: Household Sensitivity and Flood Potential
Figure 20: Household Sensitivity and Flood Potential
Total Runoff Exposure by Block Group 2010 - Labeled
Vacant Housing Units as Percentage of Total Units by Block Group 2010
Percent of Housing Stock Building Beofre 1940 by Block Group 2010
Contour Elevation (in Feet)
Participating Detroit “Safe Route to School” Programs
Detroit Council Districts
Detroit Council District 1 Block Groups
Detroit Council District 2 Block Groups
Detroit Council District 3 Block Groups
Detroit Council District 4 Block Groups
Detroit Council District 5 Block Groups
Detroit Council District 6 Block Groups
Detroit Council District 7 Block Groups
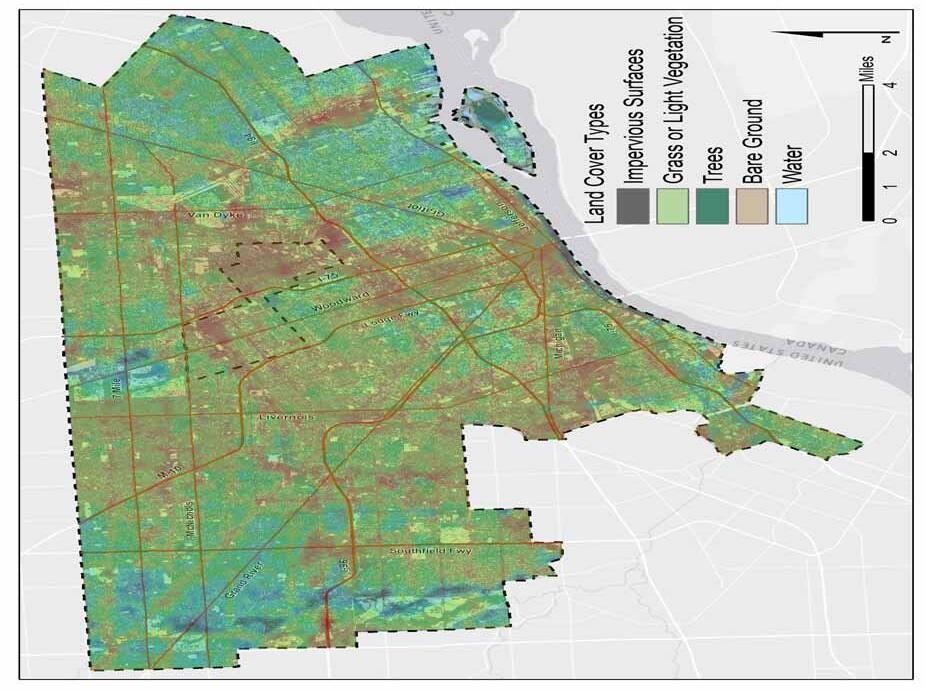
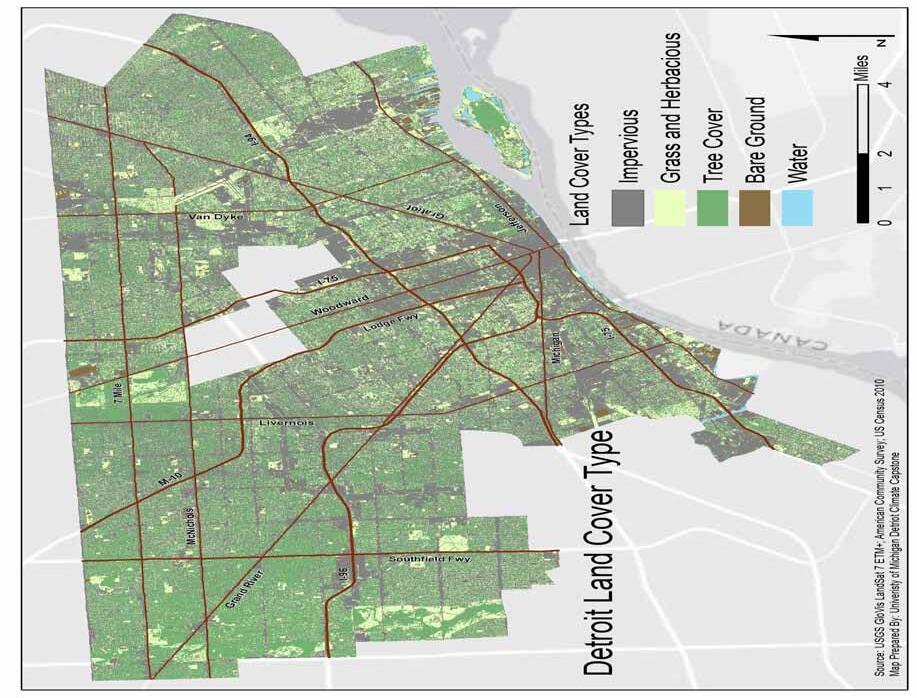
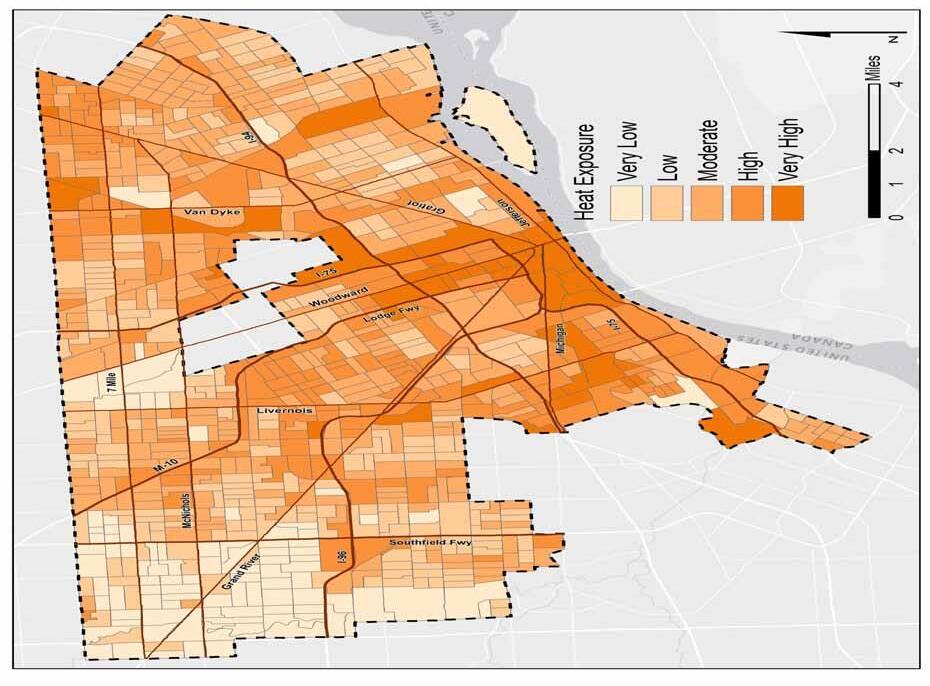
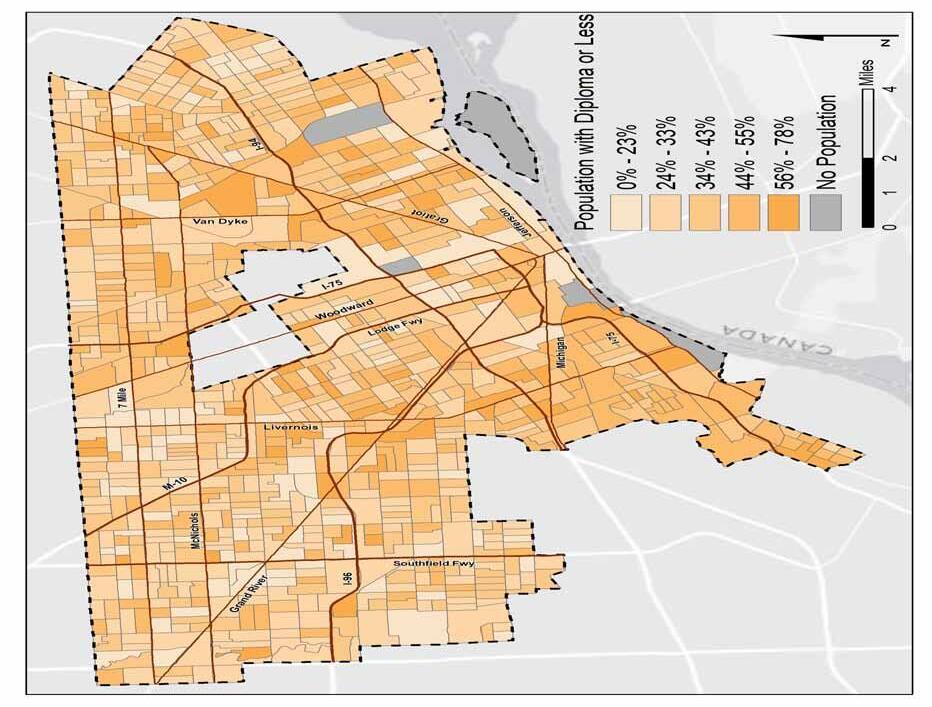
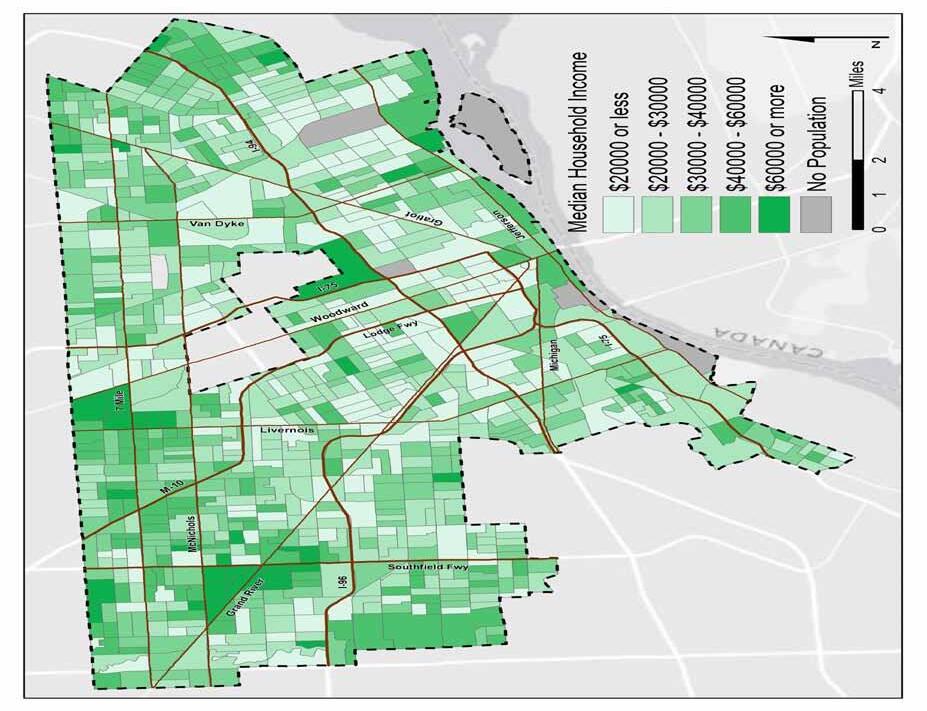
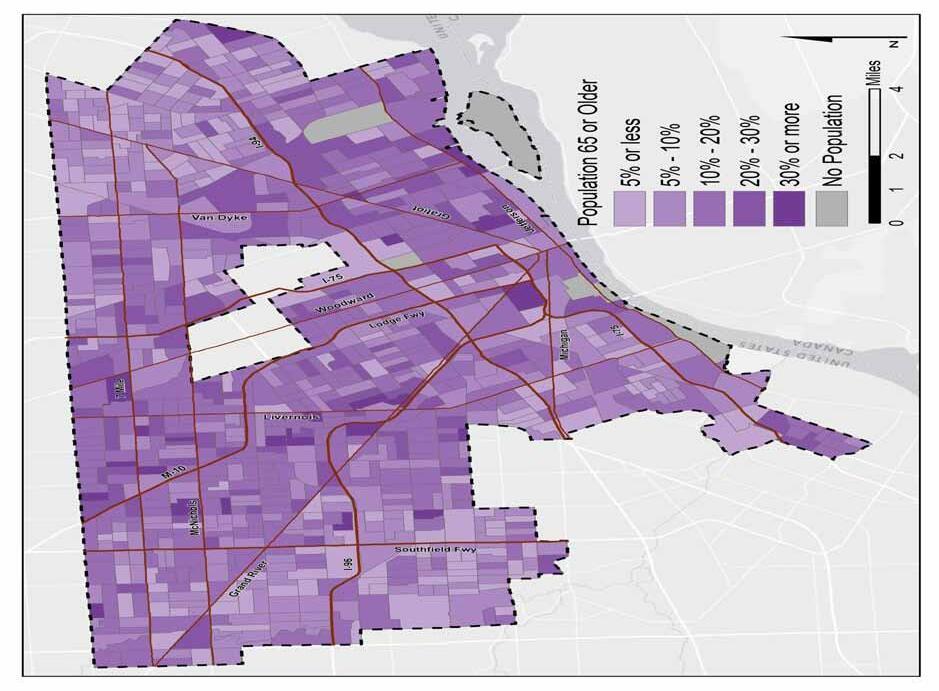

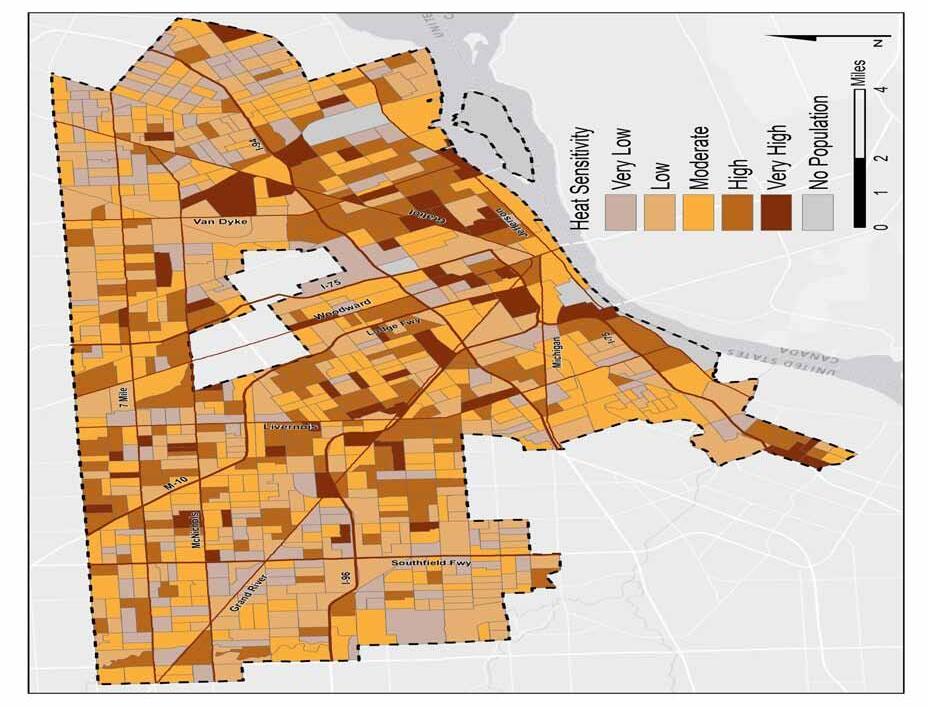
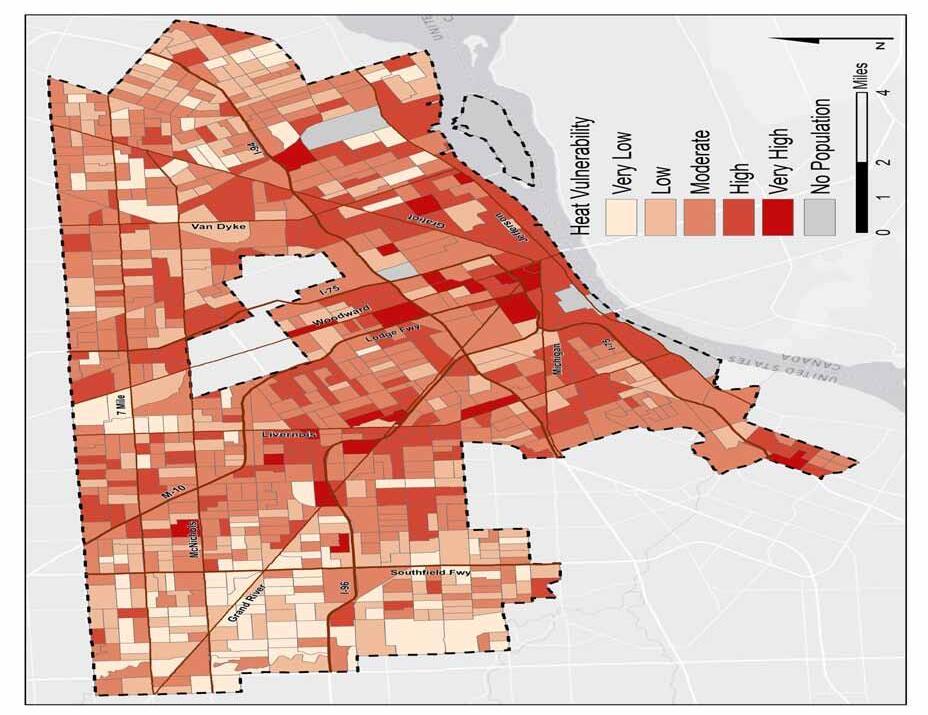
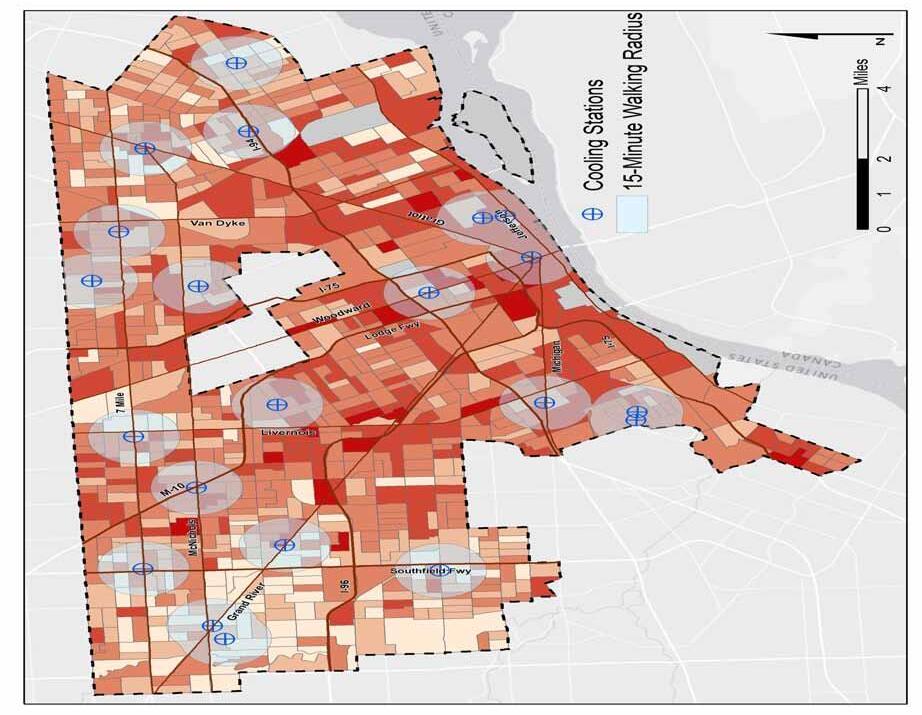


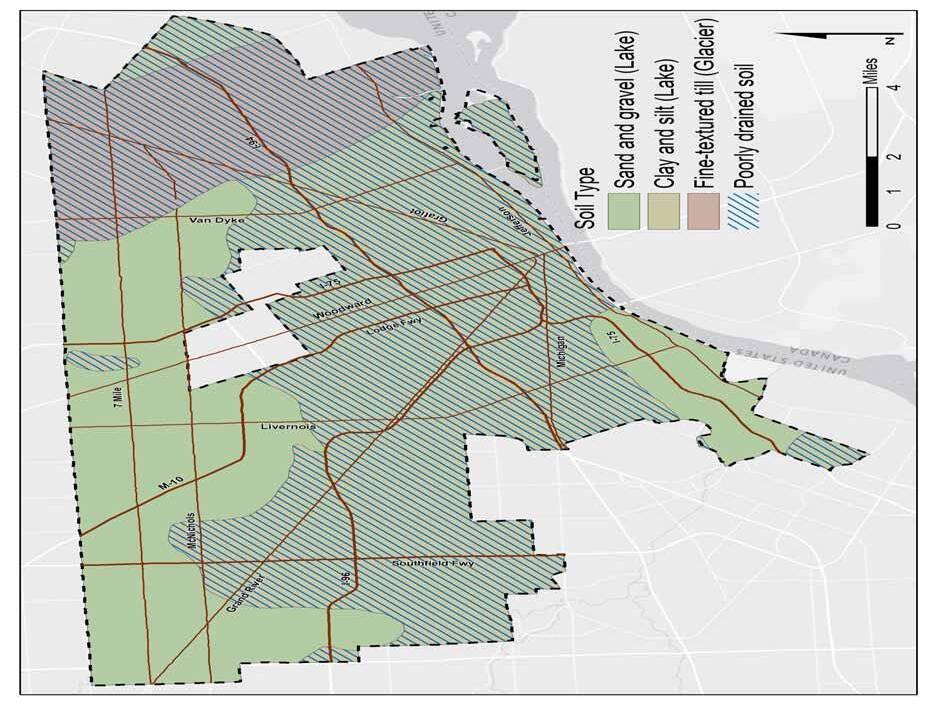
Figure 13: Topographical Slope as Percent Change in Elevation
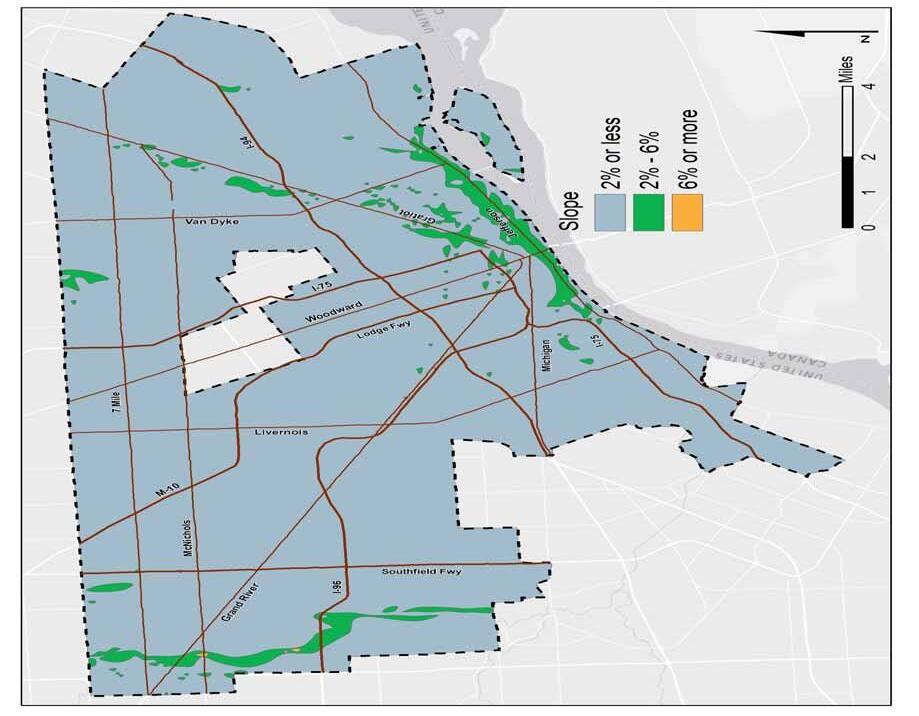

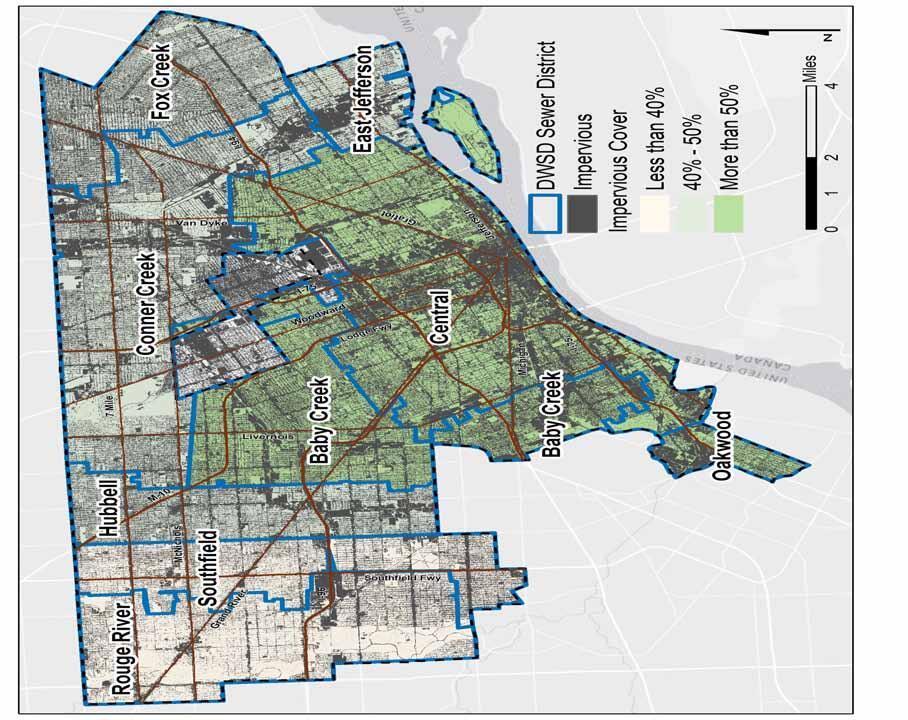
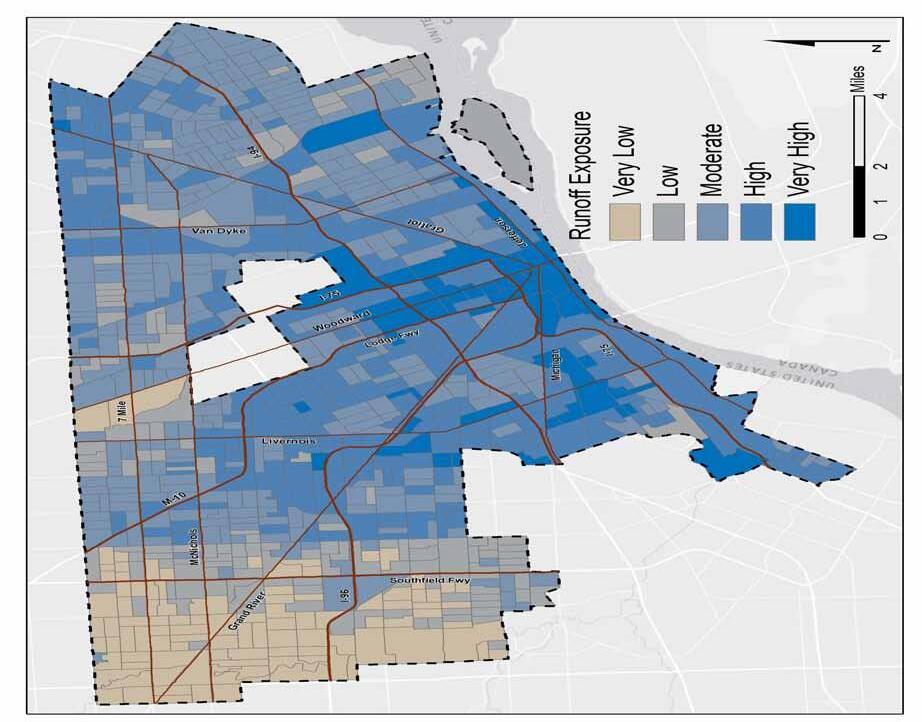
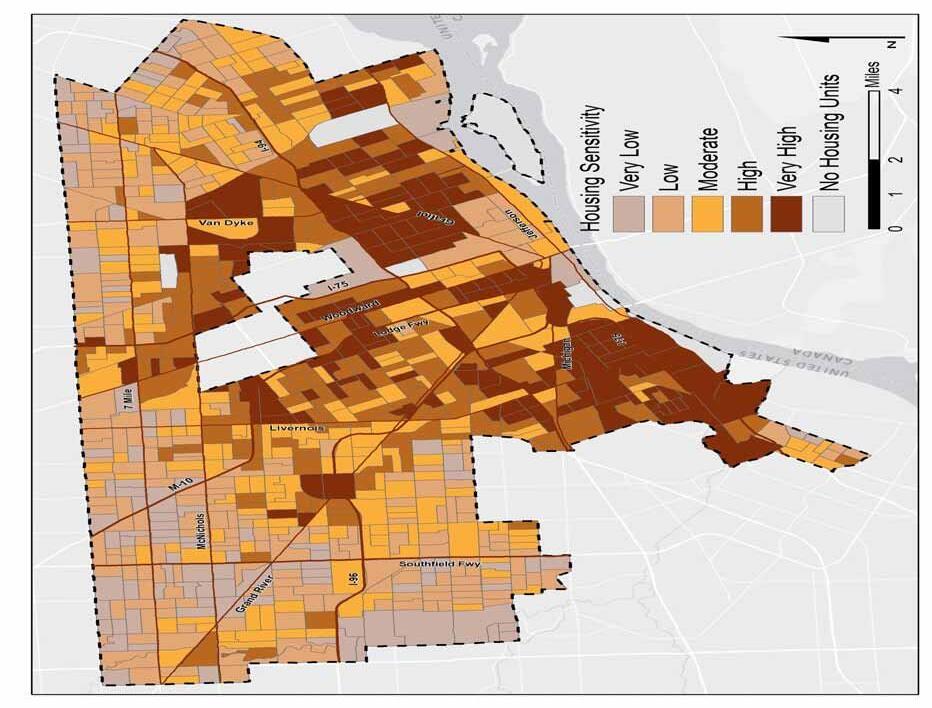
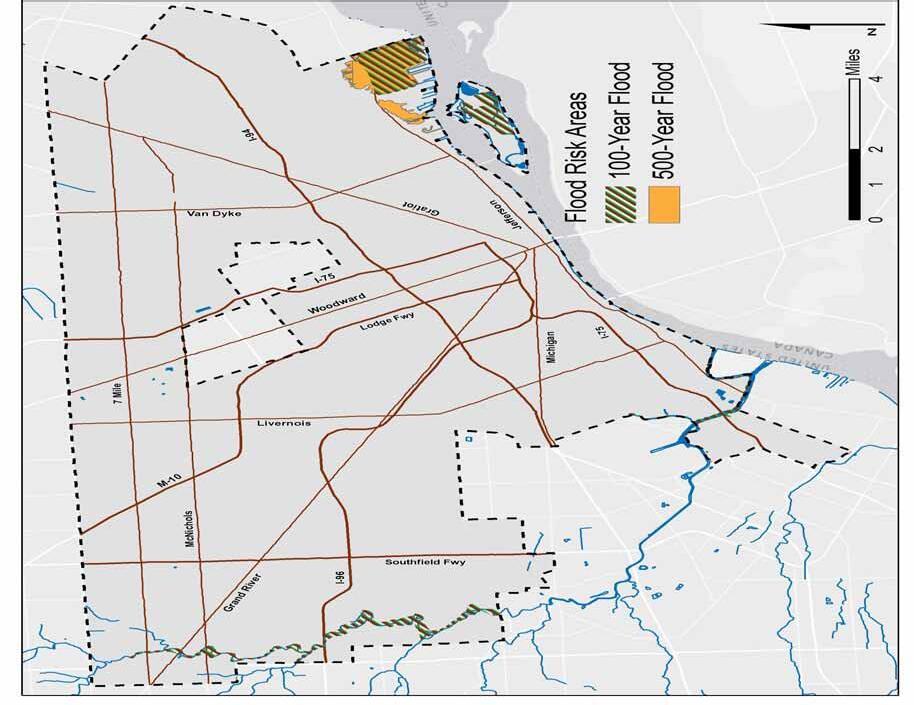
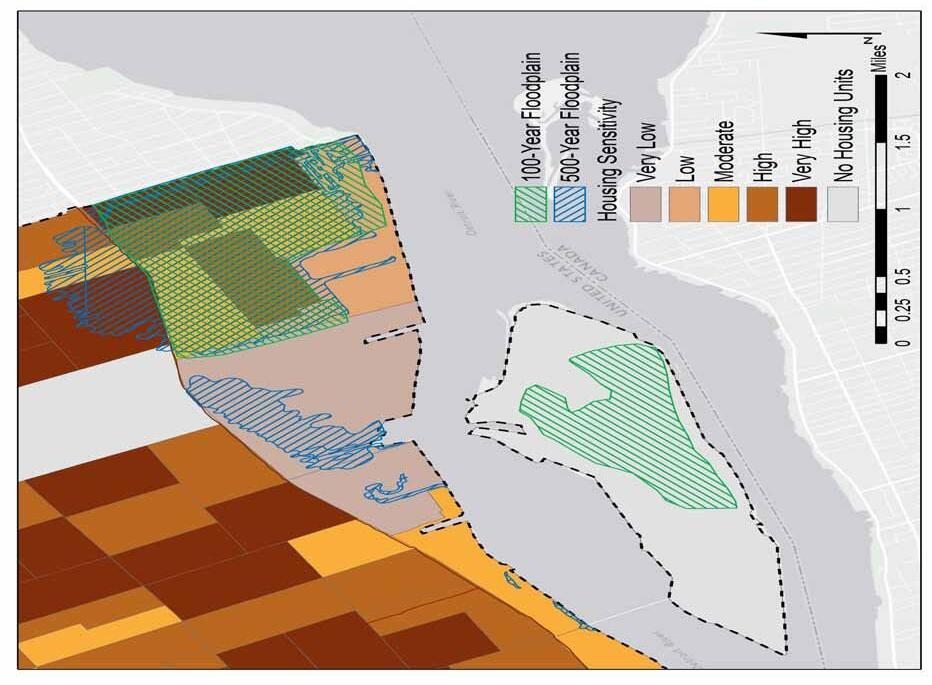
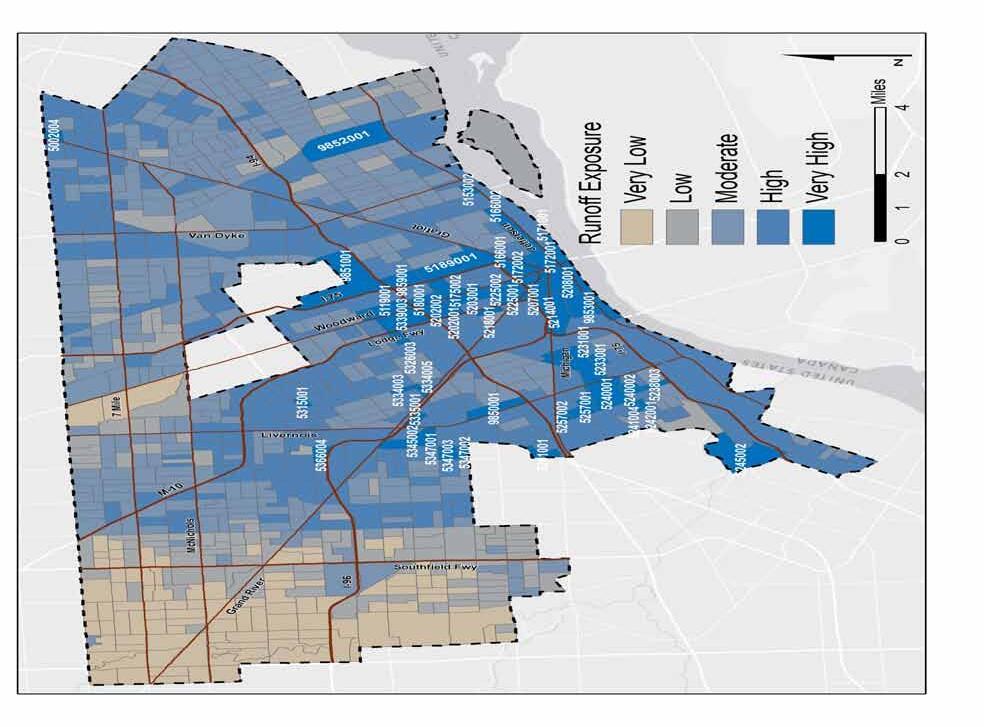
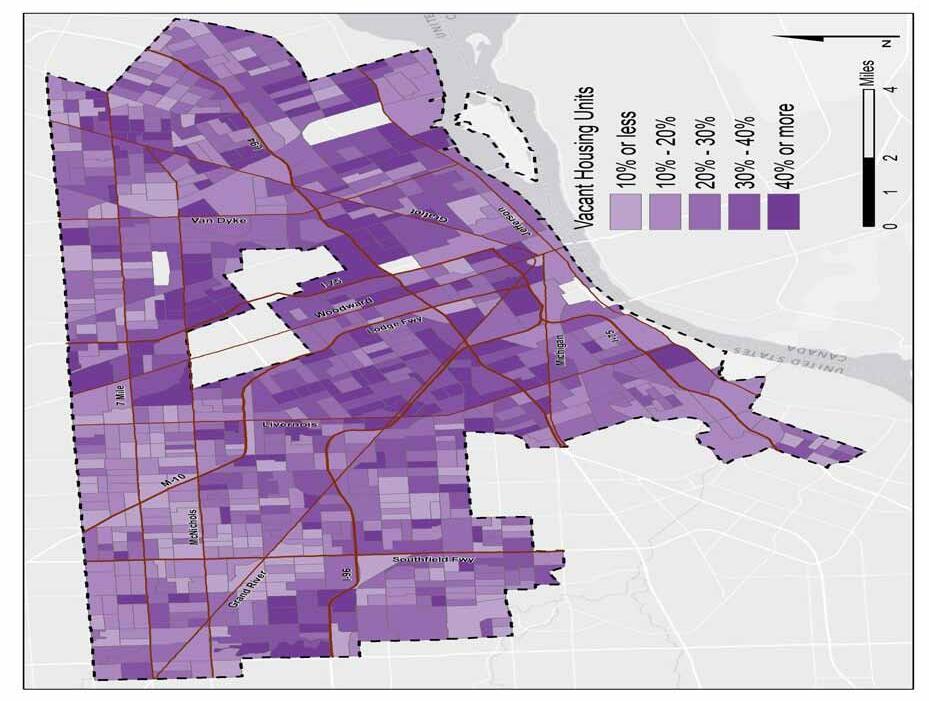
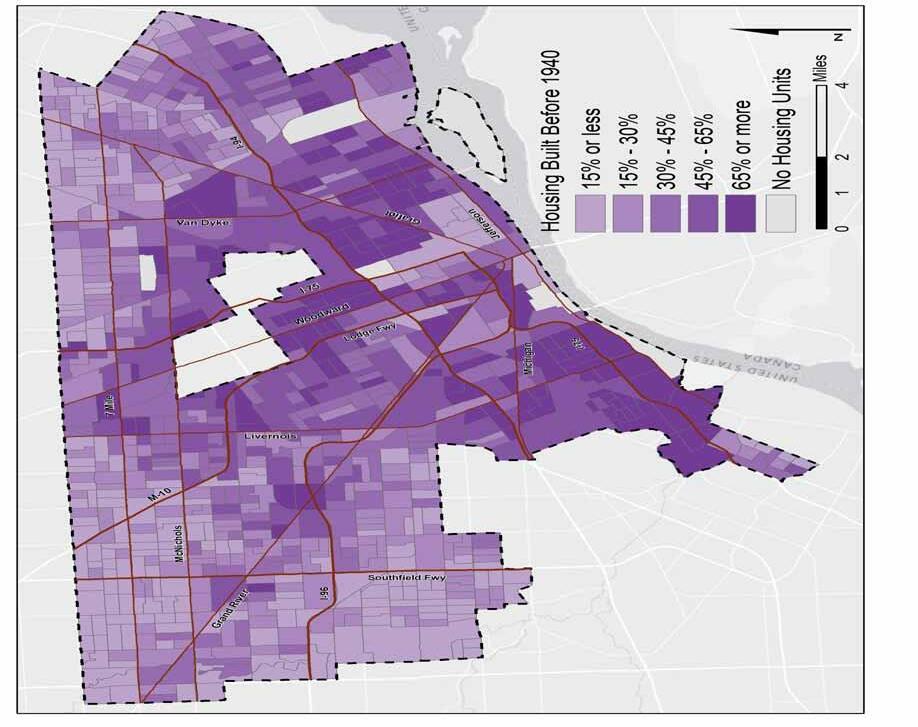
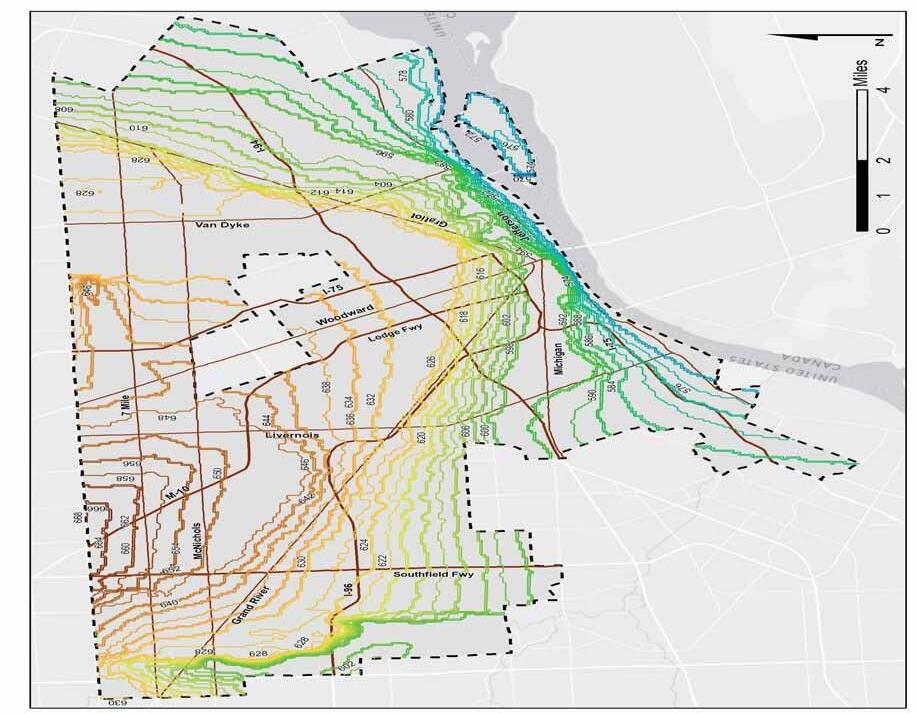
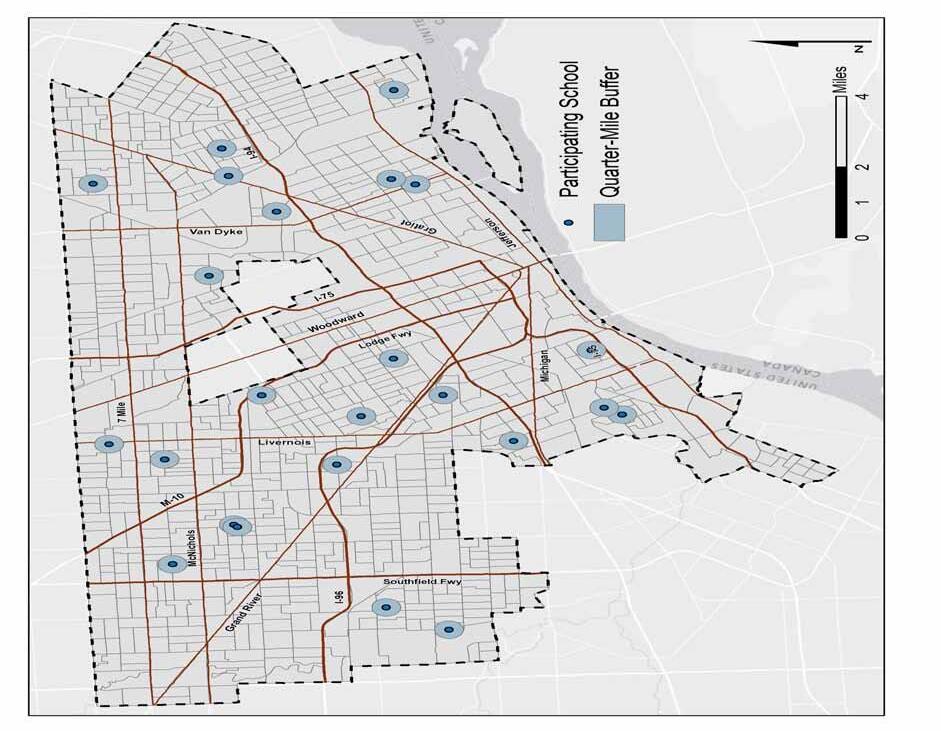
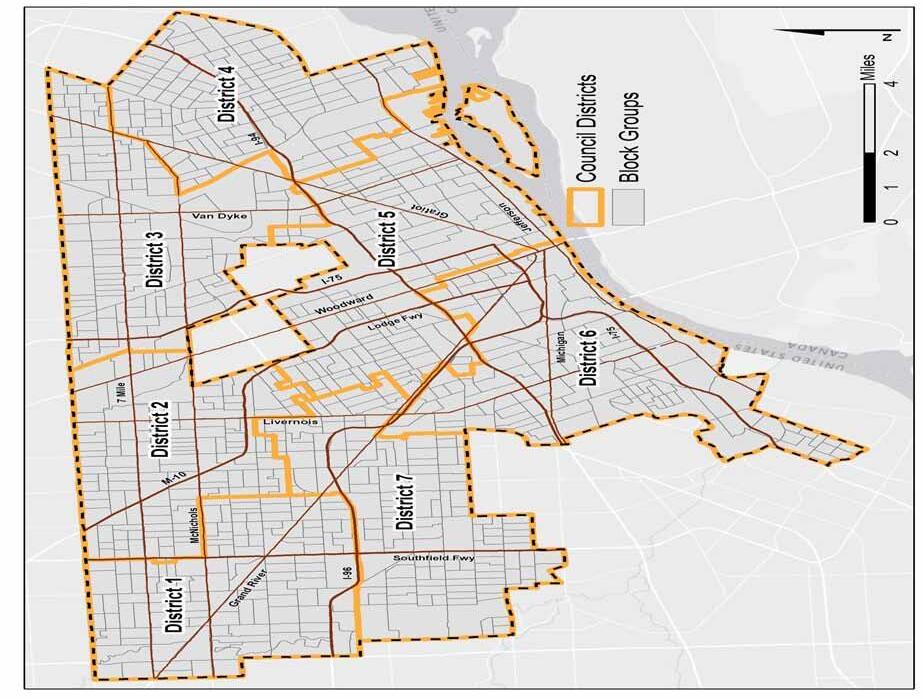
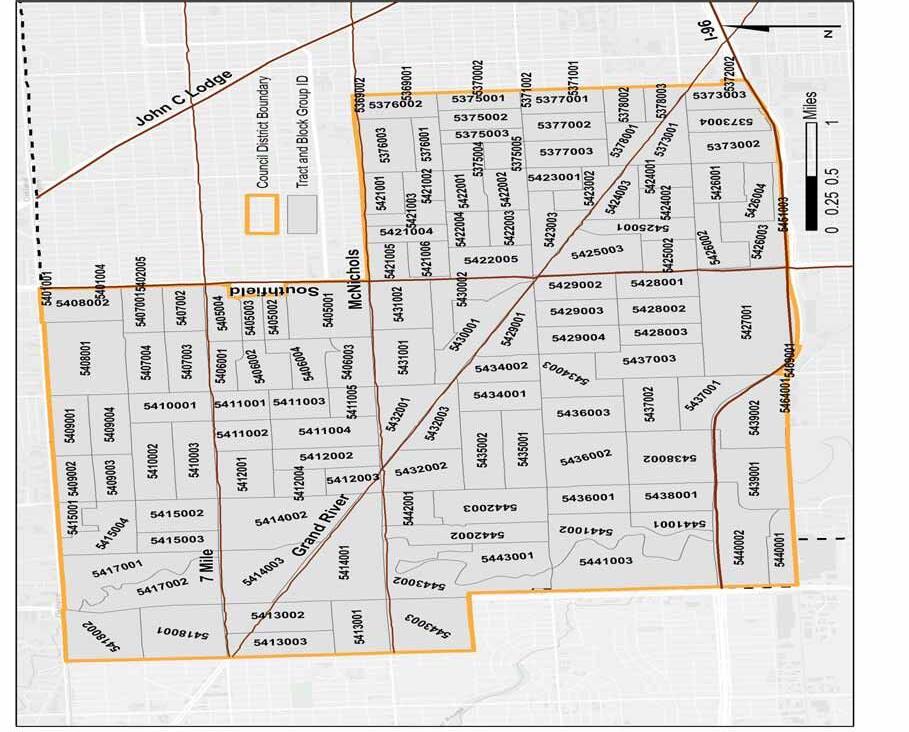
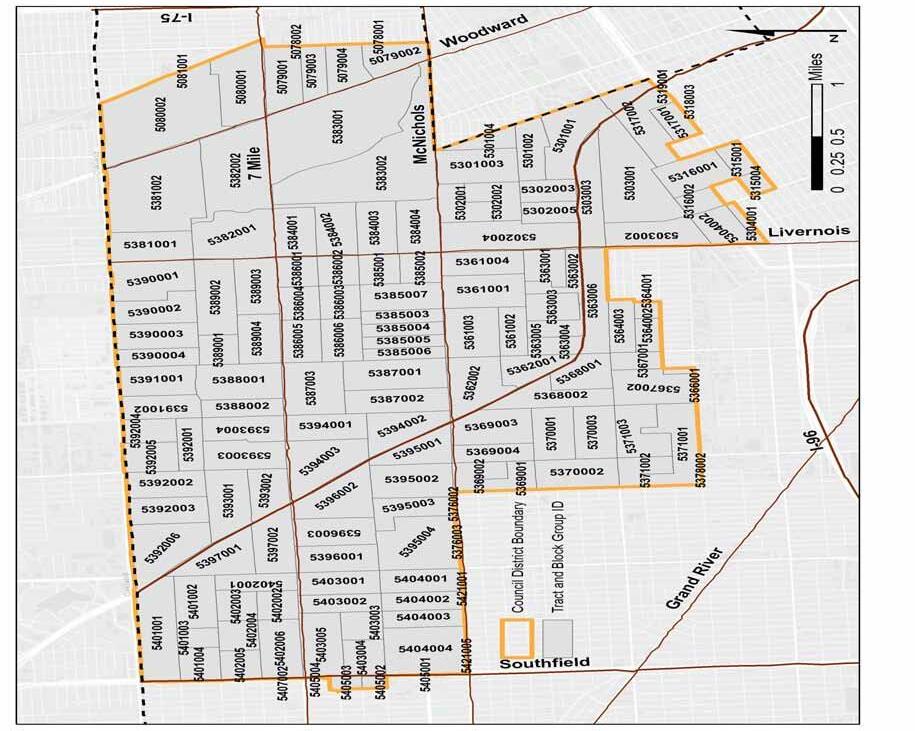
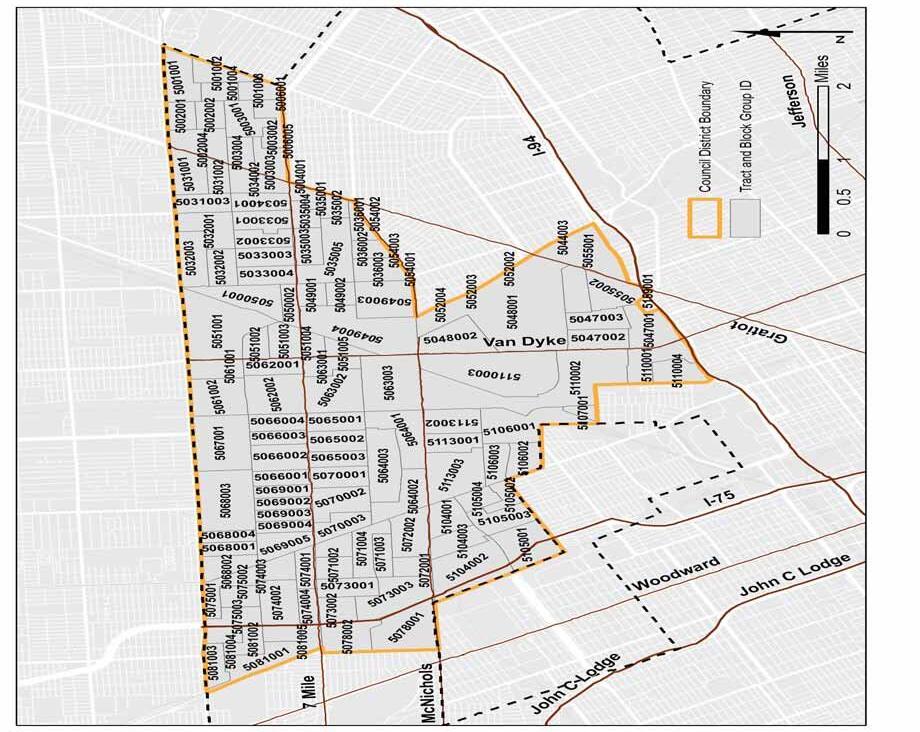
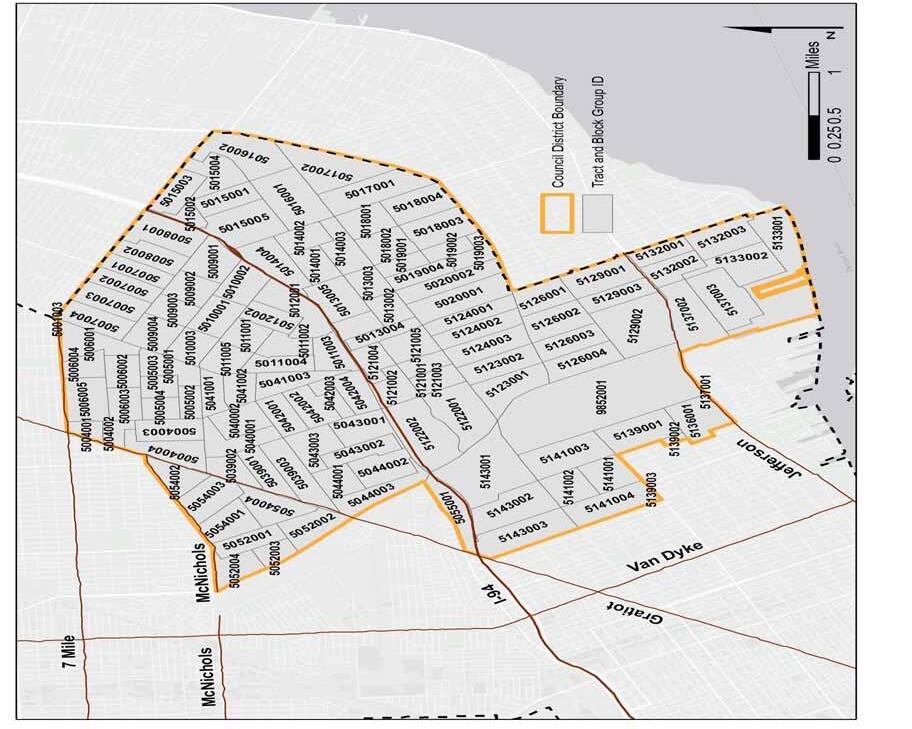
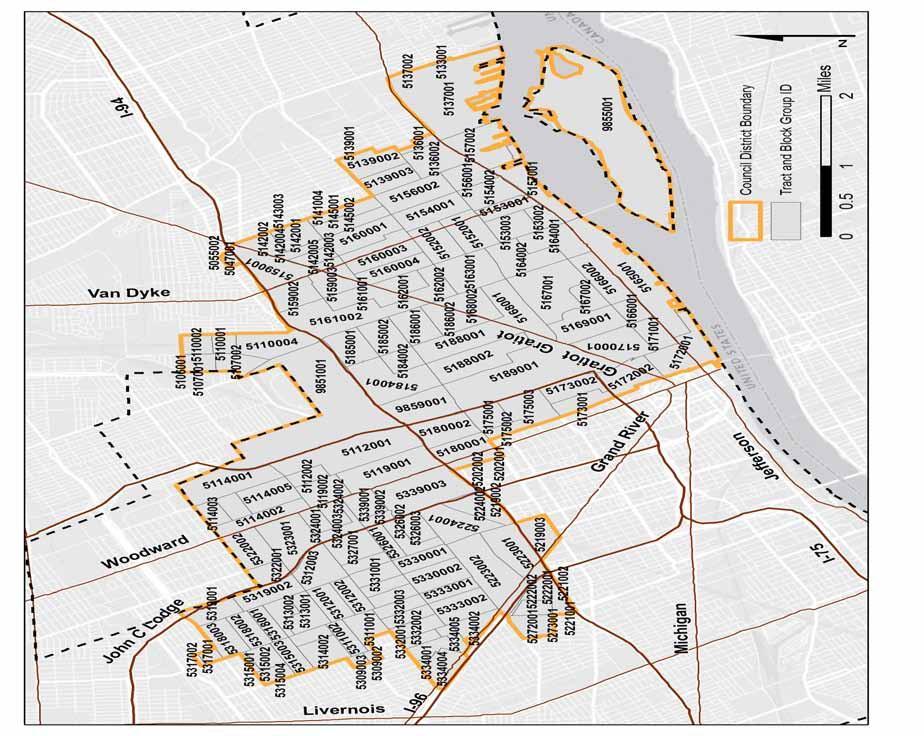
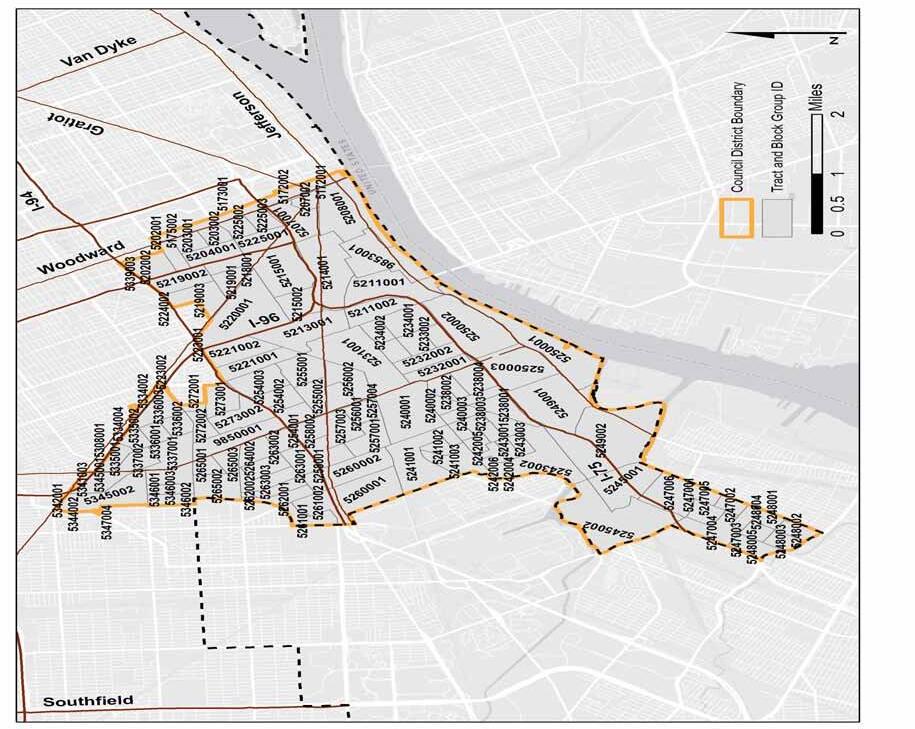
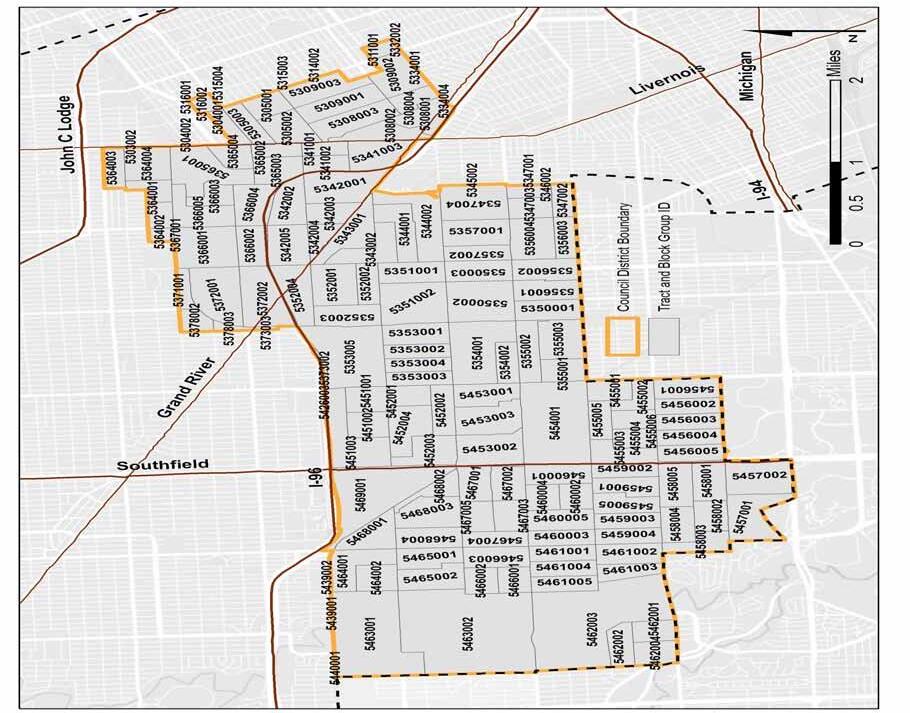
University of Michigan Taubman College of Architecture & Urban Planning