Coastal Shoreland Management for Chikaming Township, MI
A Technical Analysis Report: Spatial Analysis, Scenario-Based Planning & Policy Evaluation for the Chikaming Township Master Plan Update

Prepared for Chikaming Township, Michigan
Authored by

Faculty Advisor
Dr. Richard Norton
University of Michigan
Alfred A. Taubman College of Architecture and Urban Planning
May 2026

Arwa Aldulaimy, Alex Hull, Camille Johnson, Saloni Kapoor, Gembong Kurniadi, Nivedita Patel, Jaylyn Taylor, Qingyu Zhou
Acknowledgement
We would like to thank Mr. David Bunte and the staff at Chikaming Township for the opportunity to contribute to their master plan update and to support the township’s long-term efforts to preserve and strengthen a resilient shoreline through this technical analysis report.
We are also grateful to Dr. Ethan J. Theuerkauf, Francisca Andrea Nunez Ferreira, and their team at Michigan State University for their time and rigorous geospatial work, which underpins the report’s spatial analysis work.
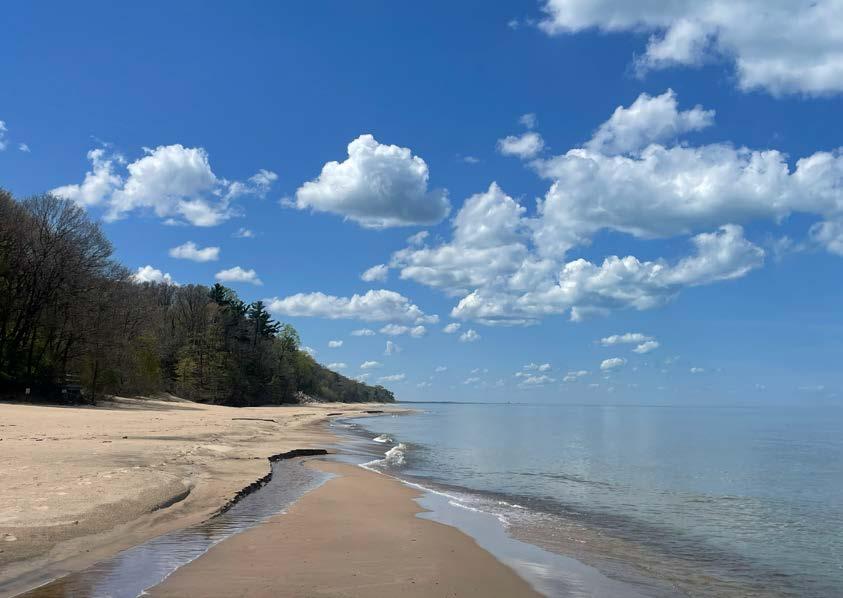
Image Source - Author
List of Figures
Introduction
Figure 1: Location of Chikaming Township(Berrien County, MI) along the Lake Michigan shoreline
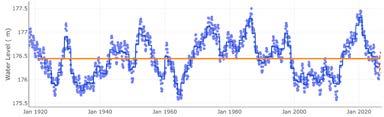
Figure 2 : Hydrograph showing water levels in Lake Michigan and Lake Huron
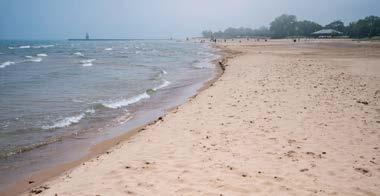
Figure 3: Beach during low water levels along the Great Lakes
Figure 4: “2-step-landward / 1-step-lakeward movement” of the shoreline during high water period
Figure 5: Hard armoring along the shoreline in front of waterfront properties
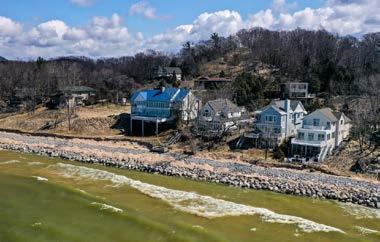
Figure 6: Long-term acceleration of shoreline erosion in neighboring areas around hard armoring structures.
Figure 7: Map illustrating average shoreline projections currently used for shoreland management.
Figure 8: Map illustrating the MLRS line in comparison to average shoreline projection line
Spatial Analysis
Figure 9: Spatial Analysis study area (Chikaming Township, Lake Township, and New Buffalo Township)
Figure 10: Coastal Management Zone(CMZ) within Chikaming Township
Figure 11(a): Development Mapping from 1981 to 2024 - Sawyer Area in North Chikaming
Figure 11(b): Development Mapping from 1981 to 2024 - North Harbert Area
Figure 11(c): Development Mapping from 1981 to 2024 - South Harbert Area
Figure 11(d): Development Mapping from 1981 to 2024 - North Lakeside Area
Figure 11(e): Development Mapping from 1981 to 2024 - South
Lakeside Area
Figure 12: Number of buildings and net rise in buildings in Chikaming Township 1981-2024
Figure 13: Increase in number of buildings by category and net rise in residential buildings in Chikaming Township 1981-2024
Figure 14: Rise in number of residential buildings in Chikaming Township, Bridgman, and New Buffalo between 1981 and 2024
Figure 15: Distribution of seasonal and non-seasonal resident parcels within the CMZ in Chikaming Township
Figure 16(a): Chikaming Township building density, 1981
Figure 16(b): Chikaming Township building density, 2024
Figure 16(c): Chikaming Township new development density, 19812024
Figure 17: Structures with increased building footprint between 19812024
Figure 18(a): Lake Township and Bridgman building density, 1981
Figure 18(b): Lake Township and Bridgman building density, 2024
Figure 19(a): New Buffalo building density, 1981
Figure 19(b): New Buffalo building density, 2024
Scenario-Based Planning
Figure 20: Climate Futures Types
Figure 21: Coastal Management Options
Figure 22 Inset: Zoom A – Lucky Climate Future / HZ
Figure 22: Scenario 1 Map – Lucky Climate Future / HZ
Figure 23 Inset: Zoom B – Lucky Climate Future / EHZ
Figure 23: Scenario 2 Map – Lucky Climate Future / EHZ
Figure 24 Inset: Zoom C – Lucky Climate Future / FBMPZ
Figure 24: Scenario 3 Map – Lucky Climate Future / FBMPZ
Figure 25 Inset: Zoom D – Expected Climate Future / HZ
Figure 25: Scenario 4 Map – Expected Climate Future / HZ
Figure 26 Inset: Zoom E – Expected Climate Future / EHZ
Figure 26: Scenario 5 Map – Expected Climate Future / EHZ
Figure 27 Inset: Zoom F – Expected Climate Future / FBMPZ
Figure 27: Scenario 6 Map – Expected Climate Future / FBMPZ
Figure 28 Inset: Zoom G – Perfect Storm Climate Future / HZ
Figure 28: Scenario 7 Map – Perfect Storm Climate Future / HZ
Figure 29 Inset: Zoom H – Perfect Storm Climate Future / EHZ
Figure 29: Scenario 8 Map – Perfect Storm Climate Future / EHZ
Figure 30 Inset: Zoom I – Perfect Storm Climate Future / FBMPZ
Figure 30: Scenario 9 Map – Perfect Storm Climate Future / FBMPZ
Figure 31: Affected Parcel by Climate Futures
Figure 32: Structures at risk by type
Figure 33 Inset: Zoom J – lakeshore 150’ Set Back from ROHWM
Figure 33: Map with lakeshore 150’ Set Back from ROHWM
Figure 34: Hydrograph highlighting varying periods of rising water levels and a table of the derived potential climate futures.
Figure 35(a): Schematic illustration of various shore erosion lines over time.
Figure 35(b): Schematic illustration various long-term shore erosion lines over time.
Figure 36: Map of the MLRS under a Lucky climate future, and parcels and structures at risk to shoreline recession.
Figure 37: Map of the MLRS under a Expected climate future, and parcels and structures at risk to shoreline recession.
Figure 38: Map of the MLRS under a Perfect Storm climate future, and parcels and structures at risk to shoreline recession.
Figure 39: Map showing parcels and structures at potential risk within the existing 150ft setback fom the OHWM
Policy Analysis
Figure 40: Lake Michigan shoreline in Chikaming township
Figure 41: Cherry Beach, Chikaming Township
Figure 42: Sand dunes along Lake Michigan in Berrien County.
Figure 43: Geotextile tubes along the shoreline
Figure 44: Swash channel on Harbert Beach in Chikaming Township
Figure 45: Community meeting on short-term rentals in Chikaming Township
Figure 46: Native marram grass on the Lake Michigan Shoreline
Coastal Management Considerations
Figure 47: Cherry Beach, Chikaming Township
Figure 48: Lake Michigan shoreline in Chikaming Township
Figure 49: Aerial view of Lake Michigan shoreline in Chikaming Township
List of Tables
Spatial Analysis
Table 01: Types of building categorisation
Scenario-Based Planning
Table 02: Scenario Planning Matrix
Table 03: Development Metrics for Lucky Climate Future / HZ
Table 04: Development Metrics for Lucky Climate Future / EHZ
Table 05: Development Metrics for Lucky Climate Future / Full BMP Zone
Table 06: Development Metrics for Expected Climate Future / Hazard Zone
Table 07: Development Metrics for Expected Climate Future / EHZ
Table 08: Development Metrics for Expected Climate Future / FBMPZ
Table 09: Development Metrics for Perfect Storm Climate Future / HZ
Table 10: Development Metrics for Perfect Storm Climate Future / EHZ
Table 11: Development Metrics for Perfect Storm Climate Future / FBMPZ
Table 12: Scenario Assessment Summary
Table 13: Comparison of HZ vs. EHZ metrics across climate futures, showing the marginal effect of the 50-foot BMP buffer.
Table 14: Development Metrics for 150’ setback from ROHWM
Table 15: Evaluation of parcels at risk in Chikaming Township
Table 16: Summary - Climate Scenarios
Policy Analysis
Table 17: City of Grand Haven Zoning Ordinance, Article IV, Section 40-422
Table 18: City of Grand Haven Zoning Ordinance, Article IV, Section 40-423
Table 19: City of St. Joseph Zoning Ordinance, Article IX, Section 9.6.5
Table 20: Natural Shoreline Management Projects in Michigan
Table 21: Michigan Coastal Management Program Projects
Table 22: Nationwide Permits Program
Table 23: Chikaming Township Master Plan Draft
List of Acronyms
BOD - Beach Overlay District
CMZ - Coastal Management Zone
CZMA - Coastal Zone Management Act
EGLE - Michigan Department of Environment, Great Lakes & Energy
EHZ - Expanded Hazard Zone
FBMPZ - Full Best Management Practice Zone
FEMA - Federal Emergency Management Agency
GIS - Geographic Information System
HZ- Hazard Zone
MCMP - Michigan Coastal Management Program
MLRS - Most Landward Reach of the Shoreline
MPEA - Michigan Planning Enabling Act
MZEA - Michigan Zoning Enabling Act
NFHL - National Flood Hazard Layer
NHD - National Hydrography Dataset
NWI - National Wetlands Inventory
NOAA - National Oceanic and Atmospheric Administration
NREPA - Natural Resources & Environmental Protection Act
NWP - Nationwide Permits
OD - Overlay District
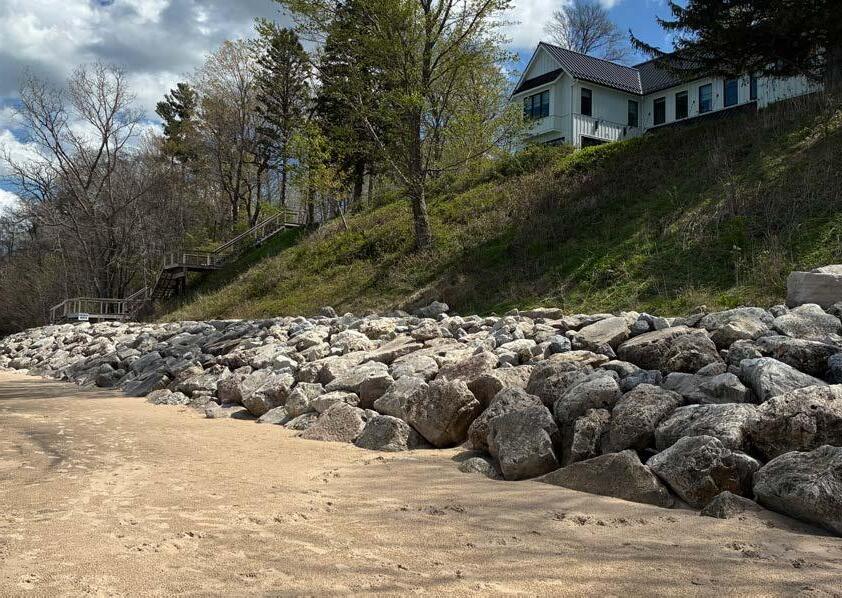
Image Source - Author
Executive Summary
Michigan’s shorelines are a dynamic and constantly shifting environment. The consistent and remorseless long term erosion of the shoreline is complicated by the year-to-year and even day-to-day movement of the shoreline from storms, water levels, and wind action. While these conditions make coastal conditions hard to plan for, they also create enjoyable and popular spaces for recreation and tourism, encouraging people to live close to the water. Chikaming Township has attempted to resolve the conflict between the potential threat to property posed by shoreline erosion and the threat to shoreline conditions posed by the installation of hard shoreline by placing restrictions on the type and duration of shoreline armoring types allowed. As the township updates it’s master plan, this report presents several technical analyzes conducted to assist the township enhance its shoreline preservation efforts. These analyses include a geospatial analysis of Chikaming Township’s development patterns over the past 40 years, along with a pair of scenario planning analyses focusing on storm related flooding and long term shoreline erosion risks, before concluding with a policy analysis that describes best shoreline management practices and presents several potential management possibilities for Chikaming Township to consider.
These analyses provide some key findings.
• First, building density increases closer to the Lake Michigan shoreline, approaching a full build out in a manner akin to that of the coastal communities to the north and south of the township.
• Second, a majority of the properties at risk of inundation-related flooding are located inland, along the township’s creeks and wetlands.
• Third, most of the shoreline erosion risks are borne by shorefront properties.
• Fourth, through our analysis of shoreline erosion risks on a dynamic Great Lake shoreline, we have conceptualized and present here a new way of thinking about and marking high hazard erosion areas, which we identify and map for planning purposes as the most landward reach of the shoreline (MLRS).
Finally, our policy analysis mostly substantiates the policy recommendations in the draft master plan as corresponding to best shoreline management practices, and we further identify several management options the township might consider for future adoption, including the creation of a sensitive area overlay district across the whole of Chikaming Township, the creation of a beach overlay district that incorporates a building setback premised on the MLRS framework, and an amendment to the floodplain overlay district in accordance with the high inland-flooding risks likely to be experienced given climate change, as determined through our scenario-based planning technical analysis.
Introduction
1.1 Background
The Great Lakes are relatively young geological features with long stretches of sandy coastline highly susceptible to erosion, especially along Michigan’s Lower Peninsula. In addition, regional precipitation, storms, winter ice flows, and persistent winds produce dynamic shifts in local water levels and wave severity. These two factors combine to produce shorelines that are highly dynamic, shifting back and forth as sand is taken from and redeposited on the shore, sometimes over the course of a single storm. As a result, the location of the shoreline is not fixed, and the movement of the shoreline in any given place is not uniform but highly variable, dependent on unique wind and wave processes, geographical conditions, and–increasingly–the influence of intensifying storms resulting from global climate change1.
This back and forth pattern is substantially affected by the standing water levels of the lakes, which rise and fall over the course of seasons, years, and decades (see Figure 2). During periods of low water, the shoreline moves lakeward as water levels recede. Sand is deposited on the beach by wave action, causing the beach to grow. During periods of high water, however, shorelines move landward, remorselessly eroding the natural sandy beach. Depending on the length of the period during which standing water levels rise, the landward movement of the shoreline during high-water periods is typically more significant than the lakeward movement during low-water periods, resulting in a net landward shoreline shift in a two-steps-landward, one-step-lakeward dynamic. That dynamic is expected to become even more pronounced given the increased variability in water levels that are, again, resulting from global climate change.
The periodic expansion of Great Lakes beaches during low water periods creates strong pressure to place new development as close to the water’s edge
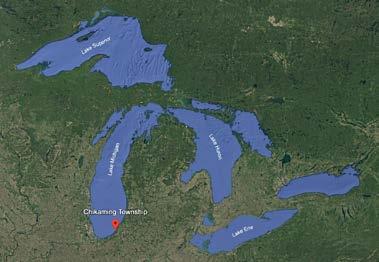
Figure 1: Location of Chikaming Township(Berrien County, MI) along the Lake Michigan shoreline | Source: Google Earth
Figure 2: Hydrograph showing water levels in Lake Michigan and Lake Huron
Source: NOAA Great Lakes Environmental Research Laboratory
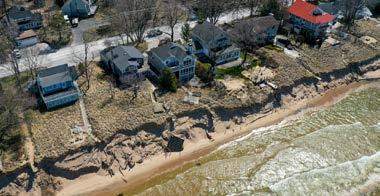
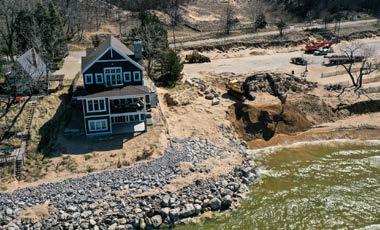
as possible. At the same time, shoreline erosion dynamics increasingly prompt shoreland property owners to want to install hard shoreline armoring to protect their investments, especially during periods of rising-to-high standing water levels. Hard shoreline armoring, however, has long-term consequences. Most prominently, it ultimately leads to the loss of the natural walkable beach, disrupts the access rights of the public, and accelerates erosion, both on neighboring properties and lakeward of the armoring structures themselves. Furthermore, while armoring structures do eventually fail, research indicates that the natural beaches they disrupt take much longer to recover2.
Localities play the predominant role in managing land use and development throughout the U.S., and Michigan’s coastal communities have a substantial responsibility to manage this coastal development—often a contested and contentious endeavor3. Toward that end, Chikaming Township passed Ordinance No. 147 in February 20214. This ordinance prohibits the hard armoring of beachfront properties along the township’s Lake Michigan coastline in order to prevent the “erosion and permanent loss of natural sandy beach lakeward of the armoring”5. Intended to protect the community from public health and safety hazards that result from the degradation of the coastline over time, this ordinance allows property owners to install only short-term sandbags and geotextile tubes to protect their properties from erosion as water levels rise.
Chikaming Township is the first–and as far as we know, the only–township in the state of Michigan to pass such an ordinance against hard armoring for waterfront properties throughout its entire jurisdiction, allowing only softer protective measures. Even so, the township has yet to face enforcement challenges under the ordinance, largely due to the currently low water levels in Lake Michigan. Uncertainty also remains regarding how the township will respond to potential legal challenges once water levels rise and receding shorelines begin to threaten coastal properties that have not been armored.
Figure 3: Beach during low water levels along the Great Lakes | Source: MLive
Figure 4: “Two-steps-landward, one-step-lakeward movement” of the shoreline along a Great Lake coast Source: MLive
1.2 New Approach to Understanding Shoreline Dynamics
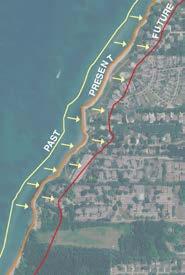
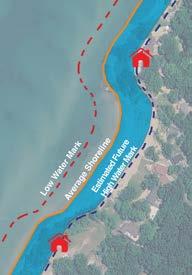
To date, much of the research and practice that grapples with the dynamic changes in shoreline locations along the Great Lakes has characterized those dynamics primarily in terms of the long-term average projection of shoreline location over fixed periods of time (e.g., over a 15-year, 30-year, or 80-year period). Based on those projections, the long-term average shoreline recession of the sandy Great Lakes shorelines has been estimated at approximately 1 foot per year6. The projected location of a shoreline based on a long-term average rate of recession, however, does not reflect the two-steps-landward, onestep-lakeward dynamic that characterizes Great Lakes shoreline dynamics, with periods of relatively high erosion and aggressive landward recession of the shoreline during periods of rising and high water. For shoreland planning purposes, the more appropriate consideration is not the average progression of the shoreline over time but rather the greatest extent to which the shoreline progresses landward during periods of rising-to-high water levels. Even when sandy beaches return as standing lake water levels fall, those areas that had been submerged when water levels were high will quickly erode and become submerged again during the next period of rising-to-high water, such that allowing the development of structures within those areas would be imprudent.
Reflecting the reality of Great Lakes shoreline dynamics, and the prudence of planning for the likely landward recession of the shoreline during future periods of rising-to-high standing water levels (i.e., rather than projected long-term shoreline locations based on long-term average recession rates), the technical analyses conducted here introduce the concept of the most landward reach of the shoreline (MLRS). The MLRS can be mapped as the predicted shoreline location following a specified period of rising water levels for specific segments of the coast7 (see Figure 7 & 8). We were able to estimate different MLRS lines for Chikaming Township by collaborating with and using data provided by researchers with Michigan State University8. Those data were drawn from their extensive study and analysis of shoreline dynamics along Southwest Michigan’s Lake Michigan coast, including extensive data collected during the last period of rising lake water levels–from 2013 through 2020. We used the MLRS primarily for our scenario-based technical assessments, as presented in more detail below.
Figure 5: Hard armoring along the shoreline in front of waterfront properties | Source: MLive
Figure 6: Long-term acceleration of shoreline erosion in neighboring areas around hard armoring structures. | Source: MLive
1.3 Purpose of this Study and Study Area
Chikaming Township is in the process of updating its comprehensive master plan. Supplementing that effort, a group of graduate students in urban and regional planning at the University of Michigan’s Taubman College of Architecture and Urban Planning conducted a research and assessment project addressing coastal shoreland management for the township. Grounded in science-based approaches to shoreline protection, this project aligns with the township’s ongoing work by providing technical support for its planning and zoning efforts and by suggesting additional strategies the township might consider to effectively preserve and sustain its natural coastline. This report is the product of that work.
As part of its responsibilities under the 1972 Coastal Zone Management Act, the state of Michigan has designated a coastal management boundary in order to provide resources and support in favor of management options that limit environmental degradation and property risks. This coastal boundary, which defines the coastal management zone (CMZ) established by Michigan, is the primary area that this report addresses. It encompasses the primary residential and commercial zones subject to Lake Michigan flood and erosion risk in Chikaming Township.
The shoreline zone is predominantly zoned R-1-W (Waterfront Single Family Residential), which is most directly exposed to coastal erosion processes given its adjacency to Lake Michigan. Inland from the shoreline, R-1 (Single Family Residential) parcels predominate. Commercial and mixed-use developments are concentrated along Red Arrow Highway near Harbert and Shorewood Hills, represented by the C (Commercial) and C-H (Harbert Mixed-Use) zones. Two creek corridors visible in the mapping as inland extensions of the flood zone introduce riverine flood exposure to inland properties, a spatial pattern that is central to understanding the distribution of structures at risk of flooding presented below.
The remainder of this report, presenting the methods, findings, and conclusions of our work, consists of three sections: a spatial analysis of development
patterns in the township and neighboring communities, provided primarily for context; technical scenario-based assessments of potential future coastal area flooding and shoreline recession along with corresponding management options, provided to support a full, community-engaged scenario-based planning effort should the township undertake such an effort; and a policy analysis to supplement the community’s ongoing shoreline planning and management efforts more broadly.
Figure 7: Left - Map illustrating average shoreline projections currently used for shoreland management.
Figure 8: Right - Map illustrating the MLRS line in comparison to average shoreline projection line
End Notes
1. The information presented in the introduction to this report is drawn from various sources, including the following:
• Shifting sands: Michigan’s great lake shores. (n.d.). https://www. michbar.org/journal/Details/Shifting-sands-Michigans-great-lakeshores?ArticleID=4447
• Michigan Coastal Management Program. (2023). Resilient Coastal Communities Planning Guide. https://www.michigan.gov/egle/-/ media/Project/Websites/egle/Documents/Programs/WRD/CoastalManagement/Resilient-Coastal-Communities-Planning-Guide.pdf
• Norton, R., Meadows, G., & Meadows, L. (2013). The deceptively complicated “elevation ordinary high water mark” and the problem with using it on a Laurentian Great Lakes shore.Journal of Great Lakes Research, 39(4), 527-535. http://doi.org/10.1016/j.jglr.2013.09.008
• Richard K. Norton, Nina P. David, Stephen Buckman, Patricia D. Koman, Overlooking the coast: Limited local planning for coastal area management along Michigan’s Great Lakes, Land Use Policy, Volume 71, 2018, Pages 183-203,ISSN 0264-8377, https://doi.org/10.1016/j. landusepol.2017.11.049.
2. Richard K. Norton, Guy A. Meadows, Oday Salim, Matthew Piggins, Phillip Washburn & Lauren A. Week, Armor or Withdraw? Likely Litigation and Potential Adjudication of Shoreland Conflicts Along Michigan’s Shifting Great Lake Coasts, 12 MICH. J. ENVTL. & ADMIN. L. 153 (2023).
3. Richard K. Norton, Nina P. David, Stephen Buckman, Patricia D. Koman,
Overlooking the coast: Limited local planning for coastal area management along Michigan’s Great Lakes, Land Use Policy, Volume 71, 2018, Pages 183-203,ISSN 0264-8377, https://doi.org/10.1016/j.landusepol.2017.11.049.
4. Township of Chikaming Berrien County, Michigan Ordinance No. 147. (2021). https://www.chikamingtownship.org/s/Ordinance147.pdf
5. Township of Chikaming Berrien County, Michigan Ordinance No. 147. (2021). https://www.chikamingtownship.org/s/Ordinance147.pdf
6. Richard K. Norton, Guy A. Meadows, Oday Salim, Matthew Piggins, Phillip Washburn & Lauren A. Week, Armor or Withdraw? Likely Litigation and Potential Adjudication of Shoreland Conflicts Along Michigan’s Shifting Great Lake Coasts, 12 MICH. J. ENVTL. & ADMIN. L. 153 (2023).
7. The MLRS can be conceptualized as the likely future location of the natural ordinary high water mark (NOHWM) following a period of rising lake levels and extensive shoreline recession. The NOHWM is that line along the shore where there is physical evidence of the presence of lake water and the line demarcating dry upland from submerged bottomland in the past, marking also the line below which the public enjoys Michigan public trust doctrine rights to traverse along the shore. See Norton, Meadows, and Meadows (2013).
8. Dr. Ethan J. Theuerkauf, Assistant Professor, Department of Geography, Environment and Spatial Sciences, College of Social Science, Michigan State University and Francisca Andrea Nunez Ferreira, Research Scientist, Michigan State University
(page intentionally left blank)
Spatial Analysis
2.1 Introduction
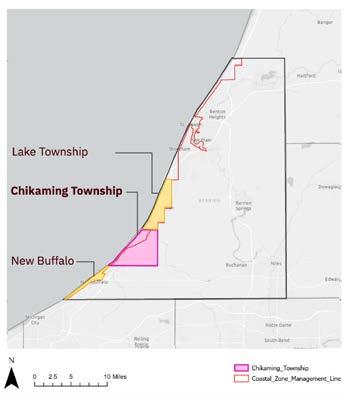
In order to better understand the historic development patterns in Chikaming Township, we digitized building footprints within the township’s coastal management zone (CMZ), and then performed a range of spatial analyses on them. We performed similar digitizations and spatial analyses in the CMZ’s of Lake and New Buffalo Townships, which border Chikaming Township to the north and south respectively, in order to better understand the coastal development context along the larger Southwest Michigan shore. Using the information gathered, we derived insights into Chikaming Township’s development patterns, looking at building counts and typography and the seasonality of homeowners in the CMZ, before finally performing a development density analysis to get a better sense of where people have been building in the township.
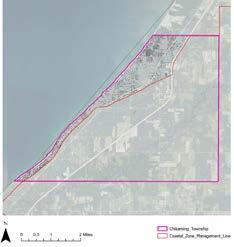
Figure 9: Left - Spatial analysis study area (Chikaming Township, Lake Township, and New Buffalo Township)
Figure 10: Right - Coastal Management Zone (CMZ) within Chikaming Township
2.2 Methodology
2.2.1 Methods
1. Digitizing the Building Footprint Across Five Decades
In order to identify the building footprints within Chikaming Township’s CMZ, we manually digitized all visible buildings for geospatial information systems (GIS) spatial analysis, using ArcGIS Pro. To enable contextual analyses, we performed the same work for the CMZs of the townships to the north and south of Chikaming Township. This work was aided by the Microsoft Building Footprints published on ArcGIS, which was an incomplete but useful baseline from which to work. Using that data layer as the base, we then manually digitized the rest of the CMZ, employing the following steps:
Building Categorisation
Commercial
C_Outbuilding
Governmental
Industrial
I_Outbuilding
• We used a total of five compiled aerial imageries as base layers from the years 1981, 1997, 2010, 2016, and 2024. The imageries were acquired from USDA (2010, 2016, 2024) and USGS Earth Explorer (1981, 1997).
• Once imported into ArcGIS Pro, we manually identified each structure visually and then traced its silhouette as a polygon, following the silhouette. For buildings pre-identified by Microsoft Building footprints, we verified the accuracy of the polygons provided, and we manually adjusted them in cases to correct inaccuracies.
• Finally, we assigned each structure to one of the following land-use categories (see Table 01), for use in later analyses:
Description
Buildings for commercial activities
Smaller, non-primary structures of the commercial building
Public buildings for purposes including but not limited to education, governance, healthcare, or public safety
Structures used for industrial and manufacturing purposes; generally not open to the public
Smaller, non-primary structures of the industrial building
Maritime Marina, lighthouses, boat yards
Private_Recreation
Public_Recreation
Private parks, private campgrounds, beach clubs, private pavilions
Public parks, public campgrounds, public restrooms, public pavilions
Religious Churches, chapels, etc.
Residential
R_Outbuilding
Unknown
A building that is developed to live in
Smaller, non-primary structures of the residential building
Unknown land-use
Table 01 - Type of building categorisation
2. Property Parcel Mapping for Seasonal Residence Analysis
According to the American Community Survey 2022 (Chikaming Township Master Plan, 2026, p. 38), approximately 60.4% of the township’s housing stock is used as seasonal residences or short-term rentals. This information is provided by the draft Chikaming Township Master Plan, but that draft does not elaborate or map in detail where those seasonal properties are located. We used GIS accordingly to better understand the spatial distribution of those seasonal residences, employing the following steps:
• We acquired detailed property-parcel-level shapefile data of Berrien County in 2024 from Regrid9, a parcel information platform for the U.S., accessible in the endnotes.
• Using ArcGIS Pro, we clipped the geographic extent of the CMZ in Chikaming Township to limit our analysis to the coastal region.
• Using the shapefile data identifying property owner name, physical address, mailing address, FEMA risk level, and related attributes, we conducted a matching test between the city and state name of the physical and mailing addresses. Assuming that properties for which the property owner address differs from the parcel address are properties not used as permanent residences, we identified those properties as seasonal.
3. Development Analysis
Visual observations of five satellite images dating from 1981, 1997, 2010, 2016, and 2024, reveal how Chikaming Township has developed over the years. To identify the specific density hotspots within Chikaming Township from the beginning of the study period (1981) through its conclusion (2024), we conducted a density analysis. Furthermore, utilizing this density analysis, we also drew comparisons with neighboring areas situated to the north and south of Chikaming Township.
Given that the boundaries of the CMZ vary across individual townships, we established a buffer zone to serve as the designated study area for our density analysis. This buffer zone was generated by applying a 900-foot buffer to the township’s 2020 shoreline; we designated this specific zone as the “nearshore
coastal area.” Subsequently, we executed the density analysis tool within ArcGIS, thereby generating a raster image that visually delineates the various density zones within the defined study areas.
2.3 Spatial Analysis Findings
2.3.1 Chikaming Township’s Development 1981-2024
Using manual digitization of five satellite images in Berrien County, we developed building footprint maps of the Coastal Management Areas of Chikaming Township, Lake Township (Bridgman), and New Buffalo. Figure 11(a) to 11(e) presents a series of maps illustrating the progression of development in Chikaming Township over time–between 1981 and 2024–based on our mapping. Our observations indicate that the majority of development occurred prior to 1981. By 1981, building density began to appear in the northern and southern strips within the coastal management area in Chikaming Township.
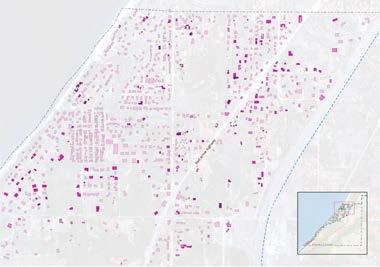
Figure 11(a): Development Mapping from 1981 to 2024 - Sawyer Area in North Chikaming
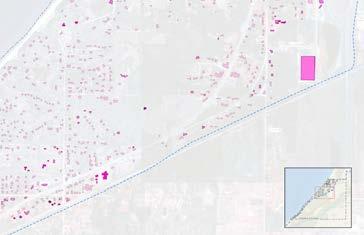
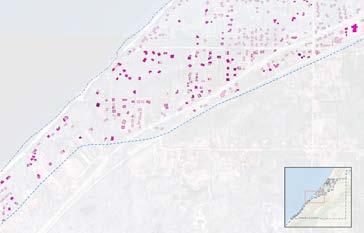
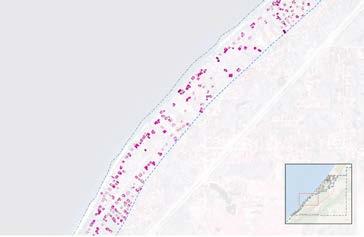
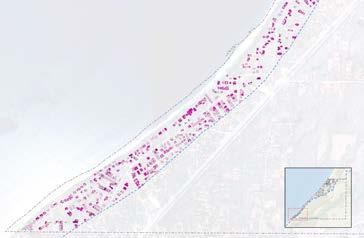
Figure 11(b): Development Mapping from 1981 to 2024 - North Harbert Area
Figure 11(d): Development Mapping from 1981 to 2024 - North Lakeside Area
Figure 11(c): Development Mapping from 1981 to 2024 - North Harbert Area
Figure 11(e):Development Mapping - South Lakeside Area
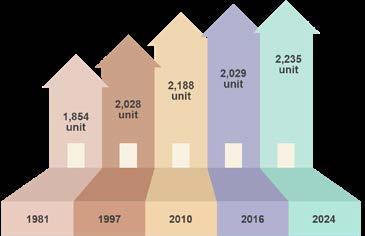
Based on our observations, the number of buildings within Chikaming Township’s CMZ increased from 1,854 structures in 1981 to 2,235 in 2024, showing steady development over the past four decades (see Figure 12). The five-year data show that growth occurred earlier in the study period, with 334 new structures built between 1981 and 2010, while development slowed considerably after 2010 with only modest increases.
To further understand development patterns in Chikaming Township, we categorized our building footprint data based on their function. The three categories with the highest numbers are residential, outbuildings (such as sheds, residential garages, and other accessory buildings), and commercial buildings. As illustrated by Figure 13, residential buildings dominate the coastal


zone, accounting for the vast majority of structures across all years. Between 1981 and 2024, residential buildings alone increased by 314 units, while other categories such as outbuildings and commercial structures grew only slightly.
Comparing Chikaming Township to neighboring coastal areas shows that development growth has occurred across the region, but at different rates.
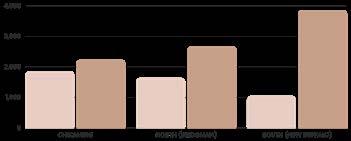
Between 1981 and 2024, Chikaming Township added 381 buildings, while Lake Township to the north of Chikaming Township added 1,041 residences (primarily in the city of Bridgman) and New Buffalo Township to the south added 2,809, suggesting that Chikaming Township has reached a peak in residential buildout earlier than the neighboring areas (see Figure 14).
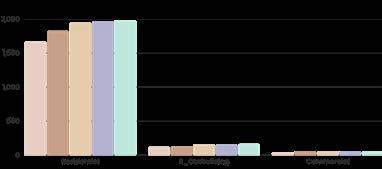


Figure 12: Number of buildings and net rise in buildings in Chikaming Township 1981-2024
Figure 13: Increase
Chikaming


2.3.2 Seasonal Residence Analysis
Using the methodology described above to determine whether a parcel was a seasonal residence, we mapped the locations of parcels corresponding to seasonal and year-round properties (see Figure 15), and we determined the numbers of seasonal parcels situated adjacent to the Lake Michigan Shoreline (73%), within the nearshore coastal area (65%), and within the entire CMZ (58%). The majority of the properties in the CMZ are owned by residents who only inhabit those properties seasonally, with the share increasing from 58% within the CMZ to 73% immediately adjacent to the shoreline. These percentages are roughly in line with American Community Survey data regarding the proportion of properties in the whole of Chikaming Township that are seasonal or short term rentals, but the geographic distribution indicates that seasonal properties are more concentrated closer to the shore.
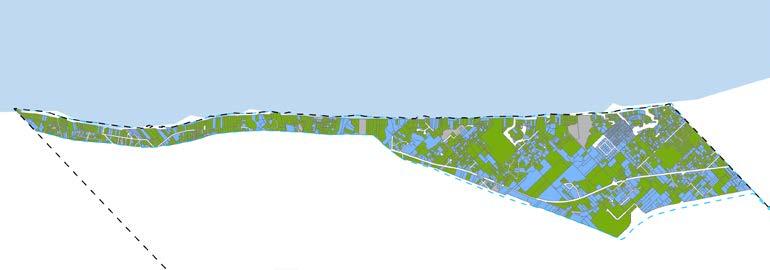
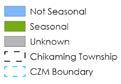


Figure 15: Distribution of seasonal and non-seasonal resident parcels within the CMZ in Chikaming Township
Figure 14: Rise in number of residential buildings in Chikaming Township, Bridgman, and New Buffalo between 1981 and 2024
2.3.3 Density Analysis
1. Chikaming - 1981 and 2024
Comparing the density maps of Chikaming Township for 1981 and 2024, no substantial differences are apparent. This is partly because much of the development had already occurred prior to 1981. As shown in the 1981 density map, building density was concentrated in the northern and southern portions of the nearshore buffer area. The 2024 map indicates only a slight increase in density in the southern section, largely driven by infill development between
existing structures, but no significant changes in the density distribution. Similarly, while we identified 190 buildings within the CMZ that appear to have been expanded in terms of footprint area (see Figure 17), particularly in the southern sector of the township around Union Pier, there has been little visual change in density over these years of development (see Figure 16(c)).
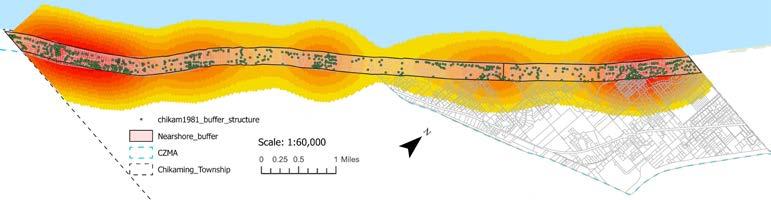
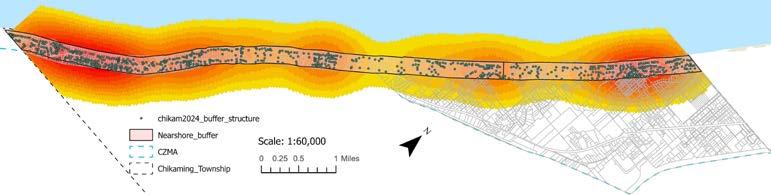
Figure 16(a): Chikaming Township building density, 1981
Figure 16(b): Chikaming Township building density, 2024.
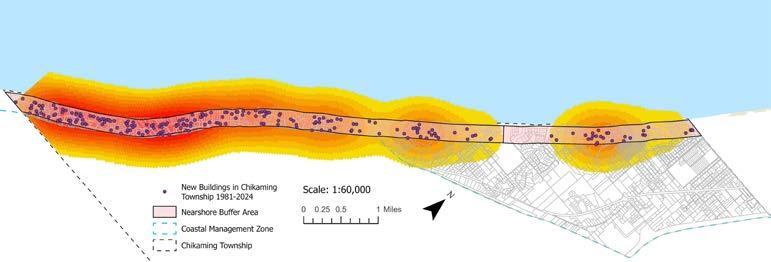
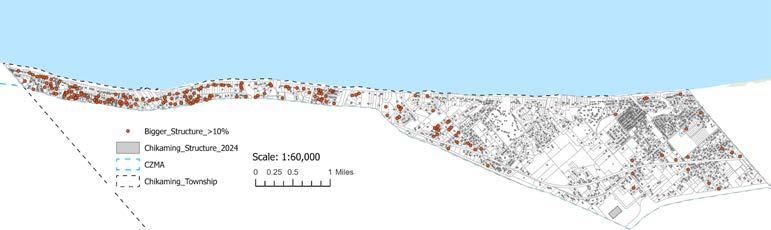
Figure 16(c): Chikaming Township new development density, 1981-2024
Figure 17: Structures with increased building footprint between 1981-2024
2. Bridgman - 1981 and 2024
In Bridgman, development remains more localized and clustered, with clear concentrations in specific areas rather than continuous spread along the shoreline. The presence of protected lands, such as Warren Dunes State Park and Grand Mere State Park, has limited development along those respective shorelines and created breaks in the density pattern in the nearshore buffer area.
Looking at Bridgman as a whole, development is thus more concentrated in the center area, rather than along the entire shoreline. This contrasts significantly with Chikaming Township, where development within the entire nearshore area has been more intense compared to development further landward within the larger CMZ.
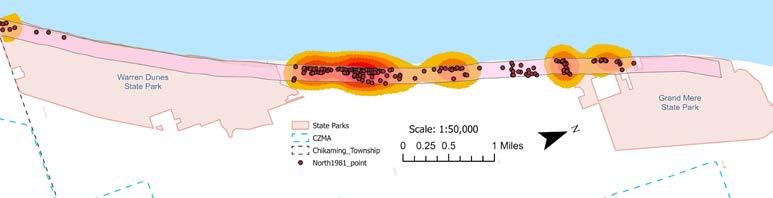
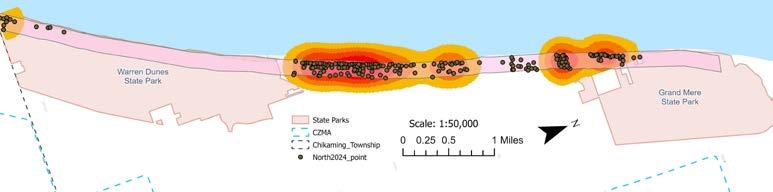
Figure 18(a): Lake Township and Bridgman building density, 1981.
Figure 18(b): Lake Township and Bridgman building density, 2024.
3. New Buffalo - 1981 and 2024
In New Buffalo, development density increased substantially from 1981 to 2024, with larger and more connected high-density clusters emerging over time. Areas that were previously fragmented or low-density have transitioned into more continuous development zones. This reflects a stronger growth trajectory compared to Chikaming Township, with ongoing expansion and
intensification of coastal development. Looking at the density maps from three areas (see Figures 16, 18 & 19), Chikaming Township shows a development pattern similar to that of the surrounding areas. However, Chikaming Township is growing at a slower rate because compared to its neighbours, it appears to have approached a peak in residential build out earlier than its neighbors.
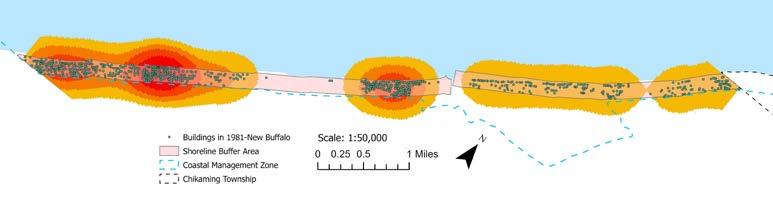
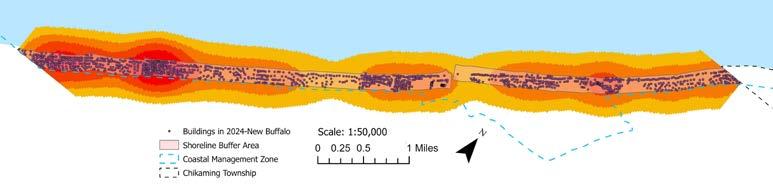
Figure 19(a): New Buffalo building density, 1981.
Figure 19(b): New Buffalo building density, 2024.
End Notes
9. Regrid is a data company that specializes in land parcel data and property information databases. Its webpage can be accessed here.https://regrid.com
(page intentionally left blank)
Image Source - Author
Decision-Centered Scenario-Based Planning
This section presents technical analyses provided to support scenariobased planning for Chikaming Township, addressing two types of coastal risks - risks associated with:
03.01. Coastal Flooding
03.02. Coastal Shoreline Recession
For flood-related risks, the work presented here is grounded in the decision-centered scenario planning framework developed by Norton et al.(2019),10 which situates planning interventions within a matrix of plausible futures and management options. What makes this framework decisioncentered is the specific combination of two dimensions: parameters that a community cannot change–future climate conditions–and parameters the community can change–land management approaches.
For the coastal shoreline recession scenario analysis, we focused solely on the uncontrollable parameters–potential recession rates associated with uncertain future standing lake water levels. We address potential management options given those uncertain physical dynamics through the policy analysis presented in Section 4 of this report. Crucially, the two primary coastal hazards correspond to two different geographic areas: coastal shoreline recession threatens lakes-adjacent homes, but those homes are relatively insulated from storm-based flood events given the topography of Chikaming Township’s Lake Michigan shoreline, while inland creek-adjacent properties are not at risk of coastal erosion, yet face increased exposure to storm-based flooding. Our work on floodrelated risks follows directly from the prior work of Norton et al. (2019); the work presented here on shoreline recession is new and unique.
03.01 Scenario Planning - Coastal Flooding
3.1.1. Introduction
This section presents a scenario-planning-based spatial analysis of parcels and structures exposed to flood risks within Chikaming Township’s Coastal Management Zone (CMZ). In brief, we evaluated risks associated with physical coastal processes–the parameters localities cannot change but also cannot precisely predict–in terms of likely future storm events coupled with varying standing lake water levels. Drawing from prior work, uncertainty regarding the intensity of those risks are presented as a best-case, moderate-case, and a worst-case array, labeled for convenience as Lucky, Expected, and Perfect Storm climate futures, respectively.
We evaluated potential responses to those uncertain climate future risks–that is, the coastal management options localities can change–by accounting for different potential coastal management areas, or how large of an area the township might decide to manage with respect to coastal hazards. For this project, we identified three distinct potential coastal management areas, labeled for convenience as the Hazard Zone (HZ), the Expanded Hazard Zone (EHZ), and the Full Best Management Practice Zone (FBMPZ).
We then combined the spatial area associated with each of the three climate futures with the spatial area associated with each of the three coastal management areas to yield nine distinct scenarios, as detailed below. Finally, we evaluated each of those nine scenarios across four metrics: number of parcels, total acreage, existing structures, and potentially constrained vacant parcels within each climate future and coastal management area combination. This approach provides Chikaming Township with an assessment of the scale and distribution of flood exposure under current conditions and the degree to which different coastal management area options could constrain future development in high-risk areas.
3.1.2. Methodology
We conducted the scenario-based analysis presented here using a GIS-based methodology applied to the zones across three potential climate futures and three potential coastal management areas, producing nine distinct decisioncentered scenario combinations. The workflow was designed to be replicable and transparent and is directly linked to the regulatory standards of the Chikaming Township Zoning Ordinance. It is important to note that while this analysis builds from the decision-centered scenario planning approach of Norton et al. (2019), that original methodology required use of a GIS application to frame the management options parameter of the assessment, which consisted of a current-conditions, full-buildout, and moderated-buildout array of management options. That GIS application is no longer available. Because we could not use GIS to estimate a full buildout projection rigorously, and given the extensive buildout that has already occurred within the nearshore coastal area of the township, we reconceptualized the management options for analysis here. Specifically, rather than modeling different buildout futures, the analysis here contemplates different spatial areas the township might specify for managing coastal shoreland flooding risks.
1. Climate Futures
Lake Michigan water levels have historically fluctuated by as much as six feet over multi-year cycles, with recent years recording near-record-high water levels. Higher base lake levels amplify the reach and damage potential of storm surge associated with differing intensities of potential storms. Given uncertainties associated with those physical processes, the three climate futures evaluated in this analysis represent a range of plausible conditions: a. Lucky: The spatial area encompassed by a Lucky climate future storm is based on the historical low standing water level for Lake Michigan and the area mapped by the Federal Emergency Management Agency (FEMA) as
subject to the 2% annual chance storm (FEMA zones AE, A). That area totals 663 acres.
b. Expected: The spatial area encompassed by an Expected climate future storm is based on the long-term average standing water level for Lake Michigan and the area mapped by FEMA as subject to the 1% annual chance storm (FEMA flood layer zones AE, A, AO). It totals 693 acres.
c. Perfect Storm: The spatial area encompassed by a Perfect Storm climate future storm is based on the historical high standing water level for Lake Michigan and the area mapped by FEMA as subject to the 0.2% annual chance storm (FEMA flood layer zones AE, A, AO, VE, and Shaded X). By incorporating the FEMA VE zones, which capture areas subject to highvelocity waves, in addition to Shaded X zones, which capture areas subject to the most extreme storms mapped by FEMA, the Perfect Storm climate future also accounts for risk from substantial storm surge. This area totals 717 acres.
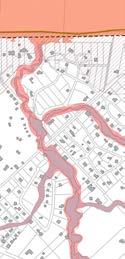
As seen in Figure 20, two types of flooding are captured across these scenarios. Coastal flooding affects parcels along the Lake Michigan shoreline. Riverine flooding affects properties along the creek corridors that extend inland through the township and that drain directly to Lake Michigan. Because they are connected directly to the lake and thus are influenced by standing lake water levels, they warrant consideration as part of a coastal management assessment, even though we refer to those properties as riverine properties here. As detailed below, under the Lucky climate future, the flooding risk is predominantly riverine. Under the Expected and Perfect Storm climate futures, both coastal and riverine properties are at risk.
2. Coastal Management Options
The three coastal management options evaluated for this assessment (see Figure 21), characterized as three potential coastal management areas, include
Lucky
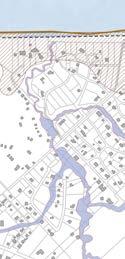
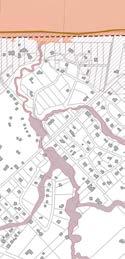
Figure 20: Climate Futures Types the following:
a. Hazard Zone (HZ): The HZ includes only that area expected to experience direct flood inundation and high-energy wave action associated with each of the three climate futures, derived from the FEMA flood zones and standing water levels as detailed above. This management option represents the least protective of the three possible options, relying on existing FEMA flood maps and essentially discounting likely increases in flooding hazards associated with climate change.
b. Expanded Hazard Zone (EHZ): The EHZ incorporates the HZ plus a 50-foot buffer applied outward from the flood-extent boundary. This management
option is intended to account for the likely increase in coastal flooding risks that will occur in the foreseeable future as a result of climate change. That is, the added buffer captures areas likely to be affected by flooding but not currently mapped as part of existing high-risk flood zones. The 50-foot distance is one commonly used for such buffers but is arbitrary, not tied closely to a scientific rationale.
c. Full Best Management Practice Zone (FBMPZ): The FBMPZ represents the combined area of the EHZ, a 50-foot buffer around all streams, and a 50-foot buffer around all wetlands. It represents a full conservation management zone, incorporating both the flood hazard zone anticipated to be at risk in the foreseeable future given climate change, captured by the EHZ, and the township’s wetland and stream networks, adding water quality benefits alongside flood risk considerations.
3. Assessment Areas
The assessment areas reflect the combination of the two distinct areas associated with climate-related flood risk and management approach. Given those two parameters, assessment areas increase in size as the climate future moves from Lucky to Expected to Perfect Storm, reflecting the larger area at risk from flooding and high-energy waves and storminess as climate change intensifies. Similarly, assessment areas also increase in size when moving from HZ to EHZ to FBMPZ, reflecting the increased area actively managed to address flood risks. Given this approach, the spatial areas of the two parameters for the three climate future / management option scenarios encompassing only Hazard Zones are one and the same.
4. Development Metrics
Both the climate futures and coastal management options are evaluated using four development metrics across the nine scenario combinations, measured within the corresponding assessment areas noted above, as shown in Table 02:
a. All Existing Buildable Parcels: Count of all parcels with an area ≥ 20,000 sq ft that intersect with the respective coastal management option area (i.e., HZ, EHZ, or FBMPZ), including both vacant and developed parcels.
A parcel is classified as buildable if its gross area is greater than or equal to 20,000 square feet. This threshold reflects the minimum lot size for residential development under §4.02 of the Chikaming Township Zoning Ordinance11 and serves as a conservative proxy for buildability across the mixed residential and commercial zones in the study area.
b. Existing Buildable Area (acres): Sum of gross parcel acreage for all qualifying buildable parcels intersecting the coastal management area.
c. Existing Structures: Count of existing buildings on all parcels intersecting the coastal management area, categorized into coastal, riverine, and wetland structures based on their location.
d. Vacant Buildable Parcels Potentially Constrained: Vacant parcels for which the net area remaining outside the coastal management area associated with the scenario is less than 940 sq ft, which is the minimum allowable dwelling unit size specified by §4.02 of the Chikaming Township Zoning Ordinance.
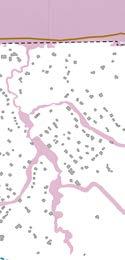
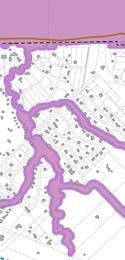
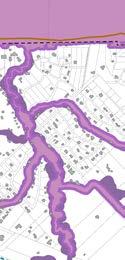
Figure 21: Coastal Management Options
Expanded Hazard Zone (EHZ ) Full Best Management Practice Zone (FBMPZ)
Hazard Zone (HZ)
Coastal Management Area /
Development Metrics
All Existing Buildable Parcels
Existing Buildable Area (acres)
Existing Structures
Vacant Buildable Parcels
Potentially Constrained
5. Data Sources
All spatial analysis was conducted in ArcGIS Pro. Spatial data for this analysis were drawn from the following sources:
a. FEMA’ National Flood Hazard Layer (NFHL) Viewer for flood zone layers (AE, A, AO, VE, Shaded X);12
b. McKenna Associates parcel and CMZ boundary GIS data for Chikaming Township;
c. Regrid parcel-level property data;13
d. USGS National Hydrography Dataset (NHD) stream corridor layers;14
e. USFWS National Wetlands Inventory (NWI) wetland delineation layers;15 and
f. Michigan EGLE Critical Dune Area designation data.
3.1.3. Findings
The following subsections present findings for each of the nine scenarios, organized by climate future and coastal management zone area. Each scenario is supported by a map showing buildable parcels intersecting the coastal management within the CMZ boundary, with existing structures symbolized separately.
1. Lucky Climate Future
a. Scenario 1: Lucky Climate Future / HZ
The Lucky flood extent is the most conservative scenario in terms of accounting for and addressing potential flood risks proactively. The inundation area is narrow and closely follows the creek corridors. The exposed parcels are predominantly R-1 single-family. Under this scenario, 96 buildable parcels and 280 acres fall within the HZ, with 12 existing structures at risk, all located in the riverine flood zone (see Table 03 and Figure 22). No vacant buildable parcels are potentially constrained, meaning that under the most optimistic climate conditions, the Hazard Zone alone does not prevent development on any currently vacant parcel.
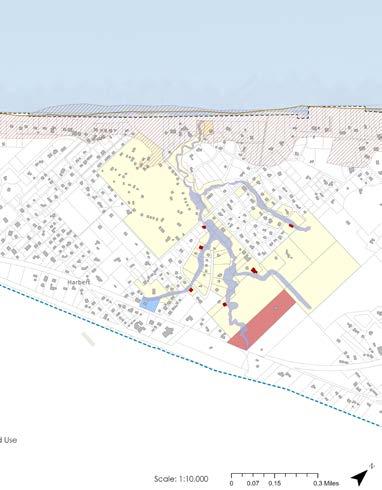
Figure 22 Inset: Zoom A – Lucky climate future / HZ (Full map on next page — see Figure 22)
Table 03: Development Metrics for Lucky climate future / HZ
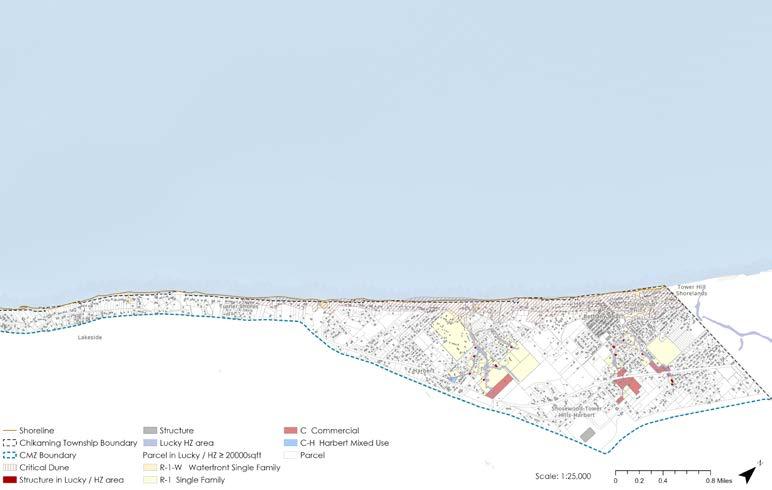
Figure 22: Scenario 1 Map – Lucky climate future / HZ
b. Scenario 2: Lucky Climate Future / EHZ
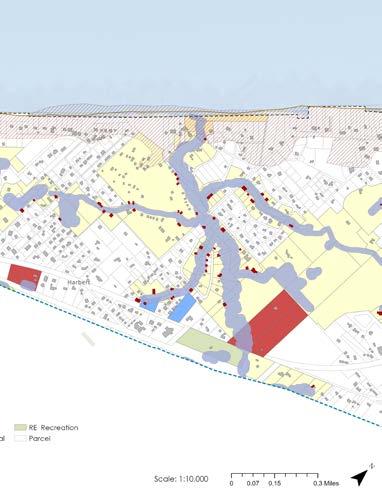
Adding the 50-foot buffer to the Lucky HZ immediately reveals a critical spatial pattern: a substantial number of structures are situated just beyond the existing FEMA-mapped flood boundary. The EHZ captures 124 buildable parcels and 329 acres, which is a 29% increase over Scenario 1, and the count of structures at risk increases from 12 to 54, all located in the riverine flood zone (see Table 04 and Figure 23). This disproportionate increase in structures relative to parcels confirms that development is clustered at the flood zone edge. One vacant buildable parcel is now potentially constrained. The 50-foot buffer is therefore a more proactive regulatory tool, not simply because it covers more land, but because it reaches the concentration of built structures that the Hazard Zone boundary narrowly misses.
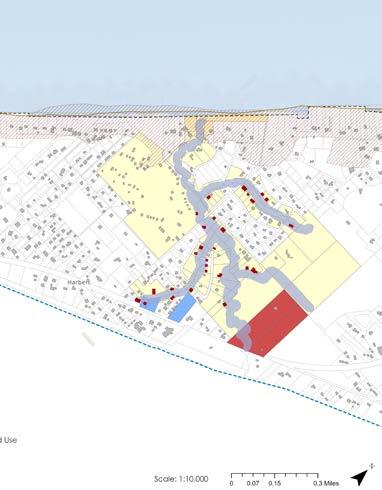
Table 04: Development Metrics for Lucky climate future / EHZ
Figure 23 Inset: Zoom B – Lucky climate future / EHZ
(Full map on next page — see Figure 23)
RedArrowHighway
Linwood
HarbertRoad
PrairieRoad
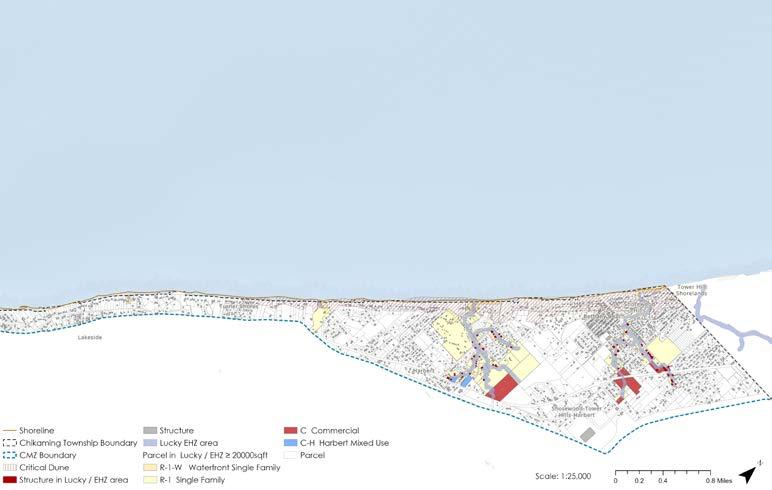
Figure 23: Scenario 2 Map – Lucky climate future / EHZ
c. Scenario 3: Lucky Climate Future / FBMPZ
The Full BMP Zone under the Lucky climate future represents the most protective management option for the best-case scenario. By adding 50-foot buffers around all wetlands and ephemeral streams, the FBMPZ expands coverage significantly, resulting in 270 buildable parcels, 787 acres, and 125 structures total at risk (see Table 05 and Figure 24). This is the only management area where wetland structures appear, and hence the increase from 124 parcels in the EHZ to 270 in the FBMPZ reflects the significant reach of the stream and wetland buffer networks across the township. Two vacant buildable parcels are potentially constrained.
Table 05: Development Metrics for Lucky climate future / FBMPZ
RedArrowHighway
Linwood
HarbertRoad
PrairieRoad
Figure 24 Inset: Zoom C – Lucky climate future / FBMPZ (Full map on next page — see Figure 24)
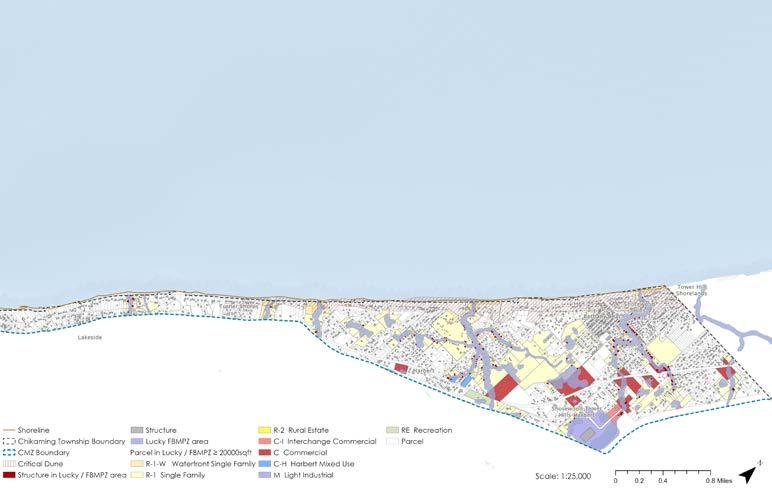
Figure 24: Scenario 3 Map – Lucky climate future / FBMPZ
2. Expected Climate Future
a. Scenario 4: Expected Climate Future / HZ
Shifting to the Expected climate future produces a significant increase in parcel exposure. The Expected climate future / HZ coastal management area combination alone captures 212 buildable parcels and 447 acres potentially at risk, more than double the Lucky / HZ count of 96. Despite this, the existing structure count remains at 12, all located in the riverine flood zone (see Table 06 and Figure 25). One vacant buildable parcel is potentially constrained. This scenario indicates that increasing climate severity will be a primary driver of parcel-level exposure, even when structure counts remain relatively stable.
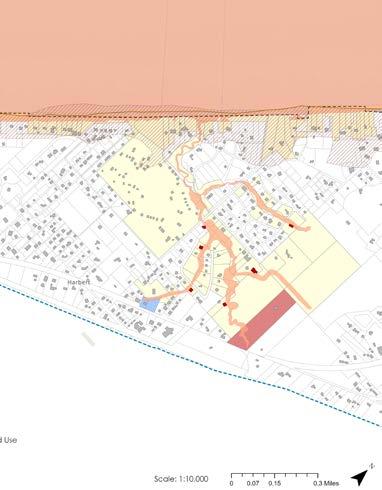
Table 06: Development Metrics for Expected climate future / HZ
Figure 25 Inset: Zoom D – Expected climate future / HZ
(Full map on next page — see Figure 25)
RedArrowHighway
Linwood
HarbertRoad
PrairieRoad
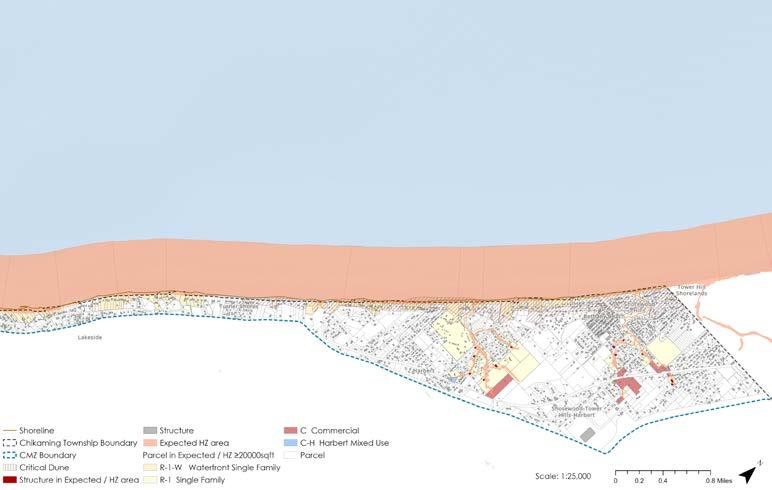
Figure 25: Scenario 4 Map – Expected climate future / HZ
b. Scenario 5: Expected Climate Future / EHZ
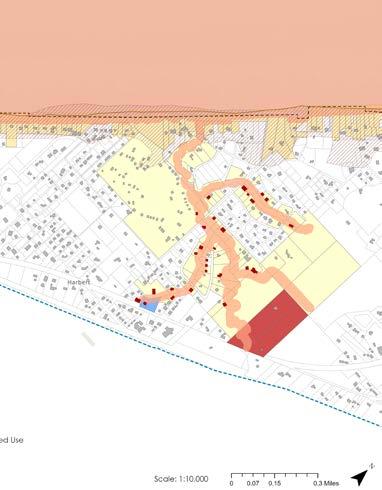
Adding the 50-foot for the EHZ and combining it with the coastal management area under the Expected climate future produces the same amplification pattern seen in the Lucky scenarios. The Expected / EHZ scenario captures 288 buildable parcels and 529 acres, a 36% increase over the Expected / HZ scenario, and structure counts rise from 12 to 55, consistent with the pattern of development clustered just outside the flood boundary (see Table 07 and Figure 26). For the first time, one coastal structure is captured in addition to the 54 riverine structures, reflecting the buffer beginning to reach the lakeshore fringe as the underlying flood zone expands. Five vacant buildable parcels are potentially constrained, representing future development pressure points where regulatory intervention could proactively prevent additional exposure.
RedArrowHighway
Linwood
HarbertRoad
PrairieRoad
Table 07: Development Metrics for Expected climate future / EHZ
Figure 26 Inset: Zoom E – Expected climate future / EHZ (Full map on next page — see Figure 26)
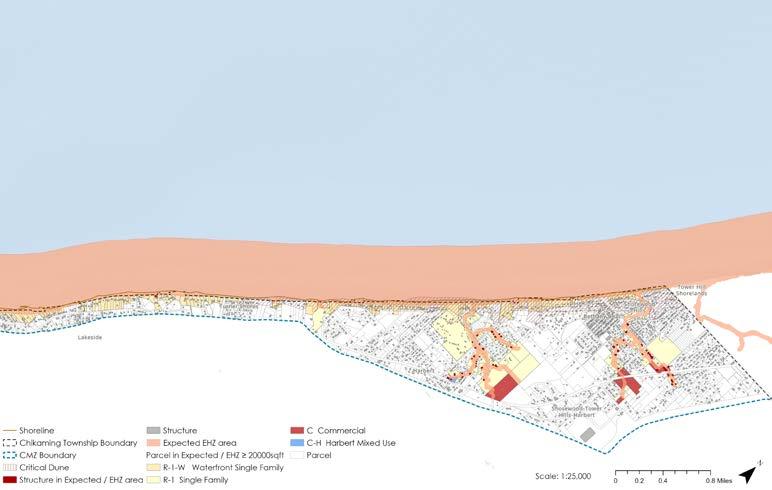
Figure 26: Scenario 5 Map – Expected climate future / EHZ
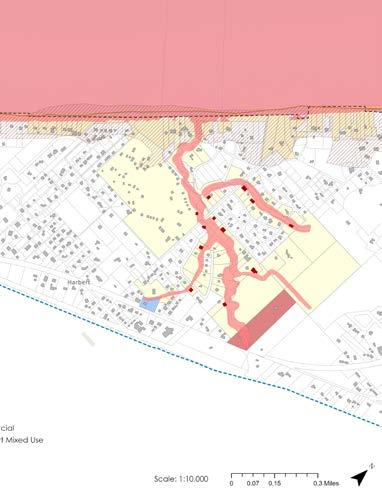
c. Scenario 6: Expected Climate Future / FBMPZ
The Expected / FBMPZ scenario is the highest-exposure scenario under the most likely climate future. It captures 428 buildable parcels, 981 acres, and 126 structures total, which is nearly four and a half times the parcel count of the Lucky / HZ baseline scenario (see Table 08 and Figure 27). The structure breakdown reflects the full range of exposure types: coastal, riverine, and wetland structures. Six vacant buildable parcels are potentially constrained, which is the highest count across all Expected climate future scenarios. These parcels represent locations where development is currently permitted under zoning but would be restricted under a full BMP-based regulatory framework, making them the highest-priority targets for proactive land use management.
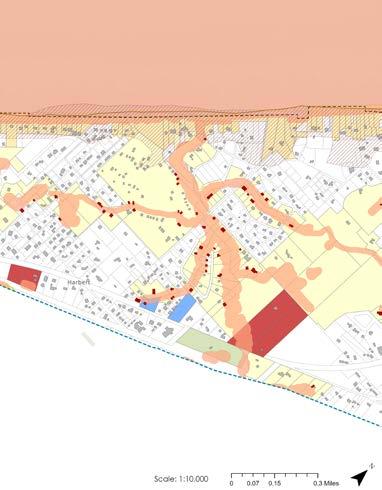
Table 08: Development Metrics for Expected climate future / FBMPZ
Figure 27 Inset: Zoom F – Expected climate future / FBMPZ
(Full map on next page — see Figure 27)
RedArrowHighway
Linwood
HarbertRoad
PrairieRoad
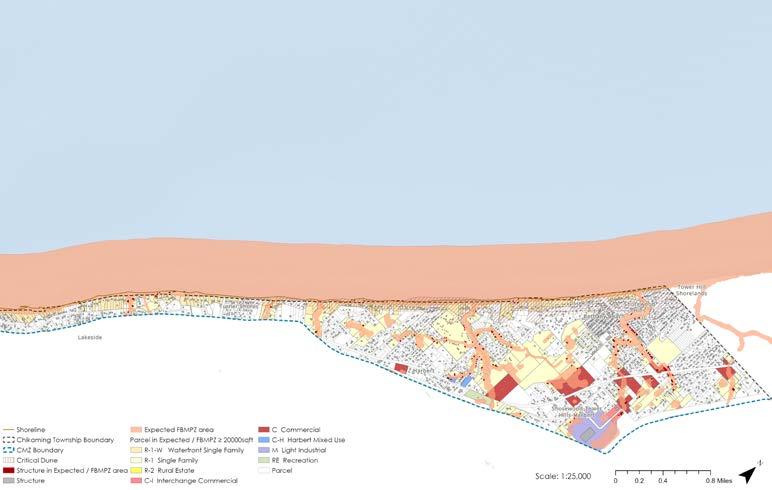
Figure 27: Scenario 6 Map – Expected climate future / FBMPZ
3. Perfect Storm Climate Future
a. Scenario 7: Perfect Storm Climate Future / HZ
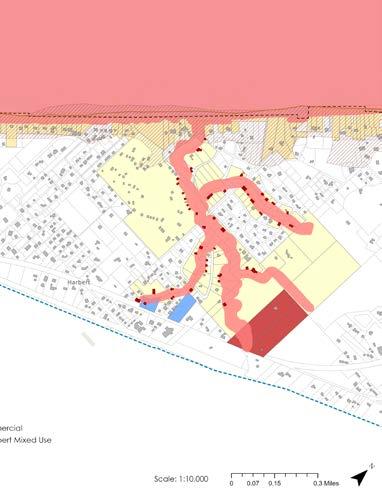
The Perfect Storm climate future scenarios add the VE zone (for wave energy, corresponding to the coastal high hazard area subject to wave action rather than inundation alone), along with the Shaded X zone (for the 0.2% storm, representing the most extreme storm mapped by FEMA) to the potential flood extent. The Perfect Storm / HZ scenario captures 229 buildable parcels and 461 acres, with 23 existing structures, all riverine, and 1 constrained vacant parcel (see Table 09 and Figure 28). The structure count doubles from the Lucky / HZ and Expected / HZ scenario levels of 12 to 23, confirming that climate severity is impacting the structure count as well in the case of a Perfect Storm climate future.
RedArrowHighway
Linwood
HarbertRoad
PrairieRoad
Table 09: Development Metrics for Perfect Storm climate future / HZ
Figure 28 Inset: Zoom G – Perfect Storm climate future / HZ
(Full map on next page — see Figure 28)
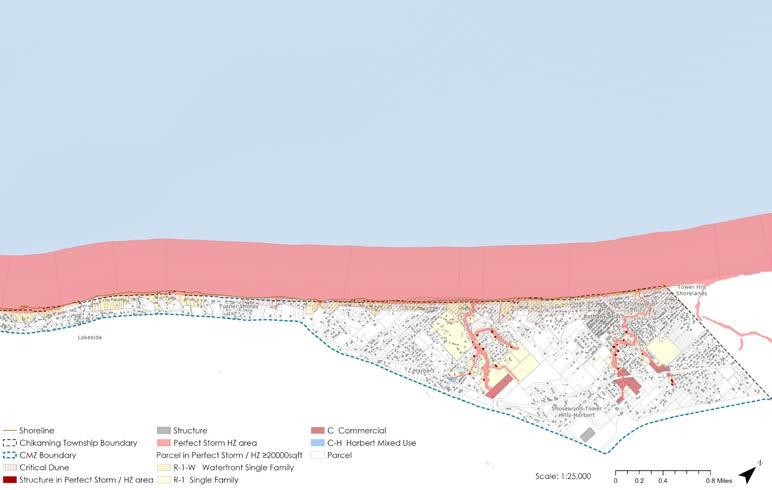
Figure 28: Scenario 7 Map – Perfect Storm climate future / HZ
b. Scenario 8: Perfect Storm Climate Future / EHZ
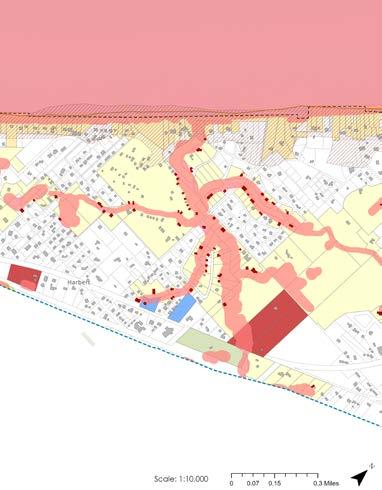
The Perfect Storm / EHZ scenario captures 296 buildable parcels and 544 acres, with 92 existing structures, the highest structure count of any HZ or EHZ scenario in the matrix (see Table 10 and Figure 29). The jump from 23 structures in the Perfect Storm / HZ scenario to 92 in this scenario is again roughly four times, consistent with the buffer effect observed across all three climate futures. One coastal structure appears in addition to 91 riverine structures. Five vacant buildable parcels are potentially constrained. The consistency of the buffer amplification effect across Lucky, Expected, and Perfect Storm climate futures confirms that the clustering of development immediately outside the current FEMA flood hazard boundary is a systematic phenomenon, one reflecting the regulatory approach currently used by the township, not an artifact of any single climate scenario.
next page — see Figure
RedArrowHighway
Linwood
HarbertRoad
PrairieRoad
Table 10: Development Metrics for Perfect Storm climate future / EHZ
Figure 29 Inset: Zoom H – Perfect Storm climate future / EHZ (Full map on
29)
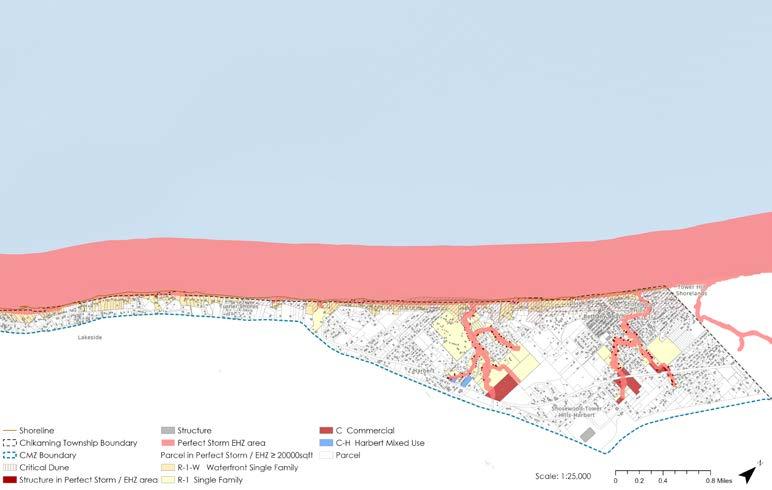
Figure 29: Scenario 8 Map – Perfect Storm climate future / EHZ
c. Scenario 9: Perfect Storm Climate Future / FBMPZ
The Perfect Storm / FBMPZ scenario represents maximum exposure across the full matrix, capturing 433 buildable parcels, 989 acres, and 149 existing structures and representing the upper bound of Chikaming Township’s coastal flood exposure under any combination evaluated in this analysis (see Table 11 and Figure 30). Six vacant buildable parcels are potentially constrained, consistent with the Expected / FBMPZ scenario. This scenario is the planning ceiling; it answers the question, if conditions deteriorate to their worst plausible extent and the township adopts its most protective regulatory framework, what is the full scope of existing and potential development correspondingly affected?
RedArrowHighway
Linwood
HarbertRoad
PrairieRoad
Table 11: Development Metrics for Perfect Storm climate future / FBMPZ
Figure 30 Inset: Zoom I – Perfect Storm climate future / FBMPZ (Full map on next page — see Figure 30)
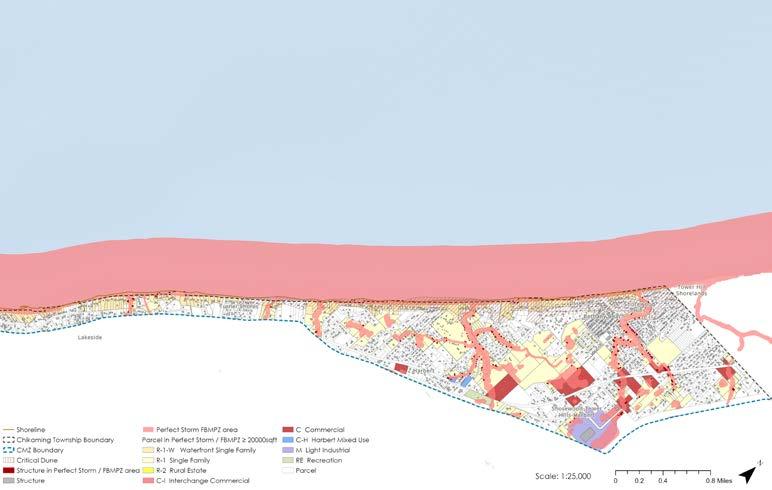
Figure 30: Scenario 9 Map – Perfect Storm climate future / FBMPZ
3.1.4. Discussion
The nine-scenario assessment reveals a consistent set of spatial and regulatory patterns across all climate futures and zone types that merit contemplation. The complete results are presented in Table 12 below, followed by discussion of five key findings.
2. The 50-Foot Buffer Captures Disproportionately More Structures
1. Climate Severity Drives Parcel Exposure
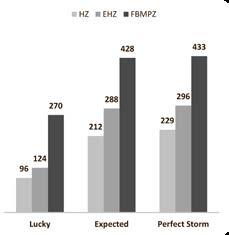
The transition from the Lucky to the Perfect Storm climate future produces a substantial increase in parcel exposure across all zone types (see Figure 31). Buildable parcels in the Hazard Zone across the three climate futures increase from 96 under Lucky to 229 under Perfect Storm, a 2.4 times increase from the Lucky / HZ baseline. The transition from Lucky to Expected is also significant; parcel count more than doubles from 96 to 212, while existing structure count remains stable at 12, suggesting that the additional parcels captured by the Expected climate future flood extent are predominantly vacant. From Expected to Perfect Storm climate future, the increase in buildable parcels is more modest, indicating that the marginal area between these two futures is less densely developed than the shoreline corridor already captured by the Expected climate future.
Across all three climate futures, the transition from a HZ to EHZ coastal management area produces a significant increase in structure counts relative to the parcel count increase. For the Lucky scenarios, the added buffer results in a 29% increase in parcels, but structures increase 4.5 times. This pattern holds consistently across all climate futures, as shown in Table 13 below, and demonstrates that a significant number of structures are clustered immediately outside the FEMA flood boundary. The 50-foot buffer is therefore not simply a protective buffer, but it is the regulatory tier that captures the most at-risk built development under a management
Table 12: Scenario Assessment Summary
Figure 31: Affected Parcel by Climate Futures
approach that acknowledges likely increases in flooding risks associated with a changing climate.
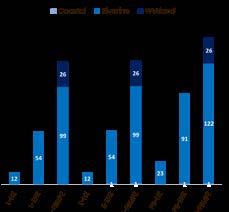
captured across scenarios with regard to coastal flooding risks are not beachfront properties but buildings located along the inland creek corridors. Under the Lucky climate future scenarios, all 12 structures in the HZ coastal management area are riverine. Even under Expected and Perfect Storm climate futures, riverine structures dominate the totals across the HZ and EHZ coastal management areas. Coastal structures appear only in small numbers in the EHZ and FBMPZ scenarios, and wetland structures (a consistent 26 across
3. The FBMPZ Captures Most Number of Parcels
The Full BMP Zone coastal management areas, which add stream and wetland buffers to the flood extent, capture a substantially larger number of parcels than the HZ and EHZ coastal management areas alone. For the Lucky climate future, the FBMPZ coastal management area captures 270 parcels, nearly three times the 96 parcels in the Lucky / HZ scenario. As shown in Table 12, for the Expected climate future, the FBMPZ coastal management area captures 428 parcels versus 212 in the HZ coastal management area. This reflects the significant spatial extent of wetland and stream buffers in the township, which reach well beyond the direct flood zone into interior areas. The FBMPZ coastal management area thus represents the most comprehensive regulatory option spatially, including both flooding and water quality regulation across the township.
4. Flood Exposure is Predominantly Riverine
A counterintuitive finding of this analysis is that the structures most consistently
all FBMPZ combinations) become visible only once the full wetland buffer network is incorporated (see Figure 32). This finding has direct implications for regulatory strategy; a flood risk management framework focused solely on the Lake Michigan shoreline would miss this primary concentration of existing structures along the creek corridors, which are equally at risk to flooding hazards.
5. The Township’s 150-Foot ROHWM Setback Provides Meaningful but Partial Protection
Chikaming Township has already adopted a 150-foot setback from the Regulatory Ordinary High Water Mark (ROHWM) for coastal properties.16
Within this existing setback area, 238 buildable parcels and 61 existing structures are captured, all of them coastal (see Figure 33). Using the most climate-optimistic and least proactive management scenario as the baseline–the Lucky / HZ scenario, and considering the more proactive management options captured by the EHZ coastal management areas for comparison, the township’s existing regulatory setback already provides more parcel coverage than the baseline (238 compared to 96 parcels) and similarly encompasses
Table 13: Comparison of HZ vs. EHZ metrics across climate futures, showing the marginal effect of the 50-foot BMP buffer.
Figure 32: Structures at risk by type
more existing structures (61 compared to 12), suggesting that for shorelineadjacent properties the existing regulation is already performing meaningfully. In comparison with a coastal management approach premised on using a EHZ coastal management area–one better aligned with likely future flooding risks given climate change, the existing regulatory setback falls in between the Lucky and Expected climate future scenarios in terms of parcels, and in between the Expected and Perfect Storm climate future scenarios in terms of structures at risk (see Table 14).
This comparison, however, also reveals an important regulatory gap: the 61 structures captured by the ROHWM setback are all coastal, while the EHZ coastal management option scenarios capture predominantly riverine structures. Thus while the OHWM setback provides protection for the lakeshore fringe, it does not address the full extent of likely flood risks for properties along the stream corridors extending inland from Lake Michigan. Taken together, the existing ROHWM setback and an EHZ coastal management area option, as an alternative approach, would provide more comprehensive coverage in terms of coastal flooding risks specifically. That approach (and the current regulatory setback) also arguably captures more lakefront properties at risk to coastal flooding than would an EHZ coastal area management approach alone. Even so, the existing regulatory setback also serves to address risks from potential shoreline recession, as addressed next.
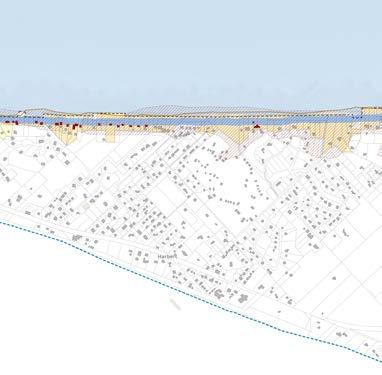
Figure 33 Inset: Zoom J – lakeshore 150’ setback from ROHWM (Full map on next page — see Figure 33)
Table 14: Development Metrics for 150’ setback from ROHWM
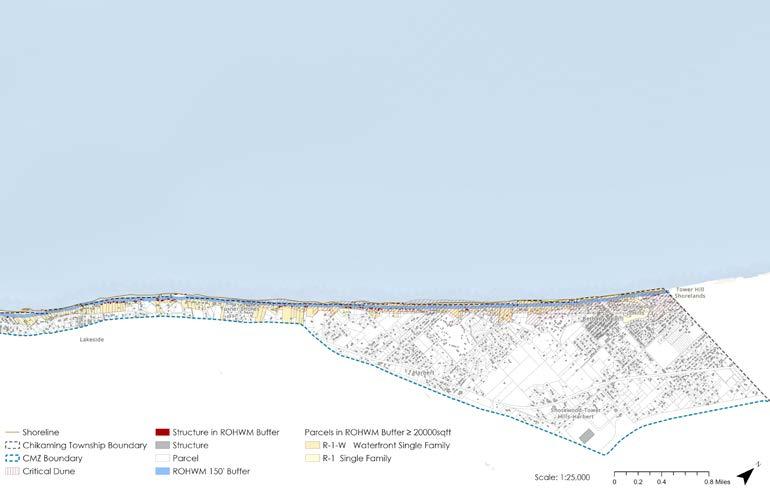
Figure 20. Perfect Storm Climate Future / FBMPZ
Figure 33: Map with lakeshore 150’ setback from ROHWM
03.02 Scenario Planning - Coastal Erosion
3.2.1. Introduction
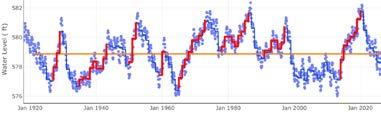
Consistent with our assessment of potential coastal flooding risks given uncertainties regarding future storminess and standing lake water levels, we used a Lucky, Expected, and Perfect Storm analysis framework to assess risks from shoreline recession as well. Specifically, we used that framing to model the range of climate futures that could impact Chikaming Township’s shoreline in terms of the potential risks from shoreline recession associated with distinct periods of rising-to-high standing lake water levels. For this application, and given the timescales of long-term rising water level changes documented since the early 1920s for Lake Michigan (see figure 34), we used the periods of 3, 9, and 15 years of continuously rising water levels to characterize a Lucky, Expected, and Perfect Storm climate future, respectively. Given that Chikaming Township is largely built out along its Lake Michigan shoreline, we did not
differentiate the scenarios for this assessment by pairing distinct climate futures with distinct coastal management options. Rather, we effectively collapsed the potential areas at risk with the potential management options, assuming that the area at risk under each potential climate future is also the same area the township would manage as a high-hazard coastal shoreland zone. We identify various management options the township might consider adopting within that high-hazard coastal management area, however identified, in our policy analysis discussion of coastal management options in Section 4 of this report below.
3.2.2. Methodology
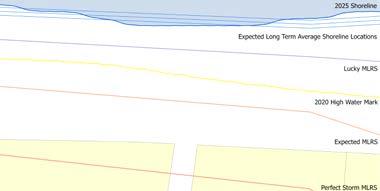
In order to determine the areas at risk during an extended erosive period, we used documented erosion rates for segments of Chikaming Township’s Lake Michigan shoreline during the last period of rising-to-high standing lake water levels (i.e., from 2013 to 2020) to predict potential erosion rates along different parts of the coast. Using those granular erosion rates, provided by researchers at MSU17, and by projecting them along the time periods associated with each potential climate future, we were able to develop an erosion prediction metric that maps the furthest landward extent that water might reach in each erosion scenario, if standing water levels were to begin rising continuously tomorrow (see figure 35(a) & 35(b)). Accordingly, we call this high point of water the Most Landward Reach of the Shoreline, or MLRS. For our analysis, we projected the progression of the MLRS starting from the 2025 shoreline, which represents the most recent shoreline position data available (and best reflects the concept of water levels beginning to rise again starting tomorrow). The MLRS more accurately describes the erosion risks faced by shoreline properties than the commonly used average long-term shoreline location, because while the average long-term shoreline location does describe the slow and steady net movement of the shoreline, by averaging out periods of high and low water, it fails to capture the risk to structures during periods of high water and steady erosion.
Figure 34: Hydrograph highlighting varying periods of rising water levels and a table of the derived potential climate futures
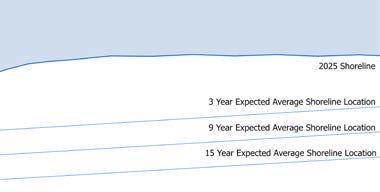
3 Year Expected Average Shoreline Location
9 Year Expected Average Shoreline Location
15 Year Expected Average Shoreline Location
Using the MLRS, we analyzed the shoreline risks confronting Chikaming Township under the different potential climate futures by mapping parcels and structures potentially affected by the receding shoreline for each climate future, respectively. We looked at three different types of impact. First, we identified parcels and structures that would be affected but not completely encompassed by the receding shoreline. This category includes all properties that the new shoreline, as indicated by the MLRS, would touch. For parcels, any shoreland erosion would cause a parcel to be included in this category; for buildings, being included in this category indicates that some portion but not all of the shoreland underlying the building would be eroded away. The second category includes parcels and structures entirely lakeward of the MLRS, indicating that those parcels or structures would be entirely lost to submerged bottomland as the shoreline recedes (i.e., at least as long as standing lake levels continue to rise). Finally, for each climate future we identified the number of parcels for which the loss of shoreland to submerged bottomland by the receding shoreline–again as marked by the MLRS– would be diminished to the point that a new structure
could no longer be built on the upland portion of the parcel, using the 940 square foot minimum footprint area required for building a residential structure under the current township zoning code.
We then compared these modeled shoreline recession risks associated with the MLRS for each climate future against the township’s existing 150 foot zoning code setback along Lake Michigan, which already limits armoring structures and new construction in an attempt to reduce erosion risks, using the same analytical framework just described.
Finally, we tabulated the distribution of property values at risk in each climate future, along with the aggregated property values of all waterfront properties, all nearshore coastal properties (within 900 ft of the Lake Michigan shoreline), properties within the broader CMZ zone, and all properties within the the township. In order to provide further insight into the distribution of risk, we compared the at-risk properties with the seasonality of their owners and analyzed the share for each scenario as well.
Figure 35(a): Schematic illustration of various shore erosion lines over time.
Expected MLRS
Lucky MLRS
Shoreline
Shoreline 2020 High Water Mark
Perfect Storm MLRS
Figure 35(b): Schematic illustration various long-term shore erosion lines over time.
3.2.3. Scenario Analysis
1. Lucky Climate Future: 3 years of water level rise
The Lucky climate future scenario describes a period during which standing lake water levels rise continuously for 3 years (figure 36). In this scenario, 47 parcels within the township would be partially affected by shoreline recession, but no parcels would be entirely lakeward of the MLRS and no structures would be threatened either partially or entirely. In some portions of the shoreline, the erosion extent would not even reach the current ordinary high water mark.

Parcels
Constrained

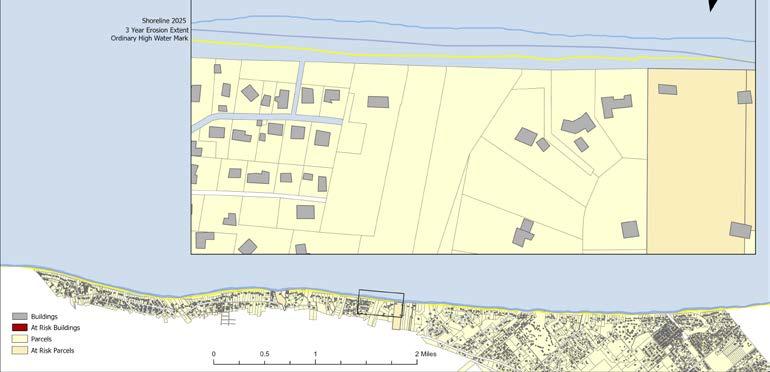
36: Map of the MLRS under a Lucky climate future, and parcels and structures at risk to shoreline recession.
Figure
Lucky Storm MLRS
2. Expected Climate Future: 9 years of water level rise
Under the Expected climate future scenario (figure 37), where standing lake levels rise continuously for a period of 9 years, 179 parcels experience erosion to some degree, while 3 parcels would be situated entirely lakeward of the MLRS. Similarly, 8 structures would be partially affected by erosion while 2 structures would be completely lakeward MLRS, meaning that the shoreland Expected

Parcels Lakeward 03
Structures Lakeward 02
Constrained Parcels 02
underlying those structures would transition entirely to submerged bottomland and the structures would either need to be removed or they would be lost entirely to the lake.
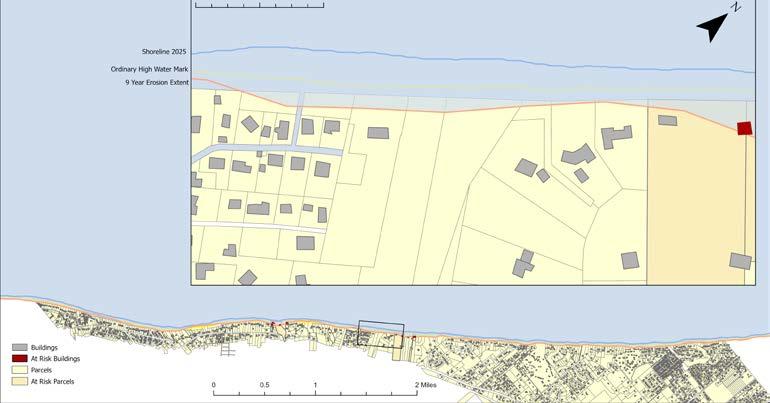
37: Map of the MLRS under a Expected climate future, and parcels and structures at risk to shoreline recession.

Figure
3. Perfect Storm Climate Future: 15 years of water level rise
Under a Perfect Storm climate future scenario (figure 38) where lake water levels rise for 15 years continuously, 308 parcels would be partially affected by shoreline recession and 19 parcels would be completely lakeward of the MLRS, such that they would convert entirely from shoreland to submerged bottomland at least while standing water levels remain high. Similarly, 105
structures would be partially affected by shoreline recession while 36 structures would be completely lakeward of the MLRS, such that they would need to be removed or would be lost entirely to the lake.

Parcel Affected 308
Structure Affected 105
Parcels Lakeward 19
Structures Lakeward 36
Constrained Parcels 16
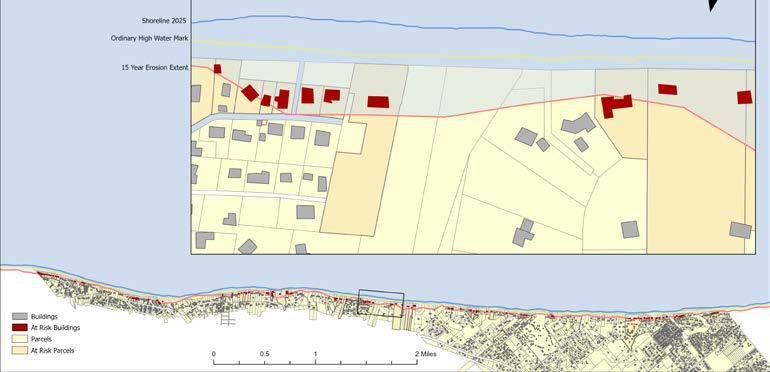
38: Map of the MLRS under a Perfect Storm climate future, and parcels and structures at risk to shoreline recession.
Figure
Perfect Storm MLRS
4. Existing Setback
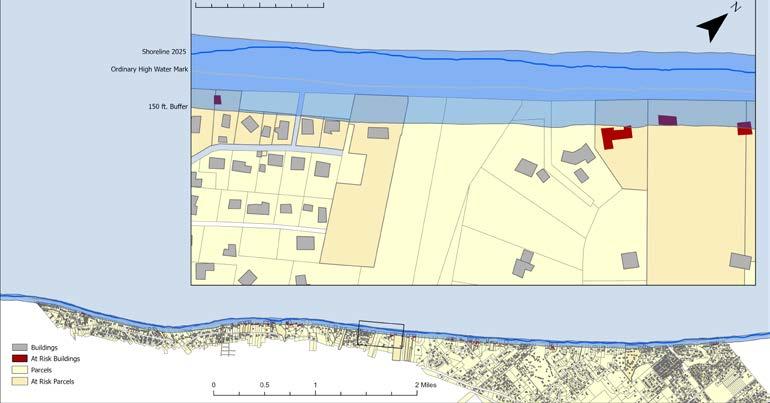
Applying the same methodology using the township’s existing 150-foot zoning setback (figure 39) along Lake Michigan, 317 parcels are encompassed partially by that setback, while 14 parcels fall fully lakeward of line and thus entirely within that setback zone. Similarly, 61 structures are currently partially
encompassed within the setback zone, while 10 structures fall completely within it.

150 ft Setback
Parcel Affected 317
Structure Affected 61
Parcels Lakeward 14
Structures Lakeward 10
Constrained Parcels 07

Figure 39: Map showing parcels and structures at potential risk within the existing 150ft setback fom the ROHWM
2025 Shoreline Ordinary High Water Mark
ft Buffer
3.2.4. Coastal Property Values
Our property value distribution analysis indicates that the coastline and nearshore properties make up a disproportionate share of Chikaming Township’s total property values. Furthermore, approaching the shoreline, the share of properties that are seasonal rises. This trend also means that seasonal properties represent a greater share of the structures at risk to shoreline recession, making up 83% of the structures at risk in a Perfect Storm Climate Future and 100% of the structures at risk in an Expected Climate Future.
3.2.3 Scenario Analysis
Based on our assessment, we identify two key findings regarding shoreline recession and the potential use of the MLRS to evaluate shoreline recession risks that warrant discussion, as follows.
1. The 150-foot Setback is a Useful Heuristic
Our coastal erosion analysis indicates that the existing 150-foot setback reflects a middle ground between the Expected and Perfect Storm climate scenarios in terms of parcel and structure count affected, being much more conservative than the Expected climate future scenario. This suggests that a standard 150 setback heuristic represents a reasonable method for identifying the shoreland area at risk from erosional processes along Chikaming Township’s Lake Michigan coast.
2. Variability in MLRS Position Justifies Increased Analysis
The MLRS setbacks are more variable than the 150ft setback, which follows the shoreline and is generally smoother. While the 150-foot setback captures all the properties at risk in the Expected climate future MLRS, the consistent nature of the standard setback set against the more variable Perfect Storm
at Risk in Perfect Scenario (15Y)
on a parcel touching Lake MI)
Nearshore Structures (Within 900ft from Shoreline)
Table 16: Summary - Climate Scenarios
Table 15: Evaluation of parcels at risk in Chikaming Township
MLRS results in in a quirky finding: some properties that fall within the standard setback do not appear to be at risk based on the Perfect Storm MLRS, while some properties that appear to be at risk based on the Perfect Storm MLRS do not fall within the standard setback. These outcomes could reflect the fact that the MLRS is based on past erosion rates, and theoretically captures variables contributing to local variation in erosion rates like topography, vegetation levels, and wind exposure. The policy implications of these differences are discussed below, but if the township would like to explore using the MLRS framework to guide land use policy, it would be valuable to conduct additional analysis to determine what additional considerations could be taken into account when using the MLRS to make it more functional.
End Notes
10. Norton, Richard & Buckman, Stephen & Meadows, Guy & Rable, Zachary. (2019). Using Simple, Decision-Centered, Scenario-Based Planning to Improve Local Coastal Management. Journal of the American Planning Association. 85. 1-19. 10.1080/01944363.2019.1627237.
11. Chikaming Township. (2023). Zoning Ordinance, effective March 4, 2023. Sections 4.02, 5.01.C.
12. FEMA’s National Flood Hazard Layer (NFHL) Viewer. https://www.arcgis.com/apps/webappviewer/index. html?id=8b0adb51996444d4879338b5529aa9cd
13. Regrid is a data company that specializes in land parcel data and property information databases. Its webpage can be accessed here. - https://regrid. com
14. U.S. Geological Survey. National Hydrography Dataset (NHD). https:// www.usgs.gov/national-hydrography
15. U.S. Fish & Wildlife Service. National Wetlands Inventory (NWI). https:// www.fws.gov/program/national-wetlands-inventory
16. Michigan Natural Resources and Environmental Protection Act (NREPA), Act 451 of 1994, Part 325 — Great Lakes Submerged Lands. Ordinary High Water Mark (OHWM) setback provisions.
17. Dr. Ethan J. Theuerkauf, Assistant Professor, Department of Geography, Environment and Spatial Sciences, College of Social Science, Michigan State University and Francisca Andrea Nunez Ferreira, Research Scientist, Michigan State University
(page intentionally left blank)
Policy Analysis 04
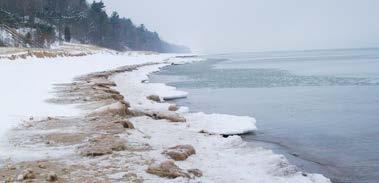
4.1 Introduction
Great Lakes coastal shoreland management in Michigan operates within a layered system of state regulations, local zoning authorities, and planning guidance that together shape how coastal communities respond to the physical processes of short-term coastal shoreline erosion, long-term shoreline recession, and coastal and coastal-riverine flooding, all in light of pressures to develop and safeguard nearshore coastal properties. While the State of Michigan establishes various protections for coastal environments and state-owned submerged Great Lakes bottomlands through legislation, local governments retain primary control over land use decisions affecting their coastal shorelands through zoning and master planning. This structure places significant responsibility on local jurisdictions to translate broader environmental goals, the best available science, and sound planning into effective and enforceable development regulations.
State-level guidance emphasizes the importance of protecting coastal systems while accommodating responsible development. Planning guides developed by the Michigan Coastal Management Program (MCMP), within the Michigan Department of Environment, Great Lakes, & Energy (EGLE), further reinforce the need for resilience-based, data-informed approaches to shoreland management, and demonstrate and how communities that fail to use them often experience higher long-term costs associated with erosion damage, flooding, and the corresponding pressures to allow engineered shoreline armoring.
Zoning plays a critical role in regulating development in sensitive coastal areas within this framework. The Michigan Zoning Enabling Act authorizes local governments to create zoning districts to address land use challenges, such as areas affected by flooding and erosion. Through these tools, municipalities can–among other things–establish building setbacks, restrict certain types of development within those setbacks, and apply additional standards within environmentally sensitive areas more broadly.
Overall, contemporary guidance reflects a shift toward more integrated and forward looking shoreline management strategies. Best practices emphasize aligning land use policy with the dynamic nature of coastal systems, prioritizing long term resilience, and strengthening local zoning authority as needed to do so. Together, these approaches provide a foundation for evaluating Chikaming Township’s current policies and identifying opportunities to enhance its shoreline management strategies through its ongoing master planning process. This section outlines the findings of our analysis, along with coastline management approaches the township might consider to further address the potential coastal flooding and erosion impacts highlighted by the scenario planning analysis presented above.18
Figure 40: Lake Michigan shoreline in Chikaming township | Source: Chikaming Township
4.2 Methodology
4.2.1. Policy Research & Literature Review
To develop a framework of considerations, the policy analysis methodology began with a policy research and literature review, which identified currently and widely accepted best practices for effective shoreland management and coastal preservation. The review included the analysis of state legislation, local ordinances, and various policy guides that reflect how federal, state, and local policies currently do and potentially might shape Lake Michigan shoreland management. We describe briefly here selected state laws, local ordinances, and policy guides most relevant to our assessment of Chikaming Township’s coastal shoreland planning efforts.
1. LEGISLATION
Coastal Zone Management Act of 197219
The Coastal Zone Management Act (CZMA) was enacted by the U.S. Congress to provide guidance and administrative oversight through the National Oceanic and Atmospheric Administration (NOAA) to manage and protect the nation’s coastal zones and their resources. This support is provided through three national programs: the Coastal and Estuarine Land Conservation Program, the National Coastal Zone Management Program, and the National Estuarine Research Reserve System. The MCMP, within EGLE, administers Michigan’s CZMA-recognized coastal management program.
Michigan Planning Enabling Act (Act 33 of 2008)20
The Michigan Planning Enabling Act (MPEA) enables local land use (or comprehensive, or master) planning by Michigan counties, townships, cities, and villages, and it provides the authority for the creation and operation of planning commissions and planning staff. The plans produced by localities
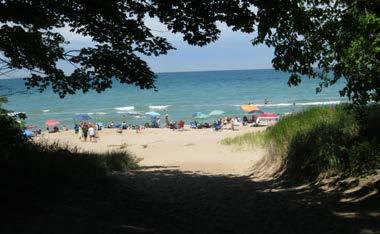
under the MPEA are intended to inform and guide local government land use regulation and infrastructure management, including zoning actions that are taken under the Michigan Zoning Enabling Act.
Michigan Zoning Enabling Act (Act 110 of 2006)21
The Michigan Zoning Enabling Act (MZEA) provides local governments in Michigan with the authority to use zoning to achieve specific land management objectives. It further enables local governments to address and resolve specific land-use problems, including the regulation of development along Great Lakes coastlines. Section 125.3201(3) of the MZEA, for example, speaks specifically to the establishment of special programs to solve specific land-use management problems in areas subjected to damage from flooding or beach erosion.
Figure 41: Cherry Beach, Chikaming Township | Source: Chikaming Parks Department
1. LEGISLATION (CONT.)
Natural Resources & Environmental Protection Act (Act 451 of 1994)22
The Natural Resources & Environmental Protection Act (NREPA) protects Michigan’s environment and natural resources through (1) codifying, revising, consolidating, and classifying laws, (2) regulating the use of certain lands and waters, and (3) prescribing state and local police powers and duties. EGLE oversees the enforcement of these policies. Several elements of that act, including especially those related to submerged bottomlands of the Great Lakes and the management of state-designated critical sand dunes, high-risk erosion areas, and environmental areas along the Great Lakes, have some impact on coastal community authorities, but none provide for state-level comprehensive coastal shoreland management.
2. ORDINANCES
City of Grand Haven Zoning Ordinance, Article IV, Section 40-42223
Grand Haven, Michigan’s zoning ordinance preserves and manages coastal shoreland through the sensitive area and beach overlay districts established in Article IV, Section 40-422. These overlay districts regulate land use and development in order to protect environmentally sensitive areas, mitigate shoreline erosion, and protect public trust beaches and shorelands.
City of St. Joseph Zoning Ordinance, Article IX, Sections 9.5 - 9.724
St. Joseph, Michigan’s zoning ordinance establishes three overlay districts to protect properties adjacent to floodplains and to prevent damage to its public trust beaches. These overlay districts regulate land use within the city’s bluffs, floodplains, and beaches, in order to preserve the character of, maintain public trust interests within, and restrain the degradation of these natural features and environmentally sensitive areas.
City of Manistee Zoning Ordinance, Article 5, Section 50525
Manistee, Michigan’s zoning ordinance includes an R-1 Low-Density Residential district to protect and preserve single-family neighborhoods located near Lake Michigan. The ordinance intends to protect the Lake Michigan shoreline environment, while enabling a ‘sustainable enjoyment’ of the unique features provided in the district.
3. POLICY GUIDES & PROGRAMS
Lake Michigan Shoreline Management26
This document was developed by the National Sea Grant Law Center as a legal research guide for shoreline management within the Lake Michigan region. The guide highlights historic federal legislation on the subject, the Environmental Protection Agency’s authority to enforce said legislation, and the impact of the Coastal Zone Management Act. Moreover, the guide outlines how the U.S. Army Corps of Engineers supports coastal shoreland management through its Nationwide Permits program.
Michigan Coastal Management Program27
The Michigan Coastal Management Program (MCMP) serves under the Water Resources Division of the State of Michigan’s Department of Environment, Great Lakes, and Energy (EGLE). The program has aimed to protect, preserve, and restore over 70 unique coastal habitats since 1978, primarily focusing on coastal habitats, public access, coastal communities, coastal waters, and coastal hazards. The MCMP provides funding through EGLE to support the conservation of publicly-owned lands, focusing on habitat feasibility and installation of nature-based solutions to protect and restore coastal habitats.
Resilient Coastal Communities Planning Guide28
This guide, prepared by MCMP, supports coastal community leaders who seek to improve resilience to hazards along the coast through long-term planning and zoning. It reflects NOAA’s national priority to prepare for and minimize risks to coastal hazards. It includes master planning approaches that adopt resilient principles, identify vulnerable coastal infrastructure, and prioritize areas to target adaptation strategies that protect and preserve natural coastal features.
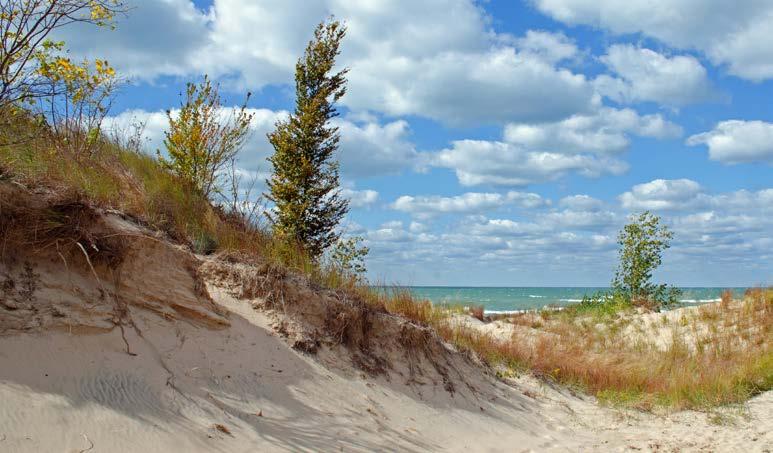
Figure 42: Sands dunes along Lake Michigan in Berrien County | Source: Krystal Fuller29
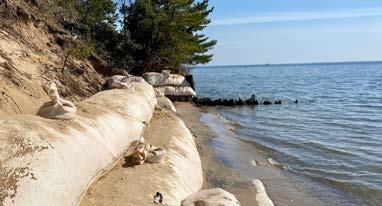
4.3 Best Practices for Coastal Management
Building from our policy research and literature review, we identified selected best practices as benchmarks to set against the proposed goals and policies articulated by the current Draft Chikaming Township Master Plan, and to identify any additional goals or policies the township might consider to further advance its Lake Michigan coastal shoreland management efforts.
Multiple best practices can be used to promote coastline management and preservation along the Lake Michigan shoreline and its surrounding natural habitats. These practices are designed to help coastal communities increase their resilience through mitigation and adaptation activities that protect shorelands and public trust interests in them. We have segmented these practices into five categories, including:
• Shoreland Development Restrictions
• Natural Shoreline Management
• Partnership Building
• Policy Making & Advocacy
• Coastal Management Programs
4.3.1 Shoreland Development Restrictions
Coastal shoreland development restrictions play an essential role in effective coastal shoreland management and preservation. Coastal communities and leaders can use zoning tools to mitigate the impacts of shoreline erosion, flooding, rising water levels, and other risks.30 When used effectively, shoreland development regulations like impervious surface restrictions and shoreline setbacks allow coastal communities to limit development activities that promote shoreline erosion and degradation.
Overlay Districts (OD) as a particularly useful mechanism for implementing various shoreland development policies and restrictions. ODs are zoning tools that impose additional regulations across zoning districts within a specific geographic area. The regulations in ODs supersede those of the impacted base zoning districts, controlling in instances where regulations between the two conflict. The MCMP Resilient Coastal Communities Planning Guide suggests that coastal communities establish coastal shoreland overlay districts through both their master planning and zoning processes. These overlay districts can include protective measures like dynamic shoreline setbacks, hard armoring prohibitions, and impervious surface restrictions, all of which aim to prevent development and construction activities that can exacerbate shoreline erosion processes.
The overlay districts established by the cities of Grand Haven and St. Joseph serve as useful case studies for the design and implementation of this best practice.
NOTE: Under Section 324.32311 of the Natural Resources and Environmental Protection Act, EGLE must approve all zoning ordinances regulating High Risk Erosion Areas –including Sensitive Area Overlays and Beach Overlays. EGLE makes its determination by evaluating how the proposed modification will (a) prevent property damage, or (b) prevent damage to an environmental area, high risk erosion area, or floodplain area.
More information regarding these requirements can be found here: legislature.mi.gov/Laws/MCL?objectName=MCL-324-35301
Figure 43: Geotextile tubes along the shoreline | Source: Superior Groundcover31
1. Grand Haven | Sensitive Area Overlay District
In 2021, the City of Grand Haven amended its zoning ordinance to include Section 40-422, which establishes a Sensitive Area Overlay District. This OD is “intended to protect, conserve and promote specific areas within the city on which there are elements of environmental significance,” and includes:
• floodplains
• wetlands and streams
• dunes and the Lake Michigan shoreline
• vegetation and habitat
• species of concern
• slopes
The ordinance outlines permitted uses and strict requirements for land development within the overlay, including these selected required conditions from Section 40-422.04, as seen in Table 17.
Section 40-422.04(M) also provides the factors that Grand Haven’s planning commission considers when determining if a “proposed use, expansion or improvement [will] unacceptably impact the Sensitive Area or surrounding property or uses.” These factors include:
• Effects of impervious surfaces
• Impacts upon wildlife and native vegetation
• Any mitigation of any effects upon the sensitive area
• Long-term shore erosion estimates
40-422.04(D) High Risk Erosion Areas
Section 40-422.04(G) Critical Dune Area Development
This section states that no existing or new use of land permitted in the Sensitive Area Overlay district shall be allowed unless it complies with the high-risk erosion area setback requirements of the (1) Natural Resources Environmental Protection Act, and (2) shoreline protection measure requirements stated in Grand Haven’s Beach Overlay district, where applicable.
Section 40-422.04(L) Construction & Expansion Approval
This section requires all development and redevelopment located within 250 feet of a critical dune area comply with requirements of Part 353 entitled “Sand Dunes protection and Management” of the Natural Resources Environmental Protection Act
This section requires propery owners to submit a site plan for any construction or expansion of any use subject to special conditions on any parcel in the Sensitive Area Overlay District. This site plan must be approved by the Michigan Department of Environment, Great Lakes, and Energy, and comply with all applicable standards outlined.
Grand Haven Sensitive Area Overlay District Regulations
Section
Table 17: City of Grand Haven Zoning Ordinance, Article IV, Section 40-422
2. Grand Haven | Beach Overlay District
Grand Haven’s 2021 zoning ordinance amendment also established a Beach Overlay District (Section 40-423). This overlay district includes high risk erosion areas along Lake Michigan, and it restricts the construction of structures (such as hard armoring) that will increase erosion and its negative impacts (e.g., damaging adjacent properties and the public trust beach). Through this OD, Grand Haven accomplishes its shoreline management goals, while supporting
impacted property owners using some of the regulations outlined in Table 18.
The amendment also requires the city to review the location of the elevation contour every ten years, or if the State of Michigan updates the fifty-year flood elevation, in order to determine the Beach Overlay District should be adjusted.
This section identifies land included in the overlay district -- using geospatial points derived from the sum of two measurements:
• The elevation contour line (i.e., the 50-year flood elevation)
Section 40-423.02 District Description
• The 60-year projected reccssion distance for High Risk Erosion Areas
The geospatial line used to delineate the beach overlay district serves as a dynamic shoreline setback, adjusting the location based on water levels instead of a set fixed distance.
This section states that no permanent shoreline protection measures may be installed in the Beach Overlay District. Allowable shoreline protection measures include:
• Seasonal wide-slatted fencing
• Geotextile tubes
Section 40-423.03(A) Shoreline protection measures
Section 40-423.03(B-D) Variances for impacted property owners
• Large sandbags
All protection measures and artifical materials must be removed when no longer needed. The section also explicitly states that it should not be construed to support hard armoring.
These sections identify specific circumstances under which impacted property owners may seek a variance for their property.
The section also identifies property owners that are disqualified from receiving variances.
Table 18: City of Grand Haven Zoning Ordinance, Article IV, Section 40-423
Grand Haven Beach Overlay District Regulations
Section Subject Regulation
3. St. Jospeh | Floodplain Overlay District
In 2024, the City of St. Joseph amended its zoning ordinance to include Article IX, Section 9.6, which establishes a Floodplain Overlay District. This OD aims to protect people and properties from flood hazards; minimize flood-related public expenditures; prevent private and public economic loss and social disruption; maintain stable development patterns; ensure the public knows what land is
included in the floodplain; and preserve the floodplains’ ability to carry and discharge base floods within its special flood hazard areas. The city achieves these objectives through some of the regulations outlined in Table 19.
Section 9.6.5.(A) Allowable Uses
Section 9.6.5.(B) Accessory Structures & Uses
This section identifies the following uses as the only allowables ones within special flood hazards areas:
• Agriculture
• Parkers and nature-based recreation
• Wildlife preserves
• Historic sites and structures
• Swimming beaches, fishing, and boating docks
• Required open spaces or yard for structures landward of the special flood hazard areas
This section outlines the types of accessory structures and uses allowed in the areas of special flood hazard offstreet parking, streets, roads and bridges.
These structures are subject to the same restrictions as the allowable uses, as well these addtional restrictions:
• Structure can’t cause an increase in water surface elevation, obstruct flow or reduce the impoundment capacity of the floodplain.
• All equipment and structures must be anchored to prevent flotation and lateral movement.
Section 9.6.5.(C) Dredging & Filling
This section prohibits filling and back filling with any material, unless it is done in a way that protects and supports the floodplain.
St. Joseph Floodplain Overlay District Regulations
The city ensures compliance through a certified engineering finding by a registered engineer.
Table 19. City of St. Joseph Zoning Ordinance, Article IX, Section 9.6.5.
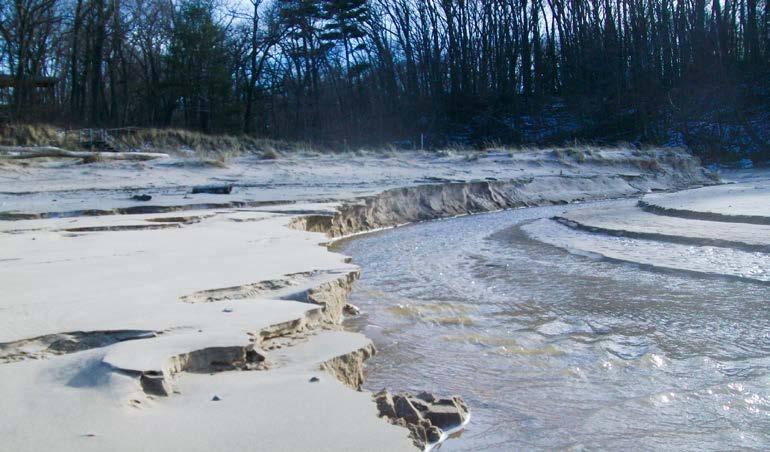
Figure 44: Swash channel on Harbert Beach in Chikaming Township | Source: Chikaming Township
4.3.2. Natural Shoreline Management
Natural shoreline management and preservation emerged as a best practice during our research.32 This practice prioritizes the restoration and maintenance of natural shoreline habitats through native planting, erosion control, storm surge protection, stormwater filtration, and wildlife habitat preservation. Local governments can promote natural shoreline management through the implementation of projects that promote the installation of nature-based solutions in environmentally sensitive areas. They may also use zoning tools to (a) enforce native vegetation preservation requirements, (b) promote native planting, and (c) prescribe natural solutions to shoreline construction.
Natural shoreline management projects are often funded by federal branches such as the U.S. Forest Service, the Environmental Protection Agency, and the U.S. Department of Agriculture. Table 20 summarizes three natural habitat projects funded through these sources to illustrate their components and benefits.
It is vitally important to recognize and acknowledge that while natural shoreline management approaches can benefit coastal ecosystems, help to mitigate some water run-off and water quality issues, and potentially impede natural erosional processes to some extent, these approaches cannot be used to entirely arrest shoreline erosion and long-term recession along an open, highenergy Great Lakes shoreline such as that found along Chikaming Township’s Lake Michigan shorefront; the wave energies and related coastal dynamics within those settings are simply too powerful.
Thus while the township should contemplate the use of natural shoreline features for habitat and related benefits along its Lake Michigan shoreline and the tributaries draining to it (as well as more broadly throughout the township), it should not look to use natural shoreline management approaches as a way to stop natural shoreline erosion and recession along Lake Michigan.
Michigan Natural Shoreline Management Project
Project Description Benefits
Planting Trees for Clean Water33
Van Buren County, MI
This annual Van Buren County project plants trees and shrubs on residential properties on or near six lakes in Van Buren and Cass County.
The project is funded by a Great Lakes Restoration Initiative grant awarded by the federal government.
Reduces storm water run off
Improves water quality
Restores the native habitat
Coastal Resforestation Grant34
Muskegon & Western MI
This project removed native trees impacted by tree disease and invasive species, and installed new trees and tree seedlings.
The project was funded through the U.S. Forest Service: Great Lakes Restoration Initiative.
Reduces storm water run off
Improves water quality
Mitigates tree disease spread
Removes invasive species
Oceana County
Coastal Conservation Corridor35
Benona Township, MI
This project restores the natural habitat through 3 steps: treatment of invasive species; cluster planting and caging White Pine, White Cedar, White Spruce, and Balsam Fir; and K-12 place-based environmental stewardship projects.
The project is funded through the U.S. Forest Service: Great Lakes Restoration Initiative.
Restores critical dune habitats
Removes invasive species
Decreases reinfestation rates
Water temperature stabilization
Erosion control
Community engagement and education
Table 20. Natural Shoreline Management Projects in Michigan
4.3.3 Partnership Building
Policy guides for good coastal shoreland management uniformly identify partnership building as an important best practice.36 Partnerships at all levels are integral to the development and implementation of effective shoreline preservation strategies. These partnerships fall into three categories:
• Intergovernmental Partnerships
• Community Partnerships
• Coastal Community Networks
Intergovernmental partnership-building is a crucial step in effective coastline management planning. By building relationships with institutions that are addressing coastal shoreland management and preservation at the regional, state, and national levels, local governments can access coastal restoration funding and participate in regional projects. These partnerships can also help coordinate enforcement of shoreline regulations, implementation of coastal restoration programs, and engagement in regional coastal resilience planning.
Community support is key to the effective implementation of coastline management strategies. To that end, local governments are encouraged to form partnerships with local residents, shoreland homeowners and homeowner associations, and community groups–including groups representing interested residents throughout the township, beyond shoreland property owners alone. By using these partnerships to build public awareness of shoreline erosion issues, educate shoreline homeowners on best practices, and garner support for new shoreline preservation strategies, these governments can build support for zoning ordinances and coastal projects that aim to preserve especially the natural features of coastal shorelands.
Finally, local governments should build networks with neighboring coastal communities experiencing similar coastal shoreland preservation and management issues. These networks allow local governments to learn from each other and to coordinate strategies and standards that increase the efficacy and impact of their coastline management efforts – locally and regionally.
4.3.4 Policy Making & Advocacy
Policy making and advocacy are best practices that support coastal shoreland preservation efforts through the codification of shoreline development regulations.37 Policy advocacy at the state-level is key, as many of the acts passed by state legislatures and administered by state agencies control the extent to which local governments can regulate land use in environmentally sensitive areas. As such, local governments should advocate for the shoreline protections especially at the state level that they believe will positively impact their coastal preservation goals, either through state action directly or through enhanced authority to do so locally.
Similarly, local policy making itself represents an important best practice for coastal shoreline management. Local governments should adopt zoning and police power ordinances that regulate shoreland development and minimize or proscribe entirely coastal development activities that harm coastal natural features. These ordinances might include, for example, the kinds of overlay districts described above. Adopting these policies ensures that communities have in place clear, enforceable standards that are accessible to and can be understood by all residents, including especially current and potential shoreland property owners.
Lastly, local governments should incorporate community engagement into their policy making and advocacy efforts. Residents should be educated about shoreline erosion and its impacts, and engaged in local shoreline management projects and planning processes. By equipping residents with the knowledge and resources to participate in these efforts, local governments can both enhance and increase buy-in for their coastal preservation policies and strategies.
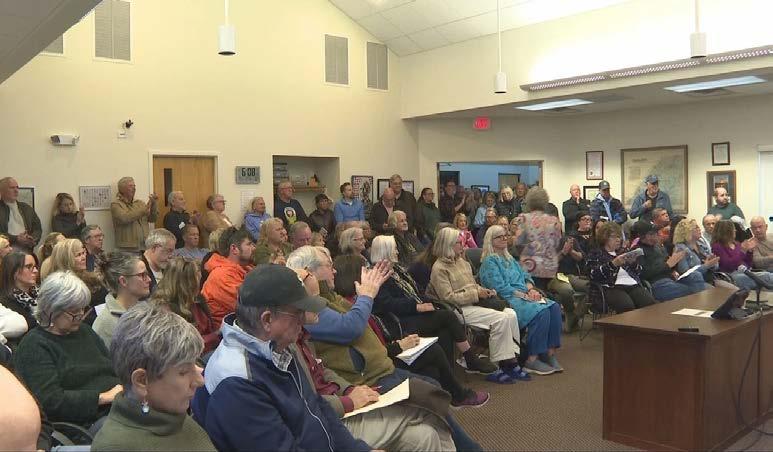
Figure 45. Community meeting on short-term rentals in Chikaming Township | Source: WSBT38
4.3.5 Coastal Management Programs
While community-led coastal preservations programs are important, coastal communities should also actively participate in state and federal-level initiatives as a best practice. The Michigan Coastal Management Program (MCMP) is the primary Great Lakes coastal preservation agency in the state of Michigan, providing technical assistance and grant funding to build coastal community
capacity to understand coastal risks and the coastal hazard mitigation strategies available to them.39 MCMP prioritizes projects that promote climate resilience, local policy making, community engagement, native plant installation, and coastal natural resource preservation. Eligible projects must fall into one of five focus areas, as detailed by Table 21.
• Resilient Master Plan development, incorporating scenario-based planning principles.
• Regional climate change and coastal issue evaluation, coupled with coastal community resilience recommendations.
• Creation of subarea and waterfront redevelopment plans that prioritize public access to, protection of and use of coastal lands.
• Plans, studies and projects that economically revitalize under-utilized coastal areas in a sustainable and resilient matter.
• Community feasibility studies, design and engineering for low-cost, natural infrastructure projects to preserve and restore critical dunes.
• Analyzing and communicating the value of coastal ecosystems and their impact on coastal communities.
• Feasibility studies, engineering plans, and implementation of site-specific projects to enhance or restore coastal habits using nature-based solutions.
Coastal Habitat
Coastal Hazards
• Creative coastal projects that promote vibrant, resilient coastal communities through ecosystem preservation, protection, restoration or enhancement.
• Address urban heat effects through urban tree canopy profiles of tree-planting.
• Collect new coastal data for use in future coastal planning or decision-making.
• Community feasibility studies, design and engineering for low-cost, natural infrastructure projects that use innovative adaptation strategies to address coastal erosion.
• Feasibility studies and policy development regarding managed retreat of infrastructure from the coast.
• Community-wide and asset-specific exposure, vulnerability and risk assessments.
• Cost-benefit analyses demonstrating the viability of projects that address natural hazards like coastal erosion.
• Updating local precipitation projections and integrating that data into planning and asset management solutions.
• Community feasibility studies, design and engineering for low-cost, natural infrastructure projects that address coastal flooding.
• Community stormwater management assessments and nature-based solution identification.
Coastal Waters
Public Access
• Stormwater ordinance analysis and amendments.
• Community engagement and education campaigns encouraging proper coastal water maintenance.
• Community planning, feasibility plans, engineering, and design projects that promote safe access, public transportation, and community placemaking
• Site-specific, low-impact and environmentally friendly development projects that enhance resilient and barrier-free public access to coastal areas.
• Historic and cultural preservation and restoration unique to Michigan’s coastline.
Table 21: Michigan Coastal Management Program Projects
Michigan Coastal Management Program Projects
Focus Area
Eligible Projects
Coastal Communites
In addition, the National Sea Grant Law Center’s Lake Michigan Shoreline Management report encourages local governments to participate in the Nationwide Permits (NWP) program.40 The U.S. Army Corps of Engineers awards NWPs to coastal zone management projects that support shoreline restoration and stabilization through erosion control, habitat restoration,
living shorelines, and beach nourishment. Any NWP project in a coastal zone must pass a federal consistency review to confirm their proposed actions are consistent with state coastal policies; these decisions may be reviewed by states. Table 22 summarizes examples of coastal zone management NWPs.41
This permit covers the construction and maintenance of living shorelines to stabilize banks and shores in the Great Lakes. Living shorelines incorporate vegetation and other living, natural “soft” elements alone or in combination with harder shoreline structures for added protection and stability. NWP
This permit covers shoreline stabilization activities, and encourages the use of soft bank stabilization approaches and nature-based solutions, to reduce adverse environmental effects.
This permit involves the dredging and filling of materials into coastal waters for aquatic ecosystem restoration, enhancement, or establishment. It was updated in 2026 to focus on the construction, maintenance or expansion of nature-based solutions that resemble ecological references.
Nationwide Permit Types Permit
Table 22: Nationwide Permits Program
4.4 Analyzing Chikaming Township’s Master Plan Draft
As part of Chikaming Township’s current master planning processes, leadership and planning consultants have proposed several land use regulations and stewardship programs to protect the township’s shoreline and surrounding coastal ecosystems.42 All of these recommendations, like the impervious surface restrictions, align with the selected best practices outlined above.
Waterfront Residential Zoning Type
This proposed zone will better acknowledge and regulate the unique considerations that exist for residential housing development and maintenance along the Lake Michigan shoreline.
Dune Overlay Zone
Impervious Surface Restrictions
Intergovernmental Partnerships
Coastal Preservation Projects
Community Education & Engagement
This overlay zone would cover properties and parcels in the Township’s critical dune areas and high risk erosion areas – subjecting them to additional standards that ensure shoreline and dune protections. This overlay zone is a best practice, however, the Critical Dune Act preempts more stringent local regulation of critical dunes.
This regulation will enhance the provision of a maximum lot coverage for impervious materials in shoreline developments – prioritizing designs that promote permeability and protect the natural habitat.
The Township will build or strengthen partnerships with EGLE, Berrien County, and other intergovernmental institutions to support enforcement of its coastal management ordinances and policies.
The Township will identify vulnerable parcels and develop projects to restore natural habitats and stabilize shorelines in those areas through efforts like native planting, erosion control, and storm surge protection.
The Township will form relationships with shoreline Homeowners Associations and community members to promote and provide guidance regarding shoreland stewardship and participation in shoreline stabilization initiatives.
Scenario-Based Planning & Policy Making
The township will engage in scenario-based planning to understand potential future climate risks and develop policies to address and mitigate each scenario.
Master Plan Coastal Management Proposals
Proposed
Table 23: Chikaming Township Master Plan Draft

Figure 46: Native marram grass on the Lake Michigan Shoreline | Source: Unsplash (Seboly, J.)
End Notes
18. The information presented in the introduction of this section is drawn from various sources including the following:
• Shifting sands: Michigan’s great lake shores. (n.d.). https:// www. michbar.org/journal/Details/Shifting-sands-Michigans-greatlakeshores?ArticleID=4447
• Michigan Coastal Management Program. (2023). Resilient Coastal Communities Planning Guide. https://www.michigan.gov/egle/-/media/ Project/Websites/egle/Documents/Programs/WRD/Coastal-Management/ Resilient-Coastal-Communities-Planning-Guide.pdf
• Norton, R., Meadows, G., & Meadows, L. (2013). The deceptively complicated “elevation ordinary high water mark” and the problem with using it on a Laurentian Great Lakes shore.Journal of Great Lakes Research, 39(4), 527-535. http://doi.org/10.1016/j.jglr.2013.09.008
• Richard K. Norton, Nina P. David, Stephen Buckman, Patricia D. Koman, Overlooking the coast: Limited local planning for coastal area management along Michigan’s Great Lakes, Land Use Policy, Volume 71, 2018, Pages 183203,ISSN 0264-8377, https://doi.org/10.1016/j. landusepol.2017.11.049.
19. Coastal Zone Management Act of 1972, 16 U.S.C. §§ 1451–1464 (1972). https://uscode.house.gov/view.xhtml?path=/prelim@title16/ chapter33&edition=prelim
20. Michigan Planning Enabling Act, 33 Mich. Comp. Laws § 125.3801 et seq (2008). https://www.legislature.mi.gov/documents/mcl/pdf/mcl-Act-33-of-2008. pdf
21. Michigan Zoning Enabling Act, Mich. Comp. Laws §§ 125.3101–125.3702 (2006). https://www.legislature.mi.gov/Laws/MCL?objectName=mcl-act-110of-2006
22. Natural Resources and Environmental Protection Act, Mich. Comp. Laws §§ 324.101–324.99923 (1994). https://www.legislature.mi.gov/Laws/ MCL?objectName=mcl-act-451-of-1994
23. City of Grand Haven, MI. (n.d.). Zoning ordinance, art. IV, § 40-422. Code of Ordinances. https://library.municode.com/mi/grand_haven/codes/code_of_ ordinances
24. City of St. Joseph, MI. (2007). Zoning ordinance, art. IX, §§ 9.5–9.7. Code of Ordinances, Appendix A. https://library.municode.com/mi/st._joseph/
25. City of Manistee, MI. (2006). Zoning ordinance, art. 5, § 505. https://www. manisteemi.gov/149/Zoning-Ordinance
26. Bowling, T. (2019, June). Lake Michigan shoreline management (Report No. NSGLC-19-04-04). National Sea Grant Law Center. http://nsglc.olemiss. edu/Advisory/pdfs/lake-michigan-shoreline.pdf
27. National Oceanic and Atmospheric Administration, Office of Coastal Zone Management, & Michigan Department of Natural Resources, Division of Land Resource Programs. (1978, July). United States Department of Commerce combined coastal management program and final environmental impact statement for the State of Michigan. U.S. Department of Commerce. https:// www.govinfo.gov/content/pkg/CZIC-ht393-m5-u5-1978/html/CZIC-ht393m5-u5-1978.htm
28. Michigan Department of Environment, Great Lakes, and Energy. (2023, May). Michigan resilient coastal communities planning guide. https://www. michigan.gov/egle/-/media/Project/Websites/egle/Documents/Programs/WRD/ Coastal-Management/Resilient-Coastal-Communities-Planning-Guide.pdf
29. Fuller, K. (2023, July 26). Dunes on Lake Michigan [Photograph]. Unsplash. https://unsplash.com/photos/a-sandy-path-leading-to-the-oceanunder-a-cloudy-blue-sky-GxHrlnmvU8A
30. Michigan Department of Environment, Great Lakes, and Energy. (2023, May). Michigan resilient coastal communities planning guide. https://www. michigan.gov/egle/-/media/Project/Websites/egle/Documents/Programs/WRD/ Coastal-Management/Resilient-Coastal-Communities-Planning-Guide.pdf
31. Superior Groundcover. (2020, October 5). Geotextile tubes on a lakeshore [Photograph]. https://www.superiorgroundcover.com/geotextile-tubes-forerosion-control/
32. Michigan Department of Environment, Great Lakes, and Energy. (2023, May). Michigan resilient coastal communities planning guide. https://www. michigan.gov/egle/-/media/Project/Websites/egle/Documents/Programs/WRD/ Coastal-Management/Resilient-Coastal-Communities-Planning-Guide.pdf
33. Van Buren Conservation District. (2026). Planting trees for clean water: Spring 2026. https://vanburencd.org/planting-trees-for-clean-waterspring-2026/
34. West Michigan Shoreline Regional Development Commission. (n.d.). Coastal zone management reforestation project. https://wmsrdc.org/project/ coastal-zone-management-reforestation-project/
35. Oceana Conservation District. (n.d.). The Oceana coastal conservation corridor. https://www.oceanaconservation.org/the-oceana-coastalconservation-corridor
36. Michigan Department of Environment, Great Lakes, and Energy. (2023, May). Michigan resilient coastal communities planning guide. https://www. michigan.gov/egle/-/media/Project/Websites/egle/Documents/Programs/WRD/ Coastal-Management/Resilient-Coastal-Communities-Planning-Guide.pdf
37. Michigan Department of Environment, Great Lakes, and Energy. (2023, May). Michigan resilient coastal communities planning guide. https://www.
michigan.gov/egle/-/media/Project/Websites/egle/Documents/Programs/WRD/ Coastal-Management/Resilient-Coastal-Communities-Planning-Guide.pdf
38. Bookspan, A. (2025, October 28). Chikaming Township discusses short term rentals future. WSBT. https://wsbt.com/news/local/chikaming-townshipdiscusses-short-term-rentals-future
39. Michigan Department of Environment, Great Lakes, and Energy. (n.d.). Coastal management. https://www.michigan.gov/egle/about/organization/ water-resources/coastal-management
40. Bowling, T. (2019, June). Lake Michigan shoreline management (Report No. NSGLC-19-04-04). National Sea Grant Law Center. http://nsglc.olemiss. edu/Advisory/pdfs/lake-michigan-shoreline.pdf
41. U.S. Army Corps of Engineers, New Orleans District. (n.d.). Nationwide permits program. https://www.mvn.usace.army.mil/Missions/Regulatory/ Permits/Nationwide-Permits-Program/
42. Chikaming Township. (2026, February 23). Chikaming Township master plan [Draft].
Coastal Management Considerations
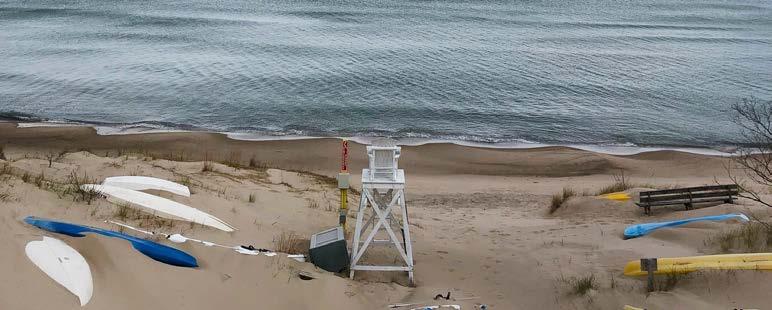
Based on the findings from our spatial analysis, scenario-based planning, and policy analysis we have identified three zoning ordinance amendments that Chikaming Township might consider to further advance coastal management and shoreline preservation goals through its draft master plan and other ongoing efforts.
These considerations are informed especially by the best practices that other coastal communities along Lake Michigan have used to achieve similar goals. Any of these approaches might be developed independently of the others, or advanced as an integrated package in some combination.
Figure 47. Cherry Beach, Chikaming Township | Source: Chikaming Township
5.1 Create a Senstive Area Overlay District Jurisdiction-Wide
Given the technical analyses presented earlier in this report, Chikaming Township might consider creating a Sensitive Area Overlay District, instead of the Dune Zone Overlay proposed by the draft master plan. Section 324.35213(2) of Michigan’s Natural Resources & Environmental Protection Act (NREPA) states that local zoning ordinances cannot have critical dune area protections that are more restrictive than the provisions in the model zoning plan. Given this regulation, it is unlikely that a Dune Zone Overlay District with additional critical dune area protections would be approved by EGLE.
A well-crafted Sensitive Area Overlay District, in contrast, would allow Chikaming Township to regulate development across all of its environmentally sensitive areas and features – including critical dunes and high risk erosion areas, without violating NREPA restrictions. Regulations for this district might include measures such as impervious surface restrictions and density limitations that align with the township’s shoreline preservation and management goals. Further, this overlay would allow Chikaming Township to bring all of its sensitive area ordinances (e.g., Floodplain Ordinance No. 35 and Anti-Armoring Ordinance No. 147) into coherence – creating required conditions for approval of development in sensitive areas. The district would also empower the planning commission with increased oversight over development in these sensitive areas, ensuring compliance with local and state laws, and increasing the ordinance’s efficacy and enforceability.
Finally, such an overlay district would allow the township to respond to changes within its coastal areas that are driven by the coastal shoreline shifts and hazards, especially those being amplified by climate change, as envisioned through our scenario-based planning technical assessments. Current FEMA
floodplain maps provide some level of protection from flooding, but they quickly become outdated and are backwards looking, as they are based primarily on past storm patterns and do not fully account for climate change driven potential future storm events. A sensitive overlay district could be used to provide enhanced resource protection and flood-risk mitigation features, such as additional development limitations within an expanded buffer from the current FEMA-mapped hazard zones, as captured for example by the Expanded Hazard Zone (EHZ) coastal management area model for the flood-risk scenario planning assessment presented above.
Figure 48: Lake Michigan shoreline in Chikaming Township | Source: Chikaming Township43
5.2 Create a Beach Overlay District and Lakefront Setback
Based on the MLRS
To bolster coastal preservation and erosion control efforts, Chikaming Township might consider developing a beach overlay district (BOD) for its nearshore coastal area, perhaps corresponding to the 900 ft. distance from the shoreline identified as the nearshore coastal area for the spatial analysis presented in Part 2 of this report. This type of overlay district is a best practice used by Lake Michigan coastal communities like Grand Haven and Saugatuck.
The benefits of a BOD are several-fold. First, establishing a BOD that is tied geographically to the shoreline alone, rather than being bounded landward by existing parcels and roadways adjacent to the shoreline, better reflects the influence of coastal dynamics and the potential for the shoreline to recede landward over time. Second, adopting a BOD would offer an appropriate mechanism to codify the township’s anti-armoring policies in the zoning ordinance, rather than relying on a stand-alone police power ordinance alone, thereby increasing the enforceability of those policies. Third, a BOD could also be used to appropriately and effectively establish a dynamic shoreline setback and, potentially, one based on a projected MLRS, which is premised on likely future shoreline recession, rather than an ordinary high water mark, which is premised on past shoreline movement.
A dynamic shoreline setback might be established by incorporating expressly within a BOD the intent to revisit the placement of that setback periodically over time and assess its appropriate placement given changing shoreline conditions. In addition, that setback might be specified using geospatial longitude and latitude lines that are easier for residents and local officials to discern, and that are not as subject to enforcement challenges that might arise with setbacks connected to ordinary high water mark delineations. Consistent with the scenario-based planning technical assessment focusing on potential shoreline recession, presented in Section 3 above, the BOD setback might also be tied to a MLRS line that best reflects the township’s assessment of likely future shoreline movement given climate change, that best incorporates its risk tolerance given that likely shoreline movement (i.e., adopting the Lucky,
Expected, or Perfect Storm climate future scenario).
The use of an MLRS line would offer the benefit of employing a setback based on scientific analysis of actual shoreline dynamics, relative to establishing a standardized but more arbitrary setback distance. It would also reflect conceptually, in a more straightforward way, the relevant setback line for regulating future development and redevelopment along a dynamic Great Lakes coastal shoreline–that is, a line that would limit development or redevelopment lakeward of the most landward reach of the shoreline corresponding to a likely future period of high lake levels. The potential drawback of employing an MLRS line would be that it would require deciding expressly what level of risk tolerance to employ, and it would also necessarily implicate scientific uncertainties associated with measuring and predicting Great Lake coastal processes accurately.
Should the township want to explore further the option of establishing both a BOD and a dynamic shoreline setback premised on the MLRS within the BOD, it should conduct further analysis and community-based planning to further fine-tune and verify the accuracy of the MLRS estimations presented here, establish the community’s level of risk tolerance for shoreline erosion and the appropriate MLRS to adopt accordingly (i.e., one premised on a
5.3 Amend the Floodplain Overlay District
Our scenario-based planning exercise projected significant future inland flooding risks along Chikaming Township’s coastal rivers and streams, even–or perhaps especially–for existing structures situated today immediately adjacent to existing FEMA-mapped flooding hazard zones. Given that assessment, the Township might consider amending the existing Floodplain Overlay District provided in Article 5, Section 5.01(K) of its zoning ordinance to increase protections
against future flooding incidences.44 This amendment might include expanding outward the flood hazard management area and adopting additional riskreduction provisions, such as, for example, increasing increasing restrictions on filling and backfilling within the hazard area, or requiring that structures situated within the expanded hazard zone be elevated, either proactively or should a structure be damaged by a flood event.
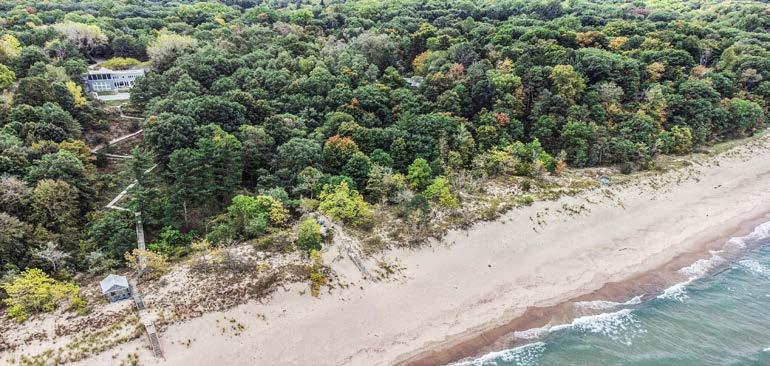
Figure 49: Aerial view of Lake Michigan shoreline in Chikaming Township | Source: Living in Michigan45
End Notes
43. https://www.facebook.com/profile.php?id=100064514179897
44. Chikaming Township Zoning Ordinance, art. 5, § 5.01(K) (2019, amended 2023). https://chikaming-mi-township.squarespace.com/s/ Chikaming-Zoning-Ordinance-Effective-March-4-2023-with-Map.pdf
45. https://livinginmichigan.com/properties/listing/Realcomp/69025045648/ Chikaming-Township/VL--1-+-3-Dune-Road
(page intentionally left blank)
Bibliography
1. The information presented in the introduction to this report is drawn from various sources, including the following:
• Shifting sands: Michigan’s great lake shores. (n.d.). https://www. michbar.org/journal/Details/Shifting-sands-Michigans-great-lakeshores?ArticleID=4447
• Michigan Coastal Management Program. (2023). Resilient Coastal Communities Planning Guide. https://www.michigan.gov/egle/-/media/ Project/Websites/egle/Documents/Programs/WRD/Coastal-Management/ Resilient-Coastal-Communities-Planning-Guide.pdf
• Norton, R., Meadows, G., & Meadows, L. (2013). The deceptively complicated “elevation ordinary high water mark” and the problem with using it on a Laurentian Great Lakes shore.Journal of Great Lakes Research, 39(4), 527-535. http://doi.org/10.1016/j.jglr.2013.09.008
• Richard K. Norton, Nina P. David, Stephen Buckman, Patricia D. Koman, Overlooking the coast: Limited local planning for coastal area management along Michigan’s Great Lakes, Land Use Policy, Volume 71, 2018, Pages 183-203,ISSN 0264-8377, https://doi.org/10.1016/j. landusepol.2017.11.049.
2. Richard K. Norton, Guy A. Meadows, Oday Salim, Matthew Piggins, Phillip Washburn & Lauren A. Week, Armor or Withdraw? Likely Litigation and Potential Adjudication of Shoreland Conflicts Along Michigan’s Shifting Great Lake Coasts, 12 MICH. J. ENVTL. & ADMIN. L. 153 (2023).
3. Richard K. Norton, Nina P. David, Stephen Buckman, Patricia D. Koman,
Overlooking the coast: Limited local planning for coastal area management along Michigan’s Great Lakes, Land Use Policy, Volume 71, 2018, Pages 183-203,ISSN 0264-8377, https://doi.org/10.1016/j.landusepol.2017.11.049.
4. Township of Chikaming Berrien County, Michigan Ordinance No. 147. (2021). https://www.chikamingtownship.org/s/Ordinance147.pdf
5. Township of Chikaming Berrien County, Michigan Ordinance No. 147. (2021). https://www.chikamingtownship.org/s/Ordinance147.pdf
6. Richard K. Norton, Guy A. Meadows, Oday Salim, Matthew Piggins, Phillip Washburn & Lauren A. Week, Armor or Withdraw? Likely Litigation and Potential Adjudication of Shoreland Conflicts Along Michigan’s Shifting Great Lake Coasts, 12 MICH. J. ENVTL. & ADMIN. L. 153 (2023).
7. The MLRS can be conceptualized as the likely future location of the natural ordinary high water mark (NOHWM) following a period of rising lake levels and extensive shoreline recession. The NOHWM is that line along the shore where there is physical evidence of the presence of lake water and the line demarcating dry upland from submerged bottomland in the past, marking also the line below which the public enjoys Michigan public trust doctrine rights to traverse along the shore. See Norton, Meadows, and Meadows (2013).
8. Dr. Ethan J. Theuerkauf, Assistant Professor, Department of Geography, Environment and Spatial Sciences, College of Social Science, Michigan State University and Francisca Andrea Nunez Ferreira, Research Scientist, Michigan State University
9. Regrid is a data company that specializes in land parcel data and property
information databases. Its webpage can be accessed here.https://regrid.com
10. Norton, Richard & Buckman, Stephen & Meadows, Guy & Rable, Zachary. (2019). Using Simple, Decision-Centered, Scenario-Based Planning to Improve Local Coastal Management. Journal of the American Planning Association. 85. 1-19. 10.1080/01944363.2019.1627237.
11. Chikaming Township. (2023). Zoning Ordinance, effective March 4, 2023. Sections 4.02, 5.01.C.
12. FEMA’s National Flood Hazard Layer (NFHL) Viewer. https://www.arcgis.com/apps/webappviewer/index. html?id=8b0adb51996444d4879338b5529aa9cd
13. Regrid is a data company that specializes in land parcel data and property information databases. Its webpage can be accessed here. - https://regrid. com
14. U.S. Geological Survey. National Hydrography Dataset (NHD). https:// www.usgs.gov/national-hydrography
15. U.S. Fish & Wildlife Service. National Wetlands Inventory (NWI). https:// www.fws.gov/program/national-wetlands-inventory
16. Michigan Natural Resources and Environmental Protection Act (NREPA), Act 451 of 1994, Part 325 — Great Lakes Submerged Lands. Ordinary High Water Mark (OHWM) setback provisions.
17. Dr. Ethan J. Theuerkauf, Assistant Professor, Department of Geography,
Environment and Spatial Sciences, College of Social Science, Michigan State University and Francisca Andrea Nunez Ferreira, Research Scientist, Michigan State University
18. The information presented in the introduction of this section is drawn from various sources including the following:
• Shifting sands: Michigan’s great lake shores. (n.d.). https:// www. michbar.org/journal/Details/Shifting-sands-Michigans-greatlakeshores?ArticleID=4447
• Michigan Coastal Management Program. (2023). Resilient Coastal Communities Planning Guide. https://www.michigan.gov/egle/-/media/ Project/Websites/egle/Documents/Programs/WRD/Coastal-Management/ Resilient-Coastal-Communities-Planning-Guide.pdf
• Norton, R., Meadows, G., & Meadows, L. (2013). The deceptively complicated “elevation ordinary high water mark” and the problem with using it on a Laurentian Great Lakes shore.Journal of Great Lakes Research, 39(4), 527-535. http://doi.org/10.1016/j.jglr.2013.09.008
•
• Richard K. Norton, Nina P. David, Stephen Buckman, Patricia D. Koman, Overlooking the coast: Limited local planning for coastal area management along Michigan’s Great Lakes, Land Use Policy, Volume 71, 2018, Pages 183203,ISSN 0264-8377, https://doi.org/10.1016/j. landusepol.2017.11.049.
19. Coastal Zone Management Act of 1972, 16 U.S.C. §§ 1451–1464 (1972). https://uscode.house.gov/view.xhtml?path=/prelim@title16/ chapter33&edition=prelim
20. Michigan Planning Enabling Act, 33 Mich. Comp. Laws § 125.3801 et seq (2008). https://www.legislature.mi.gov/documents/mcl/pdf/mcl-Act-33-of-2008. pdf
21. Michigan Zoning Enabling Act, Mich. Comp. Laws §§ 125.3101–125.3702 (2006). https://www.legislature.mi.gov/Laws/MCL?objectName=mcl-act-110of-2006
22. Natural Resources and Environmental Protection Act, Mich. Comp. Laws §§ 324.101–324.99923 (1994). https://www.legislature.mi.gov/Laws/ MCL?objectName=mcl-act-451-of-1994
23. City of Grand Haven, MI. (n.d.). Zoning ordinance, art. IV, § 40-422. Code of Ordinances. https://library.municode.com/mi/grand_haven/codes/code_of_ ordinances
24. City of St. Joseph, MI. (2007). Zoning ordinance, art. IX, §§ 9.5–9.7. Code of Ordinances, Appendix A. https://library.municode.com/mi/st._joseph/
25. City of Manistee, MI. (2006). Zoning ordinance, art. 5, § 505. https://www. manisteemi.gov/149/Zoning-Ordinance
26. Bowling, T. (2019, June). Lake Michigan shoreline management (Report No. NSGLC-19-04-04). National Sea Grant Law Center. http://nsglc.olemiss. edu/Advisory/pdfs/lake-michigan-shoreline.pdf
27. National Oceanic and Atmospheric Administration, Office of Coastal Zone Management, & Michigan Department of Natural Resources, Division of Land Resource Programs. (1978, July). United States Department of Commerce combined coastal management program and final environmental impact statement for the State of Michigan. U.S. Department of Commerce. https:// www.govinfo.gov/content/pkg/CZIC-ht393-m5-u5-1978/html/CZIC-ht393m5-u5-1978.htm
28. Michigan Department of Environment, Great Lakes, and Energy. (2023, May). Michigan resilient coastal communities planning guide. https://www. michigan.gov/egle/-/media/Project/Websites/egle/Documents/Programs/ WRD/Coastal-Management/Resilient-Coastal-Communities-Planning-Guide. pdf
29. Fuller, K. (2023, July 26). Dunes on Lake Michigan [Photograph]. Unsplash. https://unsplash.com/photos/a-sandy-path-leading-to-the-oceanunder-a-cloudy-blue-sky-GxHrlnmvU8A
30. Michigan Department of Environment, Great Lakes, and Energy. (2023, May). Michigan resilient coastal communities planning guide. https://www. michigan.gov/egle/-/media/Project/Websites/egle/Documents/Programs/WRD/ Coastal-Management/Resilient-Coastal-Communities-Planning-Guide.pdf
31. Superior Groundcover. (2020, October 5). Geotextile tubes on a lakeshore [Photograph]. https://www.superiorgroundcover.com/geotextile-tubes-forerosion-control/
32. Michigan Department of Environment, Great Lakes, and Energy. (2023, May). Michigan resilient coastal communities planning guide. https://www. michigan.gov/egle/-/media/Project/Websites/egle/Documents/Programs/WRD/ Coastal-Management/Resilient-Coastal-Communities-Planning-Guide.pdf
33. Van Buren Conservation District. (2026). Planting trees for clean water: Spring 2026. https://vanburencd.org/planting-trees-for-clean-waterspring-2026/
34. West Michigan Shoreline Regional Development Commission. (n.d.). Coastal zone management reforestation project. https://wmsrdc.org/project/ coastal-zone-management-reforestation-project/
35. Oceana Conservation District. (n.d.). The Oceana coastal conservation corridor. https://www.oceanaconservation.org/the-oceana-coastalconservation-corridor
36. Michigan Department of Environment, Great Lakes, and Energy. (2023, May). Michigan resilient coastal communities planning guide. https://www. michigan.gov/egle/-/media/Project/Websites/egle/Documents/Programs/WRD/ Coastal-Management/Resilient-Coastal-Communities-Planning-Guide.pdf
37. Michigan Department of Environment, Great Lakes, and Energy. (2023, May). Michigan resilient coastal communities planning guide. https://www. michigan.gov/egle/-/media/Project/Websites/egle/Documents/Programs/WRD/ Coastal-Management/Resilient-Coastal-Communities-Planning-Guide.pdf
38. Bookspan, A. (2025, October 28). Chikaming Township discusses short term rentals future. WSBT. https://wsbt.com/news/local/chikaming-townshipdiscusses-short-term-rentals-future
Shoreland Management - Chikaming Township, MI
39. Michigan Department of Environment, Great Lakes, and Energy. (n.d.). Coastal management. https://www.michigan.gov/egle/about/organization/ water-resources/coastal-management
40. Bowling, T. (2019, June). Lake Michigan shoreline management (Report No. NSGLC-19-04-04). National Sea Grant Law Center. http://nsglc.olemiss. edu/Advisory/pdfs/lake-michigan-shoreline.pdf
41. U.S. Army Corps of Engineers, New Orleans District. (n.d.). Nationwide permits program. https://www.mvn.usace.army.mil/Missions/Regulatory/ Permits/Nationwide-Permits-Program/
42. Chikaming Township. (2026, February 23). Chikaming Township master plan [Draft].
43. https://www.facebook.com/profile.php?id=100064514179897
44. Chikaming Township Zoning Ordinance, art. 5, § 5.01(K) (2019, amended 2023). https://chikaming-mi-township.squarespace.com/s/Chikaming-ZoningOrdinance-Effective-March-4-2023-with-Map.pdf
45. https://livinginmichigan.com/properties/listing/Realcomp/69025045648/ Chikaming-Township/VL--1-+-3-Dune-Road