2025-2026 NMVISTAS SCHOOL REPORT CARDS


MATH PROFICIENCY
RE ADING PROFICIENCY
New Mexico: 25%
The percentage of students who are pro cient and above in math
New Mexico: 43%
The percentage of students who are pro cient and above in reading
New Mexico: 35%
New Mexico: 50th
Growth is a percentile measured for students in grades 4-8 that show improvement on the MSSA Math test compared to peers.**
DESIGNATIONS
The percentage of students who are pro cient and above in science GR ADUATION R ATE
New Mexico: 49th
Growth is a percentile measured for students in grades 4-8 that show improvement on the MSSA Reading test compared to peers.**
New Mexico: 78%
The percentage of students who graduated in four years *
New Mexico: 71%
The percentage of students who were present for more than 90% of enrolled school days.
Spotlight: Highest recognition; schools among the top 25% of schools
Traditional: Good standing; not in designation
New Mexico: 0.9%
The annual increase in the four-year graduation rate over three years
New Mexico: 89%
The percentage of high school students who have par ticipated in college and career preparator y courses or assessments.***
Targeted Support and Improvement School (TSI): Schools with consistently underper forming student groups
Additional Targeted Support and Improvement School (ATSI): Schools in need of suppor t with one or more of the lowest per forming groups of students
Comprehensive Support and Improvement School (CSI): Schools scoring in the bottom 5% of Title I schools overall or that have a graduation rate below 67%
More Rigorous Inter ventions (MRI): Schools not exiting CSI Status after 3 years receiving suppor t
Masked: Data not available due to masking
N/A: Data not applicable to this school or is other wise unavailable
*Graduation Growth: Because students graduate throughout the summer, graduation data is one year lagged. This gure represents the graduating class of 2024.
**Math/Reading Growth: A student's peers for growth are others in their grade who had the same score on a previous year ' s test. The median growth of a school or district is the growth of the middle student of that school or district A student at the 50th percentile of growth has typical growth for their peer group, while a student at the 70th percentile has more than typical growth for their peer group
***College and Career Readiness (CCR): This includes students who, for example, took a Dual Credit course or an Advanced Placement test
Enos Garcia Elementary PRE-K - 5TH
Ranchos De Taos Elementary PRE-K - 5TH
New Mexico: 25%
The percentage of students who are pro cient and above in math
New Mexico: 43%
The percentage of students who are pro cient and above in reading
Taos Municipal Charter K - 8TH
New Mexico: 50th
Growth is a percentile measured for students in grades 4-8 that show improvement on the MSSA Math test compared to peers.**
New Mexico: 35%
The percentage of students who are pro cient and above in science
New Mexico: 49th
Growth is a percentile measured for students in grades 4-8 that show improvement on the MSSA Reading test compared to peers.**
New Mexico: 78%
The percentage of students who graduated in four years *
New Mexico: 71%
The percentage of students who were present for more than 90% of enrolled school days.
For more details on these metrics, please visit
DESIGNATIONS
Spotlight: Highest recognition; schools among the top 25% of schools
Traditional: Good standing; not in designation
New Mexico: 0.9%
The annual increase in the four-year graduation rate over three years
New Mexico: 89%
The percentage of high school students who have par ticipated in college and career preparator y courses or assessments.***
Targeted Support and Improvement School (TSI): Schools with consistently underper forming student groups
Additional Targeted Support and Improvement School (ATSI): Schools in need of suppor t with one or more of the lowest per forming groups of students
Comprehensive Support and Improvement School (CSI): Schools scoring in the bottom 5% of Title I schools overall or that have a graduation rate below 67%
More Rigorous Inter ventions (MRI): Schools not exiting CSI Status after 3 years receiving suppor t
Masked: Data not available due to masking
N/A: Data not applicable to this school or is other wise unavailable
*Graduation Growth: Because students graduate throughout the summer, graduation data is one year lagged. This gure represents the graduating class of 2024.
**Math/Reading Growth: A student's peers for growth are others in their grade who had the same score on a previous year ' s test. The median growth of a school or district is the growth of the middle student of that school or district A student at the 50th percentile of growth has typical growth for their peer group, while a student at the 70th percentile has more than typical growth for their peer group
***College and Career Readiness (CCR): This includes students who, for example, took a Dual Credit course or an Advanced Placement test
MATH PROFICIENCY
RE ADING PROFICIENCY
GR ADUATION R ATE

New Mexico: 25%
The percentage of students who are pro cient and above in math
New Mexico: 43%
The percentage of students who are pro cient and above in reading
New Mexico: 50th
Growth is a percentile measured for students in grades 4-8 that show improvement on the MSSA Math test compared to peers **
New Mexico: 35%
The percentage of students who are pro cient and above in science
New Mexico: 49th
Growth is a percentile measured for students in grades 4-8 that show improvement on the MSSA Reading test compared to peers **
New Mexico: 78%
The percentage of students who graduated in four years *
New Mexico: 71%
The percentage of students who were present for more than 90% of enrolled school days
Spotlight: Highest recognition; schools among the top 25% of schools
Traditional: Good standing; not in designation
New Mexico: 0 9%
The annual increase in the four-year graduation rate over three years
New Mexico: 89%
The percentage of high school students who have par ticipated in college and career preparator y courses or assessments ***
Targeted Support and Improvement School (TSI): Schools with consistently underper forming student groups
Additional Targeted Support and Improvement School (ATSI): Schools in need of suppor t with one or more of the lowest per forming groups of students
Comprehensive Support and Improvement School (CSI): Schools scoring in the bottom 5% of Title I schools overall or that have a graduation rate below 67%
More Rigorous Inter ventions (MRI): Schools not exiting CSI Status after 3 years receiving suppor t
Masked: Data not available due to masking
N/A: Data not applicable to this school or is other wise unavailable
*Graduation Growth: Because students graduate throughout the summer, graduation data is one year lagged. This gure represents the graduating class of 2024.
**Math/Reading Growth: A student's peers for growth are others in their grade who had the same score on a previous year ' s test The median growth of a school or district is the growth of the middle student of that school or district A student at the 50th percentile of growth has typical growth for their peer group, while a student at the 70th percentile has more than typical growth for their peer group.
***College and Career Readiness (CCR): This includes students who, for example, took a Dual Credit course or an Advanced Placement test.
New Mexico: 50th
Growth is a percentile measured for students in grades 4-8 that show improvement on the MSSA Math test compared to peers **
New Mexico: 49th
New Mexico: 71%
Growth is a percentile measured for students in grades 4-8 that show improvement on the MSSA Reading test compared to peers **
Spotlight: Highest recognition; schools among the top 25% of schools
Traditional: Good standing; not in designation
The percentage of students who were present for more than 90% of enrolled school days
Targeted Support and Improvement School (TSI): Schools with consistently underper forming student groups
Additional Targeted Support and Improvement School (ATSI): Schools in need of suppor t with one or more of the lowest per forming groups of students
Comprehensive Support and Improvement School (CSI): Schools scoring in the bottom 5% of Title I schools overall or that have a graduation rate below 67%
More Rigorous Inter ventions (MRI): Schools not exiting CSI Status after 3 years receiving suppor t
Masked: Data not available due to masking
N/A: Data not applicable to this school or is other wise unavailable
*Graduation Growth: Because students graduate throughout the summer, graduation data is one year lagged. This gure represents the graduating class of 2024.
**Math/Reading Growth: A student's peers for growth are others in their grade who had the same score on a previous year ' s test. The median growth of a school or district is the growth of the middle student of that school or district. A student at the 50th percentile of growth has typical growth for their peer group, while a student at the 70th percentile has more than typical growth for their peer group.
***College and Career Readiness (CCR): This includes students who, for example, took a Dual Credit course or an Advanced Placement test. MATH PROFICIENCY
PROFICIENCY
New Mexico: 25%
The percentage of students who are pro cient and above in math
New Mexico: 43%
The percentage of students who are pro cient and above in reading
New Mexico: 50th
New Mexico: 35%
The percentage of students who are pro cient and above in science
Growth is a percentile measured for students in grades 4-8 that show improvement on the MSSA Math test compared to peers.** RE
New Mexico: 49th
New Mexico: N/A
The percentage of students who graduated in four years *
Growth is a percentile measured for students in grades 4-8 that show improvement on the MSSA Reading test compared to peers.**

ADUATION GROWTH
New Mexico: N/A
The annual increase in the four-year graduation rate over three years
New Mexico: 71%
The percentage of students who were present for more than 90% of enrolled school days
For more details on these metrics, please visit nmvistas org
DESIGNATIONS
Spotlight: Highest recognition; schools among the top 25% of schools
Traditional: Good standing; not in designation
Targeted Support and Improvement School (TSI): Schools with consistently underper forming student
Additional Targeted Support and Improvement School (ATSI): Schools in need of
t with one or more of the lowest per forming groups of students
Comprehensive Support and Improvement School (CSI): Schools scoring in the bottom 5% of Title I schools overall or that have a graduation rate below 67%
More Rigorous Inter ventions (MRI): Schools not exiting CSI Status after 3 years receiving suppor t Red River Valley Charter School PRE-K - 8TH
New Mexico: 25%
The percentage of students who are pro cient and above in math
New Mexico: 43%
The percentage of students who are pro cient and above in reading SCIENCE PROFICIENCY
New Mexico: 35%
The percentage of students who are pro cient and above in science
New Mexico: 50th
Growth is a percentile measured for students in grades 4-8 that show improvement on the MSSA Math test compared to peers **
Roots & Wings Community K - 8TH
DESIGNATIONS
New Mexico: 49th
New Mexico: N/A
The percentage of students who graduated in four years *
Growth is a percentile measured for students in grades 4-8 that show improvement on the MSSA Reading test compared to peers **
Spotlight: Highest recognition; schools among the top 25% of schools
Traditional: Good standing; not in designation
New Mexico: N/A
The annual increase in the four-year graduation rate over three years
New Mexico: 71%
The percentage of students who were present for more than 90% of enrolled school days
Targeted Support and Improvement School (TSI): Schools with consistently underper forming student groups
Additional Targeted Support and Improvement School (ATSI): Schools in need of suppor t with one or more of the lowest per forming groups of students
Comprehensive Support and Improvement School (CSI): Schools scoring in the bottom 5% of Title I schools overall or that have a graduation rate below 67%
More Rigorous Inter ventions (MRI): Schools not exiting CSI Status after 3 years receiving suppor t
MATH PROFICIENCY
Masked: Data not available due to masking N/A: Data not applicable to this school or is other wise unavailable

*Graduation Growth: Because students graduate throughout the summer, graduation data is one year lagged This gure represents the graduating class of 2024
New Mexico: 25%
**Math/Reading Growth: A student's peers for growth are others in their grade who had the same score on a previous year ' s test The median growth of a school or district is the growth of the middle student of that school or district. A student at the 50th percentile of growth has typical growth for their peer group, while a student at the 70th percentile has more than typical growth for their peer group
New Mexico: 43%
The percentage of students who are pro cient and above in math
The percentage of students who are pro cient and above in reading
The percentage of students who are pro cient and above in science
The percentage of students who graduated in four years *
***College and Career Readiness (CCR): This includes students who, for example, took a Dual Credit course or an Advanced Placement test
The annual increase in the four-year graduation rate over three years
New Mexico: 50th
Growth is a percentile measured for students in grades 4-8 that show improvement on the MSSA Math test compared to peers **
Growth is a percentile measured for students in grades 4-8 that show improvement on the MSSA Reading test compared to peers **
The percentage of students who were present for more than 90% of enrolled school days.
The percentage of high school students who have par ticipated in college and career preparator y courses or assessments ***
MATH PROFICIENCY
RE
GR ADUATION R ATE
GR ADUATION GROWTH
New Mexico: 25%
The percentage of students who are pro cient and above in math
New Mexico: 43%
The percentage of students who are pro cient and above in reading
New Mexico: 50th
Growth is a percentile measured for students in grades 4-8 that show improvement on the MSSA Math test compared to peers **
New Mexico: 35%
The percentage of students who are pro cient and above in science
New Mexico: 49th
New Mexico: N/A
The percentage of students who graduated in four years *
Growth is a percentile measured for students in grades 4-8 that show improvement on the MSSA Reading test compared to peers **
DESIGNATIONS
Spotlight: Highest recognition; schools among the top 25% of schools
Traditional: Good standing; not in designation
New Mexico: N/A
The annual increase in the four-year graduation rate over three years
REGUL AR ATTENDANCE 89%
New Mexico: 71%
The percentage of students who were present for more than 90% of enrolled school days
Targeted Support and Improvement School (TSI): Schools with consistently underper forming student groups
Additional Targeted Support and Improvement School (ATSI): Schools in need of suppor t with one or more of the lowest per forming groups of students
Comprehensive Support and Improvement School (CSI): Schools scoring in the bottom 5% of Title I schools overall or that have a graduation rate below 67%
2024-2025 CHARTER SCHOOL REPORT CARD FOR
More Rigorous Inter ventions (MRI): Schools not exiting CSI Status after 3 years receiving suppor t
NOTES
MATH PROFICIENCY
Masked: Data not available due to masking N/A: Data not applicable to this school or is other wise unavailable
New Mexico: 25%
New Mexico: 43%
New Mexico: 35%

N/A
*Graduation Growth: Because students graduate throughout the summer, graduation data is one year lagged This gure represents the graduating class of 2024 **Math/Reading Growth: A student's peers for growth are others in their grade who had the same score on a previous year ' s test The median growth of a school or district is the growth of the middle student of that school or district A student at the 50th percentile of growth has typical growth for their peer group, while a student at the 70th percentile has more than typical growth for their peer group
The percentage of students who are pro cient and above in math
The percentage of students who are pro cient and above in reading SCIENCE PROFICIENCY
N/A
The percentage of students who are pro cient and above in science
Growth is a percentile measured for students in grades 4-8 that show improvement on the MSSA Math test compared to peers ** RE ADING GROWTH
The percentage of students who graduated in four years *
***College and Career Readiness (CCR): This includes students who, for example, took a Dual Credit course or an Advanced Placement test
The annual increase in the four-year graduation rate over three years MATH GROWTH 56th
New Mexico: 50th
New Mexico: 49th
Growth is a percentile measured for students in grades 4-8 that show improvement on the MSSA Reading test compared to peers **
The percentage of students who were present for more than 90% of enrolled school days
For more details on these metrics, please visit nmvistas.org
DESIGNATIONS
Spotlight: Highest recognition; schools among the top 25% of schools
Traditional: Good standing; not in designation
Targeted Support and Improvement School (TSI): Schools with consistently underper forming student groups
Taos International School K - 8TH MATH GROWTH 56th RE ADING GROWTH
Additional Targeted Support and Improvement School (ATSI): Schools in need of suppor t with one or more of the lowest per forming groups of students
Comprehensive Support and Improvement School (CSI): Schools scoring in the bottom 5% of Title I schools overall or that have a graduation rate below 67%
More Rigorous Inter ventions (MRI): Schools not exiting CSI Status after 3 years receiving suppor t
NOTES
New Mexico: 25%
The percentage of students who are
New Mexico: 43%
The percentage of students who are pro cient and above in reading
New Mexico: 35%
The percentage of students who are pro cient and above in science
New Mexico: 78%
The percentage of students who graduated in four years *
New Mexico: 0 9%
The annual increase in the four-year graduation rate over three years MATH GROWTH
RE ADINESS (CCR)
New Mexico: N/A
Growth is a percentile measured for students in grades 4-8 that show improvement on the MSSA Math test compared to peers **
New Mexico: N/A
Growth is a percentile measured for students in grades 4-8 that show improvement on the MSSA Reading test compared to peers **
DESIGNATIONS
New Mexico: 71%
The percentage of students who were present for more than 90% of enrolled school days.
Spotlight: Highest recognition; schools among the top 25% of schools
Traditional: Good standing; not in designation
New Mexico: 89%
The percentage of high school students who have par ticipated in college and career preparator y courses or assessments ***
Targeted Support and Improvement School (TSI): Schools with consistently underper forming student groups
Additional Targeted Support and Improvement School (ATSI): Schools in need of suppor t with one or more of the lowest per forming groups of students
Comprehensive Support and Improvement School (CSI): Schools scoring in the bottom 5% of Title I schools overall or that have a graduation rate below 67%
More Rigorous Inter ventions (MRI): Schools not exiting CSI Status after 3 years receiving suppor t
NOTES

MATH PROFICIENCY
Masked: Data not available due to masking
READING PROFICIENCY
SCIENCE PROFICIENCY
N/A: Data not applicable to this school or is other wise unavailable
*Graduation Growth: Because students graduate throughout the summer, graduation data is one year lagged. This gure represents the graduating class of 2024
**Math/Reading Growth: A student's peers for growth are others in their grade who had the same score on a previous year ' s test The median growth of a school or district is the growth of the middle student of that school or district. A student at the 50th percentile of growth has typical growth for their peer group, while a student at the 70th percentile has more than typical growth for their peer group
New Mexico: 25%
New Mexico: 43%
New Mexico: 35%
New Mexico: 78%
***College and Career Readiness (CCR): This includes students who, for example, took a Dual Credit course or an Advanced Placement test
The percentage of students who are pro cient and above in math.
The percentage of students who are pro cient and above in reading.
The percentage of students who are pro cient and above in science. GRADUATION RATE
The percentage of students who graduated in four years.*
The annual increase in the four-year graduation rate over three years. MATH GROWTH 48th
New Mexico: 50th
Growth is a percentile measured for students in grades 4-8 that show improvement on the MSSA Math test compared to peers.**
New Mexico: 49th
Growth is a percentile measured for students in grades 4-8 that show improvement on the MSSA Reading test compared to peers.**
Growth is a percentile measured for students in grades 4-8 that show improvement on the MSSA Math test compared to peers.** READING GROWTH 53.5th
New Mexico: 71%
The percentage of students who were present for more than 90% of enrolled school days.
New Mexico: 89%
The percentage of high school students who have participated in college and career preparatory courses or assessments.***
The annual increase in the four-year graduation rate over three years. MATH GROWTH 55th New Mexico: 50th

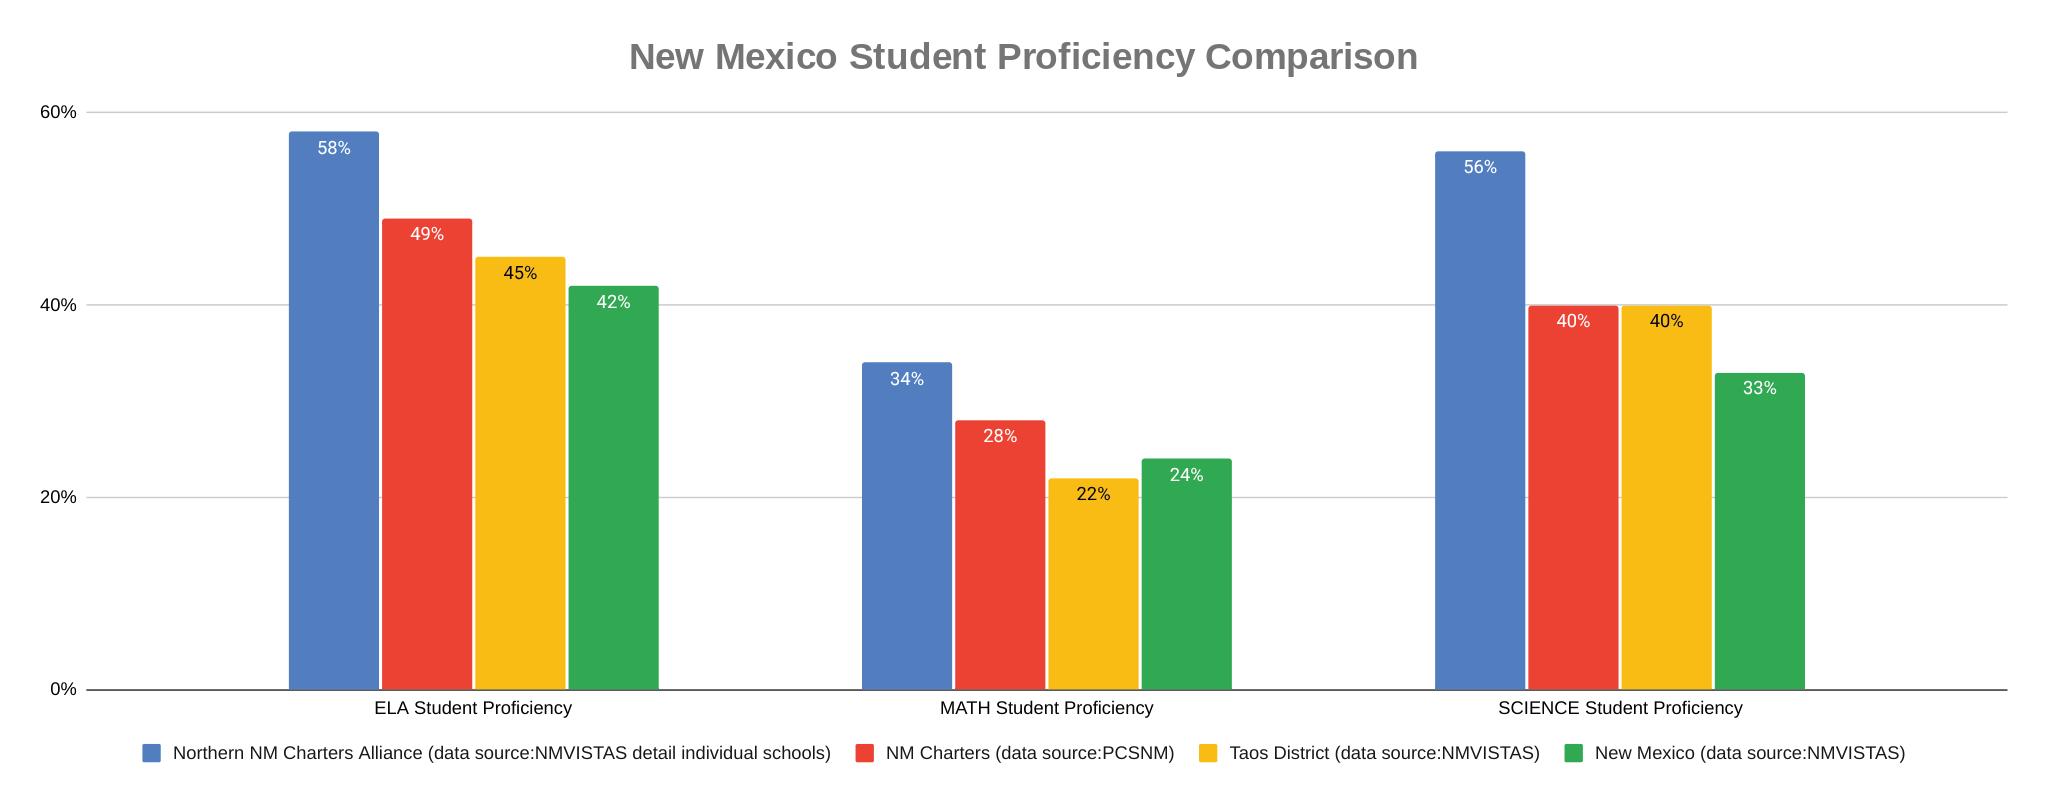
TAOS, NM — Leaders from eight regional charter schools have announced the formation of the Northern New Mexico Charter Alliance (NNMCA). This collaborative network is designed to strengthen public education through shared expertise, regional advocacy, and expanded student experiences across Northern New Mexico.
The NNMCA brings together schools with diverse educational models—including arts integration, inquiry-based learning, and global citizenship—to better serve rural families. By uniting, the member schools aim to:
● Share Best Practices: Collaborate on operational challenges and professional training.
● Expand Student Experiences: Create regional events such as arts showcases, academic competitions, and service-learning projects.
● Strengthen Advocacy: Ensure charter schools are recognized and supported as essential public assets within the state.
NNMCA Member Schools:
● Anansi Charter School: Academic potential paired with emotional intelligence (Grades K–8)
● Moreno Valley Prep: Leadership and academic preparation for future success (Grades 9–12)
● Red River Valley Charter School: Core Knowledge and well-rounded student development (Grades K-8)
● Roots & Wings Community School: Personal excellence through hands-on Expeditionary learning (Grades K-8)
● Taos Academy: Academic excellence, leadership and social responsibility (Grades 5–12)
● Taos Charter School: Inquiry-based learning with deep community ties (Grades K–8)
● Taos Integrated School of the Arts: Arts-integrated, multicultural learning (Grades K–8)
● Taos International School: Dual-language and International Baccalaureate (IB, Grades K–8)
● Vista Grande High School: Holistic, inclusive, and sustainable growth (Grades 9–12)
The Alliance invites local families to learn more about the opportunities these schools offer. Attend the Charter School Family Choice Fair at Bataan Hall from 11:00 to 2:00 on Saturday, March 7th.