The Healthy Street Dividend
The Economic, Social, and Environmental Case for Street Transformations
Acknowledgements
Published by
Deutsche Gesellschaft für Internationale Zusammenarbeit (GIZ) GmbH
Registered Offices
Bonn and Eschborn, Germany
B-5/2, Safdarjung Enclave
New Delhi-110029, India
T 011-49495353
F 011-49495391
E giz-indien@giz.de
As at June 2026, New Delhi
Prepared under
Sustainable Urban Mobility- Air Quality, Climate Action and Accessibility (SUM-ACA)
Commissioned by
Federal Ministry for Economic Cooperation and Development (BMZ), Germany
Political Partner
Ministry of Housing and Urban Affairs (MoHUA), Government of India
Responsible
Manjunath Sekhar
Project Director, SUM-ACA
Project Advisor
GIZ: Neetu Anna Joseph, Rana Anwar Amani
GFA Consulting Group GmbH: Zohra Mutabanna
Project Team:
ITDP India: Aswathy Dilip, Kashmira Dubash, Nivetha K, Varsha Vasuhe V, Venugopal AV
Contributors, ITDP India: Adith C, Roopesh K, Rutuja N, Sanchana S, Shubhra S, Suraj B
Strategies2Scale: Mitali Nikore, Abhishek Choudhary, Mozaien Tak, Vijay Sriniketan
Reviewers
Sudesh Kumar
Design and Layout
ITDP India: Varsha Jeyapandi
Litmus Ink
Editorial
Archita S
ITDP India: Donita Jose
Photo and Map Credits
GIZ, ITDP, and other sources as indicated.
Acknowledgement
We would like to thank Raahgiri Foundation, Arcadis, The Urban Lab, Oasis and city corporations involved in this study for supporting with data collection.
Disclaimer
Any maps used in the document are for informational purposes only and do not constitute recognition of international boundaries or regions; GIZ makes no claims concerning the validity, accuracy or completeness of the maps nor assumes any liability resulting from the use of the information therein. GIZ is responsible for the content of this publication.
Copyright
All rights reserved.


The Deutsche Gesellschaft für Internationale Zusammenarbeit (GIZ) GmbH has been operating in India for over 60 years. It has offices in Delhi and Bengaluru, in addition to other locations in the country.
Sustainable Urban Mobility - Air quality, Climate action, Accessibility (SUM-ACA) is implemented jointly by the Ministry of Housing and Urban Affairs (MoHU and Deutsche Gesellschaft für Internationale Zusammenarbeit (GIZ) GmbH, commissioned by the German Federal Ministry for Economic Cooperation and Development (BMZ). The project objective is to enable national, state and municipal institutions to promote climate and environmentally friendly, low emission and socially balanced urban mobility systems. The project is part of the Green Urban Mobility Partnership between Germany and India.
India and Germany have been partners for over six decades in making urban development projects environment-friendly. To further deepen this cooperation, in November 2019, the Ministry of Housing & Urban Affairs (MoHUA), the Government of India and the German Federal Ministry for Economic Cooperation and Development (BMZ) signed a Joint Declaration of Intent on Green Urban Mobility Partnership (GUMP). Both countries agreed to collaborate more closely to transform urban transport systems through more efficient, people-centric and low carbon mobility solutions. BMZ is funding a wide range of sustainable urban mobility infrastructure improvement measures such as city bus transport systems, trams, water transport, cable cars, non-motorised transport, and multimodal integration. In addition, Deutsche Gesellschaft für Internationale Zusammenarbeit GmbH (GIZ) is providing technical cooperation to enhance the capacities of national, state and local institutions and decision-makers for designing sustainable, inclusive and smart solutions for easy and affordable mobility.

The Institute for Transportation & Development Policy (ITDP) is a global non-for-profit organisation that works with cities worldwide to promote transport solutions that reduce traffic congestion, air pollution, and greenhouse emissions while improving urban liveability and economic opportunity.
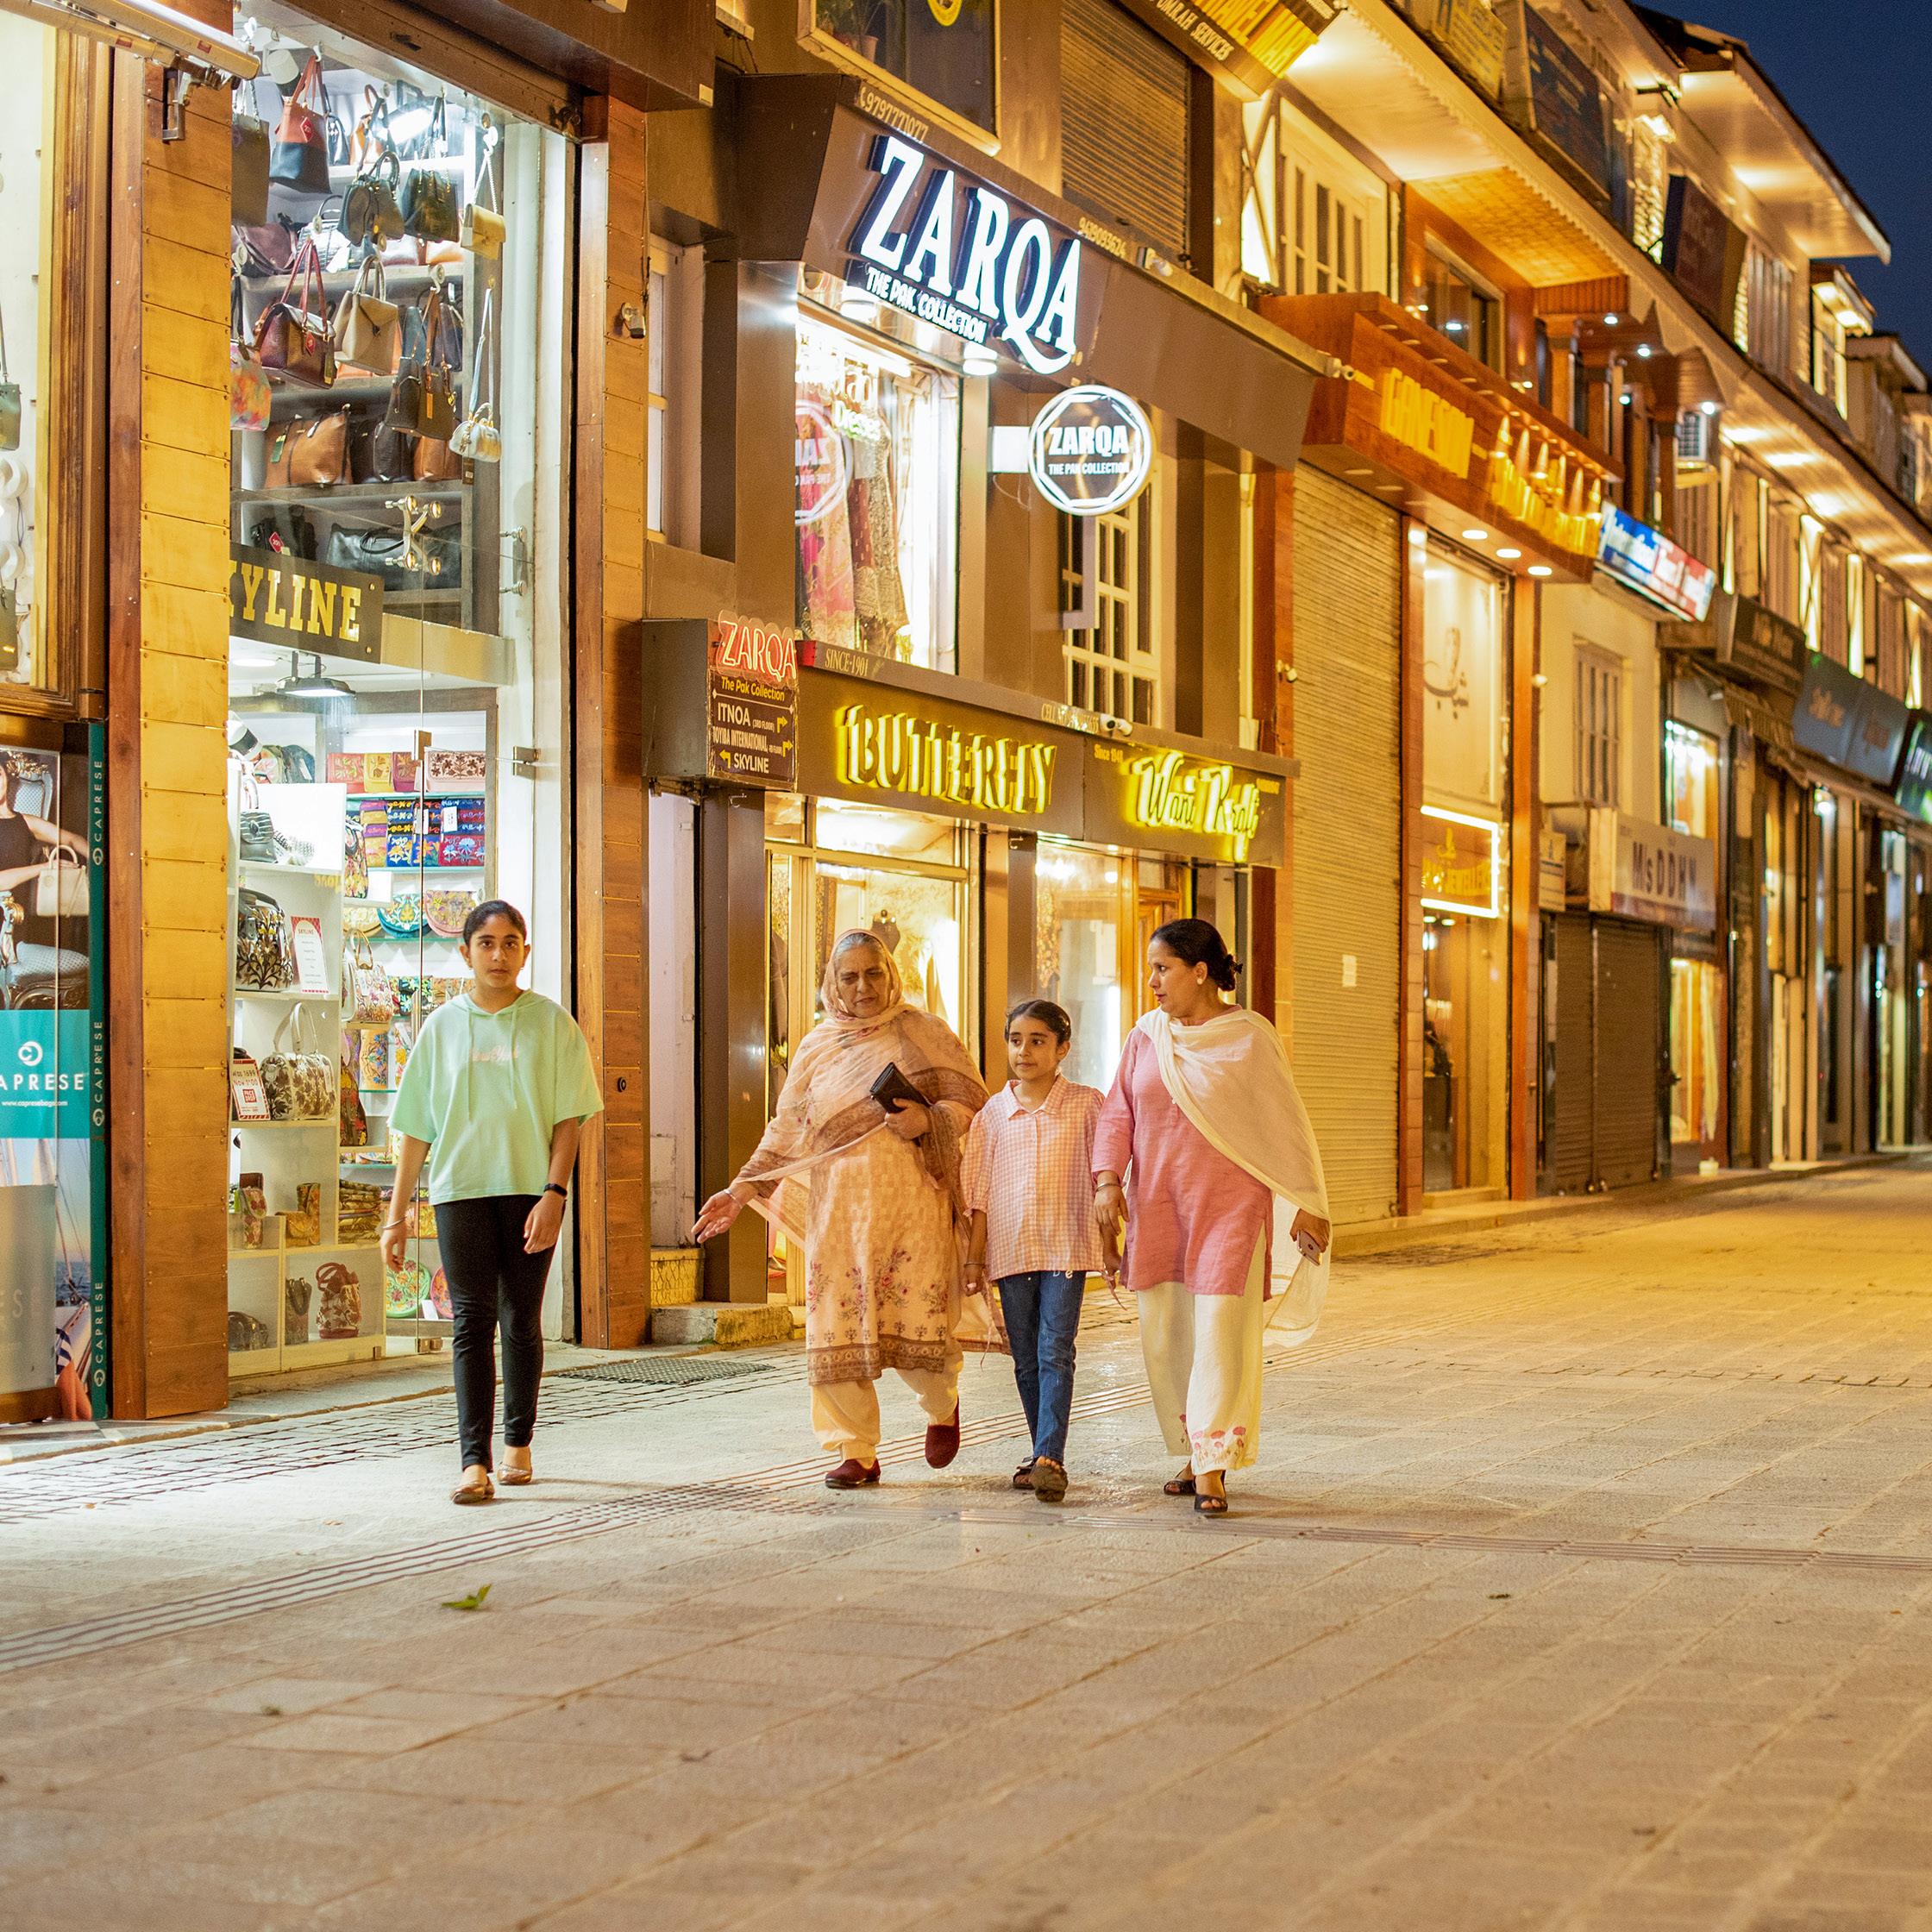
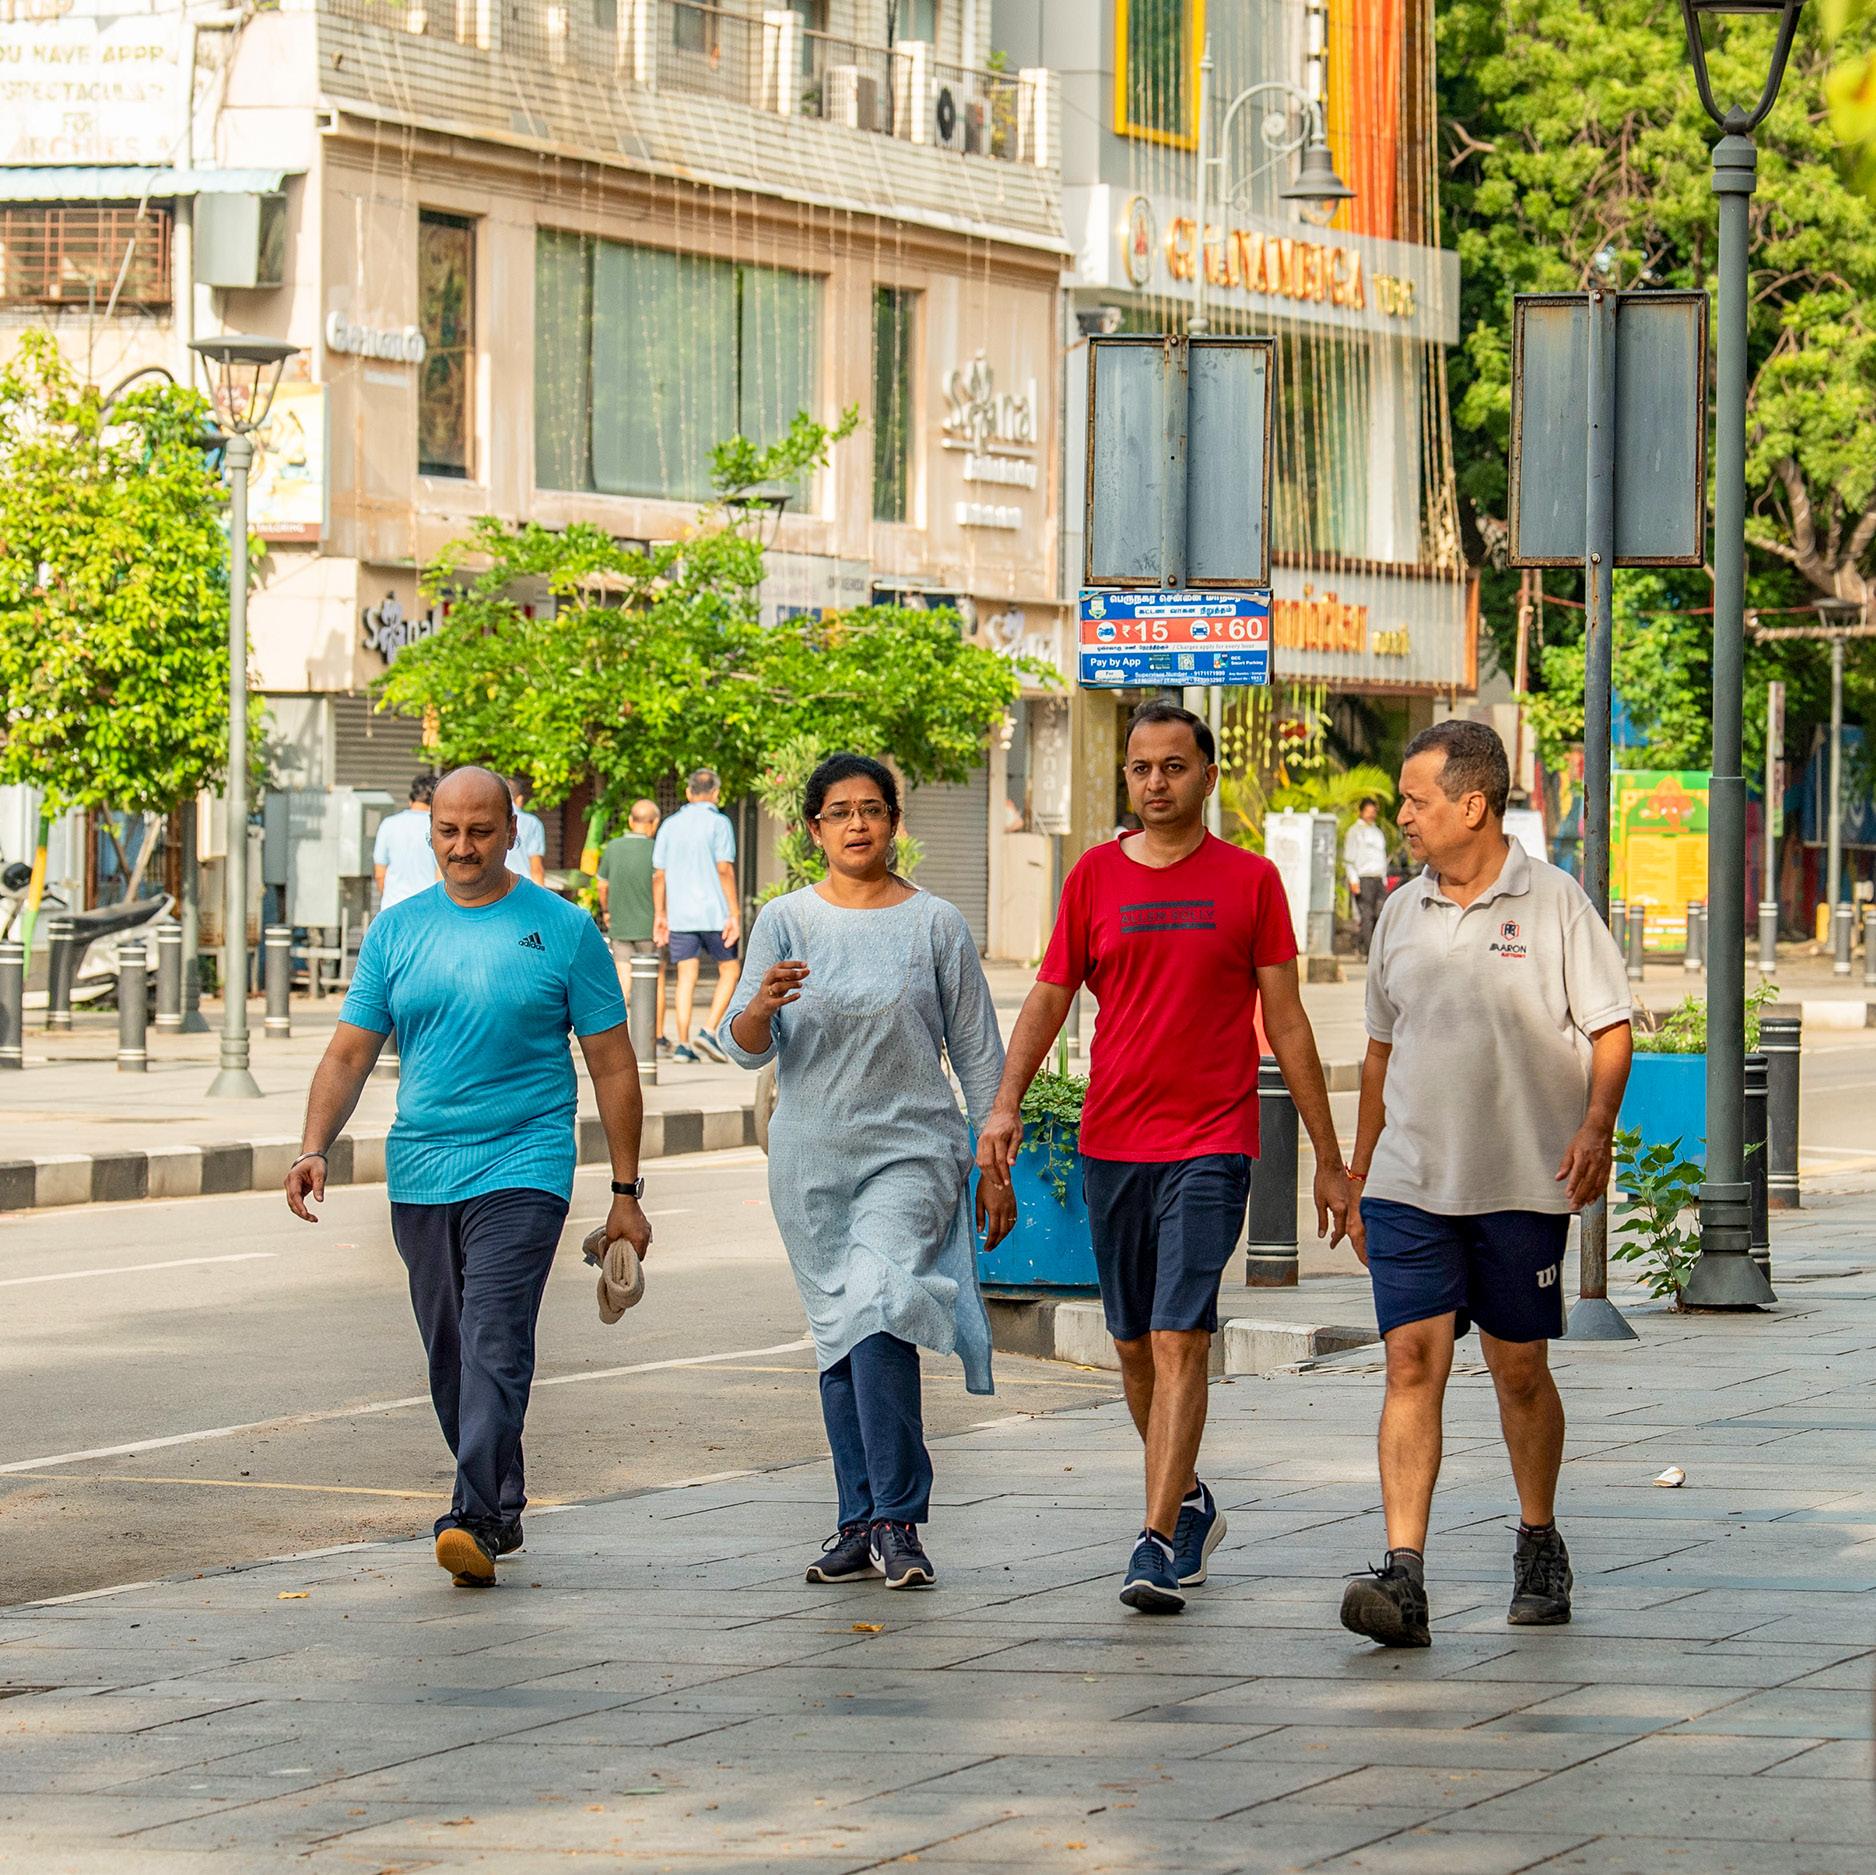
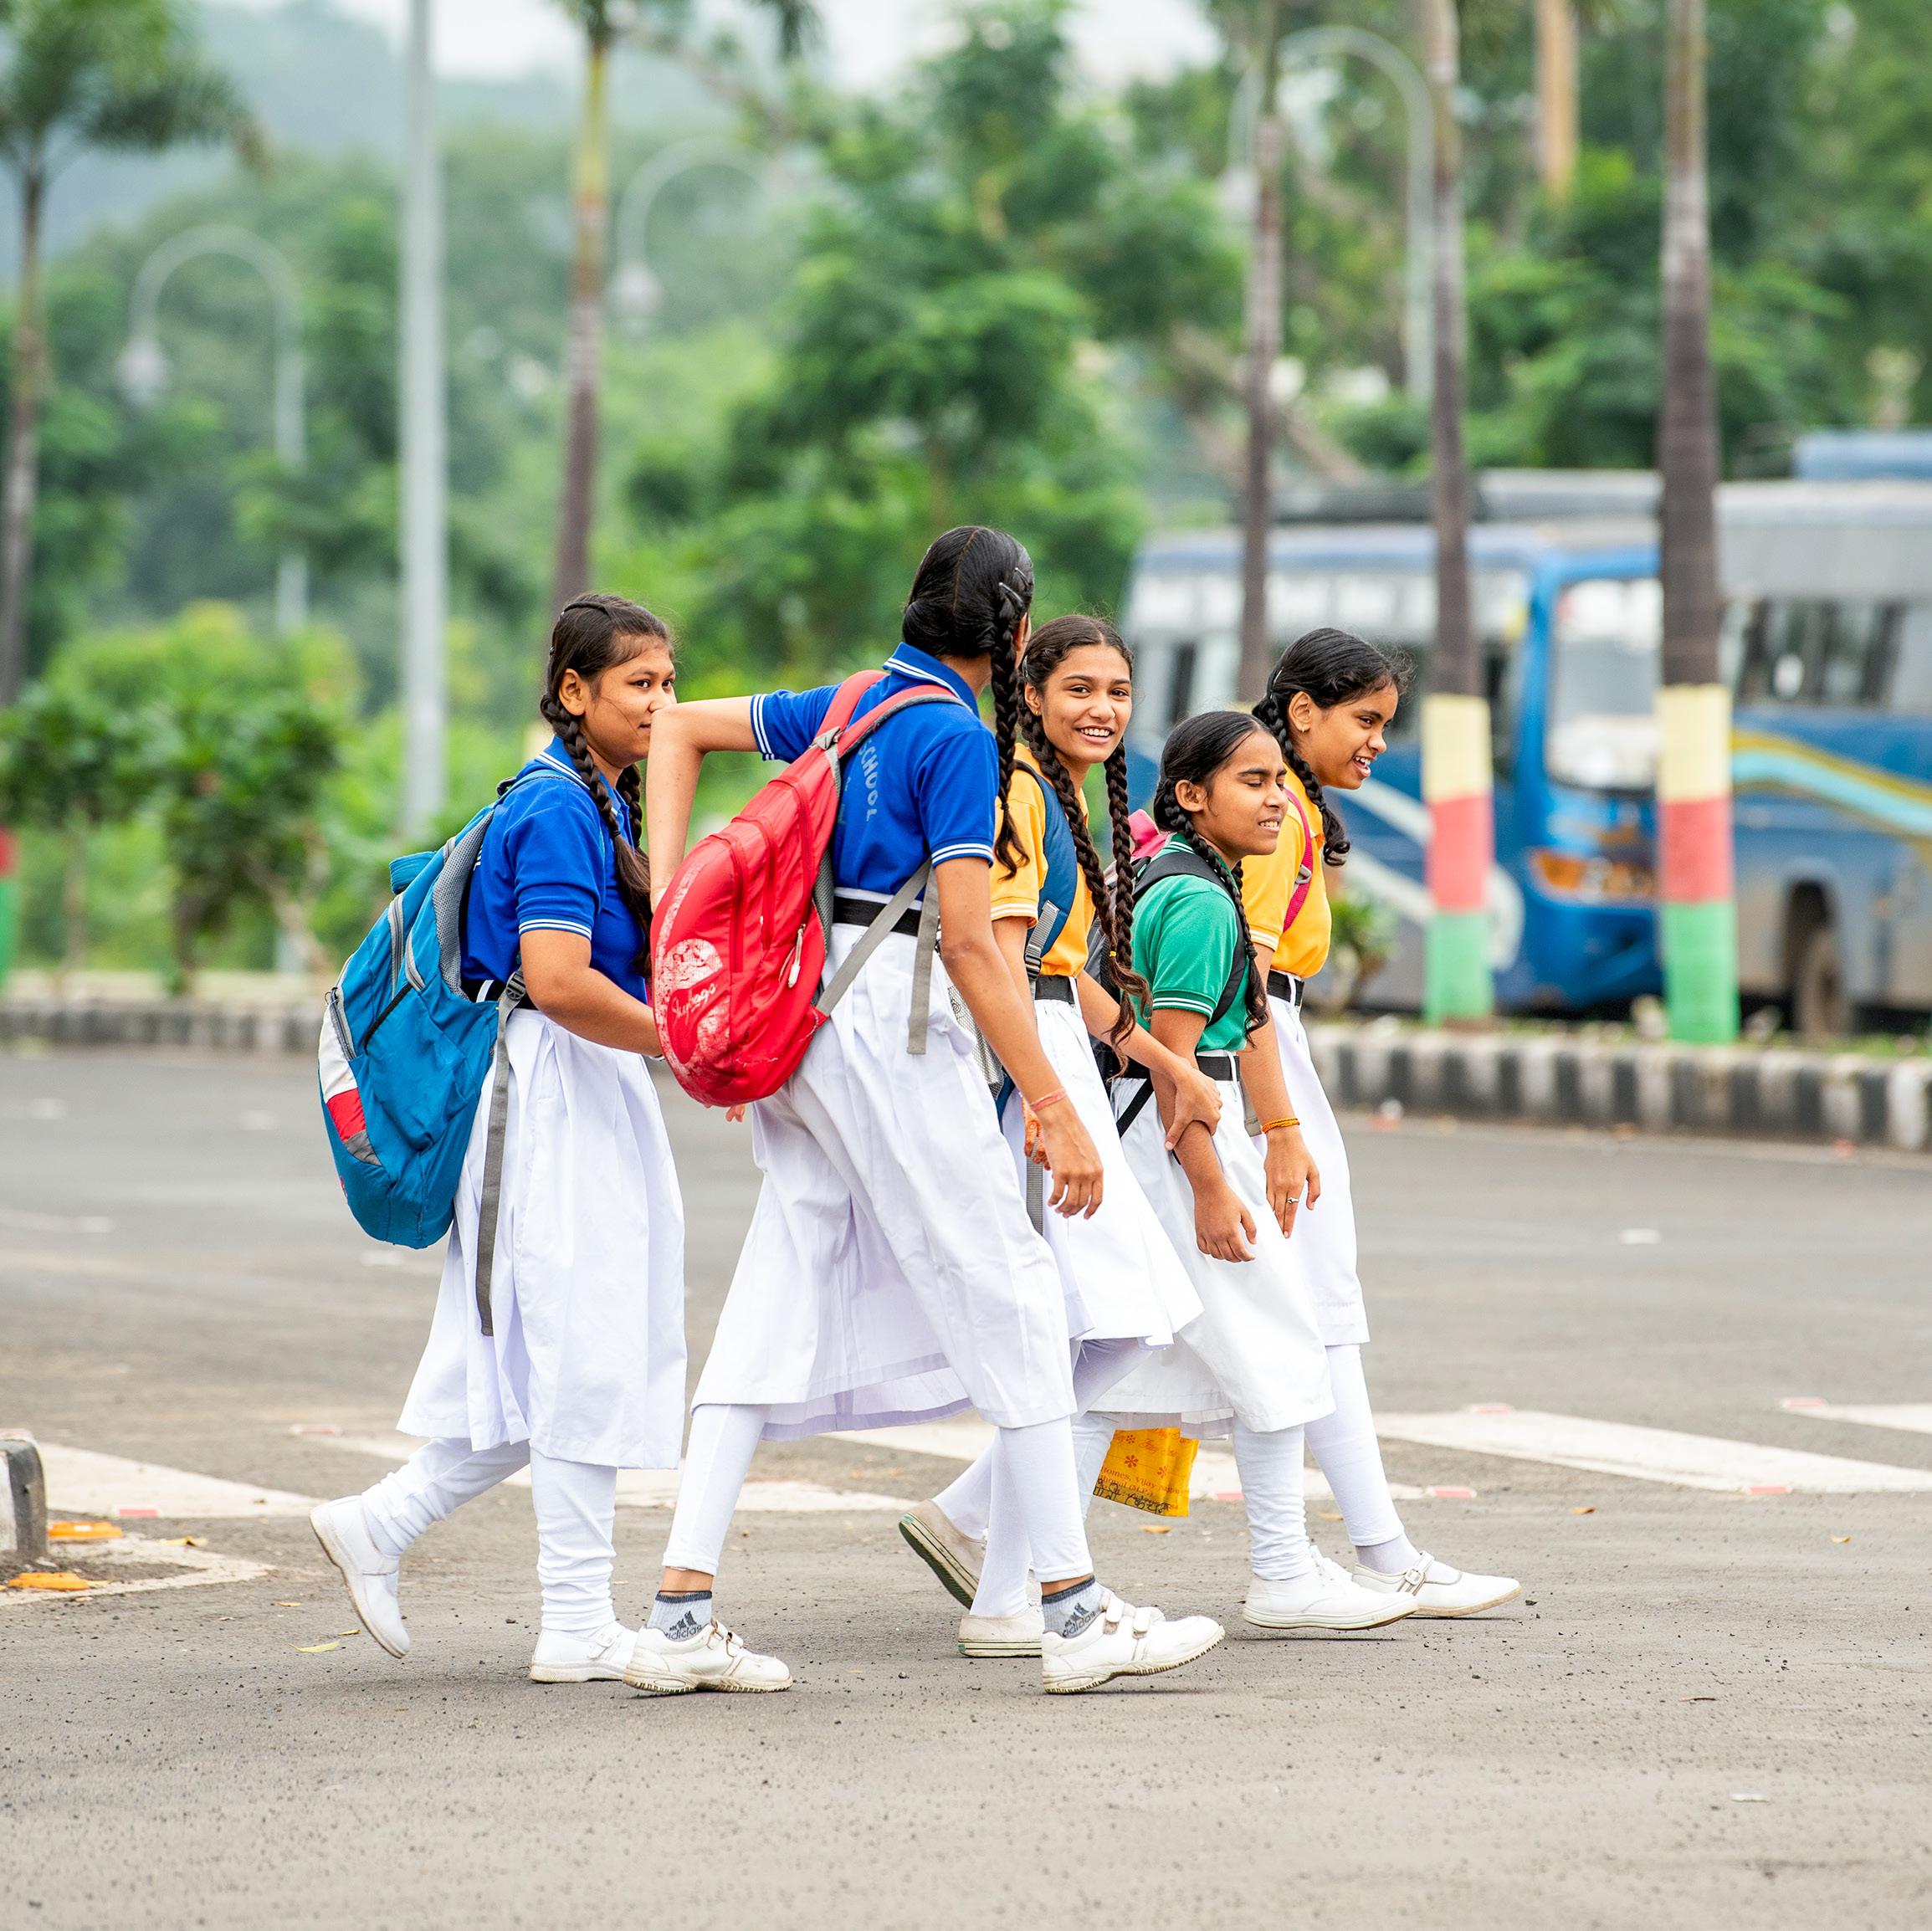

What if a single infrastructure intervention could boost local economies, improve public safety, cut air pollution, and advance gender equity—all at once? This study proves that street transformations do exactly that.
The Healthy Street Dividend brings together evidence from ten Indian cities—from Srinagar to Coimbatore, Bhubaneswar to Bengaluru— to answer a simple question: Do Healthy Streets perform better than Unwalkable Streets? The answer is a resounding yes. Shopkeepers report higher turnover. Vendors see higher daily sales. Air quality improves significantly. Women’s nighttime safety improves along with mode shares. These
Messages
are not theoretical gains. They are measured, replicated, and statistically significant across diverse urban contexts.
At GIZ India, in collaboration with Ministry of Housing and Urban Affairs (MoHUA), and the technical expertise of ITDP India, we have designed this study to be directly actionable for policymakers, city administrators, and urban practitioners. The evidence for scale is here. The investment case is made. Now is the time to build streets that work for people, for business, and for the planet.
Manjunath Sekhar Director, SUM-ACA
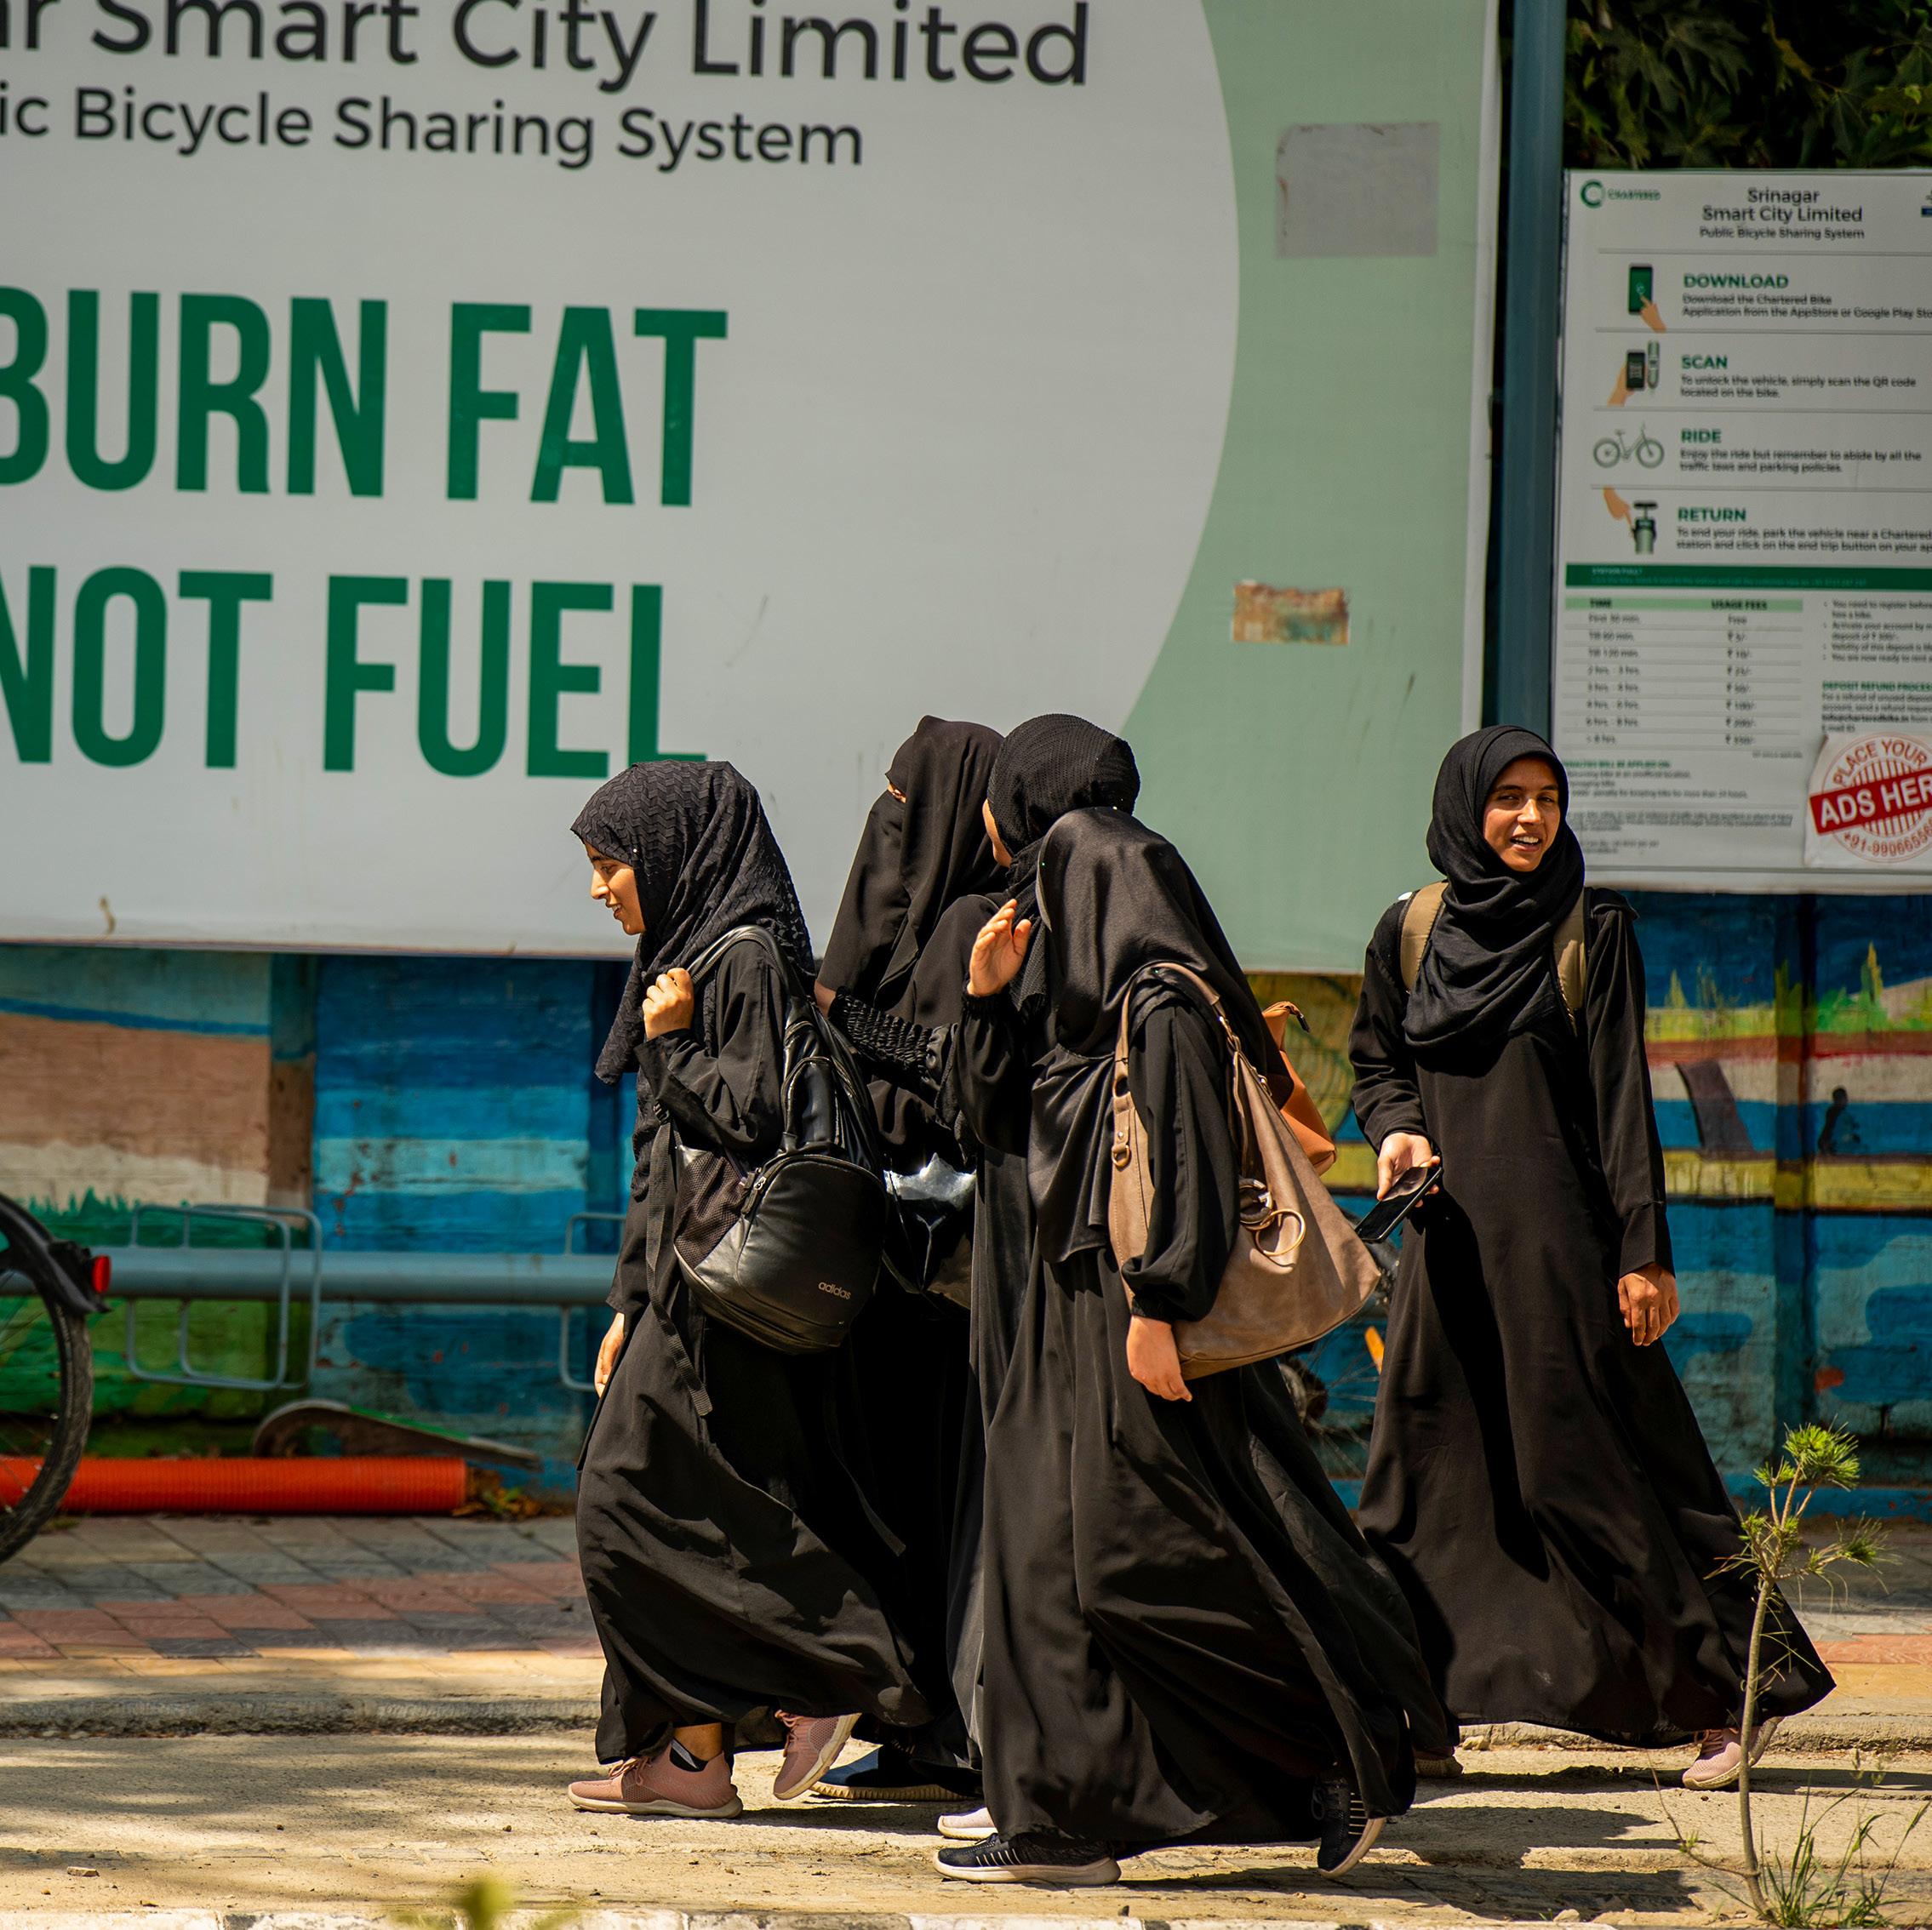

For too long, the case for walking and cycling infrastructure in India has rested on global examples rather than local evidence. This publication changes that. The Healthy Street Dividend presents the first multi-city, multiindicator impact assessment of Healthy Street transformations across ten Indian cities. The findings are unambiguous: streets designed for people outperform those designed for cars, on every measure that matters. Shopkeepers see higher turnover. Vendors earn more. Property values rise. Women, children, and the elderly feel safer. Air quality improves. And people walk more.
This evidence arrives at a critical moment. As Indian cities commit to climate action, sustainable
Messages
mobility, and livable urban futures, they need data to guide investment, policy, and public advocacy. That is precisely what this study delivers.
We thank the MoHUA for its leadership, GIZ India for prioritising this research, the ten cities for their participation, and the countless citizens who shared their experiences. Our hope is that this publication serves not as an endpoint, but as a catalyst, inspiring national missions, state policies, and city budgets to prioritise the pedestrian as the true measure of a street’s success.
Aswathy Dilip Managing Director, ITDP India
Table of Contents
EXECUTIVE SUMMARY
1. SETTING THE CONTEXT
1.1. Need for Healthy Streets in India
1.2. Why evaluate the impacts of Healthy Streets?
2. METHODOLOGY AND APPROACH
2.1. Overall approach
2.2. City and site selection
2.3. Benefits framework – Economic | Social | Environmental
2.4. Limitations
3. IMPACT OF HEALTHY STREET TRANSFORMATIONS
3.1. Economic impacts:
i. Healthy Streets drive measurable economic gains for businesses
ii. Healthy Streets attract more businesses
iii. Healthy Streets drive ease of business
iv. Healthy Streets convert high footfall into high sales
v. Healthy Streets accelerate real estate value
vi. Healthy Streets break stagnation and investment paralysis
vii. Healthy Streets reduce long term maintenance costs and improve asset life
3.2. Social impacts:
i. Healthy Streets attract more women children and the elderly
ii. Healthy Streets get more people walking, for longer
iii. Healthy Streets create positive user experience and drive social activity
iv. Healthy Streets create safer environments for women & children
v. Healthy Streets inspire civic pride and collective maintenance
vi. Healthy Streets reduce road crashes through traffic calming and safer speeds
3.3. Environmental impacts:
i. Healthy Streets deliver cleaner air and longterm health dividends
ii. Healthy Streets cut emissions, one commute at a time
iii. Healthy Streets improve thermal comfort
iv. Healthy Streets lower noise pollution for better health and comfort
3.4. Impact numbers from other Indian cities
4. CITY PROFILES
1. Ahmedabad
2. Bengaluru
3. Bhubaneswar
4. Chennai
5. Coimbatore
6. Gangtok
7. Gurugram
8. Kochi
9. Pimpri Chinchwad
10. Srinagar
5. TRANSFORMATION AT SCALE: PRIME MINISTER’S BHARAT JANPATH YOJANA
5.1 Existing challenges in scaling from pilots to city-wide transformations
5.2 Prime Minister’s Bharat Janpath Yojana
5.3 Way ahead: from evidence to investment
6. APPENDIX 7.
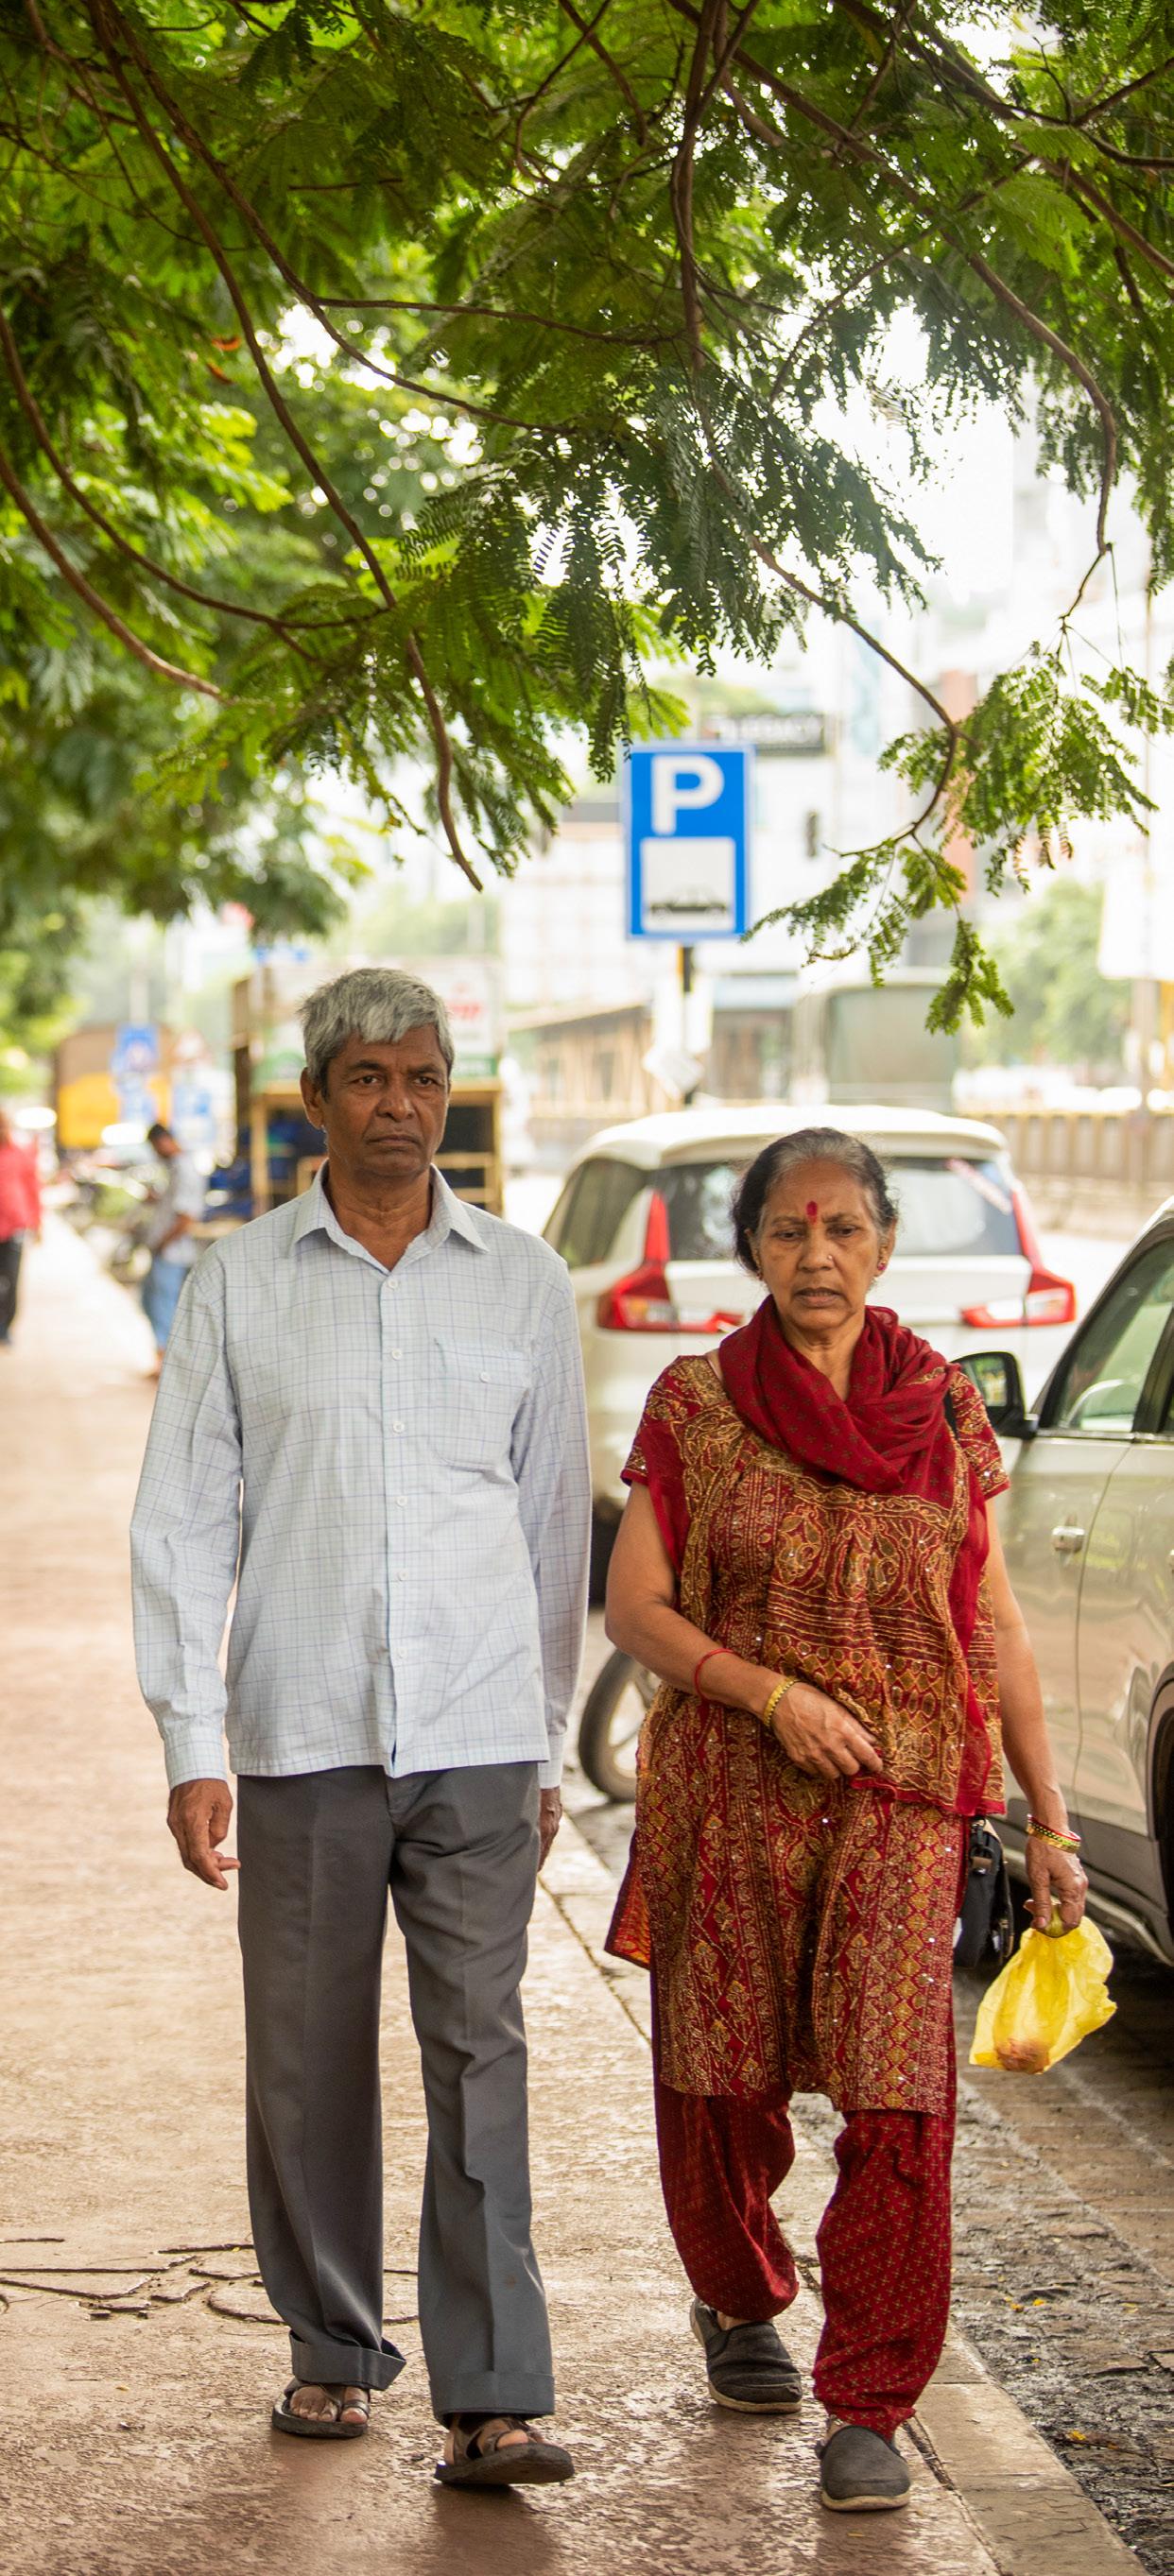
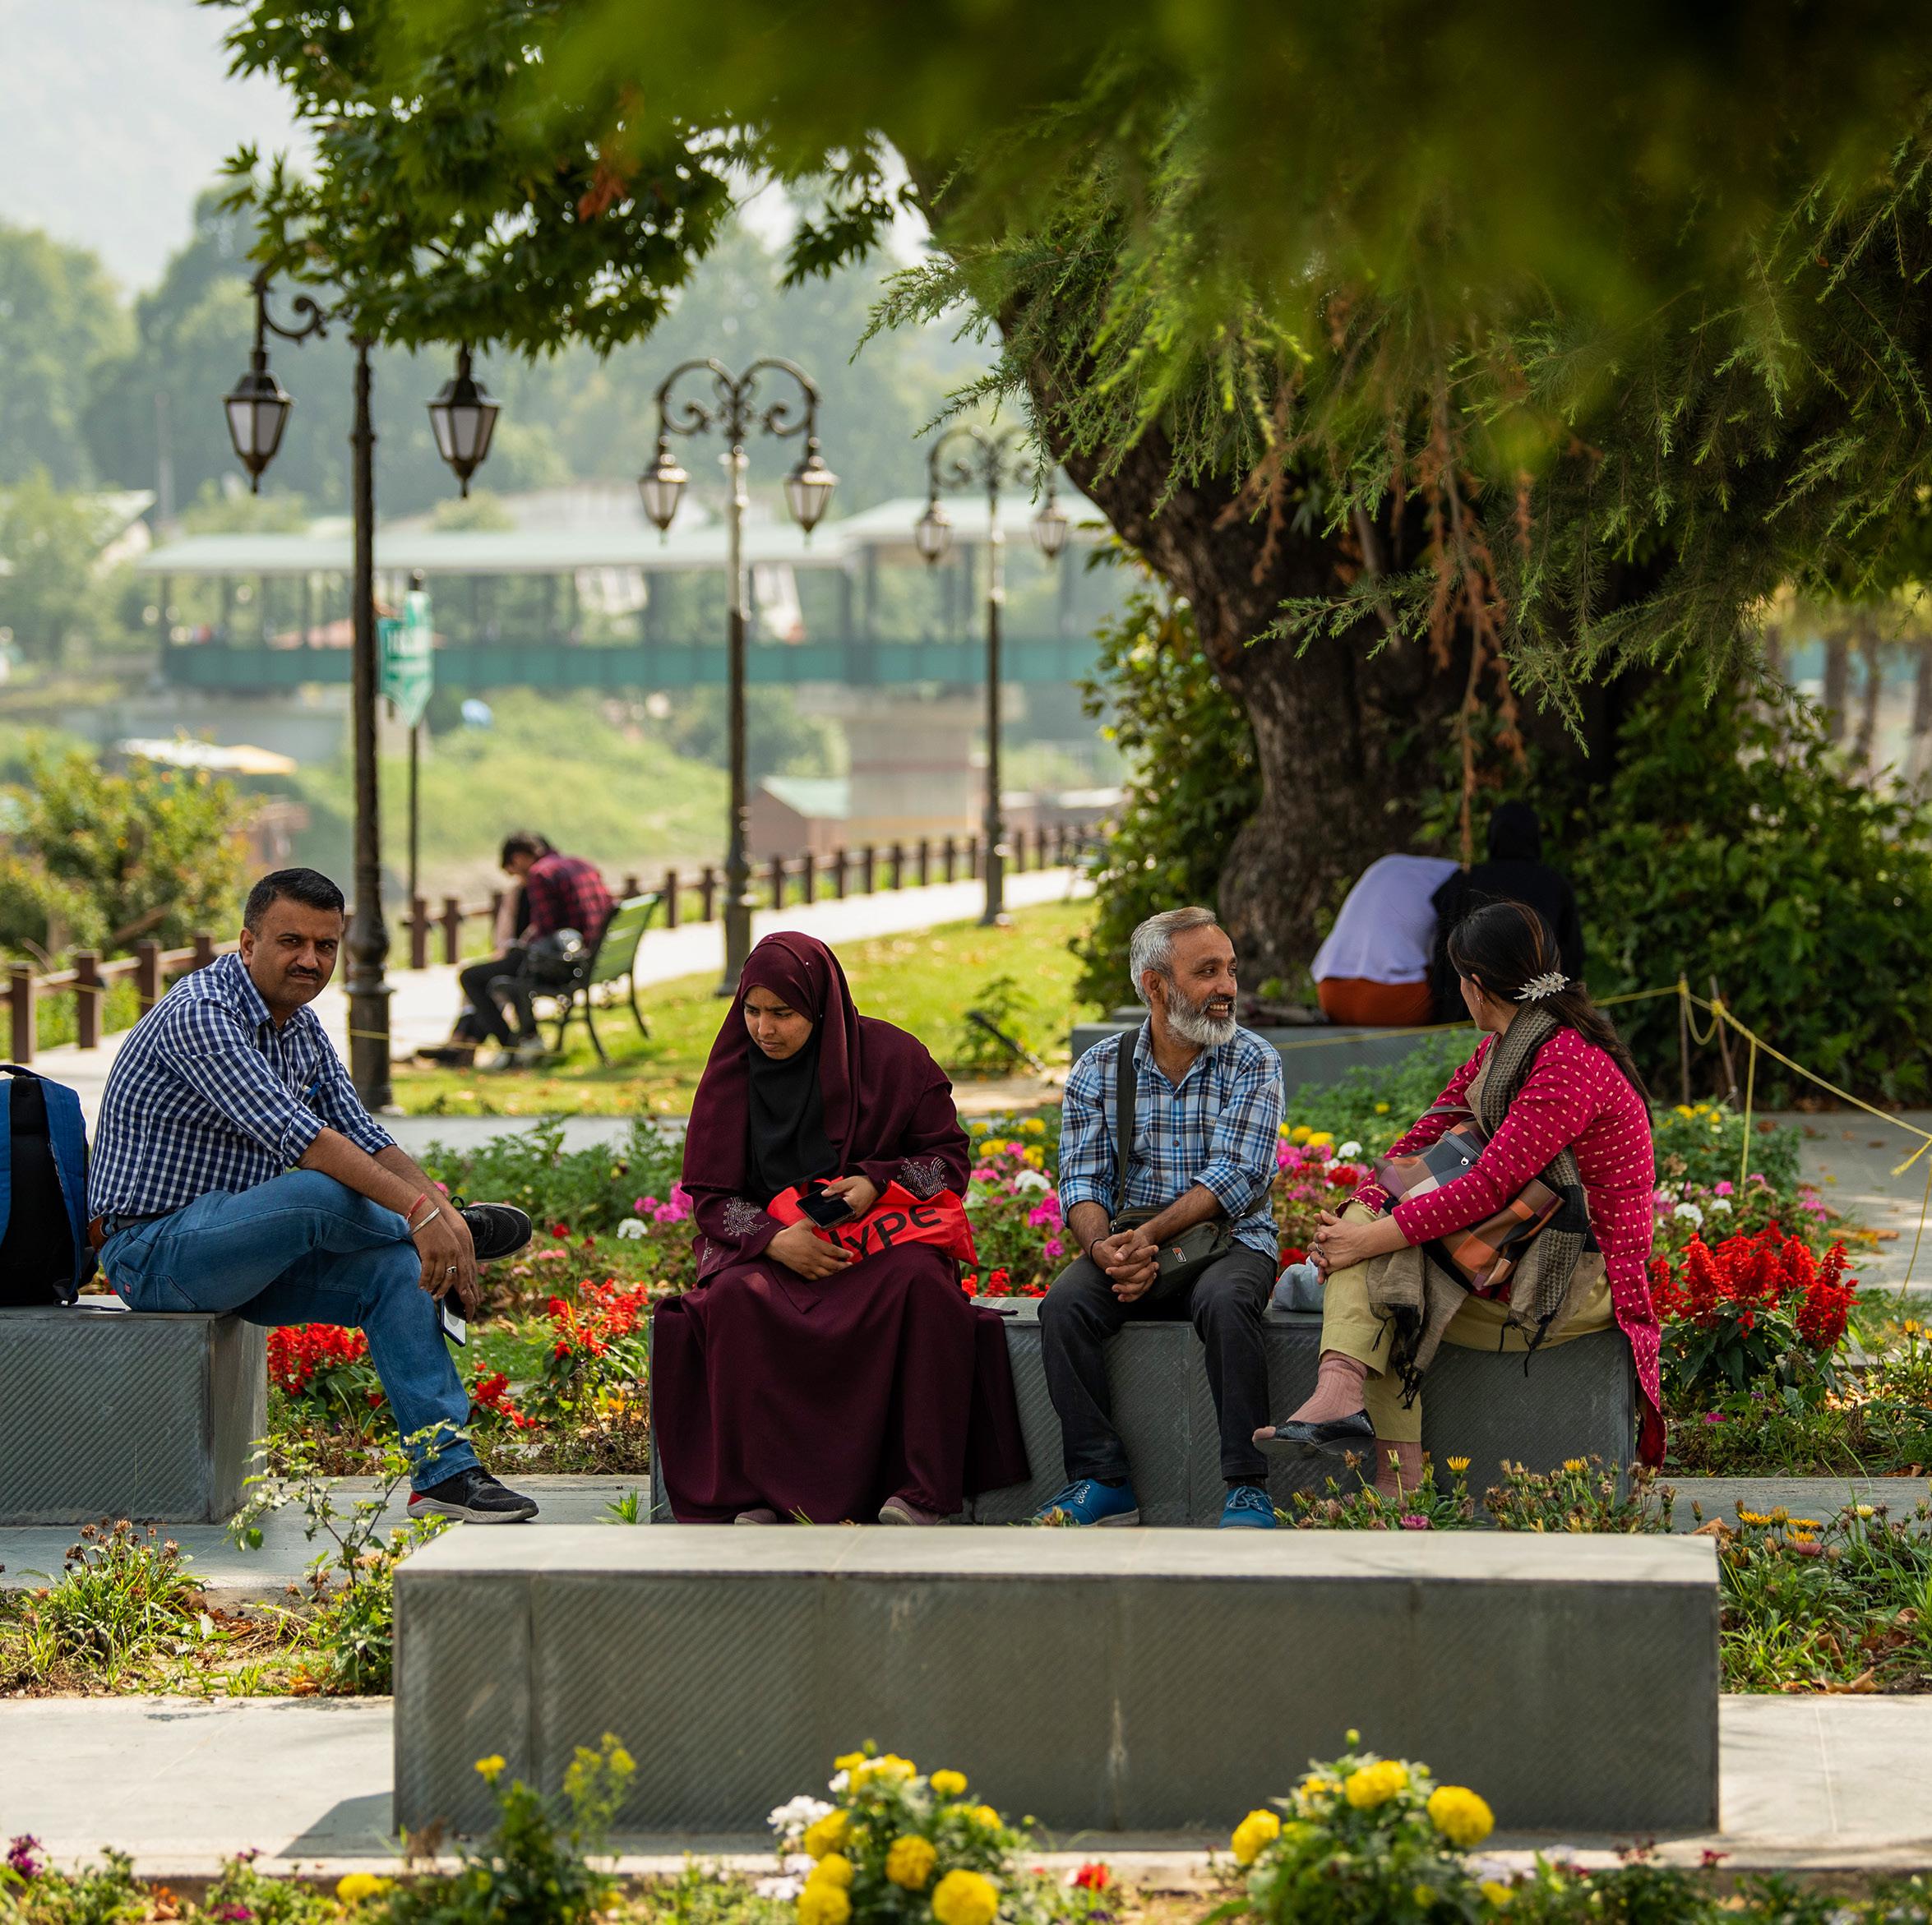
Executive Summary
As millions flock to Indian cities for livelihoods, sustainable transport planning has failed to keep pace. The result is choked infrastructure, surging dependence on private vehicles, and a landscape dominated by widened roads and elevated flyovers. Chaotic parking and dangerous speeds have turned streets into hazards for anyone on foot or bicycle. But Indian streets were never meant to be mere vehicle conduits. Historically, they thrived as lively civic spaces, for commerce, casual interactions, and daily life. The flyover-first approach erased that
character, prioritising moving traffic over people. Now, a reversal is underway. Across the country, cities are redesigning streets for people, backed by national initiatives.
Global experience shows that such transformations deliver significant economic, social, and environmental returns. Cities like New York, London, Bogotá, and Singapore have data-backed evidence: pedestrian and cycling improvements boost local economies, retail activity, public health, safety, and liveability, while advancing climate and equity goals.
The first multi-city, multi-indicator impact assessment of Healthy Street interventions across 10 cities of varying scale and geography.
Indian cities are investing in street infrastructure, yet the case for such investment remains poorly evidenced in the Indian context. This study fills that gap, producing the first multi-city, multi-indicator impact assessment of Healthy Street interventions across 10 cities of varying scale and geography. The central question is this: Do streets with better pedestrian infrastructure measurably outperform those without, across economic, social and environmental fronts? The evidence suggests that it does, consistently.
STUDY METHODOLOGY
The study compares two kind of streets: Healthy Streets, i.e streets where pedestrian infrastructure improvements have been implemented (wide footpaths, traffic calming, organised parking, greenery and universal accessibility), with Unwalkable streets (without dedicated pedestrian space) in the same cities. The approach drew on national and international case studies and expert consultations.
DATA COLLECTION STRANDS
PERCEPTION SURVEYS:
Shopkeepers, street users, and vendors surveyed on footfall, sales, safety, and amenities. ~3,223 respondents across 10 cities.
VOLUME COUNTS:
Point-in-time pedestrian and vehicle counts, disaggregated by gender and age, on both Healthy Streets and Unwalkable Streets streets.
SITE CLASSIFICATION:
Healthy Streets (with pedestrian infrastructure) vs. Unwalkable Streets (no infrastructure) typology, applied across commercial, residential, and mixed-use streets.
FIELD MEASUREMENTS:
On-ground same-day measurements of Air Quality Index (AQI), Particulate Matter (PM) levels (PM1, PM2.5, PM10), surface temperature, and vehicle speed (before and after traffic calming).
FOCUS GROUP DISCUSSIONS (FGDS):
Real estate agents, Resident Welfare Association (RWA) representatives, shopkeeper unions, and residents across 8–10 cities.
PIMPRI CHINCHWAD
SRINAGAR GURUGRAM
KEY IMPACT FINDINGS
GANGTOK
BHUBANESWAR
COIMBATORE
CHENNAI BENGALURU
KOCHI
*Map for representation purpose only
Across all 10 cities, Healthy Streets consistently and significantly outperformed Unwalkable Streets on every dimension measured. The report presents an overview of the impact areas, detailed with cross city and city-wise data in the chapters ahead.
HEALTHY STREETS ATTRACT MORE BUSINESSES:
Ninety-five out of 329 shopkeepers surveyed had relocated to Healthy Streets, with 56.8% citing street improvements as the reason for their move.
HEALTHY STREETS DRIVE EASE OF BUSINESS:
79% of shopkeepers on Healthy Streets report new shop openings, 64% witnessed facade renovations and 85% experience faster deliveries than Unwalkable Streets.
HEALTHY STREETS CONVERT HIGH FOOTFALL INTO HIGH SALES:
Rising pedestrian activity directly boosts business revenues. When footfall increased, 73% of shopkeepers reported higher turnover.
ECONOMIC GAINS FOR BUSINESSES :
Shopkeeper annual income rose to 20% in Healthy Streets, amounting to a 4.37 lakh annual gain per shopkeeper, and a 14% premium over Unwalkable Streets.
HEALTHY STREETS BREAK STAGNATION AND INVESTMENT PARALYSIS:
Nearly 46% of vendors in Unwalkable Streets reported no change in sales over the last one or two years, and said they would not renovate, expand or upgrade until street conditions improved.
HEALTHY STREETS REDUCE LONG-TERM MAINTENANCE COSTS AND IMPROVE ASSET LIFE:
Street improvements are generating measurable recurring fiscal returns in many cases. For example, Science City Road, Ahmedabad witnessed a return of 63.7% from property tax. Smart Janpath, Bhubaneshwar saw an annual revenue of ₹1.75 crores from multiple streams. Many other cities saw a structural reduction in lifecycle maintenance
HEALTHY STREETS GET MORE PEOPLE WALKING, FOR LONGER:
Nearly 82% of users who knew the street before improvements now walk there more frequently. Among shopkeepers, 43% now walk or cycle to work and even dwell time has increased amongst people with a mean of 89 minutes across cities.
HEALTHY STREETS CREATE POSITIVE USER EXPERIENCE AND DRIVE SOCIAL ACTIVITY:
Healthy Streets have generated measurable new social behaviour like social gatherings, fitness walks and extended dwelling time. 92% respondents reported a positive overall experience and 89% enjoyed the street more now.
HEALTHY STREETS ATTRACT MORE WOMEN, CHILDREN, AND THE ELDERLY:
Healthy Streets attracted substantially more vulnerable pedestrians in absolute numbers – 1.5x more women, 1.6x more children, 2.1x more elderly, and 36% more pedestrians overall.
Social impact
HEALTHY STREETS INSPIRE CIVIC PRIDE AND COLLECTIVE MAINTENANCE:
When streets are well-designed and maintained, shopkeepers do not merely benefit, they actively contribute. This study found that 38% shopkeepers on Healthy Streets actively participated in community maintenance, as opposed to around 10% on Unwalkable Streets.
HEALTHY STREETS CREATE SAFER ENVIRONMENTS FOR WOMEN AND CHILDREN:
On Healthy Streets, 93% of users feel secure from crime (vs 64% on Unwalkable Streets); 90% feel safe at night (vs 69% on Unwalkable Streets); 62% consider the street safe for children (vs 36% on Unwalkable Streets). Volume count data corroborates this: 1.5× more women physically walk on Healthy Streets.
HEALTHY STREETS REDUCE ROAD CRASHES THROUGH TRAFFIC CALMING AND SAFER SPEEDS:
Traffic calming elements on Healthy Streets like table-top crossings, lane diets, cobblestone treatments — consistently reduced vehicle speeds toward the 30 km/h and a 5 to 7 km/h average speed reduction was seen across seven cities.
Across all 10 cities, Healthy Streets recorded better AQI without exception, averaging 45% lower than the Unwalkable Streets PM1, PM2.5 and PM10 levels were also 22-23% lower on the Healthy Streets.
HEALTHY STREETS IMPROVE THERMAL COMFORT:
Shade consistently reduces footpath temperatures by ~12°C on average and carriageway temperature by ~9.5°C.
private vehicles. Data demonstrates that 43% of shopkeepers on Healthy Streets now walk or cycle to work, there are 14% more walking trips, and 27% lower volume of goods vehicles on these streets during peak hours.
Detailed additional impacts on economic, social and environmental fronts are mentioned ahead in this document.
WAY AHEAD: FROM EVIDENCE TO ACTION
The evidence is clear: Healthy Streets deliver measurable economic, social, and environmental returns. Yet Indian cities struggle to scale pilot successes into city-wide transformations. This study identifies seven persistent bottlenecks that stand in the way: lack of long-term vision, inconsistent political will and personnel churn, chronic underfunding of non-motorised transport (NMT), absence of enforceable legislation, limited technical capacity in Tier 2 and 3 cities, poor inter-agency coordination, and weak public awareness.
To overcome these barriers, this study lends its weight to a unifying national solution: the Prime Minister’s Bharat Janpath Yojana. Its vision is to reclaim India’s streets as vibrant, equitable, sustainable public spaces, affirming that the right to walk safely is integral to the Right to Life under Article 21. The Yojana rests on three interconnected components:
A National Pedestrian Policy providing a binding strategic framework beyond voluntary guidelines.
A National Streets Programme creating 10,000 km of safe, pedestrianfriendly streets across 100 cities, moving from isolated pilots to functional citywide NMT networks.
Enabling reforms including a dedicated “Healthy Streets Fund” at national and state levels, legislative amendments to the Motor Vehicles Act, institutional mandates for Active Mobility Cells, awareness campaigns and more.
The study's findings are designed for immediate application. At the national and state level, they inform policy direction, funding priorities, and urban missions. Through targeted advocacy, workshops, webinars, and storytelling, the evidence can reach practitioners, elected representatives, and citizens. And the methodology itself is built for replication, enabling a growing evidence base across more cities and street typologies.
But evidence alone does not build a footpath. Using the data to take decisive action is an essential step. This can happen through dedicated programmes by the national and state governments, that bring together a unifying vision, institutional resolve, dedicated funding, and a legislative framework. The choice before every city, state, and national leader is no longer whether to invest in walking, but how quickly to act. Every day without a safe footpath is a day a child, a worker, or an elder is denied their right to the city. A critical shift is needed to move from isolated pilots into a nationwide movement. This report aims to be a key a step to accelerate that shift and reclaim streets for people.
Need for Healthy Streets in India 1.1
Indian cities and their mobility planning are at a pivotal moment. Rapid urban growth, increasing dependence on private vehicles, and years of designing streets primarily for traffic movement have begun to show their limits.
Walking is still the most common mode of travel, with over 45 million people walking to work daily according to the 2011 Census, has become increasingly unsafe and uncomfortable. India records one of the highest rates of pedestrian fatalities globally, with 27,586 fatalities recorded in 2023, attributed to inadequate or absent footpaths and increased pedestrian-vehicular conflict. Women, children, the elderly, and Persons with Disabilities (PwDs) are disproportionately excluded from the street environment, not by choice, but because the infrastructure does not support safety, comfort, or dignity. At the same time, air quality in many Indian cities regularly breaches hazardous levels, with traffic-related emissions a major contributor.
The cumulative impact seen in congestion, road crashes, and declining environmental quality is affecting not just how people move in cities, but in how cities grow and function economically. Against this backdrop, a shift in how streets are designed and understood has been gaining momentum. Streets are increasingly being recognised not just as transport corridors, but as the equitable public spaces of cities used by diverse modes and groups of people to support economic activity, social interaction, and civic life. MoHUA has played a key role in advancing this vision through flagship policies and programmes such as the National Urban Transport Policy (NUTP), the Smart Cities Mission, national challenges such as Streets for People Challenge & the Cycles4Change Challenges etc.
Across the country, this has translated into a new generation of street transformations. Healthy Streets, characterised by wide, continuous footpaths, organised parking, traffic calming, universal accessibility, street furniture, greenery, and improved lighting are beginning to reshape the urban mobility experience. From Gangtok’s MG Marg, a fully pedestrianised street that anchors the city’s public life, to Chennai’s Pondy Bazaar, a highfootfall retail corridor reimagined with pedestrianfriendly infrastructure, to Kochi’s Shanmugham Road, a waterfront promenade integrated with
public transport these examples demonstrate that when streets are designed for people, they become safer, more inclusive, and more economically vibrant.
Yet, while these transformations are increasingly visible, there remains a limited understanding of their measurable impacts in the Indian context.
Systematically assessing how these streets perform across economic activity, safety, user behaviour, and environmental outcomes is critical to building a robust evidence base. Such evidence not only helps validate investments already made but also strengthens the case for scaling Healthy Streets as a core strategy for urban development in India.
MoHUA has played a key role in advancing this vision through flagship policies and programmes such as the National Urban Transport Policy (NUTP), the Smart Cities Mission, national challenges such as Streets4People Challenge & the Cycles4Change Challenges

1.2
Why evaluate the impacts of Healthy Streets?
While the conceptual case for Healthy Streets is increasingly visible across Indian cities, there remains a critical gap: limited evidence on how these interventions perform in practice, at scale, and across different contexts. As more cities invest in street transformations, the need to understand what works, for whom, and to what extent becomes essential. In the absence of this evidence, street improvements are often perceived as optional or aesthetic upgrades rather than core urban infrastructure. At the same time, city, state and national agencies lack the empirical basis needed to prioritise funding or scale such initiatives.
What is the Return on Investment (RoI) on these street improvements?
To justify these investments, whether in terms of economic returns, safety improvements, or broader public value, we need consistent, comparable data.
Global experience shows that evaluation plays a crucial role in strengthening this case. Cities that
have systematically measured the impacts of street transformations, whether through increased retail activity, improved safety outcomes, or environmental benefits, have been able to build long-term policy and public support. Importantly, these insights have helped shift the narrative from streets as design interventions to streets as high-impact public investments. Studies in New York City2 documented that the pedestrian friendly transformations of Broadway, Times Square3, and other corridors4 generated significant increases in retail sales and property values. Research in London5 demonstrated that cycling infrastructure investments produced economic returns several times their cost through reduced congestion, improved health outcomes, and increased local spending.
In Bogota, evaluations of the CicloVia6 and TransMilenio7 programmes provided the empirical foundation for sustained public and political support over successive administrations. In each case, evaluation transformed Healthy Streets from a planning concept into a quantified investment proposition.
India needs a similar evidence base, but one that is rooted in its own cities, streets, and realities. Street economies in India function differently from those in many global contexts, shaped by high pedestrian volumes, a strong informal sector, and patterns of commerce that are closely tied to footfall and street conditions. Understanding how street design influences these dynamics requires evidence that is grounded in Indian contexts.
DECISION-MAKER CREDIBILITY:
City administrators, state urban development departments, and central agencies such as MoHUA and NITI Aayog make investment decisions driven by evidence generated locally, using methodologies adapted to available data and grounded in on-the-ground realities
SCALE AND DIVERSITY:
India’s cities are extraordinarily diverse in scale, geography, economic base, climate, and cultural patterns of street use.
An evaluation that spans 10 cities across this diversity provides a stronger foundation for national policy than any single-city study could.
MULTI-DIMENSIONAL IMPACT:
Street transformation programmes generate economic, social, and environmental co-benefits that are often assessed in isolation. A framework that captures all three dimensions and their interactions offers a more complete and compelling case for investment than any single-lens analysis.
LEARNINGS:
Looking beyond average outcomes to understand where and why impacts differ helps identify what works, what needs strengthening, and how interventions can be adapted across contexts. These insights are critical for improving implementation and ensuring that successful models can be effectively scaled.
This study was designed with these imperatives in mind. It seeks to provide granular, multi-dimensional, contextually grounded evidence that city administrators, policymakers, and advocates need to make the investment case, design better streets, and build sustained commitment to walking and cycling infrastructure in Indian cities.
AND APPROACH
Overall approach 2.1
This study aims to build a robust, localised evidence-based understanding of how Healthy Street transformations are shaping Indian cities. At its core, the objective is to demonstrate the potential of street transformations in enhancing the quality of life, fostering economic growth, and addressing climate and equity challenges in India. By demonstrating proven benefits, the findings will support future policy and investment decisions across India.
The central question driving the study is:
Do streets with better pedestrian infrastructure measurably outperform streets without, across economic vitality, social strength, and environmental quality?
To answer this, the study adopts two comparative frameworks.
• Recognising that “before” data is often unavailable in Indian projects, the study also uses proxy streets to establish a realistic baseline. Healthy Streets —those with pedestrian-friendly infrastructure are systematically compared with similar Unwalkable Streets within the same city. The selection is made based on broadly similar location characteristics, land-use mix, built-use, and street typology, ensuring that observed differences in outcomes can be attributed, as far as possible, to the quality of street infrastructure rather than to other contextual variables.
• In addition to comparing Healthy Streets with their Unwalkable Streets counterparts, the study also includes a “before and after” comparison. Surveys on Healthy Streets capture insights from both long-term users who experienced the street before improvements and newer users who have experienced the street only after improvements.
Feedback from the long-term users, reflecting changes across both periods, provides a direct indication of how infrastructure conditions have evolved and helps validate the findings from the broader Healthy Streets–Unwalkable Streets comparison.
The overall approach was informed by a review of national and international best practices in evaluation methodologies, consultations with experts from across India, and practical considerations of data availability and field feasibility across 10 geographically and economically diverse Indian cities.
The study uses a set of complementary data collection methods to build a well-rounded and reliable evidence base. By combining perceptionbased insights with observed and measured data, the approach allows findings to be crossverified and strengthens overall robustness.

1. Surveys (street users, shopkeepers and vendors):
Structured surveys form the foundation of the study, capturing perceptions, behaviours, and economic outcomes across key stakeholder groups.
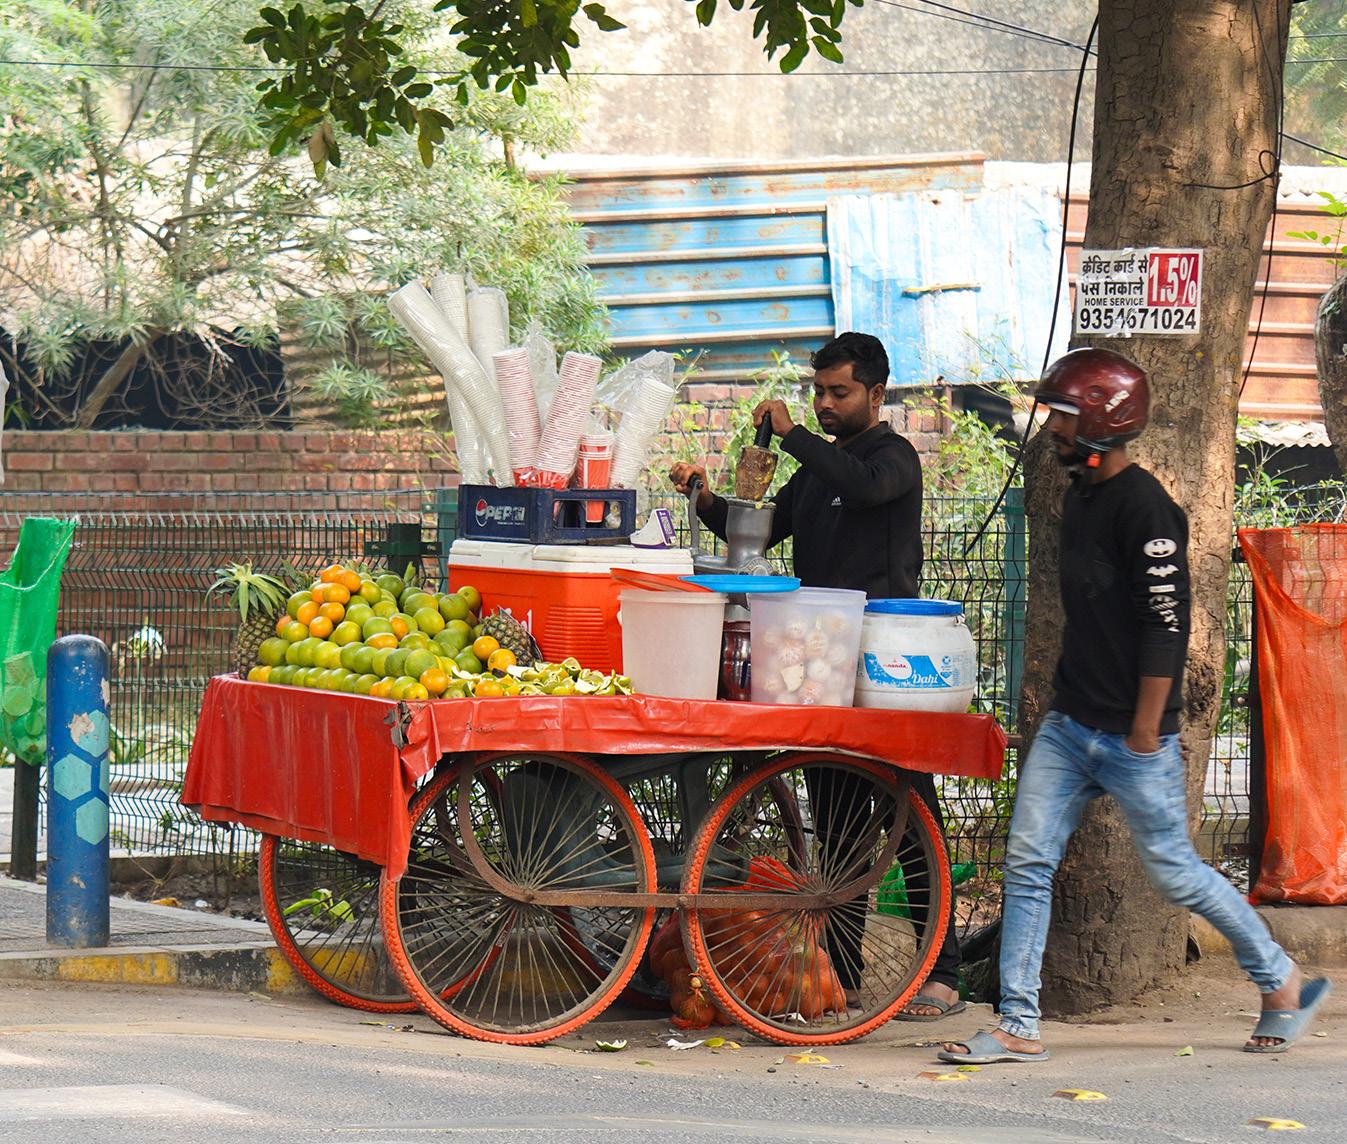
Shopkeepers: Surveys were conducted with a target sample of 30 shopkeepers per street on commercial and mixed-use streets based on the commercial built-use and density. Sampling ensured representation across different business types.
Street users: A target sample of 100 users per street was surveyed, ensuring representation across gender, age, and vulnerability groups (including elderly users and PwDs).
Vendors: A minimum of 5–10 vendors per street were surveyed, depending on street typology and availability of vendors, to capture insights from the informal economy.
The surveys captured data on sales trends, customer footfall, travel behaviour, safety perceptions, and overall street experience, providing a strong perception-based layer to the analysis. The evidence was assembled across 10 cities and more than 3,200 respondents.
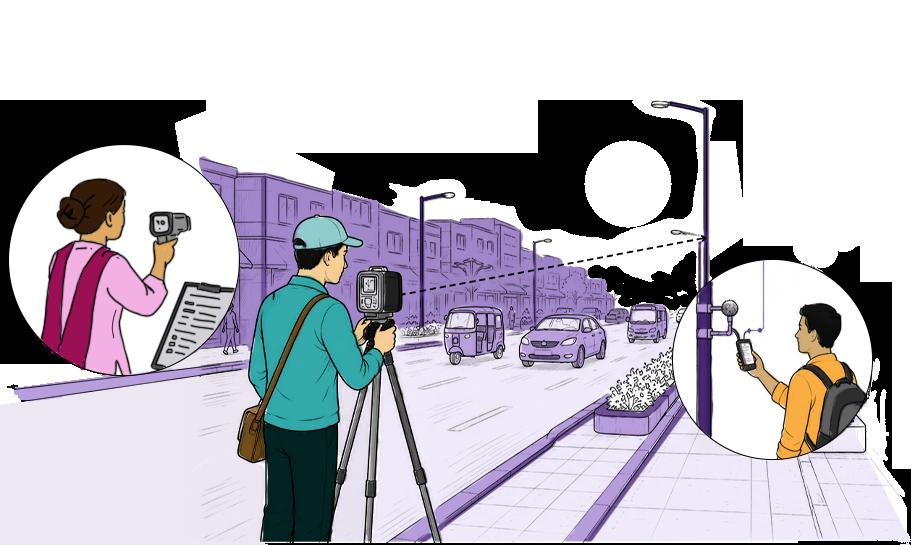
2. On-ground data collection:
To capture objective conditions, the following field surveys were conducted.
Speed measurements: Free speeds were recorded for different vehicles categories (two-wheelers, cars, autos) at mid-block locations, both before and after traffic calming elements. Random sampling was done across vehicle types to assess the impact of traffic-calming measures and street design on traffic behaviour.
Street measurements and mapping: Physical attributes of the street were documented using laser measurement tools, including Right of Way (RoW), carriageway width, footpath continuity, parking usage, and green buffers. These were analysed to understand the RoW allocation and street design quality.
Air quality and noise monitoring: Air quality monitoring was conducted using portable handheld devices, enabling real-time measurement of pollutant exposure experienced by street users. Given the highly localised nature of air pollution in urban
corridors, this approach allows for a more accurate understanding of how street design influences onground conditions. In alignment with the National Ambient Air Quality Standards (NAAQS), Central Pollution Control Board (CPCB), Government of India and Global Air Quality Guidelines by World Health Organisation (WHO), particulate matter (PM2.5 and PM10) were identified as critical pollutants due to their strong link to transport emissions and adverse health outcomes. Monitors were positioned along the pedestrian zone at a height of approximately 1 m, representing a typical child’s breathing zone. Measurements were recorded at 10-minute intervals over a one hour period, capturing short-term variability to extract averaged exposure levels. Data collection was conducted during peak traffic periods in the morning, when pollutant concentrations are likely to be highest and most representative of user exposure. Healthy Streets and Unwalkable Streets readings were taken on the same day and at similar times, minimising the influence of background pollution, meteorological variation, and daily emission cycles.
Noise: Noise levels were measured at regular 10-minute intervals over peak periods, using decibel meter applications placed at consistent locations. Average values of equivalent continuous sound levels (Leq) measured at 10-minute intervals over the peakhour duration were recorded. Data for Healthy and Unwalkable Streets was collected on the same day and at similar times to ensure comparability.
Surface temperature assessment:
Temperature readings were recorded at multiple shaded and unshaded locations on footpaths, carriageways, and designated parking areas during the hottest part of the day in each city to assess thermal comfort. Measurements were recorded on the same day at similar times for Healthy and Unwalkable Streets to ensure comparability. This helped capture how surface materials, tree cover, and shading influence microclimate conditions at the street level.
Tree cover and shade mapping:
The number of trees and canopy cover along the Healthy Streets and Unwalkable Streets were documented through field observation and supplemented with mapping tools to understand and qualify the role of shade in improving pedestrian comfort.

3.
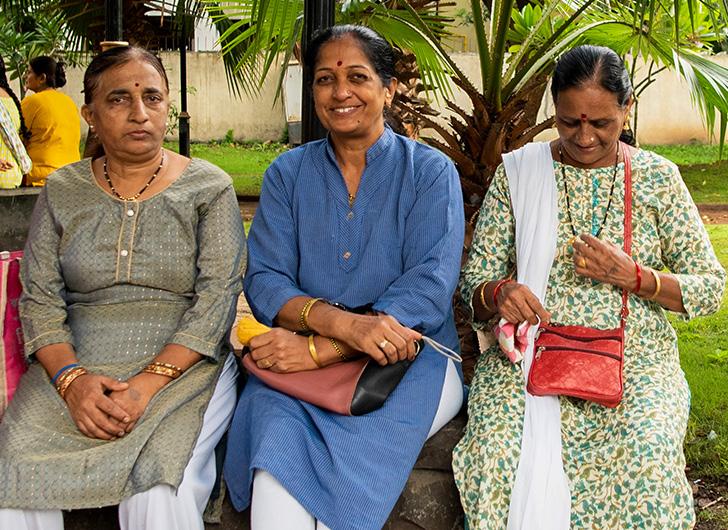
Focus Group Discussions (FGDs):
FGDs and Key Informant Interviews (KIIs) were conducted with three primary stakeholder groups: shopkeepers/shopkeeper unions, RWAs, and realestate agents/brokers. Semi-structured discussion guides were developed for each stakeholder group to enable consistency across cities while allowing flexibility for context-specific insights. The discussions focused on key themes including trends in property values and rental appreciation, business performance, customer footfall, investments in property or business upgrades, perceptions of safety and accessibility, sense of ownership and community, street usage patterns, and overall experience of the street environment. Discussions were also conducted between Healthy Streets and the comparator Unwalkable Streets to understand perceived differences in economic activity, liveability, investment attractiveness, and quality of public realm infrastructure.
FGDs were conducted in local languages to encourage open participation and context-sensitive responses. The discussions were audio-recorded

4. Secondary data collection from city agencies:
Secondary data for the Streets Impact Assessment was collected through formal data requests, stakeholder consultations, and review of administrative records from relevant city agencies. The data was primarily sourced from Municipal Corporations, Smart City Special Purpose Vehicles (SPVs), Urban Development Departments, Public Works Departments (PWDs), Traffic Police Departments, and Revenue Departments. The data collection focused on understanding the long-term economic and safety impacts of Healthy Streets interventions through comparable year-wise datasets. (with participant consent), transcribed, and thematically analysed to identify recurring trends, perceptions, and qualitative insights across stakeholder groups and cities. Findings from the FGDs and interviews were further triangulated with secondary data, perception surveys, and desk-based real-estate assessments to strengthen the overall analysis.
The data requests focused on the following indicators:
Capital investment and utility management:
• Total capital investment cost for street implementation
• Year-wise costs related to postimplementation re-digging/re-laying for utility management.
Operations and Maintenance (O&M):
• Annual allocated budgets for O&M of the street
• Actual annual expenditure on regular O&M activities (carriageway/footpath repairs, streetlights, landscaping, drainage, sanitation, and street furniture)
Traffic safety:
• Year-wise data on road crashes and fatalities, segregated by vehicle category (including pedestrians and cyclists).
Revenue:
Year-wise data on:
• Property Tax levied for different land uses and revenue collected from properties (residential, commercial, mixed use) along the road.
• Parking revenue generated from street parking, if applicable.
• Other Revenue Streams collected for the street (e.g., Solid Waste Management Tax, Holding Tax).
Secondary data collection on realestate trends for Healthy Streets:
To triangulate the real-estate trends emerging from the FGDs, a secondary deskbased assessment was undertaken using publicly available real-estate aggregator platforms and transaction records.
The exercise focused on understanding street-level trends in property sales and rental markets across the identified Healthy Street and Unwalkable Street . Historical trends in property values and rental appreciation were reviewed and compared across the identified study streets to assess the potential premium associated with improved street quality.
The findings from the desk research were further validated using governmentnotified guideline values or ready reckoner rates published annually by city and state authorities. This triangulation helped strengthen the analysis by supplementing stakeholder perceptions with market-based indicators and secondary valuation trends.
City and site selection 2.2
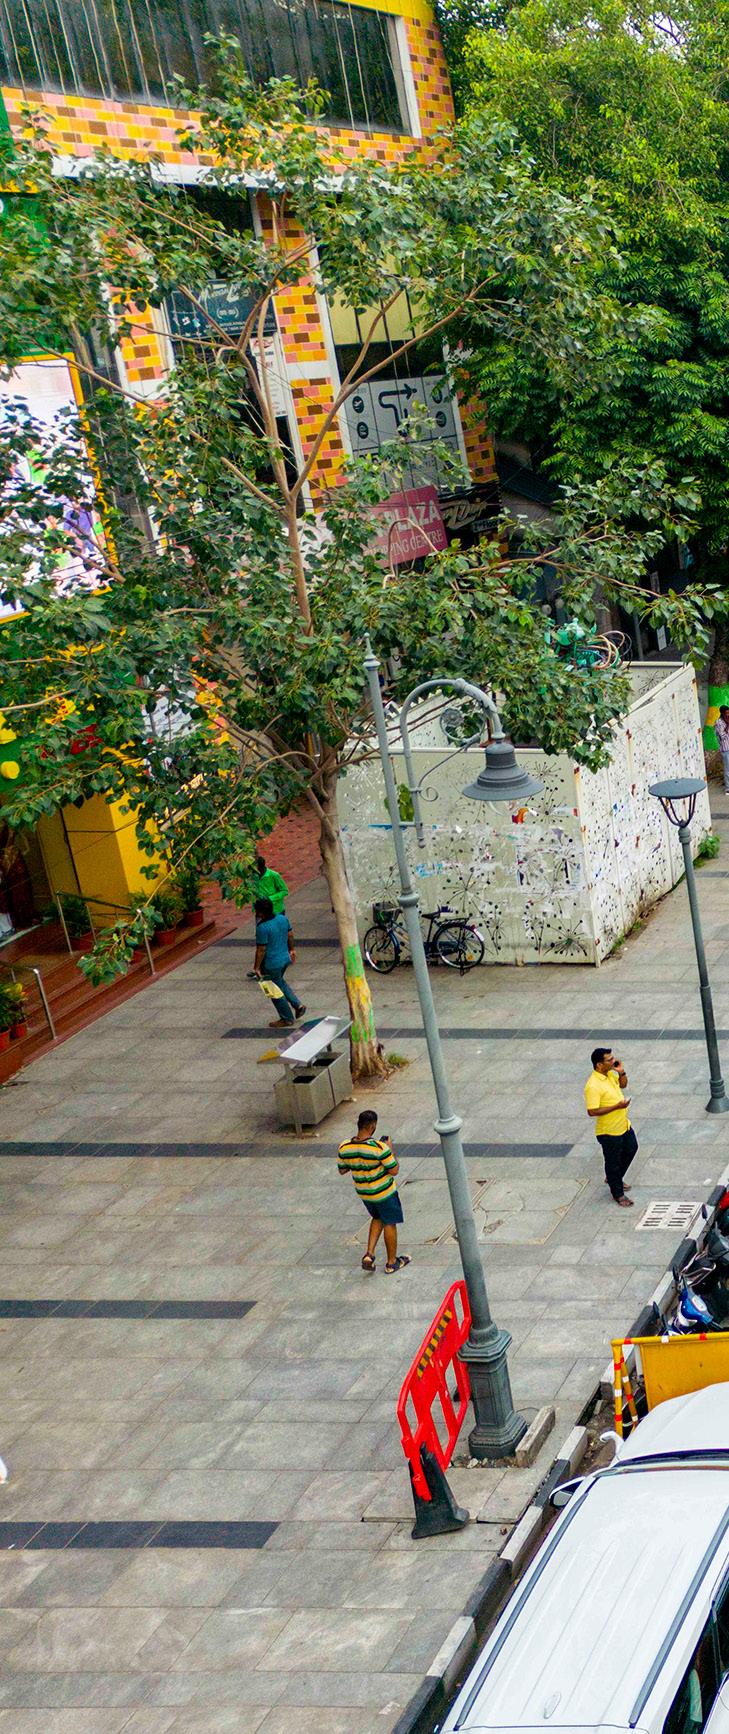
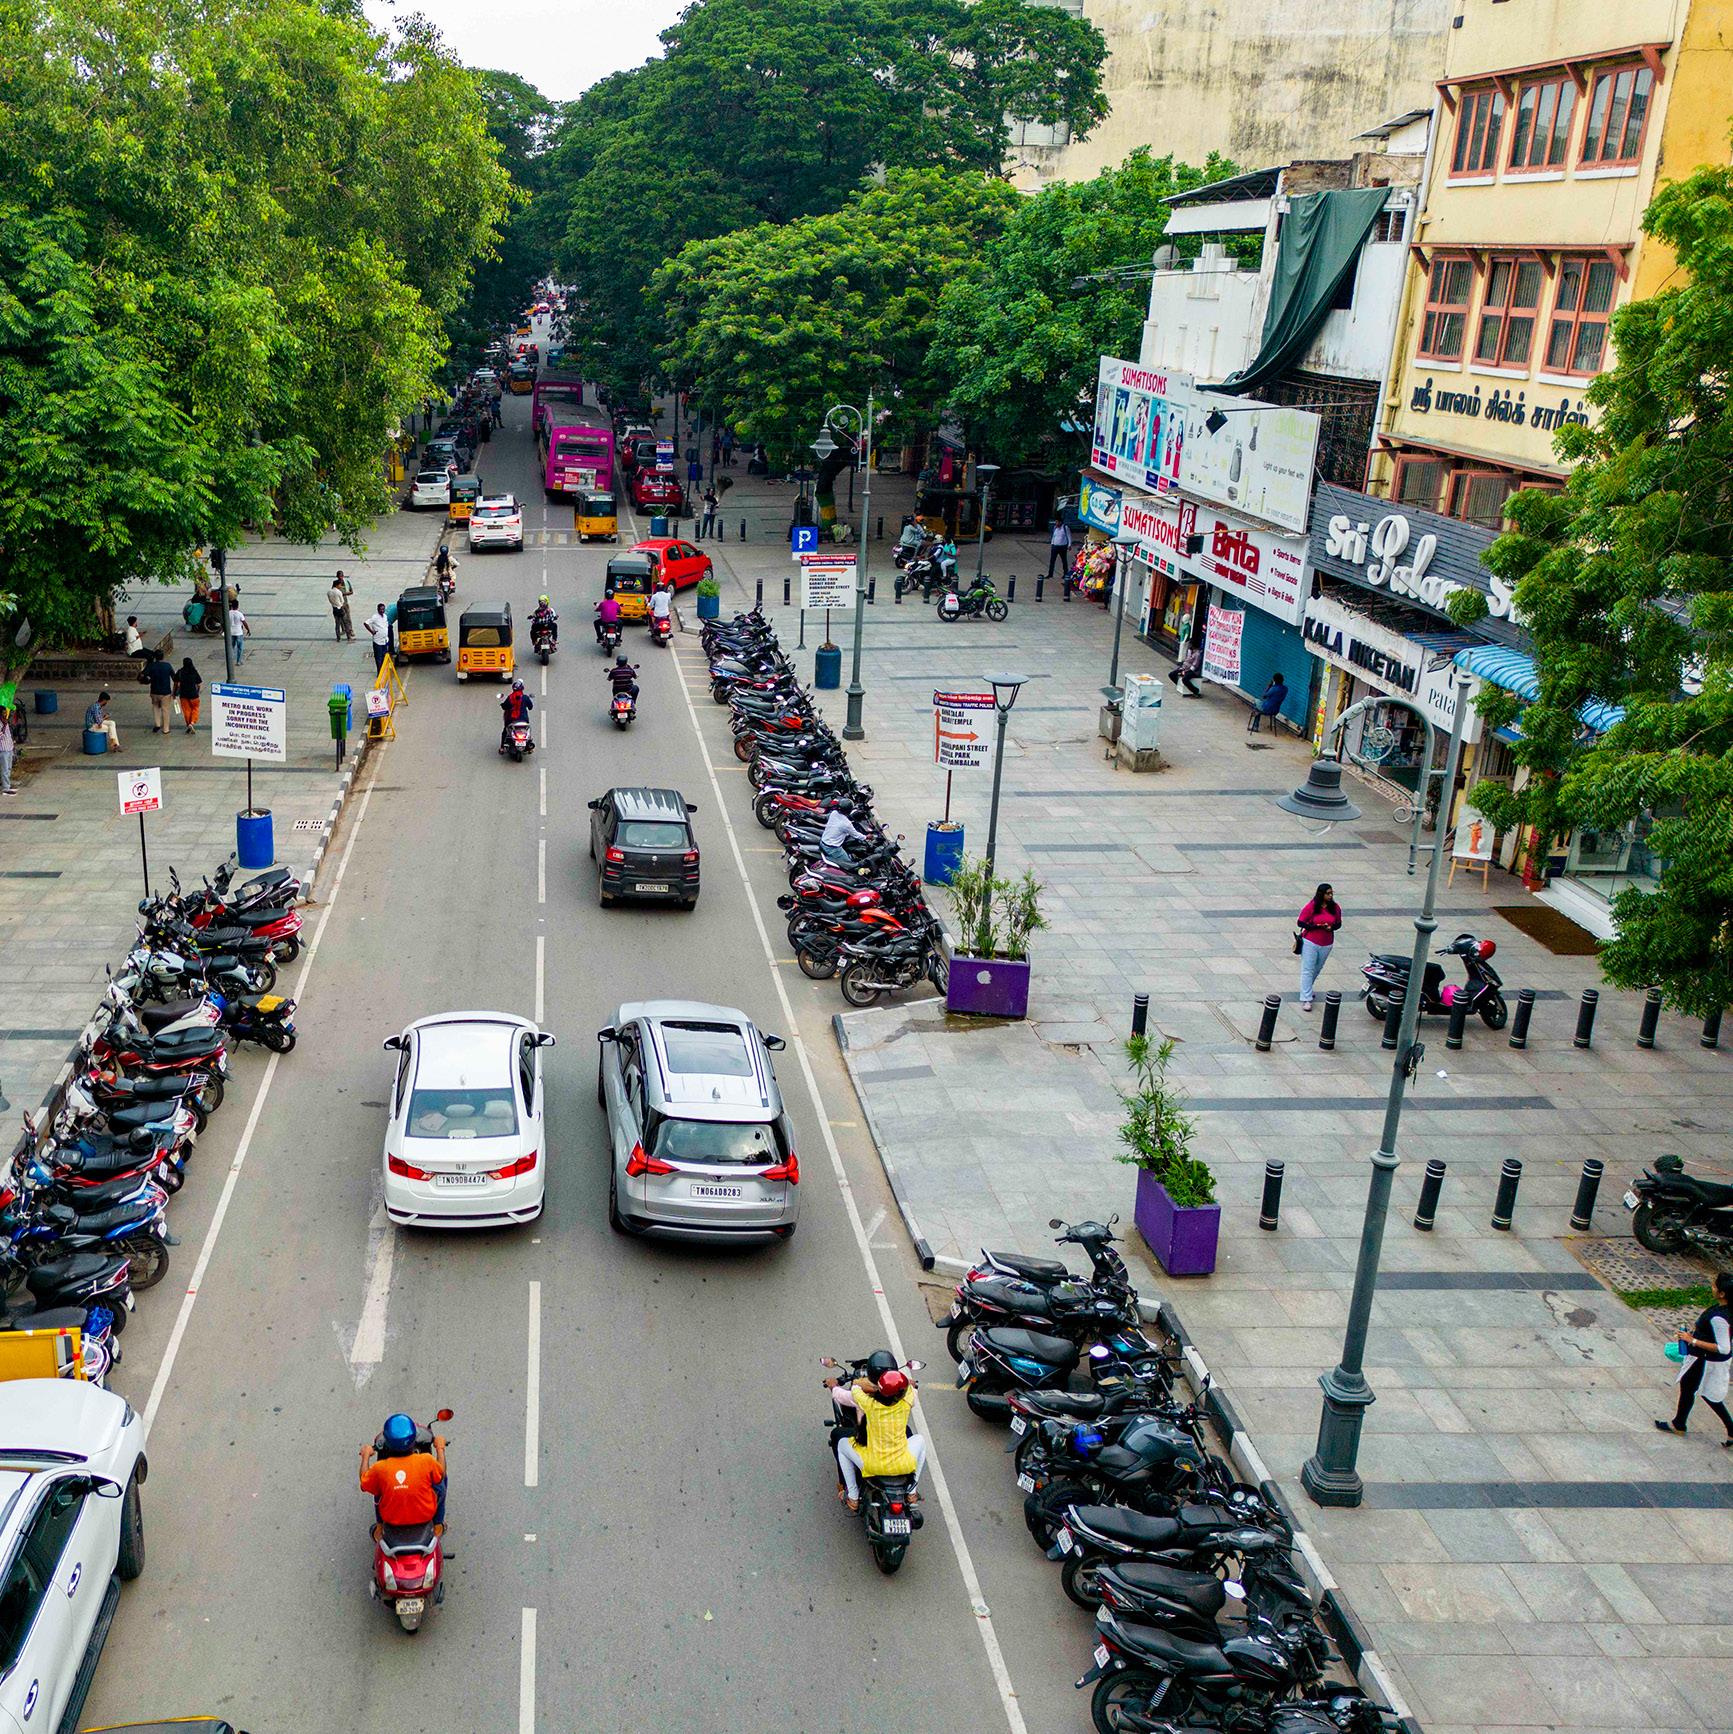
A key priority of the study was to ensure that the findings are representative of the diversity of Indian cities and streets. City and site selection was therefore guided by the need to capture variation across geography, urban scale, economic structure, and street typologies. The study covers 10 cities across India, representing a mix of Tier I, Tier II, and emerging urban contexts, as well as geographically distinct regions. This spread ensures that the evidence reflects a wide range of urban conditions— from dense metropolitan centres to smaller cities and hill towns. This approach ensures that findings are not limited to large metropolitan contexts but are relevant across a broader spectrum of Indian cities.
SITE SELECTION WITHIN CITIES:
Within each city, a pair of streets was identified:
• A Healthy Street with completed pedestrianfocused improvements
• A Unwalkable Street with similar characteristics but without such interventions
This pairing forms the basis of the comparative analysis.
SITE SELECTION CRITERIA
Location context: Streets typically located in core urban areas with active development and consistent footfall, enabling meaningful assessment of economic, environmental and social outcomes, were identified.
Street function: Streets that were active thoroughfares were selected, rather than those that function more as destinations.
This ensured that the selected streets ensure everyday movement and economic activity.
Land use mix: A mix of commercial, and mixed-use streets was included to capture different patterns of use and impact.
Extent of intervention:
The Healthy Streets selected had substantive pedestrian infrastructure improvements, such as continuous footpaths, organised parking, traffic calming, and improved lighting.
Age of intervention: Healthy Streets were selected based on when the improvements were implemented, allowing for a sufficient (at least 1-2 years) for the impacts to stabilise.
Corresponding Non-Healthy Streets:
For each Healthy Street, Non-Healthy streets were selected to broadly match the same land-use, connectivity, similar width of RoW, and overall character, ensuring that difference in outcome can be attributed primarily to street design.
*Map for representation purpose only
AHMEDABAD
PIMPRI CHINCHWAD
CHENNAI
BENGALURU
2.3
Benefits framework: -Economic -Social -Environmental
ECONOMIC
SOCIAL
ENVIRONMENTAL
Direct Commercial Impacts
Commercial Ecosystem Effects
Relocation & Access Effects
Safety & Security
Walking & Active Mobility
Inclusion & Gender Equity
Quality of Life & Social Vitality
Air Quality
Thermal Comfort & Urban Heat
Traffic Management & Speed
Modal Shift & Emissions
Shopkeeper annual turnover
Street vendor daily sales
Direction & distribution of turnover change
Property value premium
New shop openings
Facade renovations & reinvestment
Delivery time improvements
Community maintenance initiatives
Business relocation to Healthy Streets
Modal shift patterns of shopkeepers & vendors
Night-time safety perception
Security from crime perception
Traffic safety perception
Safety for children
Volume count of women, children, elderly
Walking frequency
Dwell time
Modal shift to walking
Pedestrian volume counts
Inclusion perception
Universal design accessibility
User experience rating
Congestion perception
Social gatherings
Extended street use hours
Community maintenance initiatives
AQI comparison
PM2.5 concentration
PM10 concentration
PM1 concentration
Surface temp (carriageway)
Surface temp (footpath)
Tree cover & shade
Vehicle speed
Vehicle volume
Modal share
Pedestrian-to-vehicle ratio
Limitations 2.4
While the study adopts a rigorous and multi-method approach, certain limitations must be acknowledged when interpreting the findings.
Attribution and causality:
The study is not designed as a randomised controlled evaluation and does not establish strict causality between street improvements and observed outcomes. While the combination of Healthy Streets, Unwalkable Streets comparisons and before–after insights provides strong indicative evidence, it cannot fully account for all external factors, such as pre-existing differences between streets, selection of intervention sites, or parallel changes in the surrounding urban environment.
Temporal variation:
Street improvements across the 10 cities were implemented at different points in time, with varying levels of maturity. This influences the scale and nature of observed impacts. While Unwalkable Streets streets provide a useful benchmark for comparison, they do not fully account for all timerelated variations.
Self-reported data:
Data on shopkeeper turnover and vendor sales is based on self-reporting and may be influenced by recall or perception biases. While efforts were made to identify and remove clear outliers, these figures should be interpreted as indicative of trends and relative change, rather than precise values. Insights on property values are based on qualitative inputs from real estate professionals and market stakeholders. These reflect informed assessments and observed trends, triangulated further through secondary desk research.
Sample coverage:
The study includes one Healthy Street and one Unwalkable Street per city. While this allows for comparison across diverse contexts, it limits the ability to assess variation within cities or across multiple streets of similar types. Therefore, city-level findings are based on smaller samples and should be read with this context in mind.
Temporal context of study:
The study reflects conditions during the 2025–26 period. In some cases, broader contextual factors, such as local economic conditions or recovery dynamics, may have influenced outcomes and are noted where relevant.
What is the economic return on a street improvement?
Drawing from evidence across 10 cities, this section assesses how healthy street transformations influence livelihoods, business confidence, and investment patterns. Healthy Street interventions demonstrate measurable gains in business turnover, vendor incomes, and property values. This means that streets, when designed for all users, are among the highest-return public investments a city can make.
I Healthy Streets drive measurable economic gains for businesses
Across seven predominantly commercial Healthy Street corridors, shopkeepers reported an increase in mean annual turnover

This is an average annual gain of ₹4.3 lakh per shopkeeper, reflecting a 20% rise after street improvement.

Ahmedabad (+88.1%) and Bengaluru (+106.7%) record the highest turnover growth. Kochi (+79%) and Bhubaneswar (+42.7%) reflect strong gains driven by local economic shifts and higher-value commercial use. Coimbatore (+15.3%), with predominantly migrant shopkeepers, shows moderate growth,
while Chennai (+5.8%) and Gangtok (+9%) indicate stable growth.
+88.1%
+15.3%
+5.8%
Coimbatore Chennai
*Map for representation purpose only
Considering the conservative macro scenario and India’s nominal GDP baseline of ~10% Compound Annual Growth Rate (CAGR), the Unwalkable Streets’ benchmark of ₹22.90 lakh serves as the best available empirical baseline. When compared with this, Healthy Streets overall, maintain a 14% higher turnover, indicating a sustained economic advantage.
When vendors who used the 10 Healthy Streets prior to improvement were surveyed, average daily sales increase from ₹2,165 to ₹3,261, a gain of ₹1,096 per vendor per day, reflecting a 50.6% increase after improvements.
The
economic benefit extends beyond formal retail. Street vendors across the 10 Healthy Streets studied saw average daily sales increase from ₹2,165 to ₹3,261
Ahmedabad
Bengaluru
Kochi
Bhubaneswar
Gangtok
II Healthy Streets attract more businesses
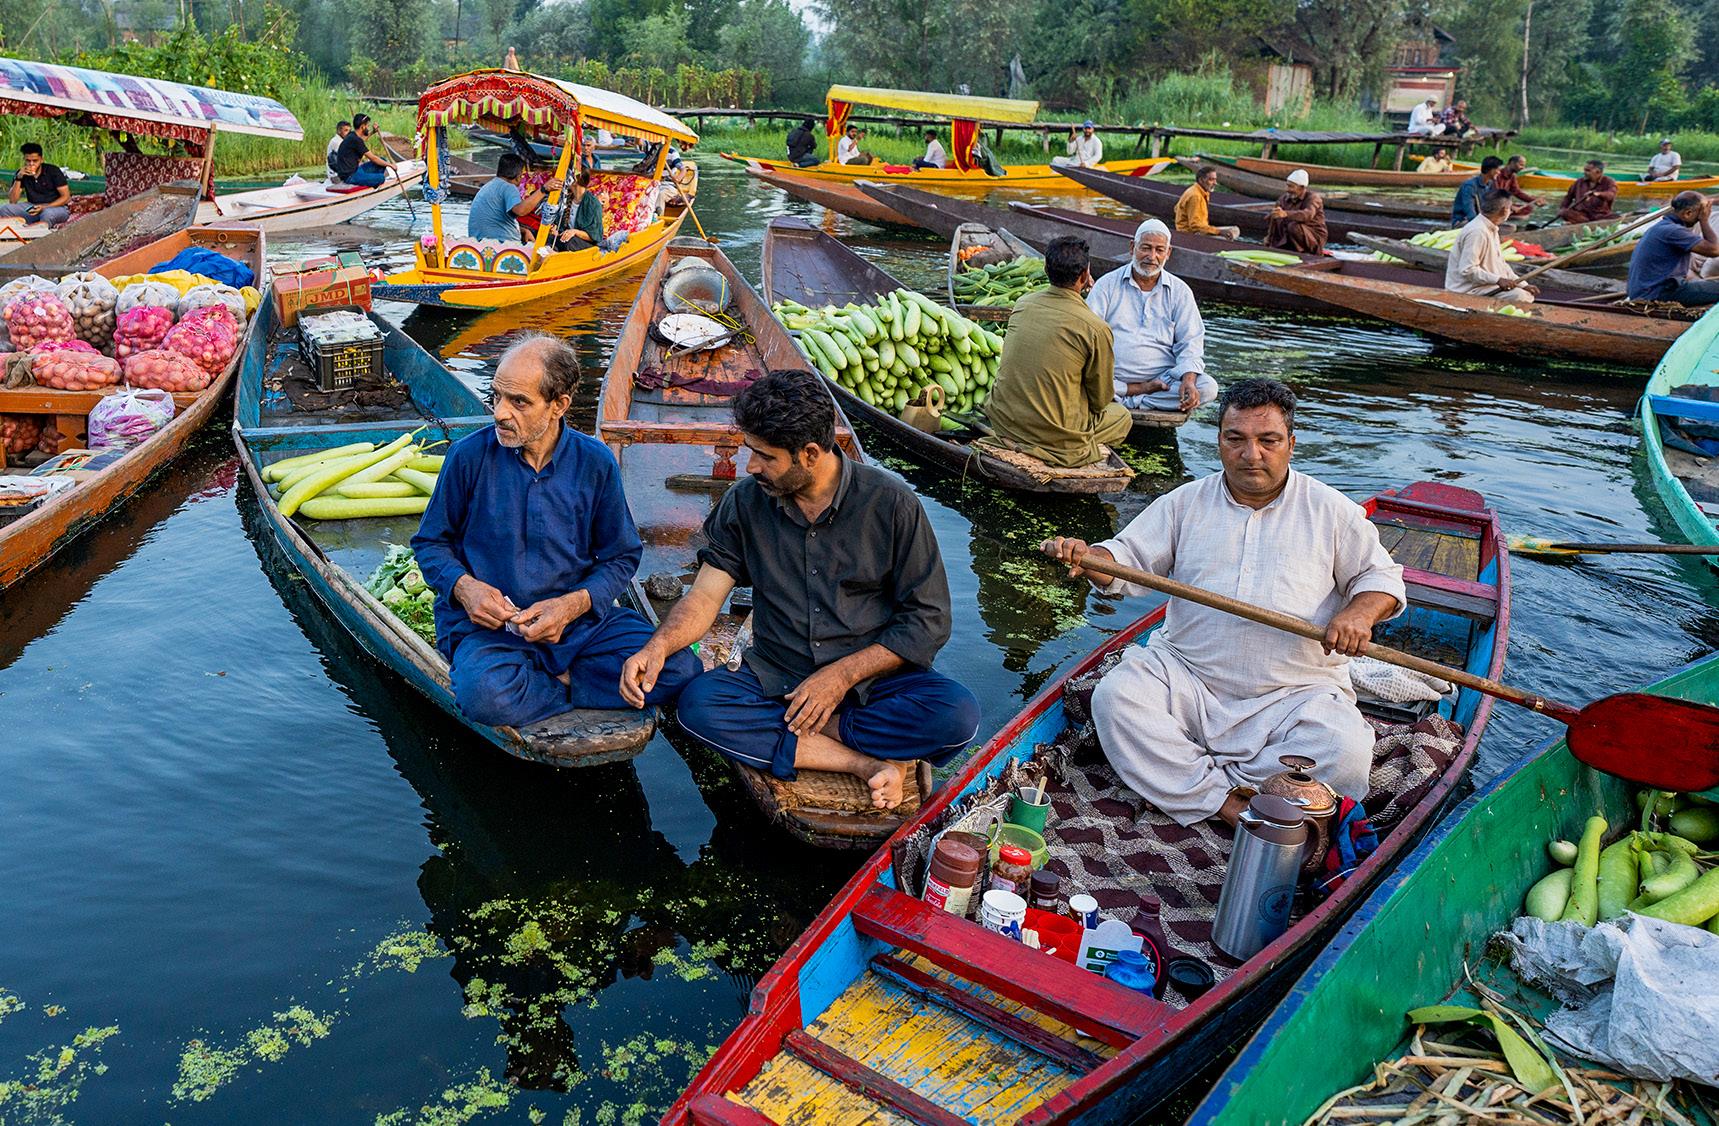
Evidence from our assessments shows that street improvements directly influence business location decisions. A significant number of shopkeepers and vendors have relocated to Healthy Streets. A total of 329 shopkeepers and 98 vendors were surveyed across 10 cities.
47
Among the 95 shopkeepers who had relocated to Healthy Streets, 54 cited street improvements as their primary reason for moving.
Of the 98 vendors surveyed, 47 had relocated to Healthy Streets; all of whom attributed their move exclusively to the street improvements.
This indicates that better pedestrian infrastructure, increased footfall and enhanced overall conditions were significant factors, drawing nearly half of vendors/shopkeepers to Healthy Streets. Previous location
6 IN 10
8
IN 10
shopkeepers report turnover increased after moving.
9 IN 10
49.5% increase After moving to Healthy Street
3,210 shopkeepers explicitly cite ‘street improvements’ as the reason they moved.
shopkeepers report a positive overall experience compared to their previous location.
III Healthy Streets drive ease of business
Beyond individual sales, improvements to Healthy Streets generate broader economic benefits. Enhanced pedestrian infrastructure boosts business visibility, streamlines logistics, and improves customer accessibility, creating a more efficient and attractive commercial environment.
Key findings from shopkeeper surveys on Healthy Streets include: reported new shop openings in the street.


noticed facade renovations along the street.

experienced faster delivery of goods, likely due to better street access and reduced congestion.
These figures suggest that street upgrades not only benefit existing businesses but also stimulate reinvestment and operational efficiency.
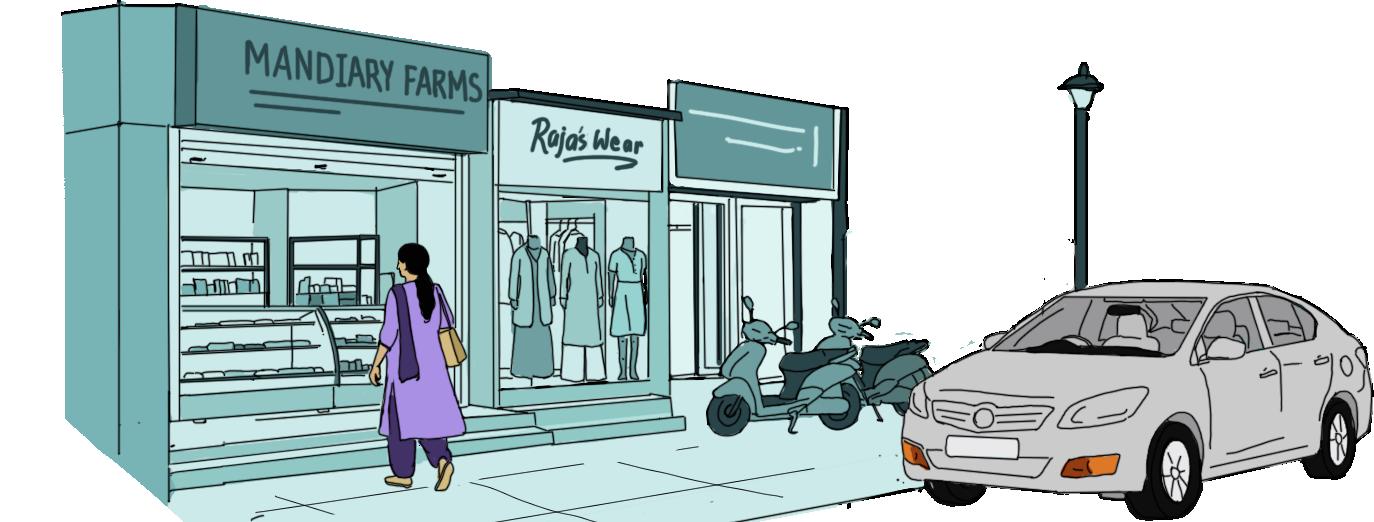
The data also challenges a persistent misconception about parking. 73% of shopkeepers who viewed organised parking as a positive factor reported higher turnover. 26% of those who perceived it negatively reported higher turnover, too. This indicates that organised parking drives positive commercial outcomes regardless of shopkeepers’ subjective opinions about it.
Actual outcome: Economic vitality is driven by people 73% EVIDENCE Feared Parking Loss = Fewer Customers = Sales Decline MYTH:
shopkeepers who viewed organised parking as a positive factor reported higher turn over
Environments = Increased Spending
IV Healthy Streets convert high footfall into high sales
Quality pedestrian environments do more than just attract people. They convert visits into actual spending, reinforcing the strong link between walkability and economic performance. Customer footfall improved for a majority of businesses after street improvements, with nearly two-thirds (62%) of shopkeepers reporting higher daily footfall, while 20% experienced a decrease and 18% reported no change.
Evidence from Healthy Streets clearly supports this:
When footfall increased,
73%
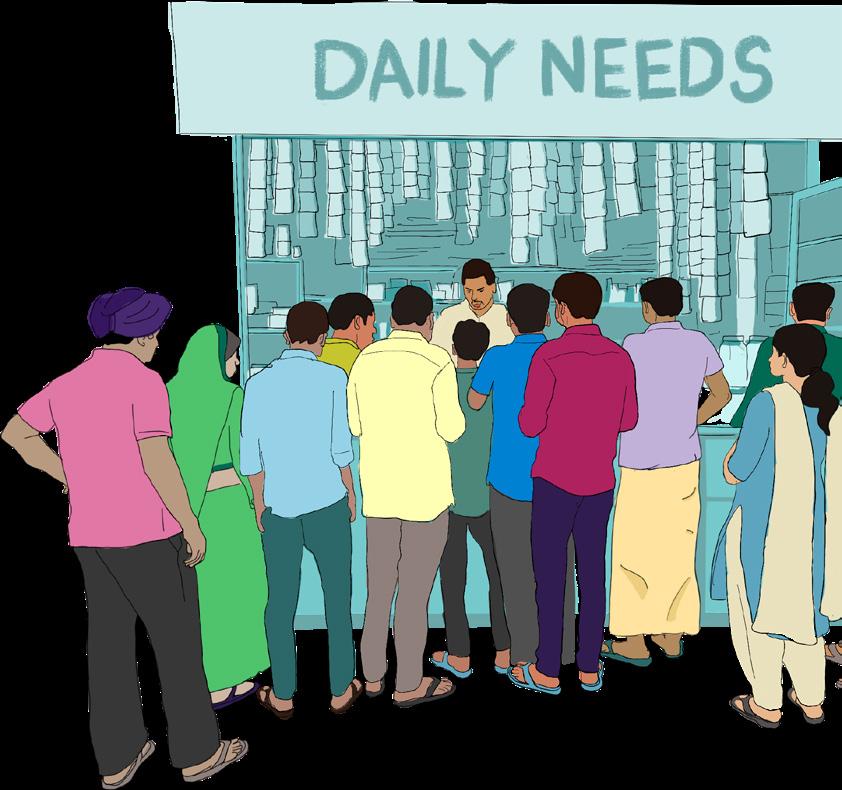
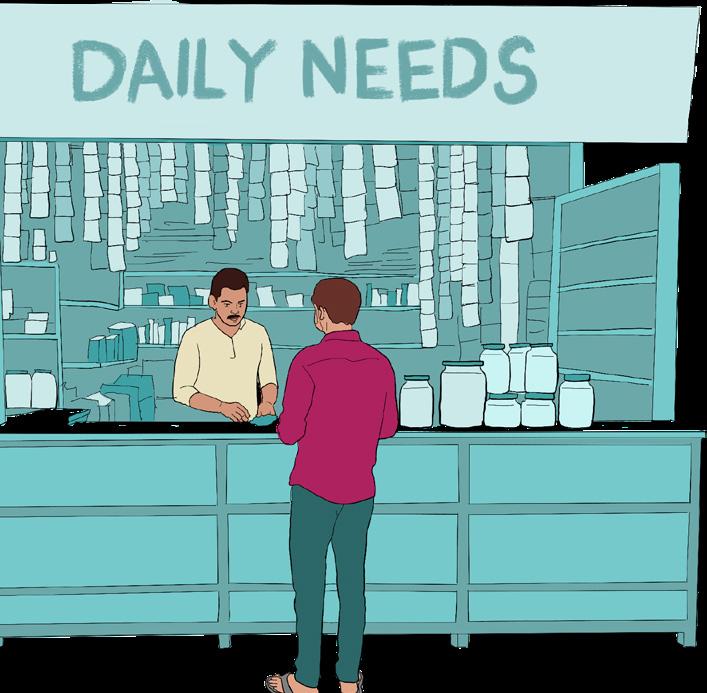
The correlation analysis between the change in footfall and change in daily sales of vendors shows a positive relationship: increase in footfall is closely associated with higher sales, boosting business and revenue. This reinforces the economic value of designing streets that invite people to walk, linger and shop. of shopkeepers reported higher turnover.
Better lighting and walkability has brought in more customers.
- Shopkeeper in Kochi

Sales have nearly doubled since the improvements, attracting newer shops.
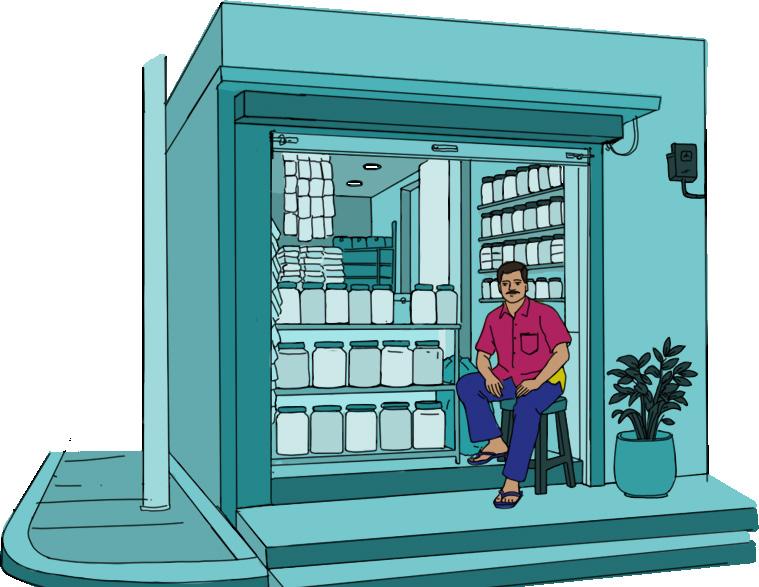
- Business Owner, Bengaluru

Improved safety has made customers more confident to visit at night.
- Shopkeeper in Ahmedabad
Vibrant, walkable streets attract more people, better footfall, and stronger economic outcomes
V Healthy Streets accelerate real estate value
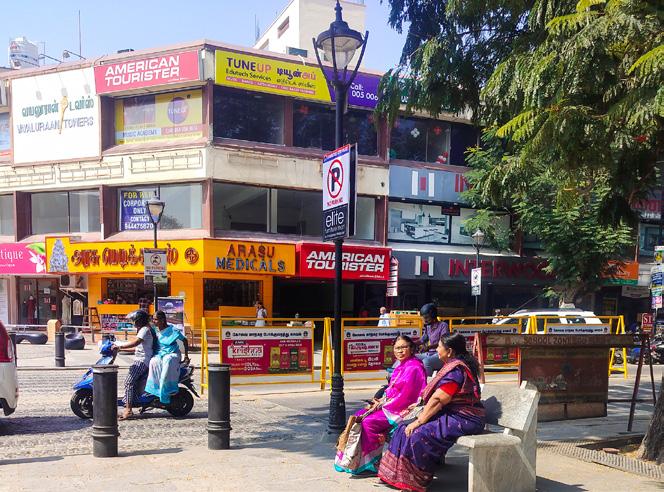
DB ROAD, COIMBATORE
The road commands a 70% increase in rental values, at ₹90.3/sqft versus ₹53/sqft on Unwalkable Streets. Being a mid-tier city, this is a significant improvement in commercial rent well above the usual market trend, demonstrating street quality effect on commercial rent.
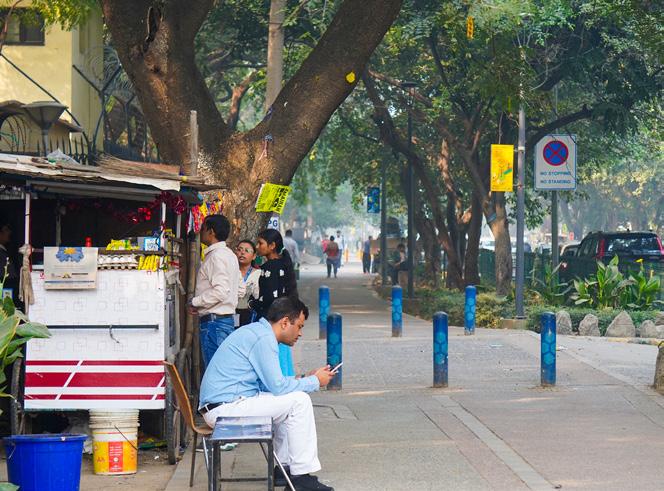
SUB. MAJOR LAXMICHAND ROAD, GURUGRAM
The street shows a meaningful rental increase of 25%. There is a premium of ₹100/sqft for commercial/office spaces on Healthy Streets, versus ₹80/ sqft on Unwalkable Streets.
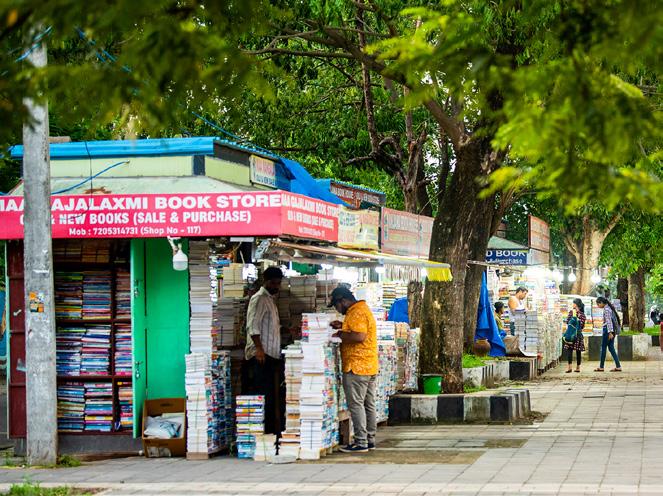
SMART JANPATH ROAD, BHUBANESWAR
Smart Janpath Road, Bhubaneswar, records commercial rents of ₹79.8/ sqft, more than double the value of ₹34.6/sqft on the Unwalkable street. The average commercial property price on the Healthy Street is ₹15,946/sqft, 22% higher than that of the Unwalkable street (₹12,334/sqft), highlighting that the rental premium is also driven by real underlying asset appreciation.
A comparison of property value appreciation and shop ownership patterns observed across Healthy Streets and Non-Heathy Streets reveal important underlying real estate dynamics.
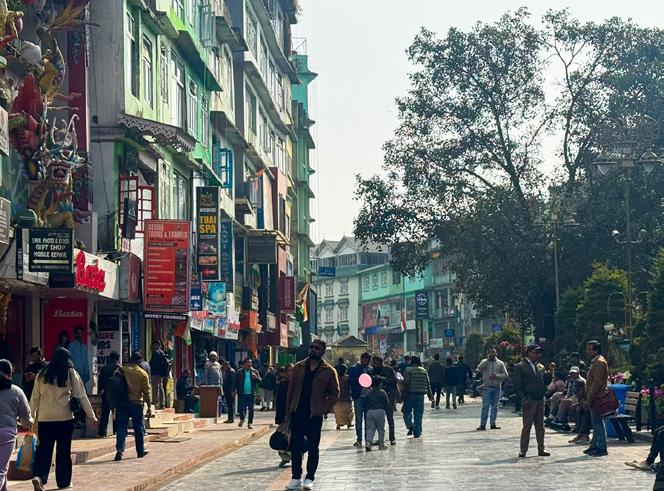
MG MARG, GANGTOK
The street witnessed a striking increase in rent of 228%: commercial rents on HS are at ₹151/sqft against ₹46/sqft on Unwalkable Streets.
FGDs attributed a 40-50% rental uplift directly to pedestrianisation alone, isolating the street-design effect from broader market trends.
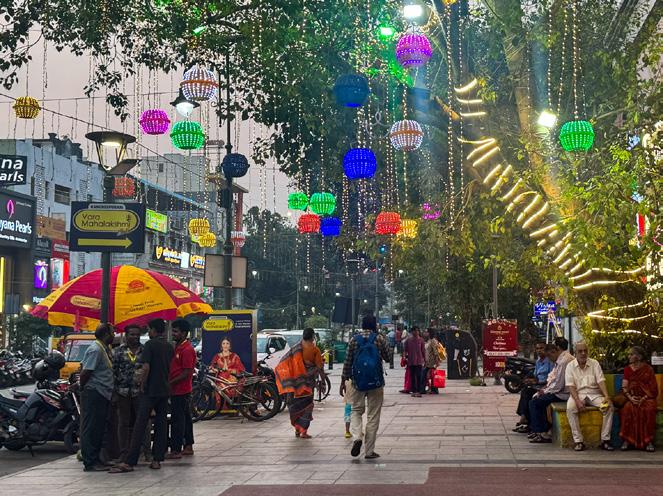
PONDY BAZAAR, CHENNAI
In this location, street quality stratifies even within a single commercial market: street-facing showrooms on the Healthy Street reach ₹200/sqft, while those on the Unwalkable Street are at ₹46/sqft. The fact that both streets share the same commercial property guideline value (₹27,500/sqft), reflecting Chennai’s macro land market, makes the rental gap a pure signal of street-quality-driven demand.
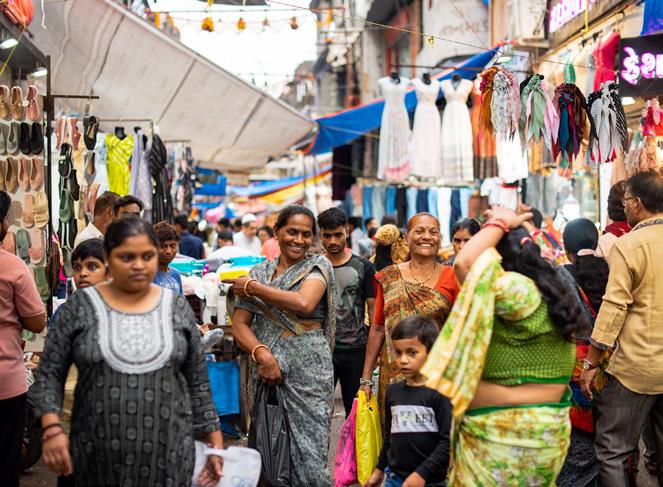
SCIENCE CITY ROAD, AHMEDABAD
The property value shows increase compounding over time: the current rents of ₹108/ sqft is already 80% above that in Unwalkable Streets (₹60/ sqft). The five-year rental growth rate of 60% is more than double the Unwalkable Streets trajectory (23.7%). FGDs confirm that roadfacing commercial demand has risen from ₹1-2 Cr to ₹5-6 Cr per unit as premium businesses actively relocate to the corridor.
Church Street’s commercial rents have increased from ₹60 to ₹200 per sqft: a 3.3× jump. Cafés, restaurants, branded retail, startups moved in. The street became a sought-after commercial address.

- Commercial property agent, Bengaluru
After the footpath, cycle track, and parking came in, roadfacing commercial properties jumped to ₹10,000/sqft versus ₹7,000/sqft, the city average. Apartments have moved from ₹40-45L to ₹70-80L.
- Real estate agent, Kochi
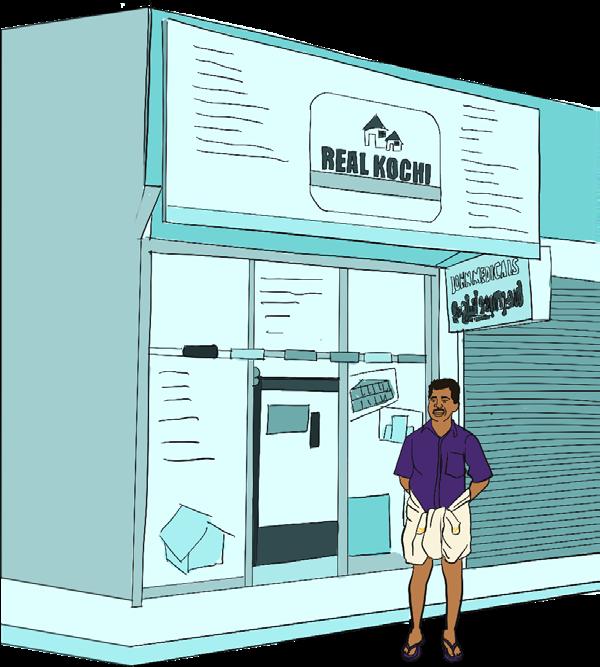
A clean road with proper footpaths, parking and greenery led to property values roughly doubling on this corridor, and the street infrastructure keeps the premium stable even when the broader market dips.

Street improvements pushed property appreciation by 10-15%. Then reclamation of the Linear Garden Park added another 2-5%. Green public spaces along with the street improvements, attract buyers.
- Real estate agent, Pimpri Chinchwad
- Commercial property agent, Gurugram

Healthy Street interventions have generated noticeable real estate appreciation across cities, with commercial rentals reportedly showing 2x raise in most of the commercial corridors.
Property/Rental Value Change After Healthy Street Improvements
Healthy Streets show higher rental activity, reflecting more active and liquid real estate markets. This aligns with economic theory: high-value commercial corridors naturally favor renting over owning, as businesses seek flexibility and prime locations.
Unwalkable Streets, in contrast, show higher rates of shop ownership, which typically indicates lower property values and less dynamic rental markets. Where demand is weaker, renting becomes less attractive or viable for property owners.
Case Example: Shop ownership in Ahmedabad – Healthy Streets vs Unwalkable Streets.
Rented (month-to-month or yearly renewals)
(% of responses)
Unwalkable Street
Leased (long-term, or more than two years) (% of responses)
Owned (% of responses)
The Healthy Street has more than twice as many renters in Ahmedabad 70% vs 31% Rented
The Unwalkable Street’s ownership rate is nearly 3x higher in Ahmedabad 20% vs 54% Owned
Leased
Small difference; long-term leases similar in Ahmedabad’s Healthy and Unwalkable Streets 10% vs 15%
In essence, the shift from ownership to rental activity on Healthy Streets signals rising land values, stronger investor confidence, and a more competitive commercial environment, all driven by improved walkability, safety, and footfall.
Focus Group Discussions with real estate agents across cities reveal that street and pedestrian infrastructure quality is consistently ranked as one of the most critical driver of property prices along with greenery, parking management, and perceived safety. Across cities, the premium range is 10% to over 60%, with street infrastructure quality as the common denominator.
The findings indicate a strong relationship between street quality and economic performance across multiple indicators. Improvements in accessibility and safety contribute to increased commercial activity and asset value. Streets that work better for people work better for businesses, too. For cities making investment choices, the implication is clear: Healthy Streets are not optional enhancements, but critical economic infrastructure that can support both immediate gains and long-term economic resilience.
VI Healthy Streets break stagnation and investment paralysis
46% of Unwalkable Streets’ vendors reported no change in sales over 1–2 years.
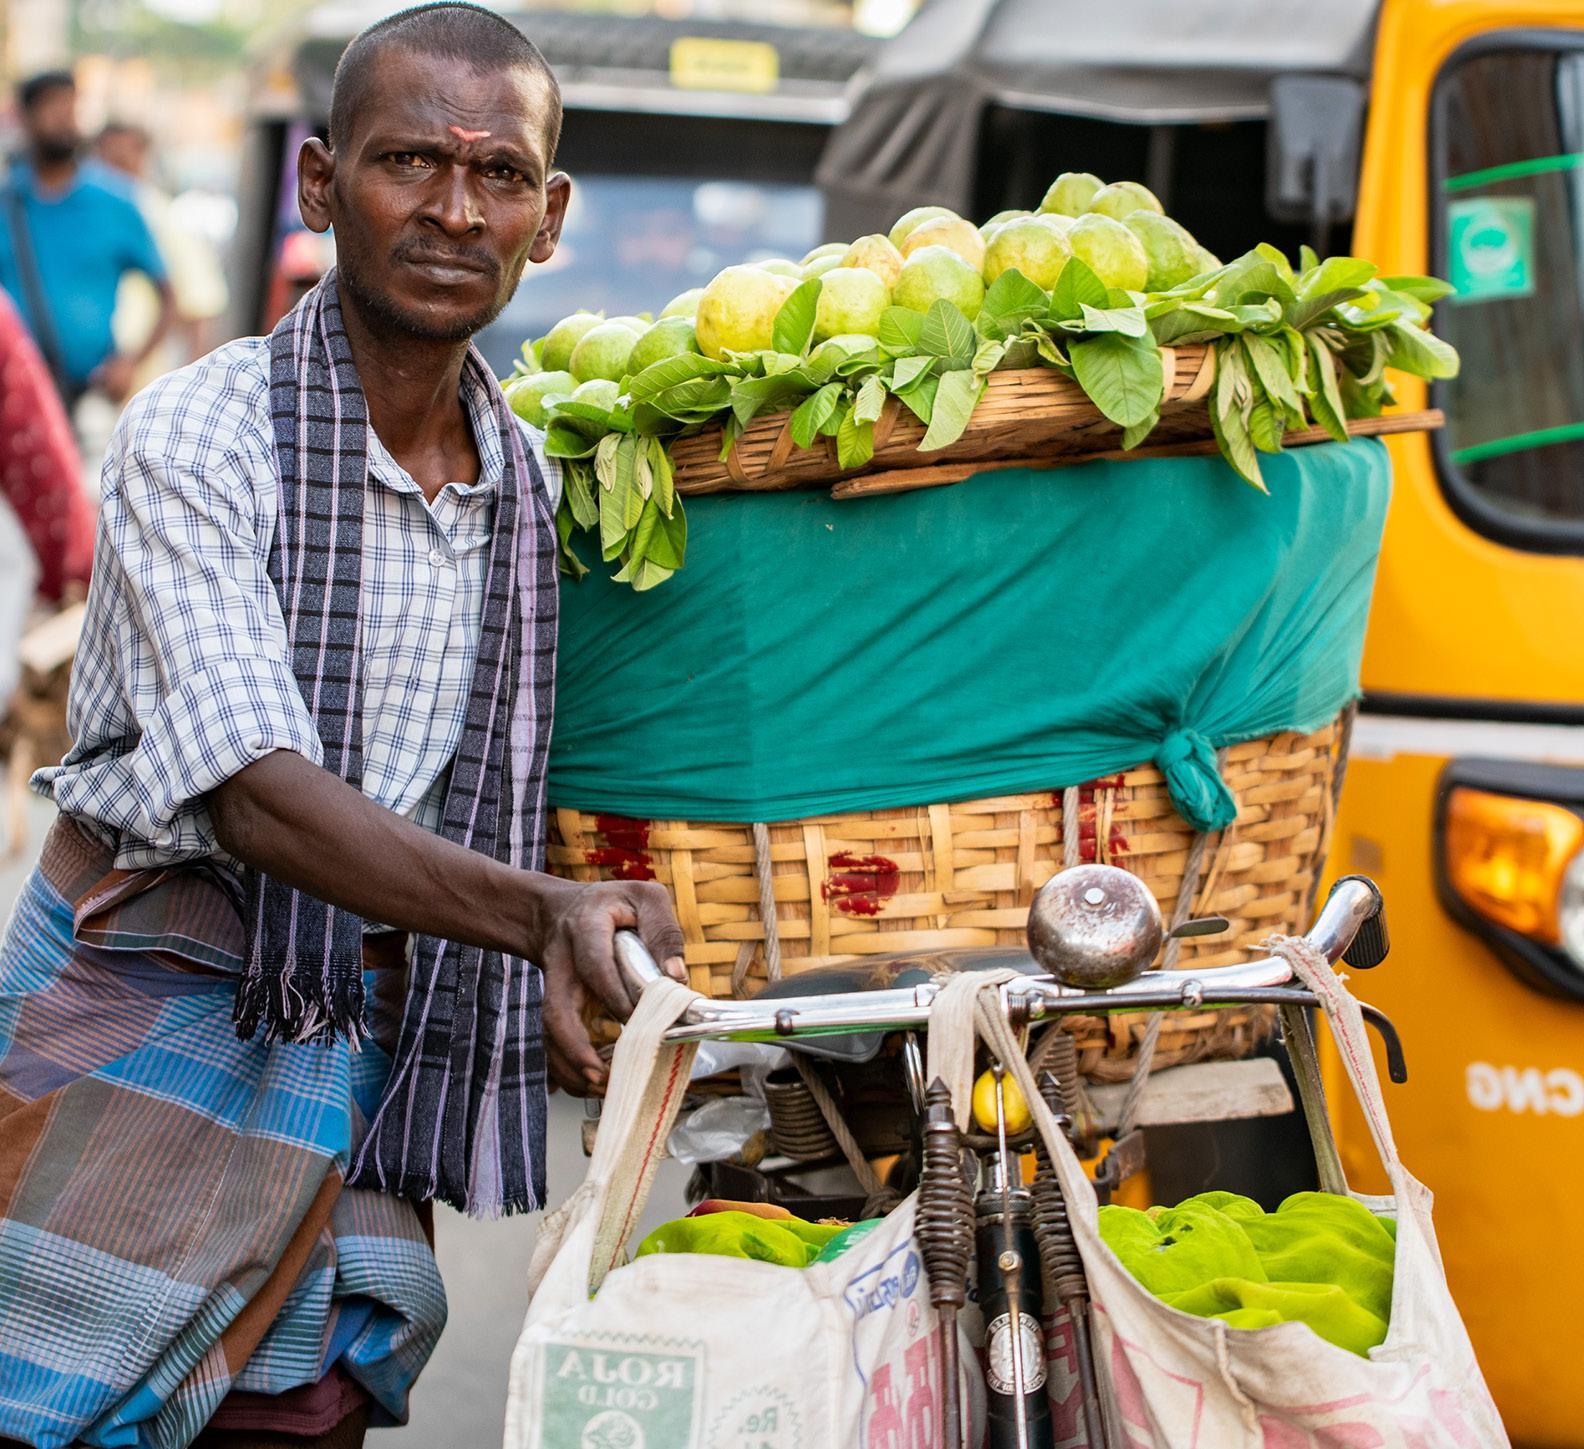
Shopkeepers across Unwalkable Streets cities reported they would not renovate, expand, or upgrade until street conditions improved. In Chennai, the Unwalkable Streets reported 2030% decline in sales, attributable to congestion and poor access. Assessments of real-estate trends and FGDs also reveal that investor confidence is primarily driven by
the street infrastructure and quality.
COIMBATORE
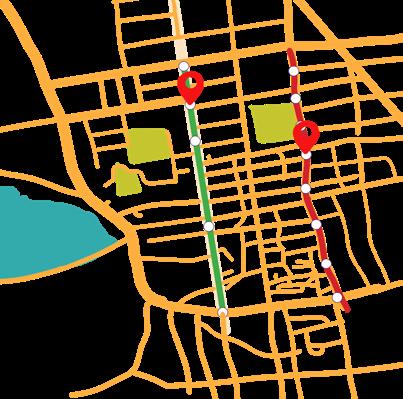
In Coimbatore, DB Road’s ten-year apartment appreciation (90%) far outpaces the NHS-Mettupalayam Road’s (49.4%), even though the NHS street has recorded a higher five-year appreciation (51% vs 33.6%). This aligns precisely with the FGD observation: Mettupalayam Road is experiencing episodic price jumps driven by micro-economic momentum, but the structural investment preference remains anchored to the pedestrian friendly DB Road, where land values have risen from ₹2-3L to ₹9-10L.
KOCHI,MG ROAD
Comparing the land prices, DB Road’s average of ₹19,300/sqft with a 52.6% threeyear appreciation rate far exceeds the NHS land cost of ₹2,450/sqft with only 15.6% appreciation over the same period, a ratio of nearly 8:1. Infrastructure gaps don’t just slow appreciation; they redirect it. This means that value concentrates on streets that have already invested in people-centric street infrastructure and quality, creating a compounding advantage for early-improving corridors.
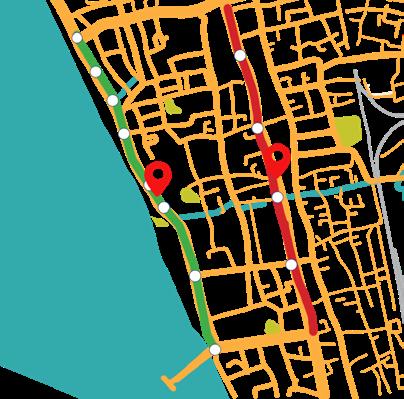
MG Road, an Unwalkable Street from the study, carries a government commercial guideline value of ₹3,251/sqft, higher than the Healthy Street of Shanmugham Road-Park Avenue’s (₹2,787/sqft). This might suggest that the Unwalkable Street is more valuable, but the apartment transaction market tells the opposite story. Prices on MG Road are ₹8,631/ sqft while Shanmugham Road-Park Avenue commands ₹13,500/ sqft, benefiting from footpaths, a cycling track, and organised parking. This investor preference is corroborated by transaction records, and property appreciation has risen from ₹40-45L to ₹70-80L.
FGDs with real estate agents confirmed that MG Road property sales are virtually frozen; only emergency sellers transact, and the market has not recovered since COVID. Due to parking constraints on MG road, a 20-year business owner emphasises that functional gaps deter buyers, and though the historical prime corridor has minimal aesthetic improvements, these are offset by access deficiencies. Infrastructure gaps redirect investment away from otherwise promising streets.
KOCHI
VII Healthy Streets reduce long‑term maintenance costs and improve asset life
The standard infrastructure question is on how much street investments cost the Urban Local Body. Healthy Streets demand a better question: what does it return? Across Ahmedabad, Bhubaneswar, Chennai, and Srinagar, street improvements are generating measurable recurring fiscal returns, flowing directly into municipal own-source revenue, expanding tax bases, formalising previously unmonetised public assets, and structurally reducing lifecycle maintenance costs.
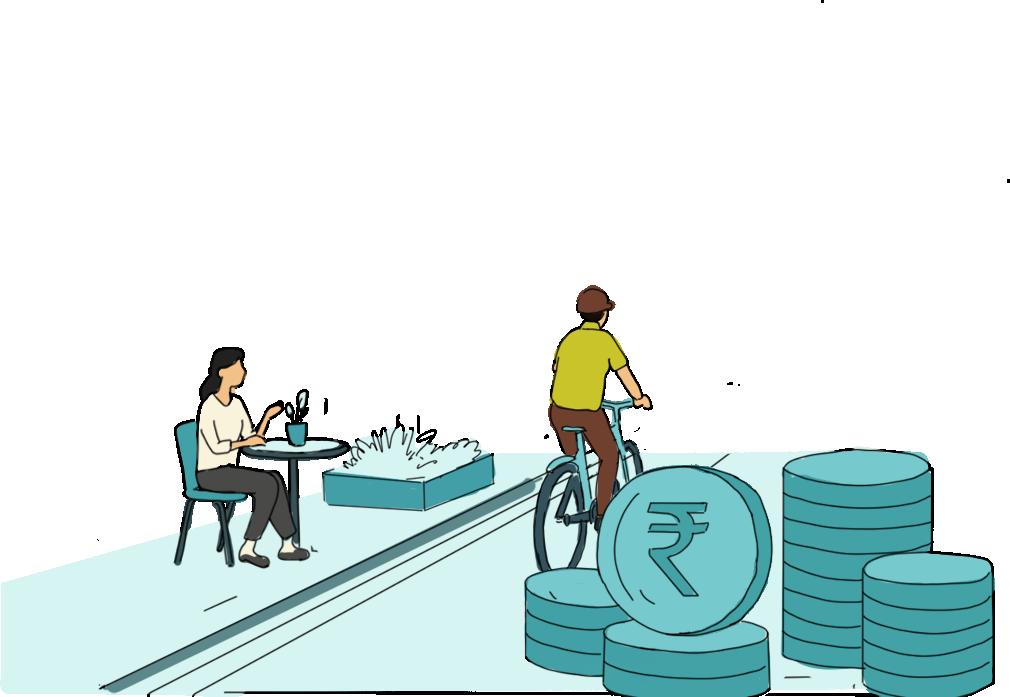
Property tax compounding:
The multiplier effect of commercial intensification
Street improvement has an overarching effect by reshaping the commercial geography in the area, and compounding property tax returns over time. Ahmedabad’s Science City Road illustrates this most powerfully. Against a ₹25 crore capital investment, total property tax recovery grew from ₹24 crores in 2021-22 to ₹39.30 crores in 2025-26, a 63.69% increase. Non-residential properties grew by 21.11%, adding over 1,400 commercial assessments to the municipal corporation’s rolls in five years.
This growth cannot be explained by statemandated annual hikes alone (5% per annum from FY 2023–24). The surplus is attributable to commercial mix-shift and rising assessed values, a direct consequence of improved street infrastructure
driving higher-value land use. The fiscal implication is structural: a Healthy Street does not just recover its investment; it continuously expands the base on which future tax revenue is calculated.

Parking and vending as new revenue streams
Across all four cities, a consistent pattern emerges: street improvements convert previously unmonetised or informally occupied public space into formalised, recurring revenue streams that simply did not exist before the intervention.
In Ahmedabad, organised on-street parking for 225 two-wheelers and 596 four-wheelers, alongside off-street facilities, generates ₹68.64 lakhs annually. In Bhubaneswar, Smart Janpath Road’s ₹1.75 crores in annual revenue flows from four new streams: vendor licences, kiosk rents, on-street parking fees, and advertisement hoardings, all on kerb space that previously yielded nothing to the municipal corporation. On-street parking alone contributes ₹1.16 crores, or 66% of total street revenue.
In Srinagar, Lal Chowk’s organised off-street parking facilities across nine locations around the Healthy Street generated ₹1.72 crores in 2025, a direct ownsource revenue stream for the ULB. Between 2024 and 2025, revenue grew by ₹48.20 lakhs, reflecting both rising footfall and improving operational capture rates as the system matures.
Operational ROI: Streets that earn more than they cost to run
Beyond capital recovery, Healthy Streets demonstrate the capacity to generate operational surpluses, a fiscal characteristic entirely absent from conventional road infrastructure. No flyover, signal upgrade, or standard resurfacing produces a revenue line for the ULB.
Bhubaneswar’s Smart Janpath Road presents the clearest case. Its revenue-to-O&M ratio of 1.6:1 means the street earns 60% more than it costs to operate every year, generating ₹30.18 lakhs per kilometre annually. This is a spatially scalable model for municipal revenue strategy.
In Chennai, Pondy Bazaar’s designated on-street parking for 72 Equivalent Car Spaces (ECS) generates ₹68.64 lakhs annually across 300 operating days, recovering its entire annual maintenance expenditure of ₹15.54 lakhs and producing a surplus of ₹53.10 lakhs which is more than three times its maintenance cost. The neighbouring Unwalkable Street corridor, by contrast, costs more to maintain and leaves its revenue potential entirely untouched.
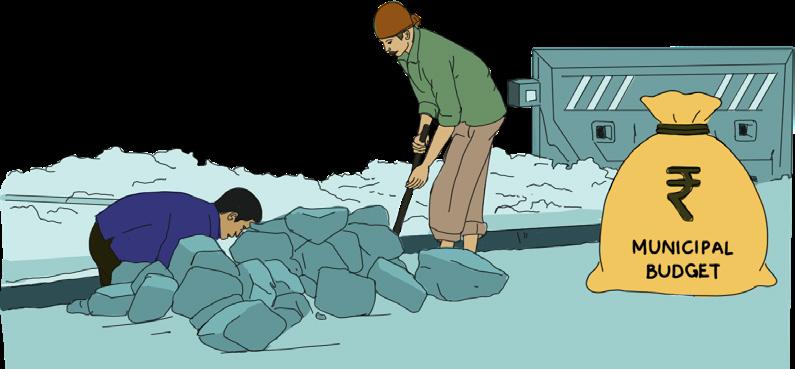
The economics of avoided costs: Making invisible expenditure visible
Chennai demonstrates an equally important fiscal argument: the economics of avoided costs. The Healthy Street’s integrated utility corridor eliminates road cuts, significantly reducing lifecycle maintenance expenditure whereas South Usman Road faces ₹70 lakhs in footpath relaying every five years, alongside unbudgeted excavation, reinstatement, and pavement degradation costs each time a utility requires repair. These costs are invisible on any single budget line but accumulate into chronic municipal expenditure on unimproved streets.
For every ₹1 invested in a Healthy Street, three fiscal effects compound simultaneously: the municipal tax base permanently expands as commercial intensity rises above the Unwalkable Street’s baseline; new own-source revenue streams are created from previously unmonetised public assets; and lifecycle maintenance costs are structurally lower than on Unwalkable Streets where lack of streamlined underground utilities generates recurring unbudgeted expenditure.
₹1 INVESTMENT
EXPANSION OF MUNICIPAL COMMERCIAL PROPERTY TAX BASE
Ahmedabad: ₹0.12 returned annually per ₹1 invested
LOWER LIFECYCLE MAINTENANCE COSTS
Chennai: ₹9 returned annually per ₹1 of yearly O&M expenditure
NEW OWN‑SOURCE REVENUE STREAMS
Bhubaneswar: ₹0.14 returned annually from new revenue streams per ₹1 invested
The economic case for Healthy Streets is built on the simple principle that streets that work better for people work better for business. Across ten cities, this plays out in rising turnover, new investment, and accelerating real estate value.
In Healthy Street corridors, the average shopkeeper’s annual turnover jumped by over ₹4 lakh, a 20% increase, and now sits 14% higher than on Unwalkable Streets. Street vendors saw their daily earnings rise by more than half. Nearly half of all vendors relocated to these streets specifically because of the improvements, and seven in ten reported higher sales after moving.
But the impact goes beyond individual shops. Street upgrades triggered a wave of neighbourhood reinvestment: new shops opened, facades were renovated, and deliveries became faster.
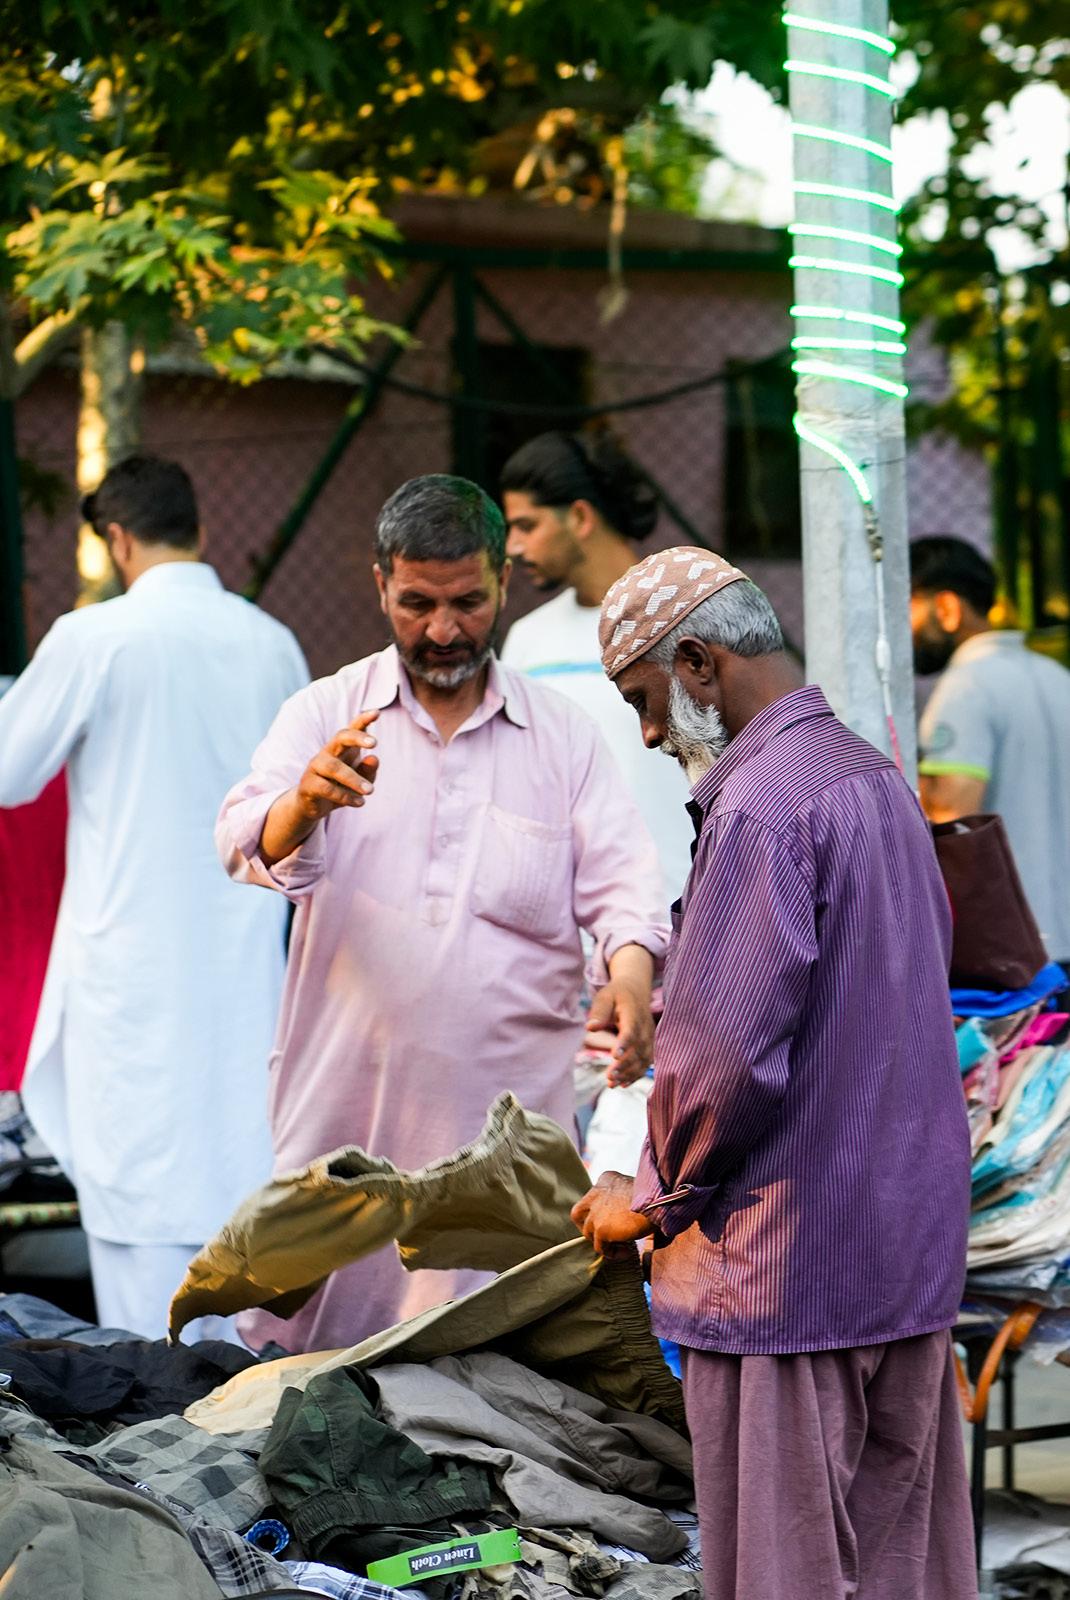
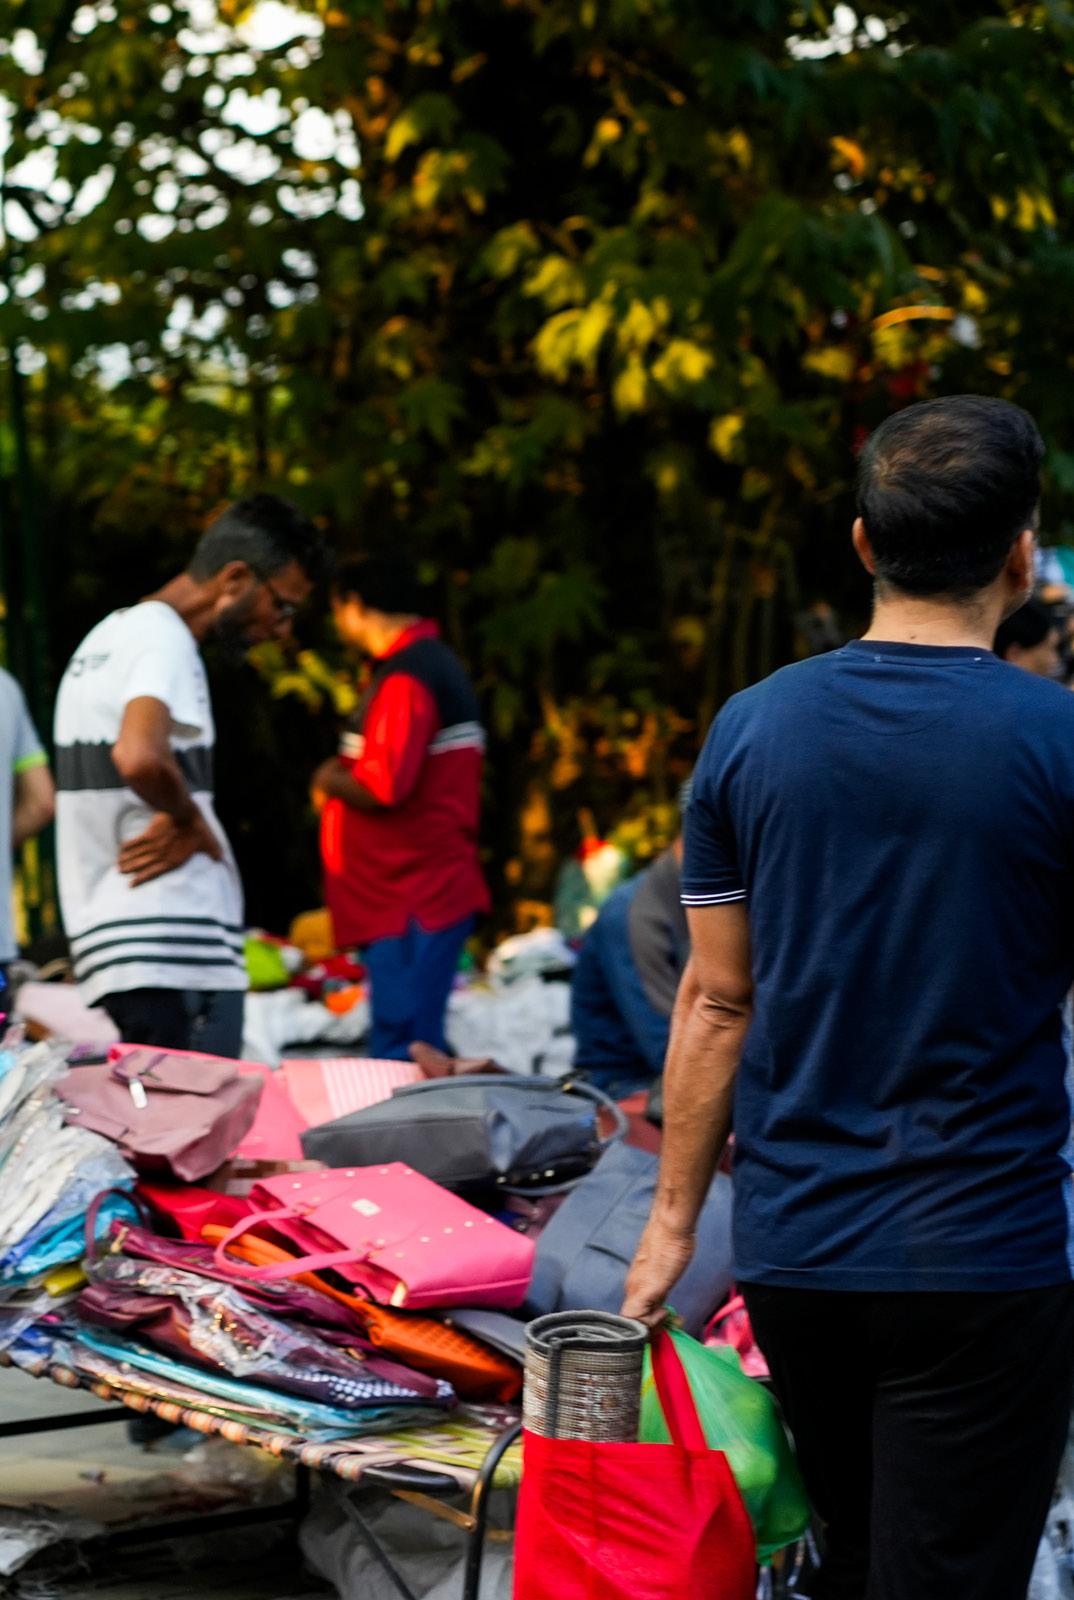
Healthy Streets show more rental activity, signalling rising land values and investor confidence, with property premiums ranging from 10% to over 75% compared to comparable Unwalkable Streets. Meanwhile, on Unwalkable Streets, stagnation rules: nearly half of vendors report flat sales, and shopkeepers refuse to renovate until conditions improve.
There is a need to move beyond the misconception that well designed streets are aesthetic luxuries or mobilityadd ons. Healthy Streets are critical economic infrastructure, one of the highest return public investments a city can make, delivering immediate gains for businesses and lasting resilience for neighbourhoods.
Healthy Streets drive measurable economic gains for businesses
20% RISE IN SHOPKEEPER TURNOVER
Healthy Streets increased average annual shopkeeper turnover by ₹4.37 lakh per business while sustaining a 14% premium over comparable Unwalkable Streets.
Healthy Streets attract more businesses
57% OF THE SHOPKEEPERS WHO RELOCATED TO HEALTHY STREETS
CITED STREET
QUALITY AS THE PRIMARY REASON
Vendors who relocated to Healthy Streets saw a sales increase of 50.6%.
Healthy Streets drive ease of business
79% SHOPKEEPERS REPORT NEW SHOP OPENINGS, 64% WITNESSED FACADE RENOVATIONS AND 85% EXPERIENCE FASTER DELIVERIES
Healthy Streets improve commercial efficiency, promote business upgrades and strengthen investor confidence.
Healthy Streets convert high footfall into high sales
73% OF SHOPKEEPERS WHO SAW HIGHER FOOTFALL, REPORTED HIGHER TURNOVER
Healthy streets do more than attract people; they convert visits into spending.
Healthy Streets accelerate real estate value
10‑60%+ PROPERTY PREMIUMS ACROSS CITIES | 2X HIGHER COMMERCIAL RENTAL APPRECIATION
Improved pedestrian infrastructure, safety, and accessibility emerge as the most influential drivers of commercial demand and investor confidence.
Healthy Streets break stagnation and investment paralysis
46% OF UNWALKABLE STREETS VENDORS SAW NO SALES CHANGE IN 1‑2 YEARS
Unwalkable Streets show signs of economic stagnation: FGDs with shopkeepers highlight that they refuse to renovate or expand businesses until street conditions improved.
Healthy Streets reduce long‑term maintenance costs and improve asset life EVERY ₹1 INVESTED IN A HEALTHY STREET RETURNS HIGHER TAX REVENUE, NEW INCOME STREAMS, AND AVOIDED MAINTENANCE COSTS.
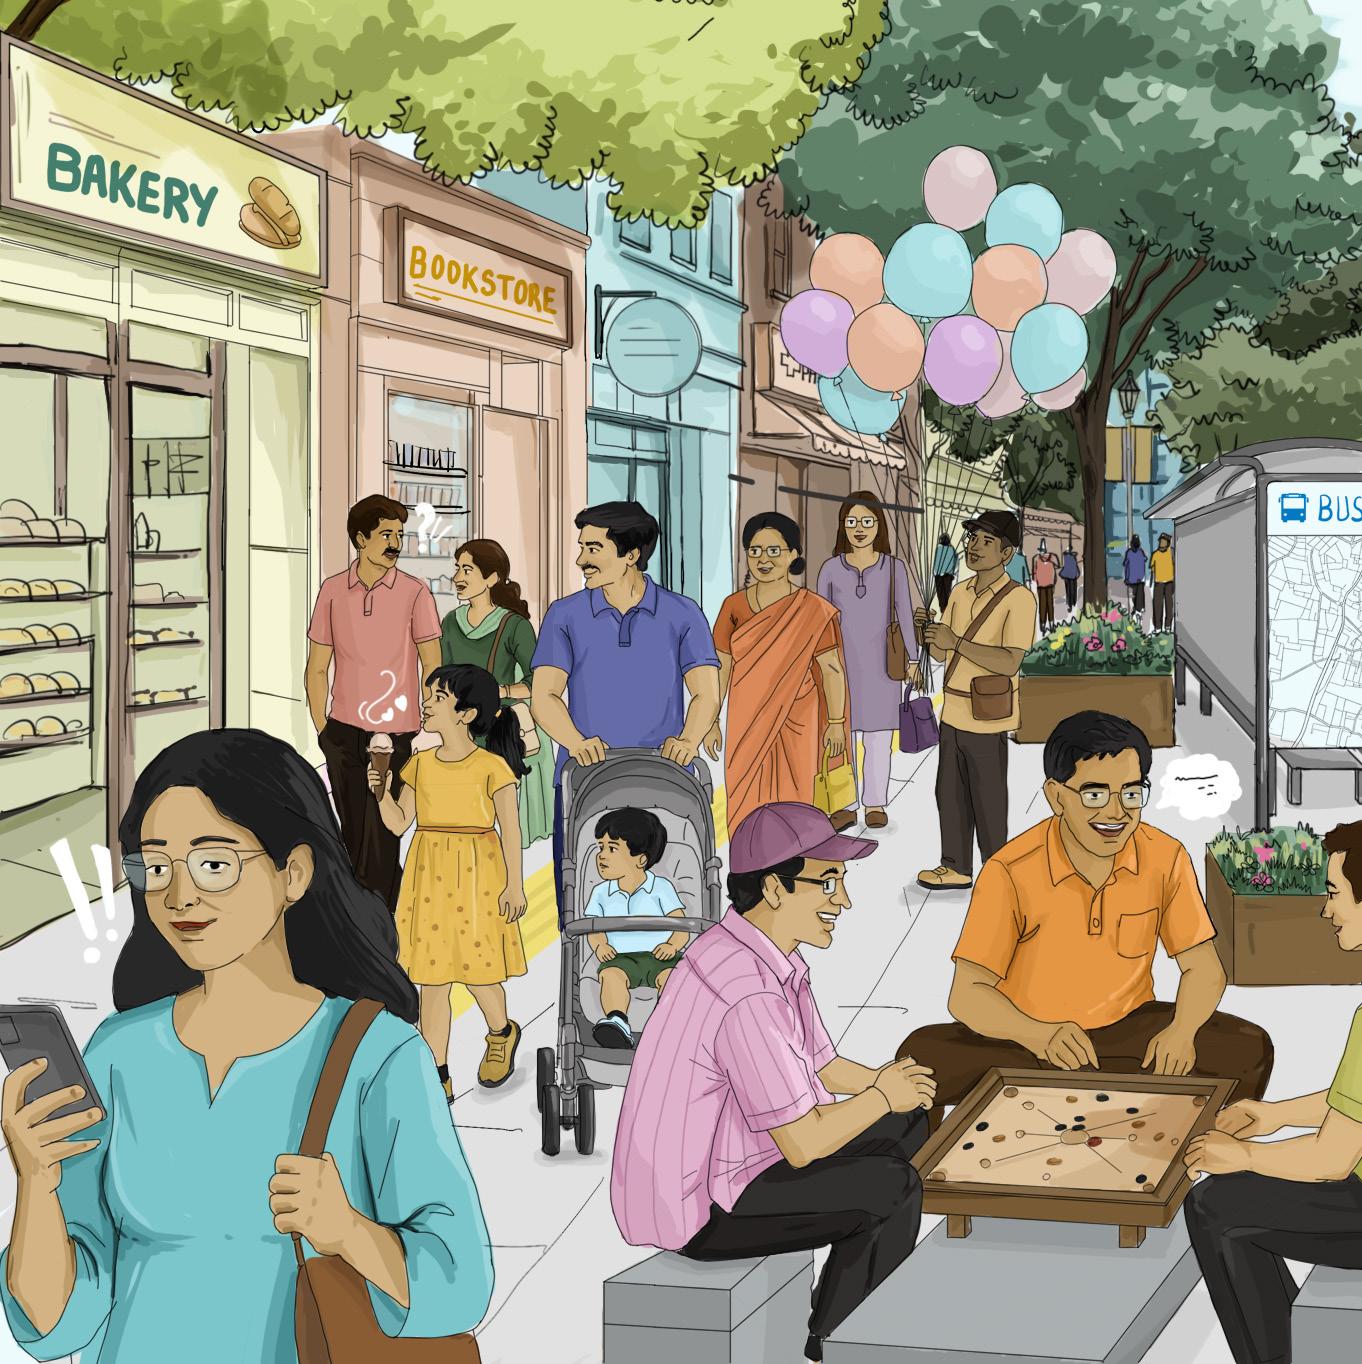
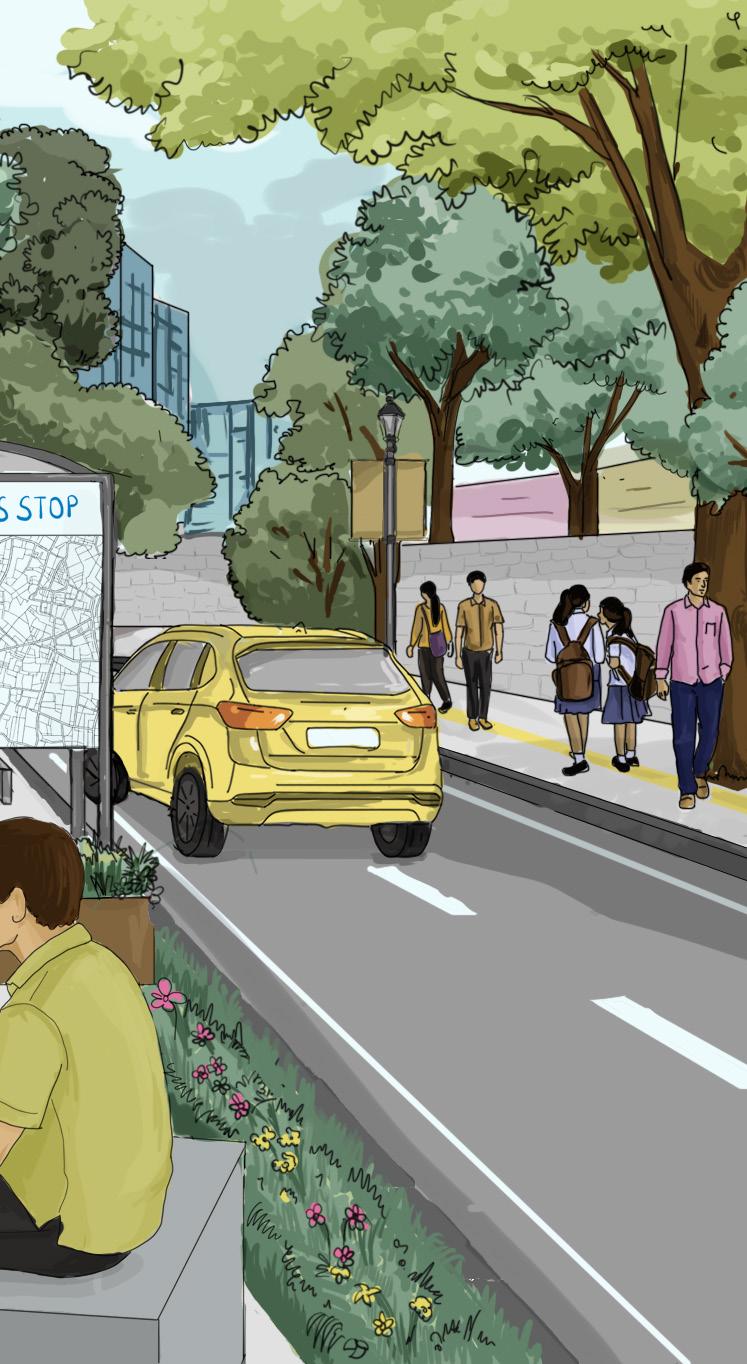
Social impacts 3.2
Healthy Streets are not just transit corridors.
Well-designed, pedestrian friendly streets bring people together and create spaces for walking, pausing and interaction. Healthy Streets strengthen everyday social connections and nurture a sense of community, making cities more inclusive, lively and connected.
I Healthy Streets attract more women, children and the elderly
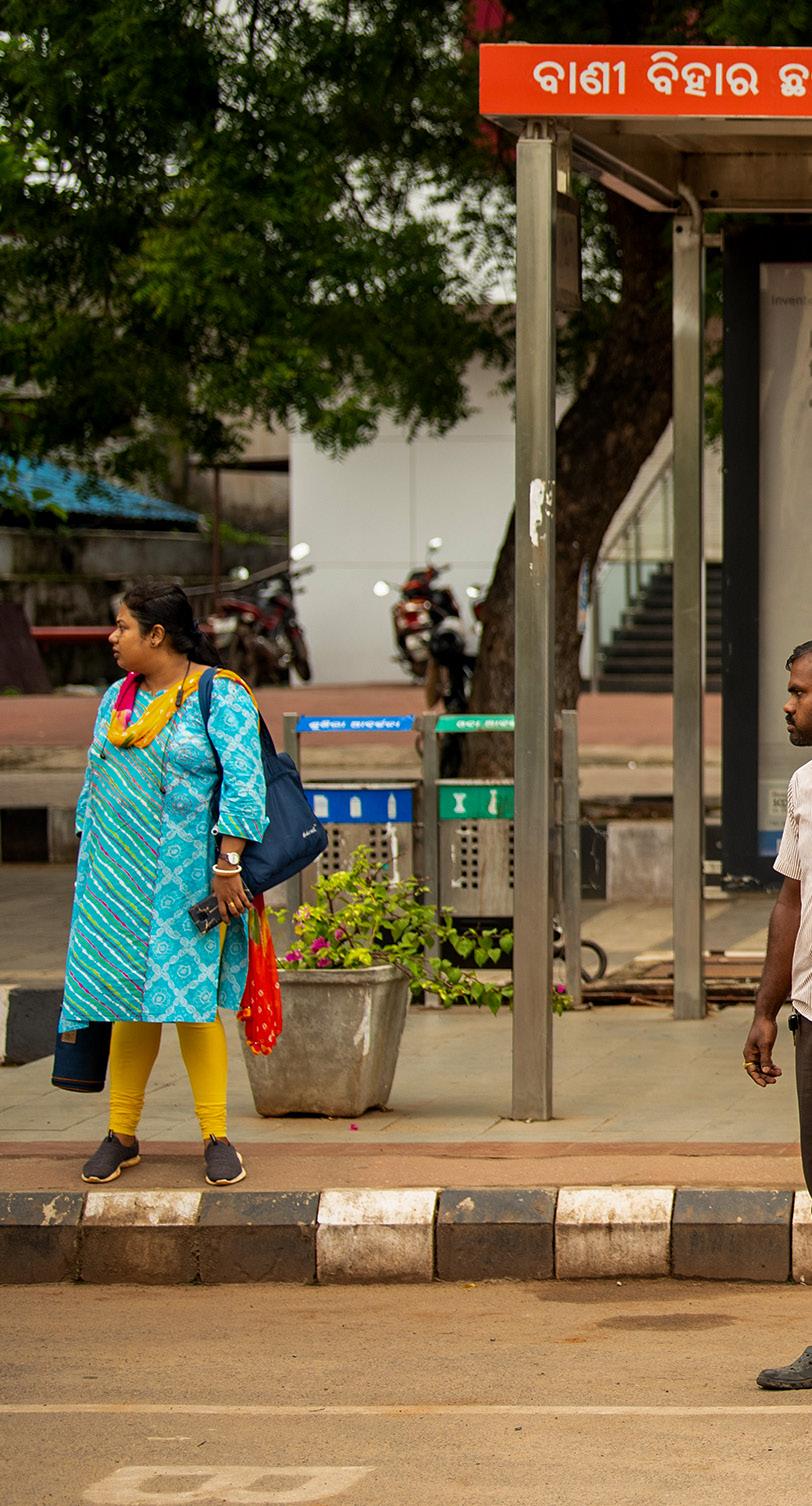
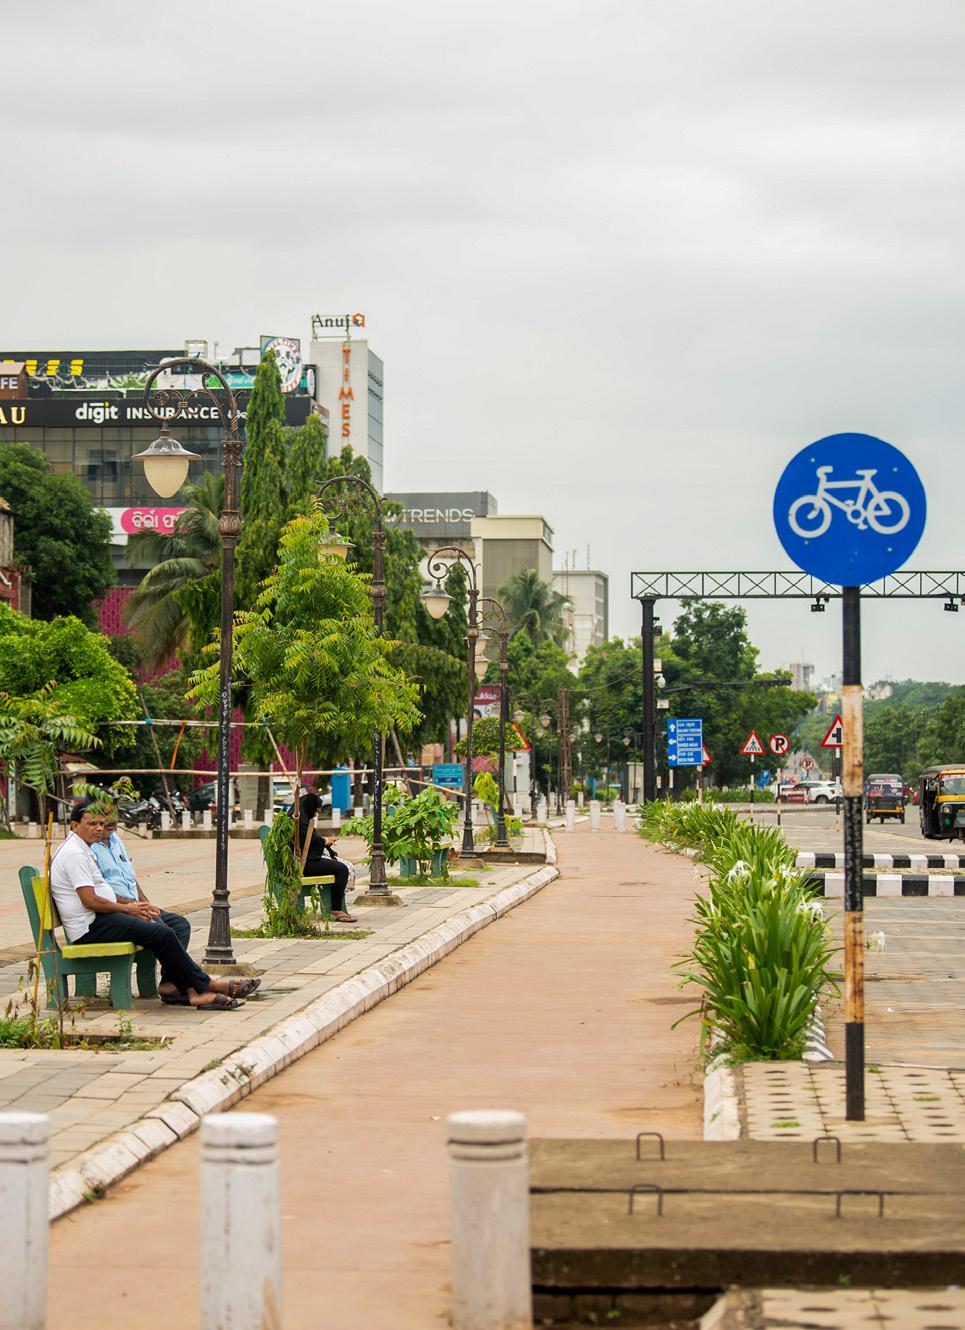
Street improvements in Healthy Streets have ensured safe and secure spaces for walking and cycling along with dedicated shaded spaces for social activities.
The improvements on Healthy Streets directly increased pedestrian activity in terms of both frequency of visit and dwell time, attracting new visitors and sustaining existing ones. The data collected from traffic volume count surveys also suggests that Healthy Streets witness 36% more pedestrians than a Unwalkable Street.
The data collected from traffic volume count surveys also suggests that Healthy Streets witness 36% more pedestrians than a Unwalkable Street.

Pedestrian count - Healthy Streets vs Unwalkable Streets.
Healthy Streets
Unwalkable Streets
Source: 15-minute peak hour traffic volume count
Ahmedabad
Bengaluru
Chennai
Gangtok
Bhubaneswar
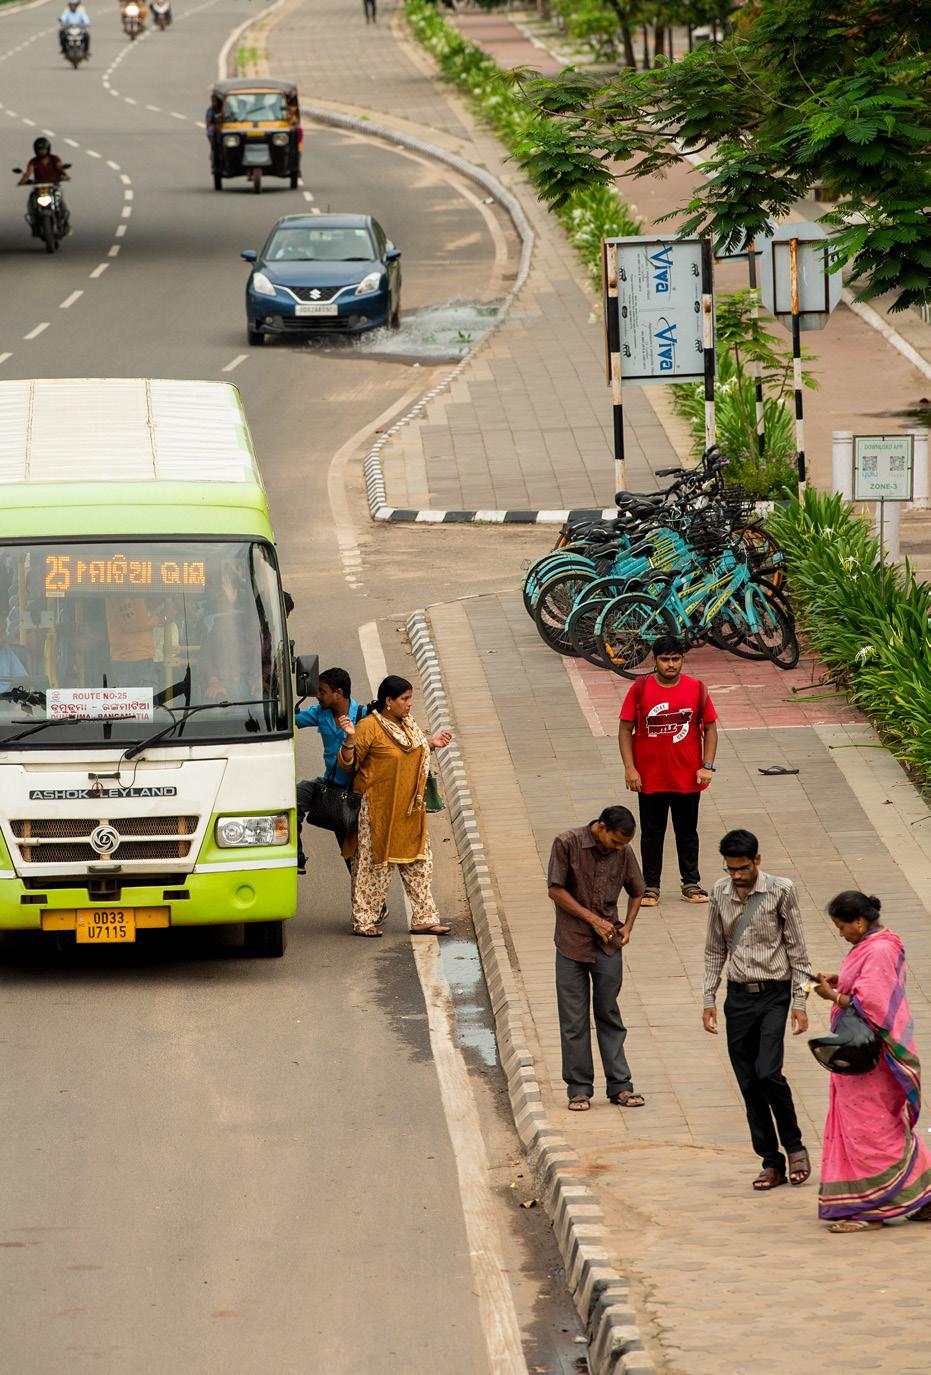
A correlation analysis was also conducted between overall walking experience and access to public transport (PT) across the selected 10 Healthy Streets. The findings revealed a positive relationship, indicating that respondents who reported better walking experiences also perceived access to public transport as safer and more convenient. This highlights the strong link between walkability and public transport accessibility, as comfortable and safe walking conditions are essential for reaching transit services. By prioritising high-quality pedestrian infrastructure, Healthy Streets not only improve the walking experience but also strengthen lastmile connectivity and enhance access to public transport.
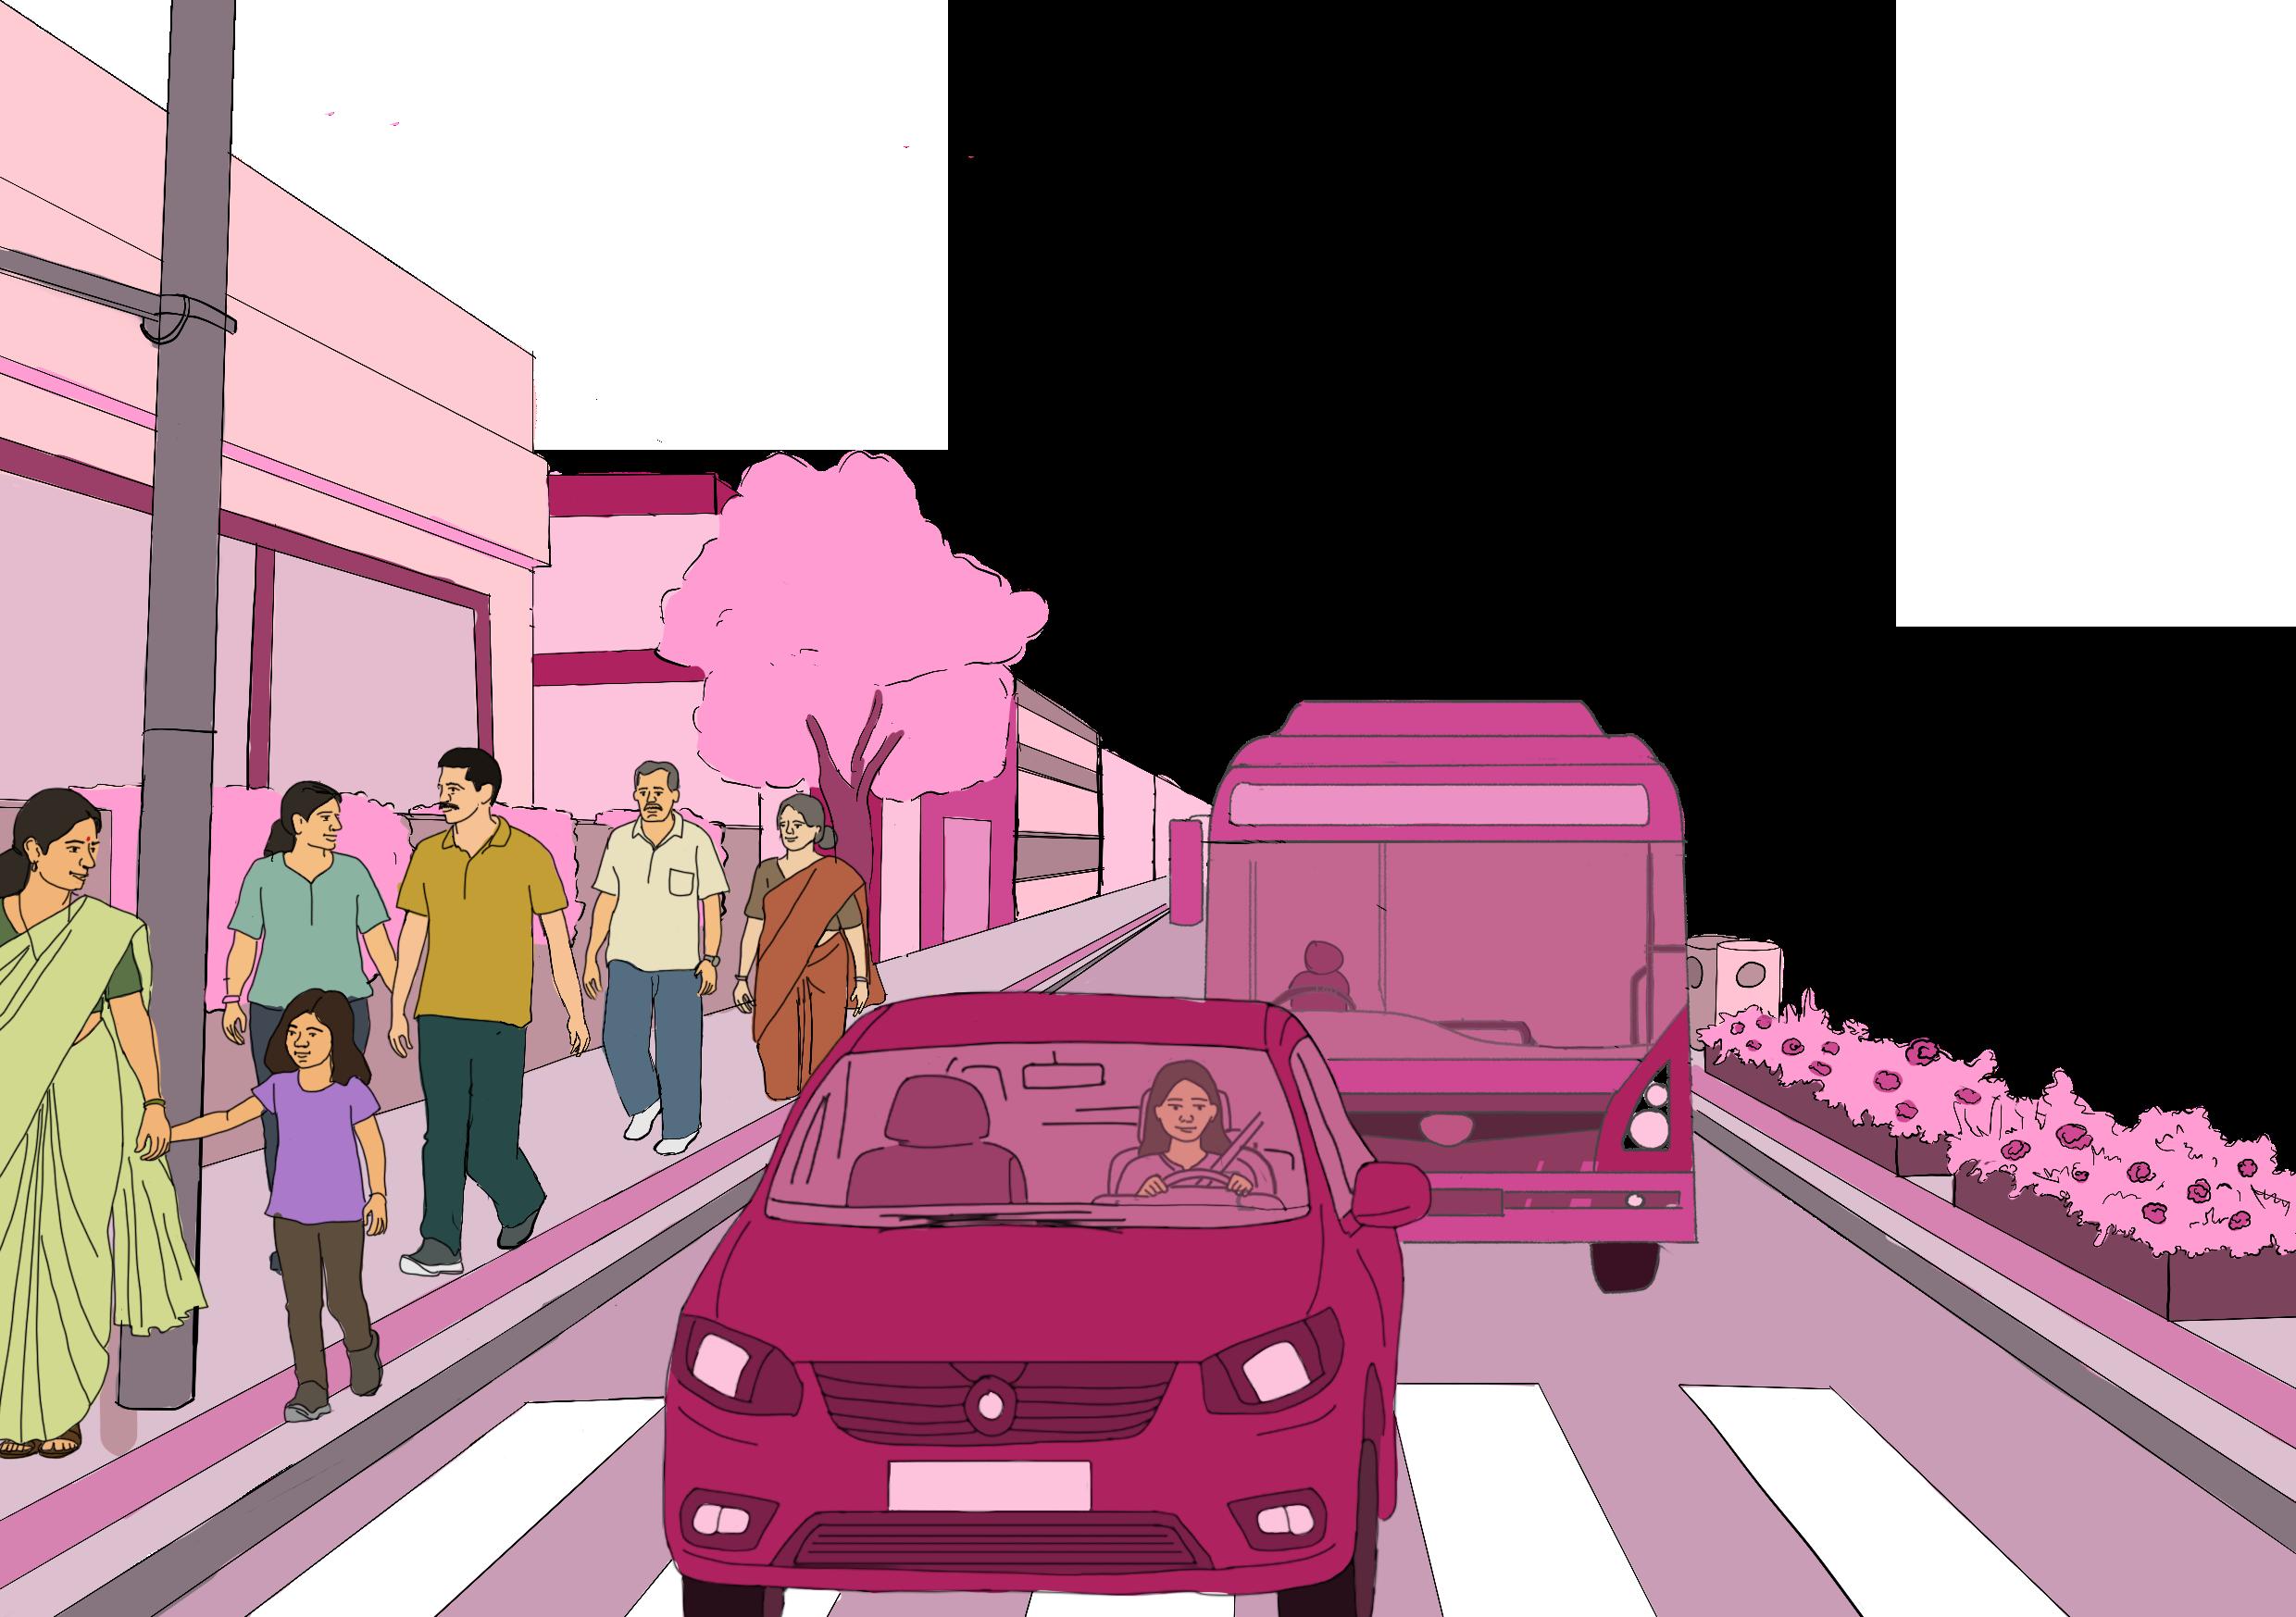
HIGHER PEDESTRIAN:VEHICLE RATIO
Healthy Streets
50 pedestrians
Unwalkable Streets =
35 pedestrians 100 vehicles 100 vehicles
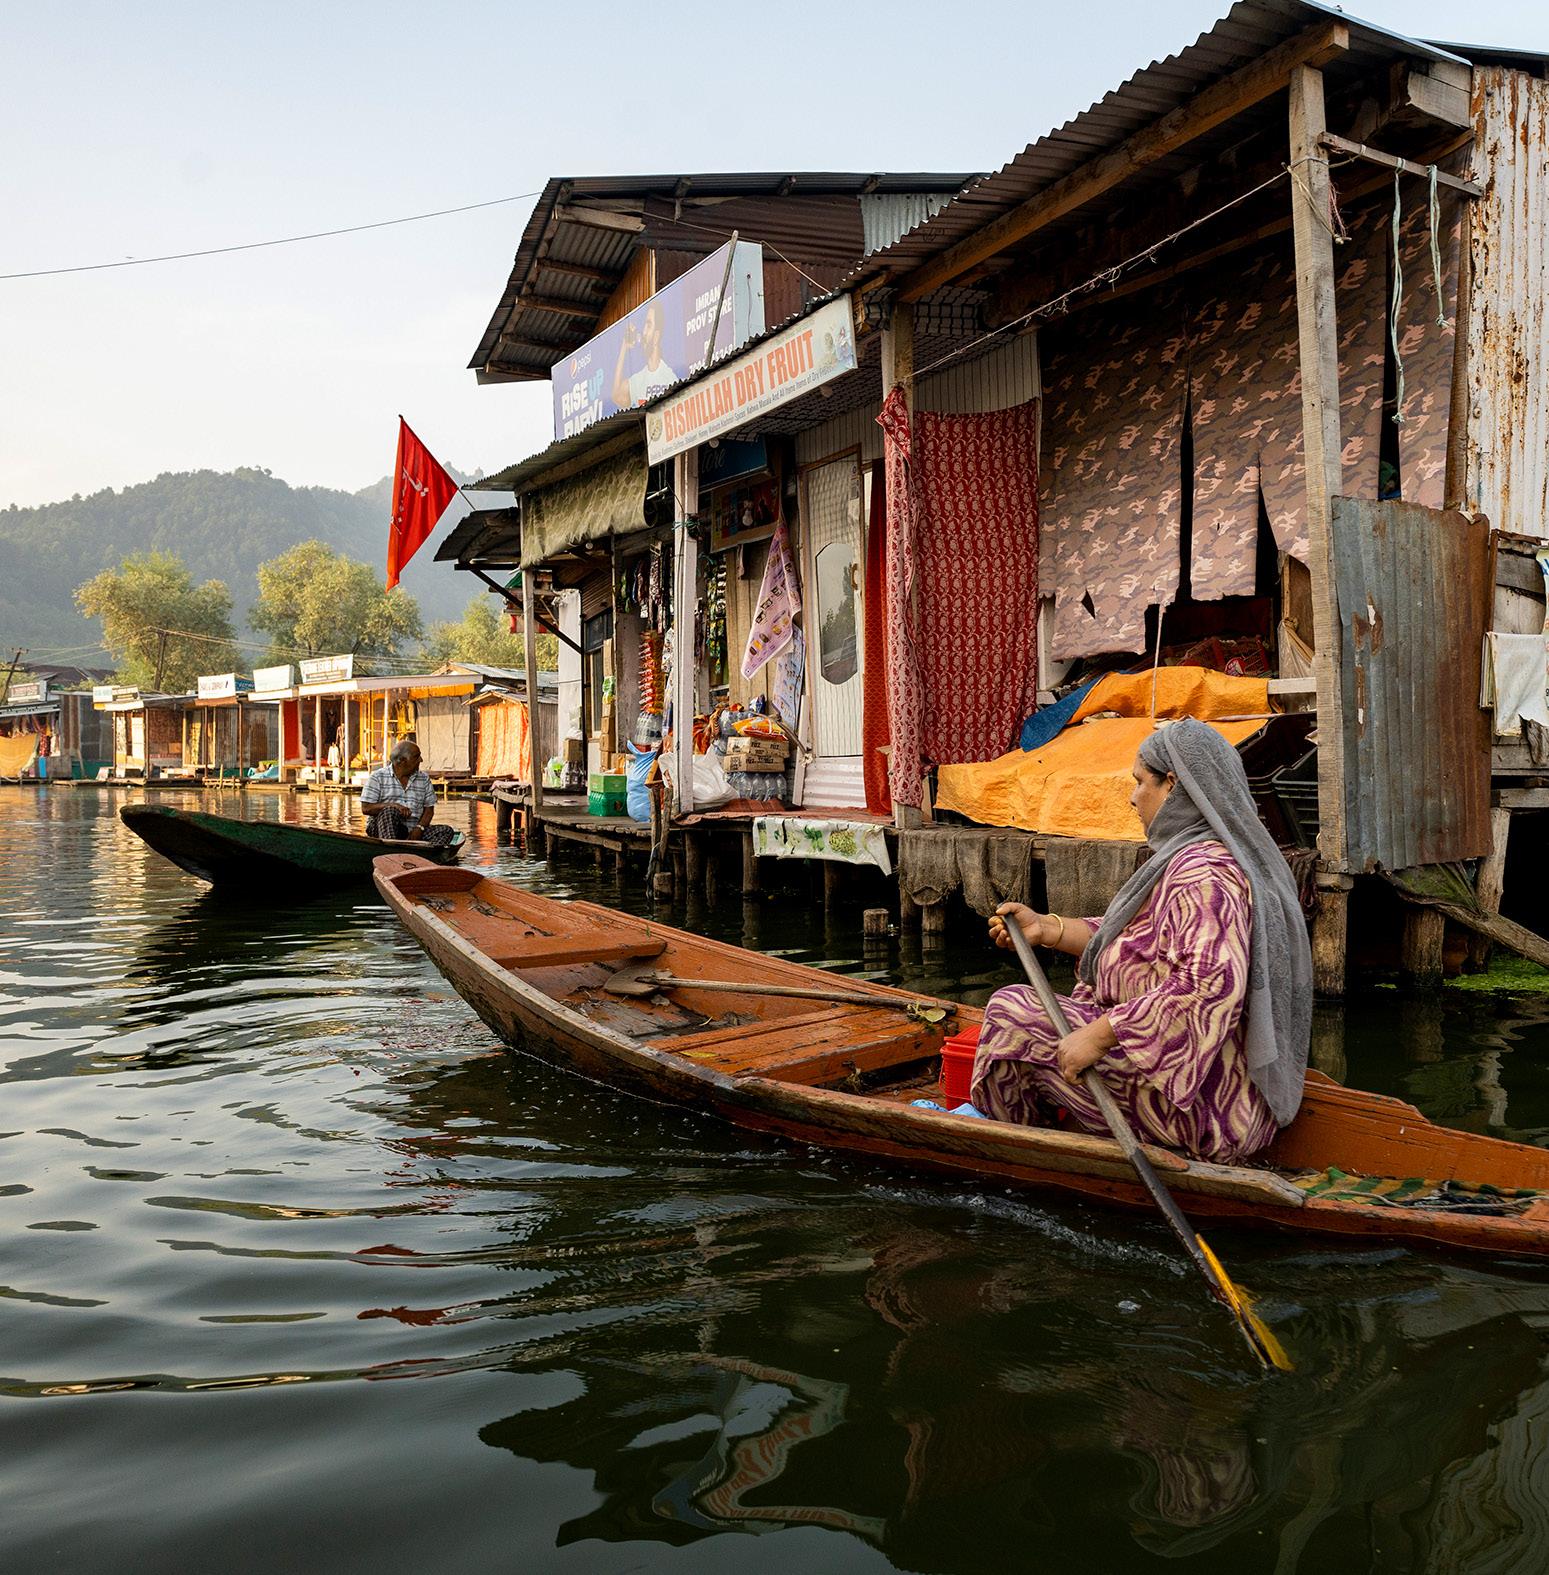
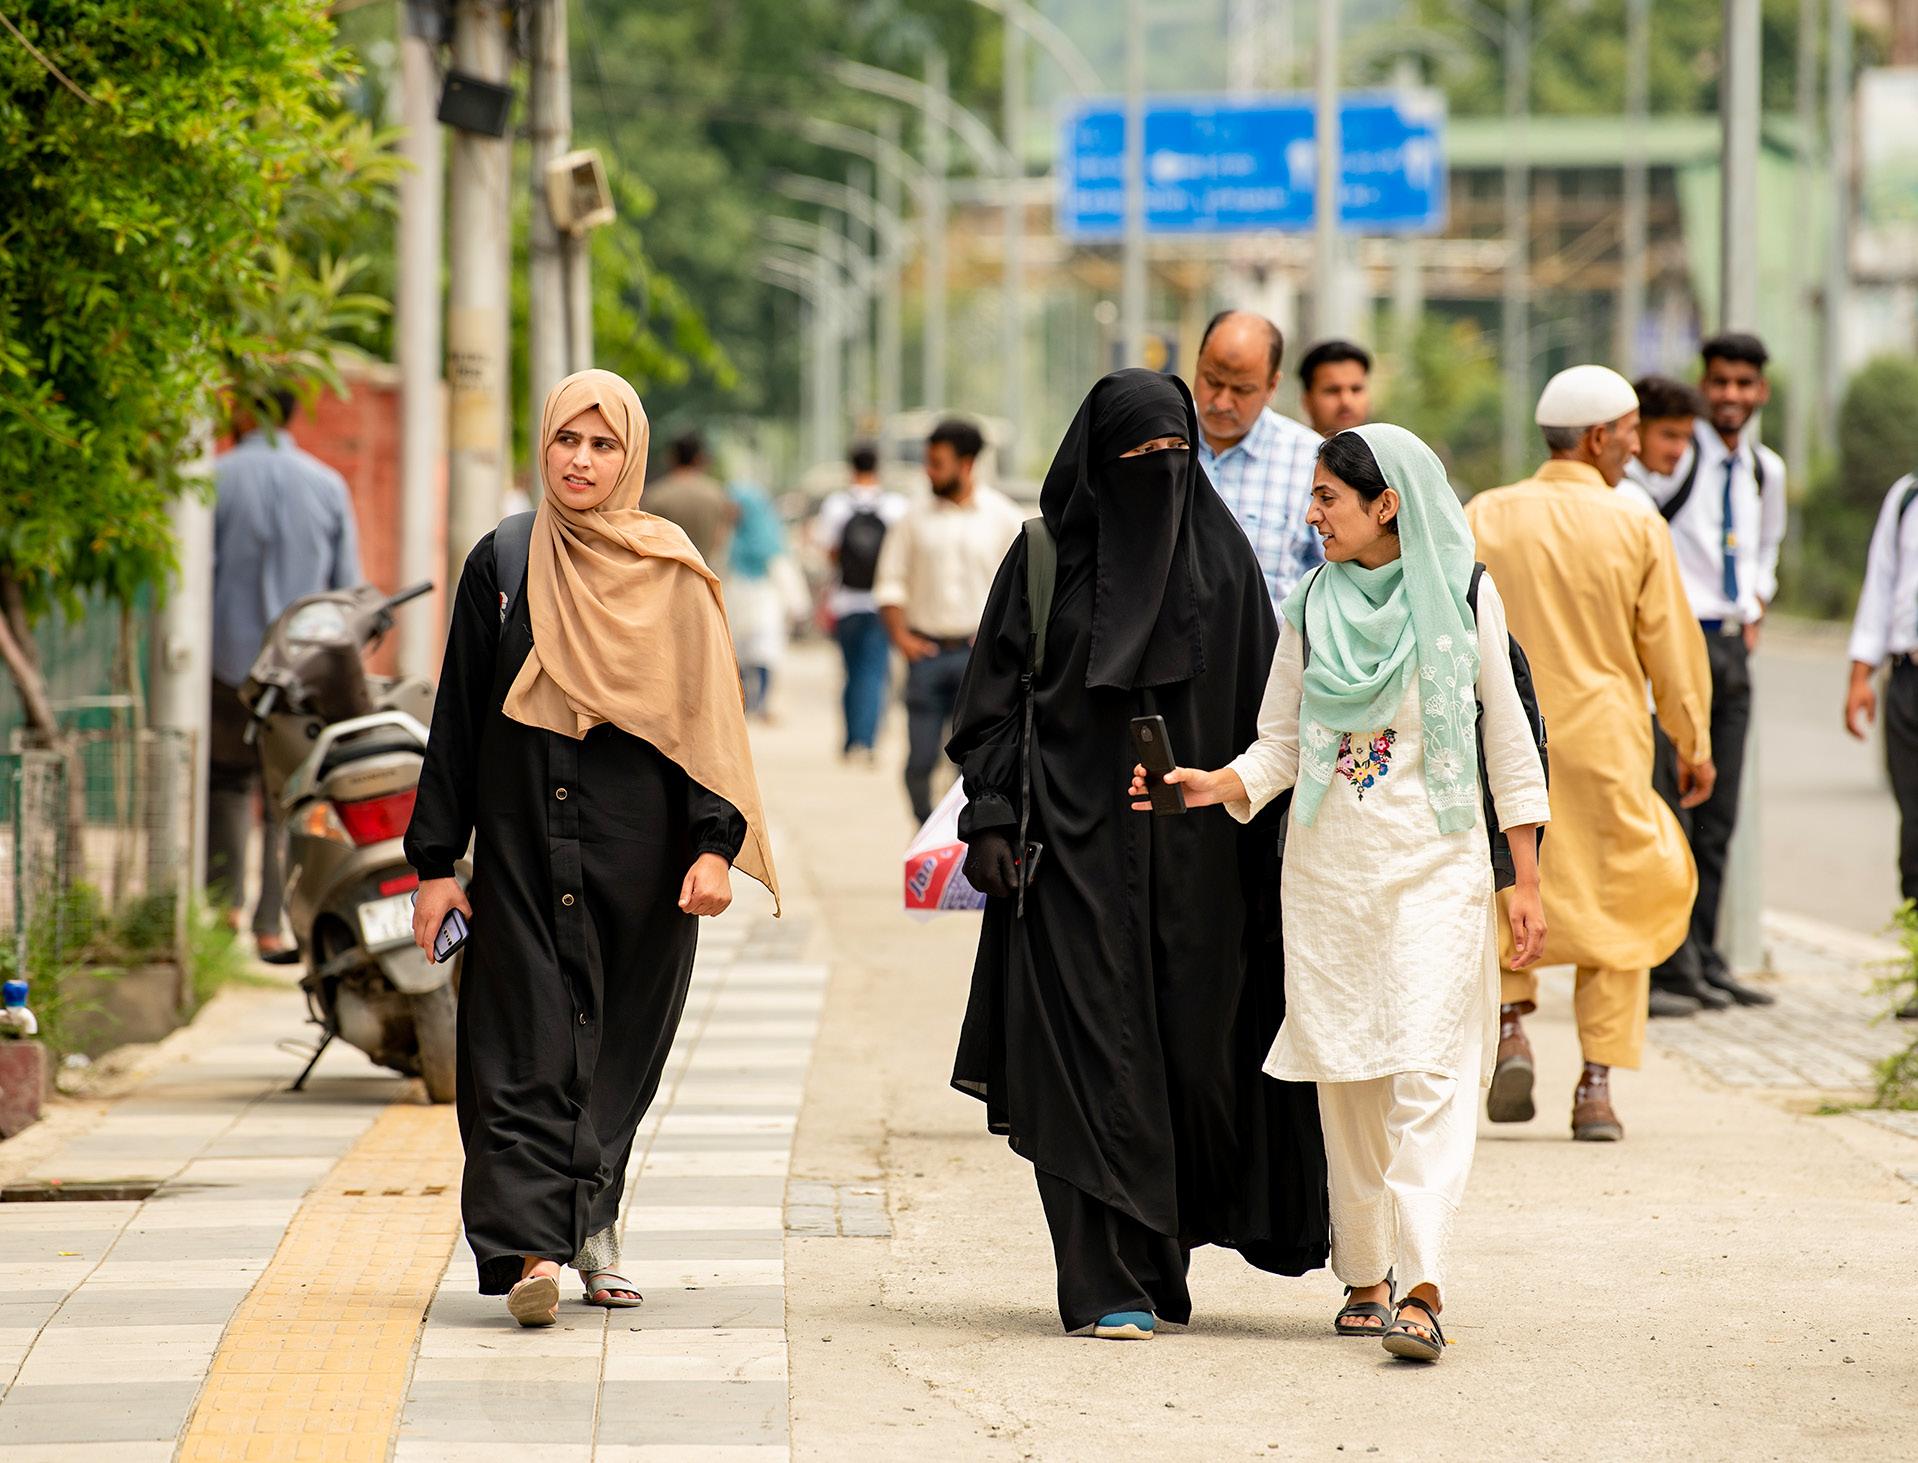
II Healthy Streets get more people walking, for longer
Street improvements directly and measurably shift how people move. Nearly 82% of visitors who used the street before improvements now walk more frequently. Critically, this is not simply a retention effect: 69% of entirely new visitors to these streets also walk more, confirming that Healthy Streets both deepen walking behaviour among existing users and attract a new pedestrian base that would not otherwise have been walking.
The effect on dwell time is equally significant. People spend an average of 89 minutes on a Healthy Street, with Bhubaneswar (165 mins), Gangtok (162 mins), and Coimbatore (143 mins) recording the highest figures. Streets where commercial businesses thrive, and allied pedestrian infrastructure such as seating, shade and amenity provision exists, convert transit corridors into staying environments. The implication for urban policy is direct: pedestrian infrastructure investment reliably produces walking behaviour at scale, across city types, geographies, and income contexts.
of preimprovement visitors walking more frequently after Healthy Streets improvements.
Source: Perception surveys
*Map for representation purpose only
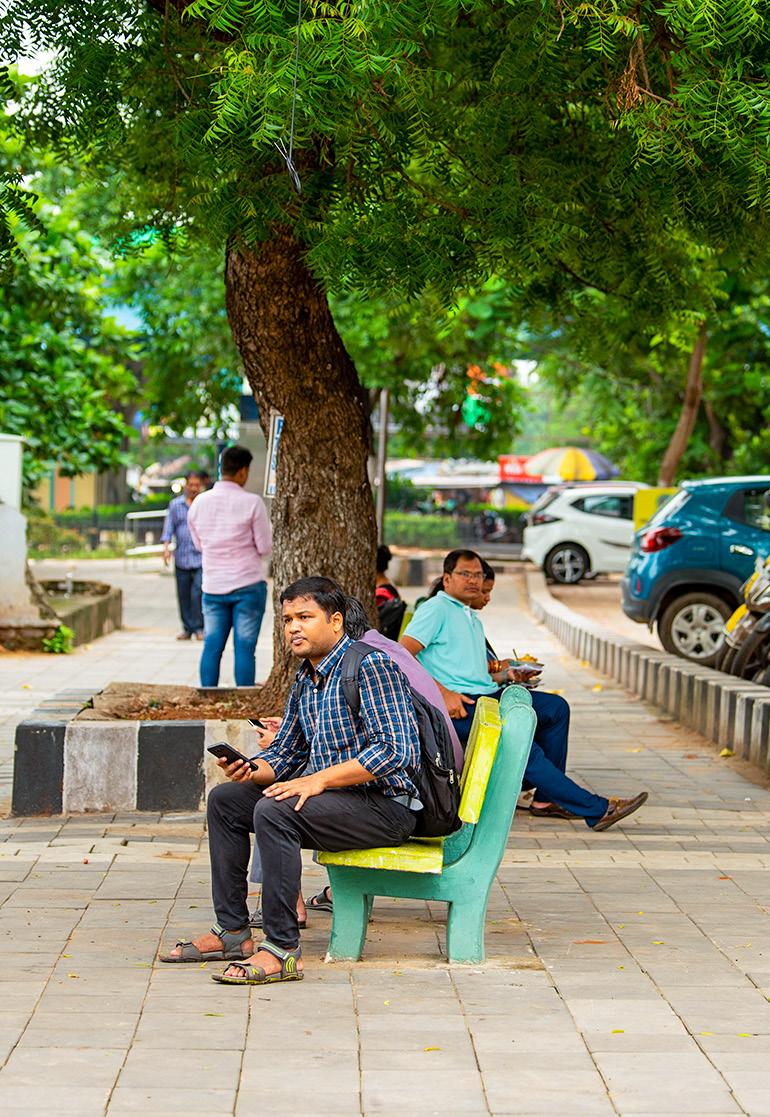
In addition, 43% of Healthy Streets shopkeepers have already started walking or cycling to work. If Unwalkable Streets streets were improved, shopkeepers on these streets project NMT usage would rise from 30% to 42%. The shift towards NMT is stronger among pre-improvement shopkeepers (48%) than migrants (32%), implying that experiencing the transformation drives behaviour more than arriving at an alreadyimproved street.
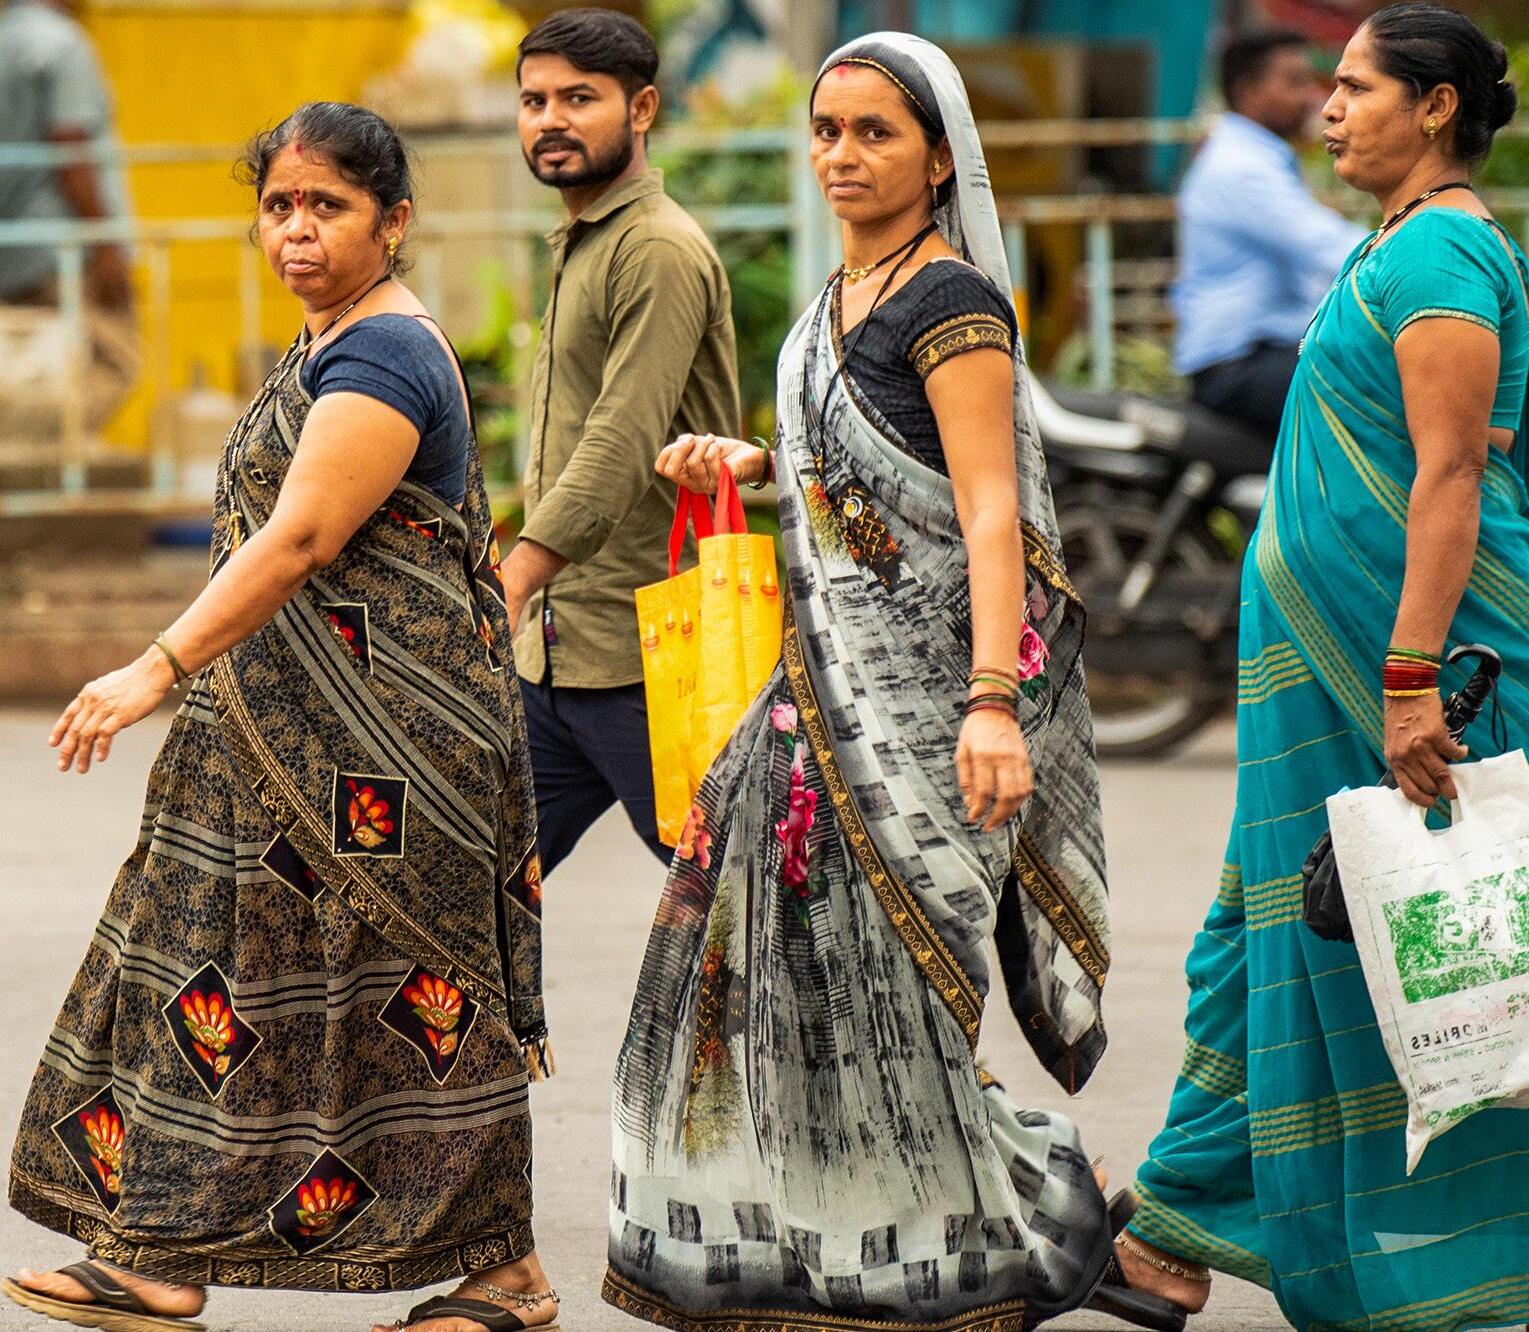
III Healthy Streets create positive user experience and drive social activity
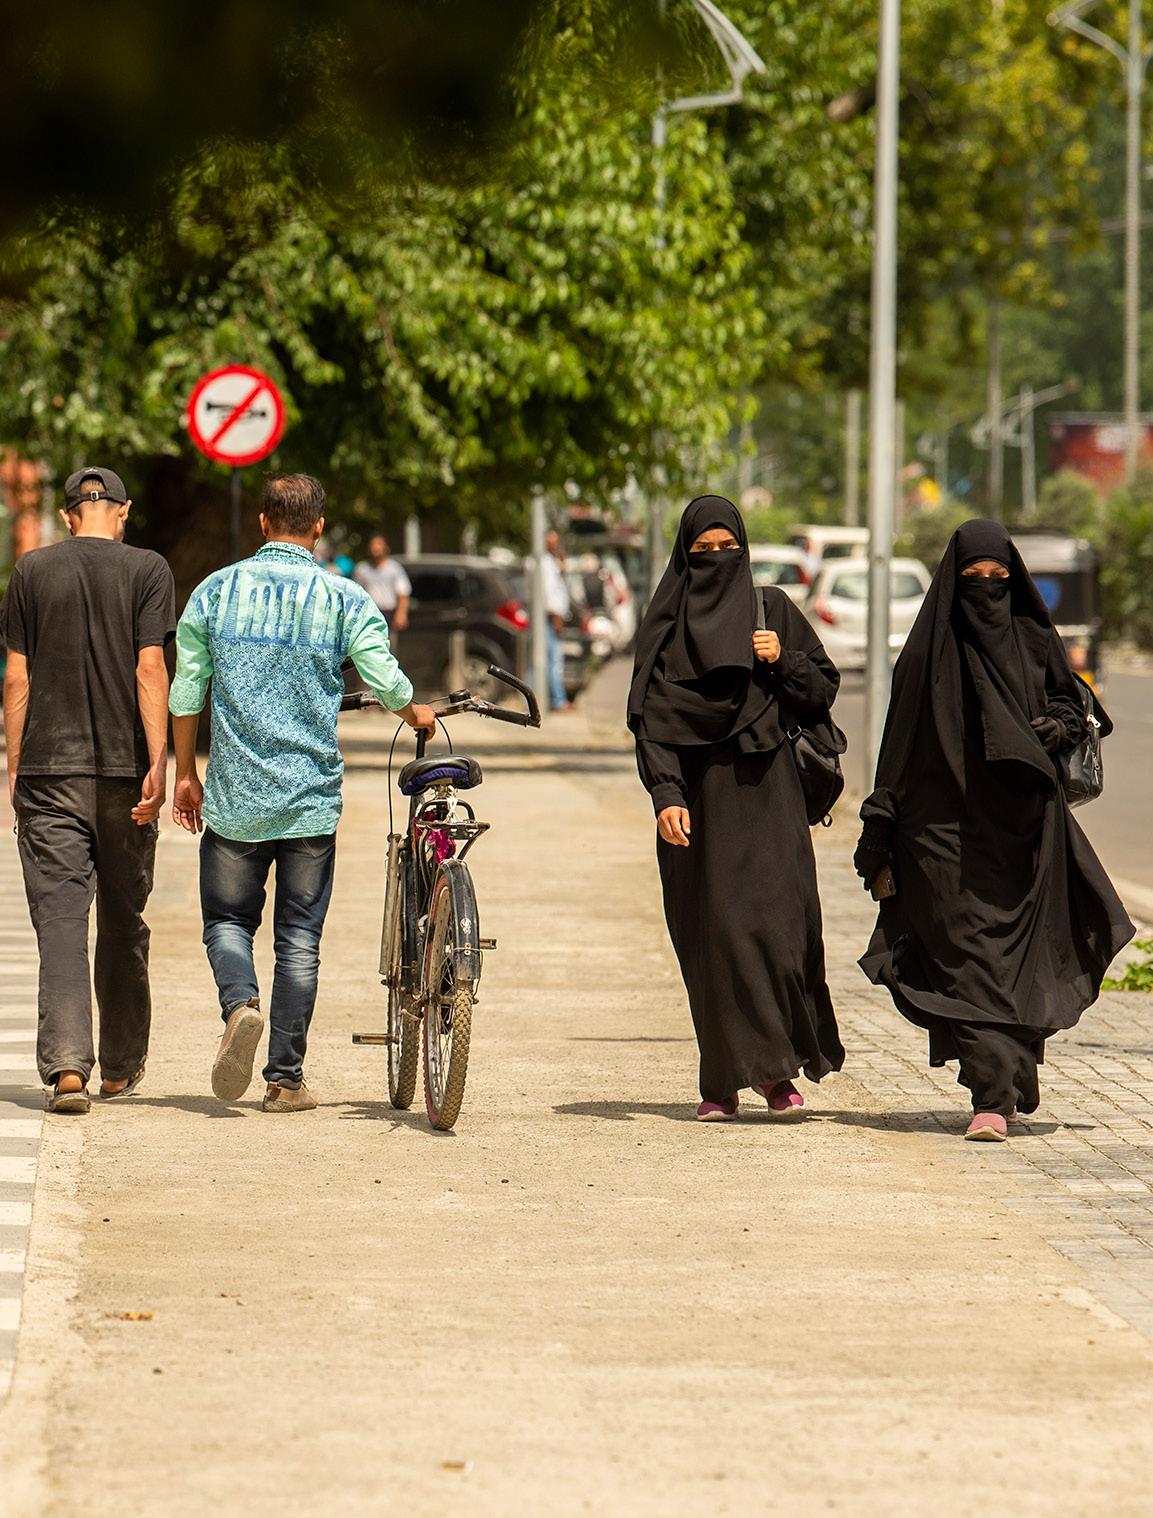
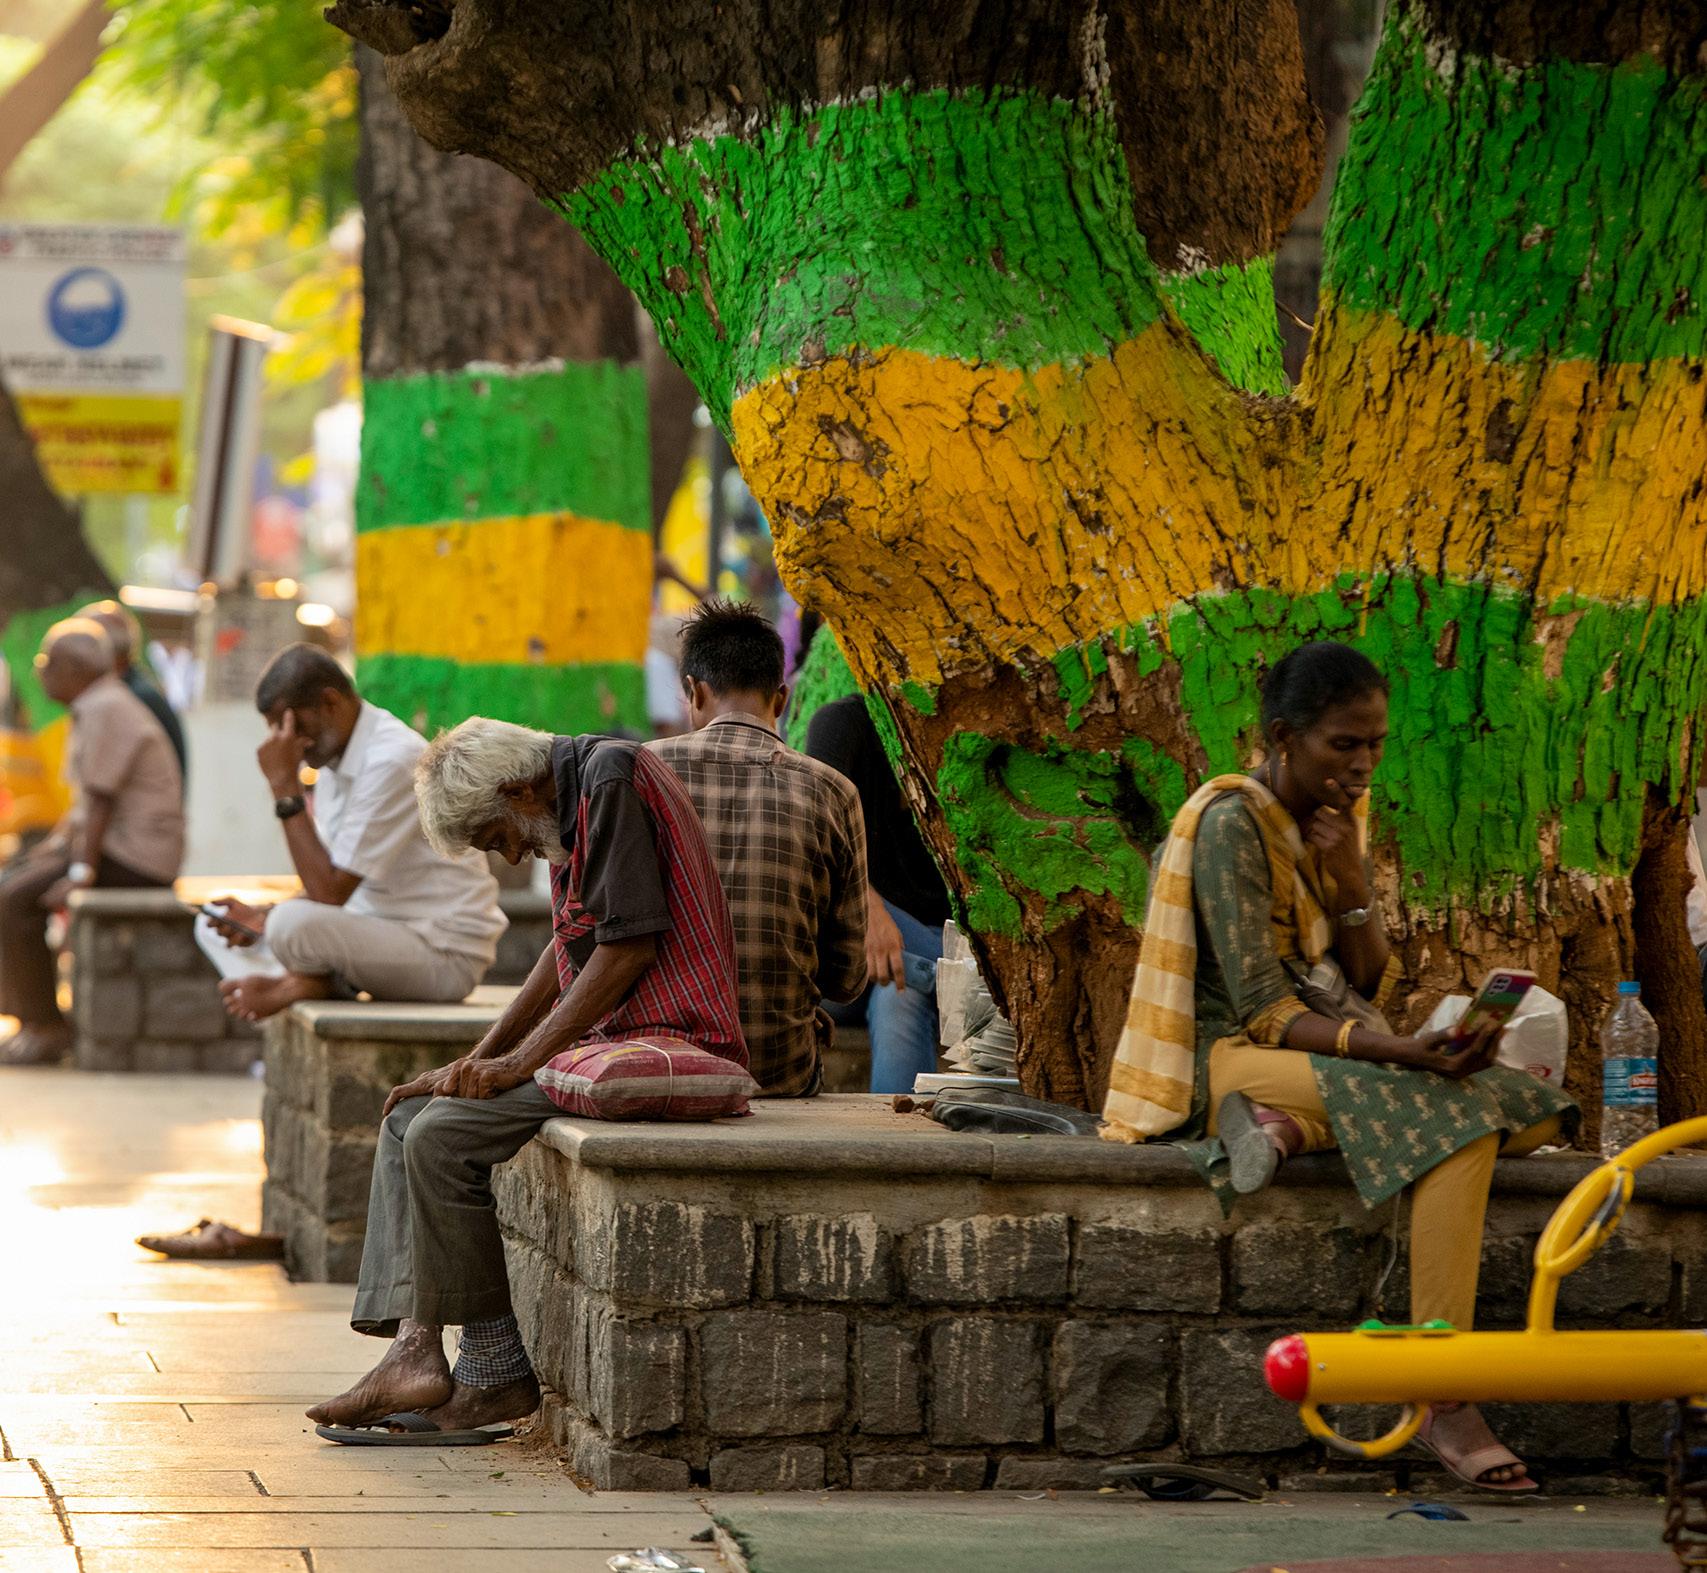
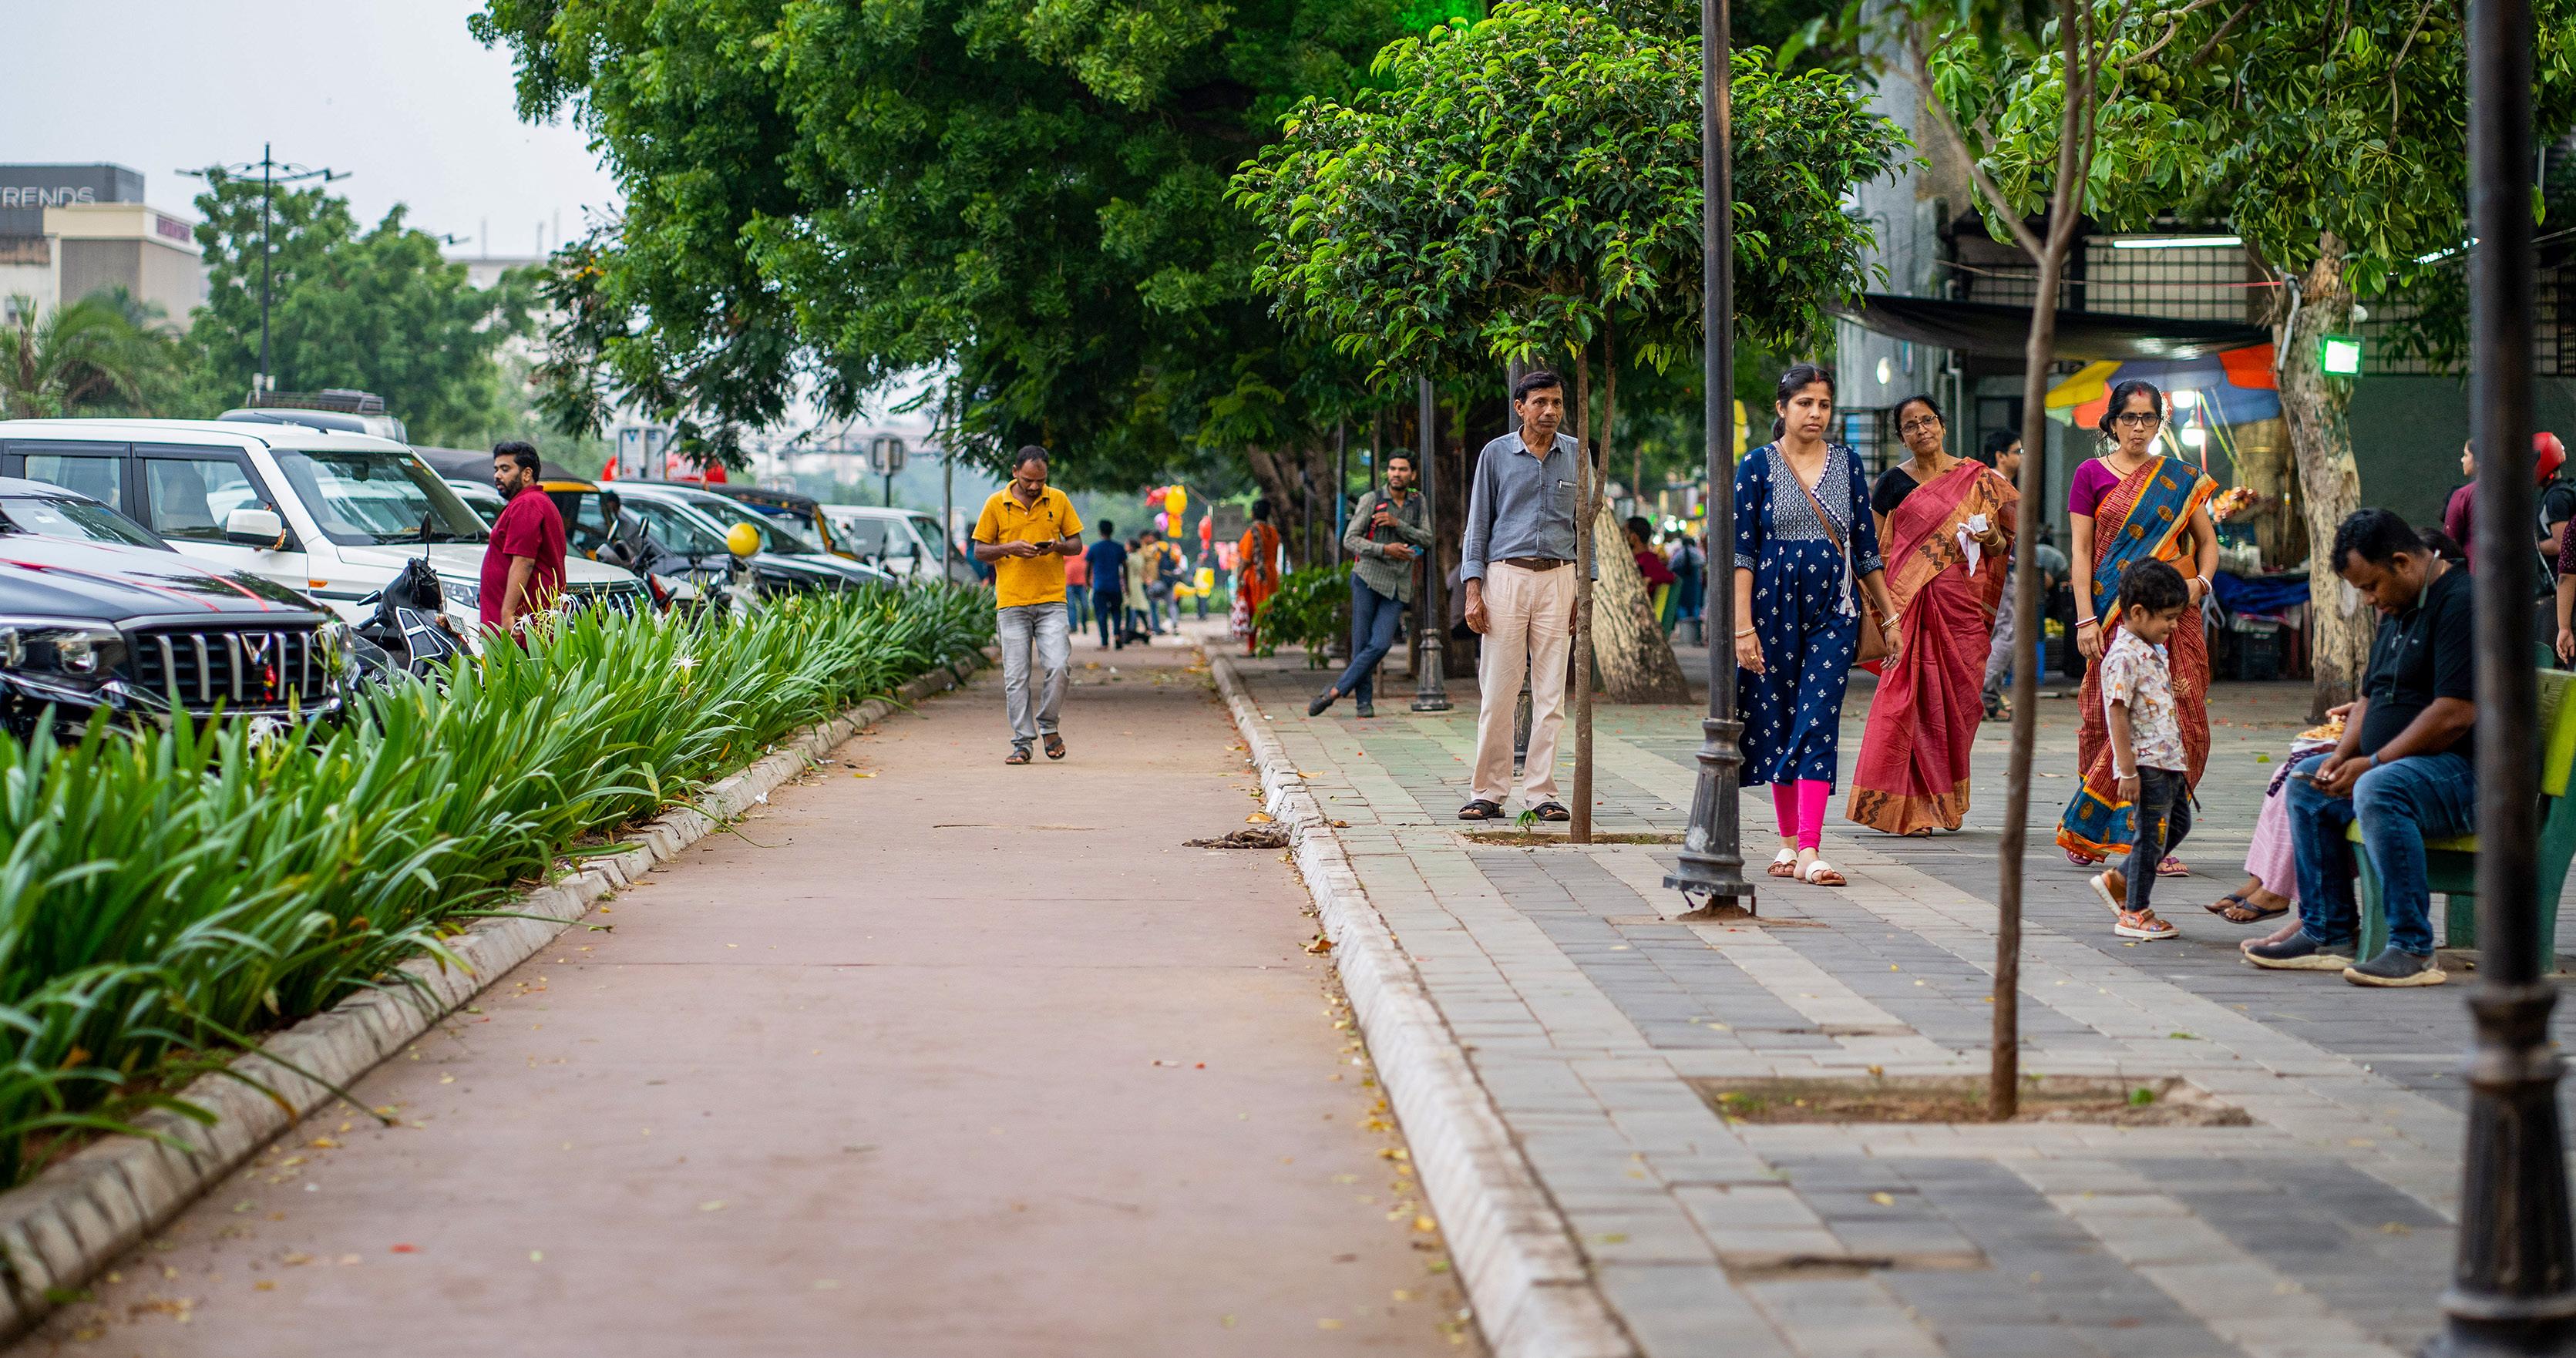
Healthy Streets transform into vibrant public spaces where people shop, socialise, and stay active. Since the improvements, the percentage of visitors has steadily increased, and the streets have become noticeably livelier for both shopping and social interactions.
Well-designed pedestrian lighting on Healthy Streets creates an inviting ambience that encourages evening activities and extends the active hours of the streets.
Footpaths emerged as the most valued street feature among respondents, followed by cleanliness and seating spaces. Female respondents showed relatively stronger preferences for pedestrian-oriented amenities such as footpaths, seating spaces, and public amenities, while male respondents reported slightly higher preference for parking management and public transport connectivity.
Safety indicators - Healthy Streets vs Unwalkable Streets
Overall Female Male
Footpath
Cleanliness
Seating Spaces
Safety (lighting, surveillance)
Greenery and Shade
Social Vibrancy (events, performances)
Barrier-free Accessible Design
Parking Management
Public Transport Connectivity Amenities (toilets, water)
Source: Perception surveys
Key findings from street user surveys:
of visitors who had experienced the street before improvements reported enjoying it more now.
described their overall experience as positive.
reported that noticeably more people visit the street since the upgrades.
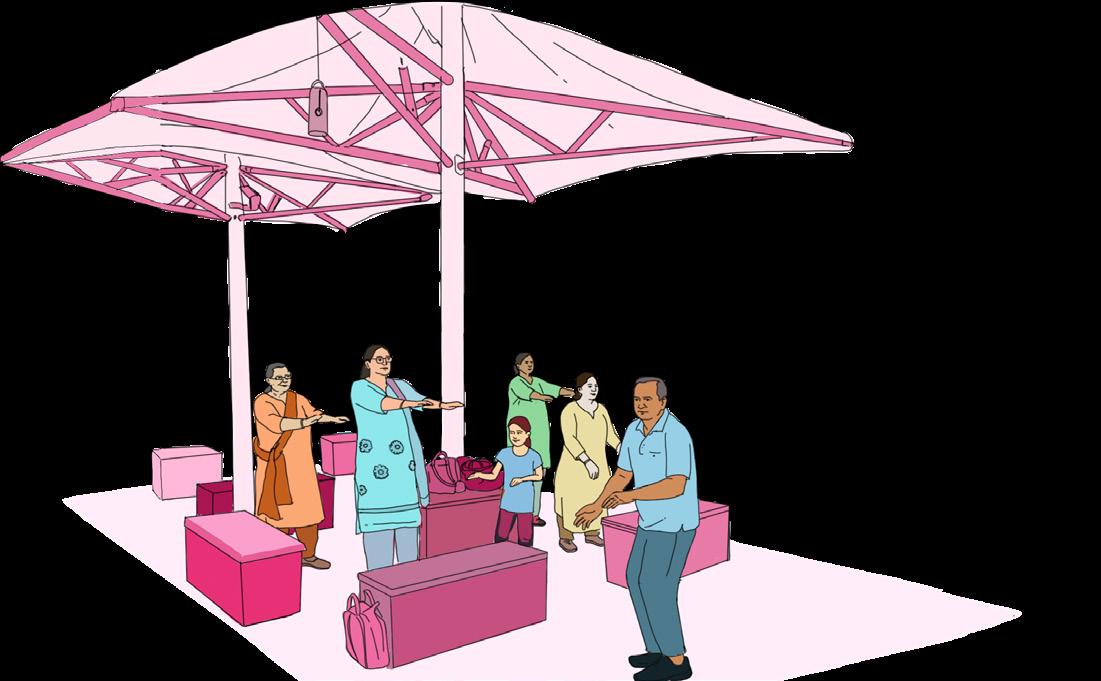

gatherings
RESPONDENTS
Family outings with children
234 RESPONDENTS
These figures show that Healthy Streets do more than support commerce— they rebuild community life, encourage physical activity, and create safer, more appealing public realms for all ages.
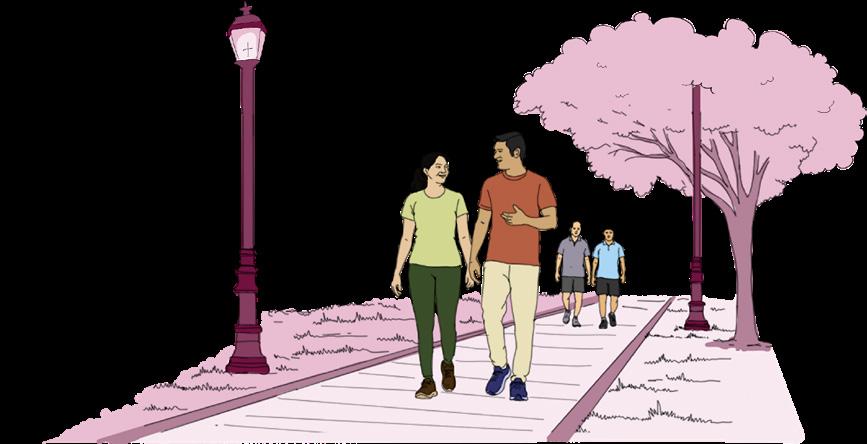
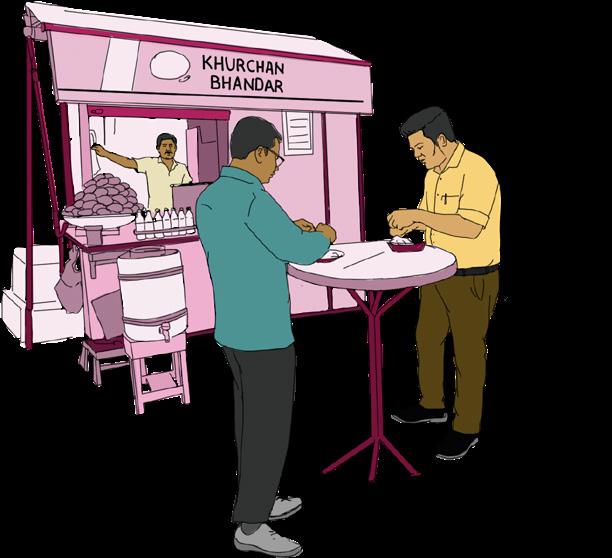
Extended eating or shopping
308 RESPONDENTS
Morning or evening fitness walk
172 RESPONDENTS
IV Healthy Streets create safer environments for women and children
Across all 10 cities, Healthy Streets consistently deliver safer environments for every category of street user.
89% of women on Healthy Streets report feeling safe at night, compared to only 66% on Unwalkable Streets which is a substantial 23 percentage point improvement in perceived safety.
Children were observed cycling and playing in their designated zones on Healthy Streets. This separation from motor vehicle lanes significantly reduces the risk of conflict with traffic.
These findings show that well-designed streets not only feel safer but also actively protect vulnerable users, encourage active mobility, and build public confidence, especially among women and children.

Safety indicators - Healthy Streets vs Unwalkable Streets
Source: Perception surveys
The perception of safety was evaluated using four lenses: feeling secure from crime, safety at night, overall positive experience and respondents’ willingness to let children above 8 years of age to walk independently on the street.
Healthy Streets show a consistent average safety advantage of approximately 26 percentage points (pp) over Unwalkable Streets.
Key design features on Healthy Streets, such as improved street lighting, wider footpaths, organised parking, and active street fronts directly contribute to perceived safety. These benefits are especially pronounced for women.
Willingness to allow children above 8 years to walk independently on the streets
Heathy Streets Unwalkable Streets
Reversal of gender safety patterns: On Healthy Streets, women report feeling more secure from crime than men: 94% of women vs. 92% of men.
Behavioural impact: Volume count data reinforces these findings: 1.5 times more women walk on Healthy Streets (532 women) compared to Unwalkable Streets (358 women).
Well designed streets not only improve perceived safety for all but also close and even reverse the gender gap in security, encouraging more women to walk and use public spaces.
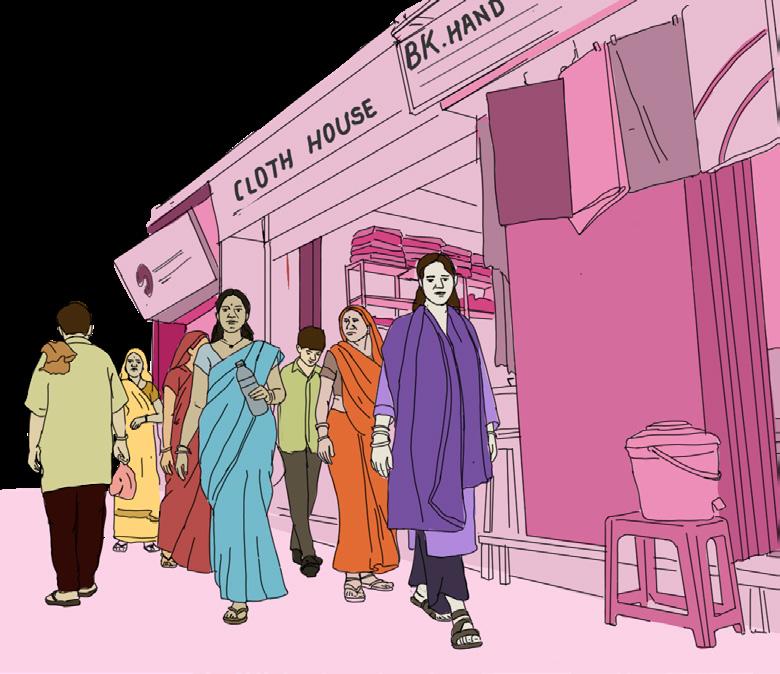
Source: Perception surveys
Pimpri Chinchwad
Kochi
Bengaluru
Gurugram
Ahmedabad
Chennai
Coimbatore
Bhubaneswar
Healthy Streets Unwalkable Streets
CHILD SAFETY GAP OVERALL SAFETY EXPERIENCE GAP
(Healthy Streets vs Unwalkable Streets)
+25 pp
(Healthy Streets vs Unwalkable Streets)
+20 pp
Source: Perception surveys
FEWER GOODS VEHICLES ON HEALTHY STREETS DURING PEAK HOURS
(Healthy Streets vs Unwalkable Streets)
Streets where children are safe automatically draw in more families. As more families come in, the dwell time and spending increases, creating better business for vendors and shopkeepers.
As the data indicates, Healthy Streets clearly influence the way people use and experience public space. Ultimately, the increased footfall, more social activity and improved safety benefits multiple stakeholders: businesses, residents and visitors.
Increased footfall, higher levels of social activity, and improved perceptions of safety are all indicators of streets that work better for people.
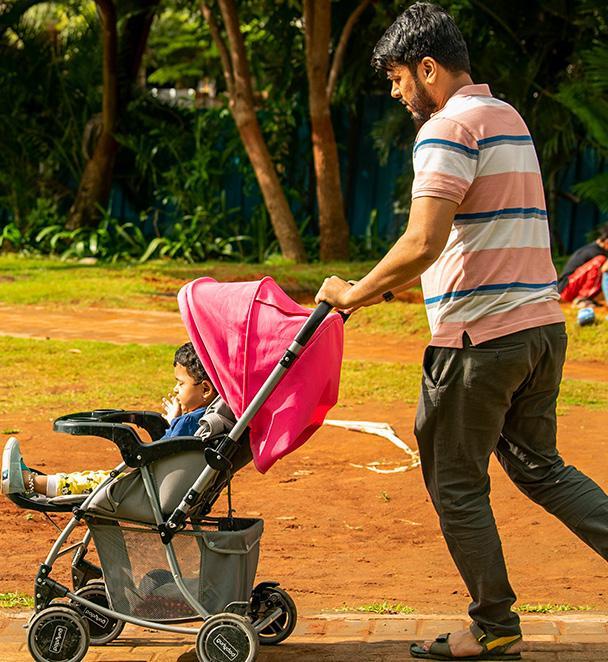
V Healthy Streets inspire civic pride and collective maintenance
Healthy Streets do more than improve physical infrastructure, they foster a sense of collective responsibility among local businesses.
38% of shopkeepers on Healthy Streets participate in community maintenance initiatives (such as cleaning, waste management, or planting).
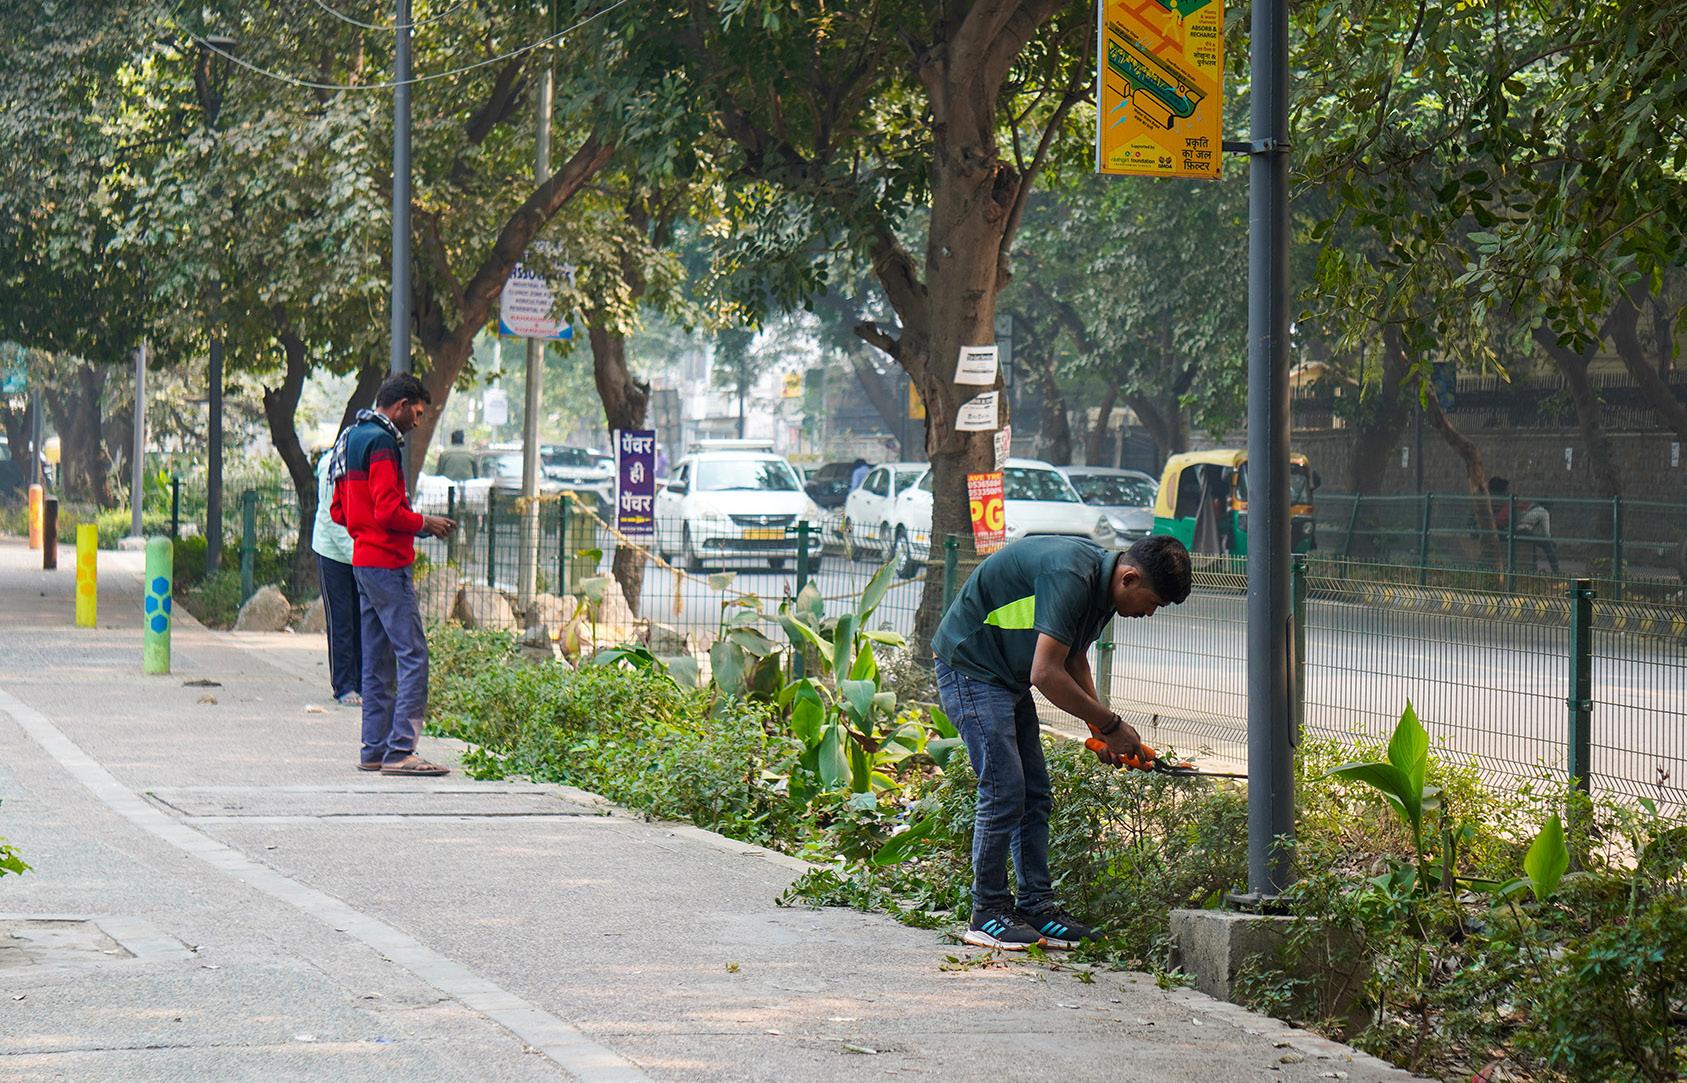
In contrast, only 10% of shopkeepers on Unwalkable Streets engage in similar activities.
This nearly four-fold increase signals a profound shift in civic ownership and social cohesion. When streets are well designed and well maintained, shopkeepers take pride in their surroundings and actively contribute to keeping them clean, safe, and inviting. This volunteer participation is both an outcome of successful street transformation and a driver of long term sustainability.
VI Healthy Streets reduce road crashes through traffic calming and safer speeds
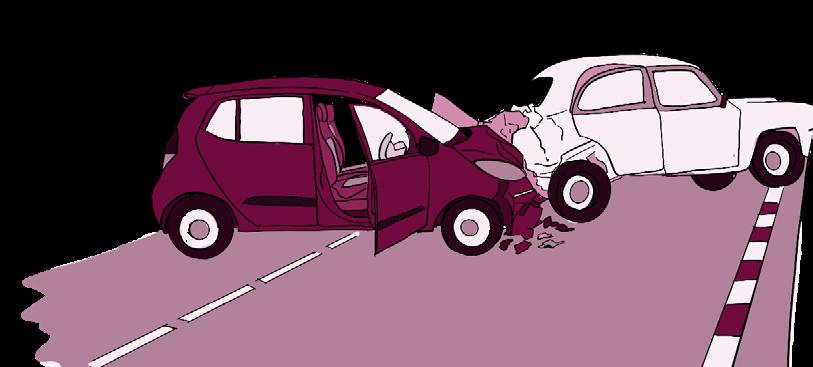
Healthy Streets perform well in managing vehicular speed. Strategic traffic calming measures such as lane diet, table-top crossings, and cobblestone treatment encourage safe
In
2023, 68% of fatalities on Indian roads were attributed to speeding, according to the Ministry of Road Transport and Highways (MoRTH).
Data from cities such as Pimpri Chinchwad and Gurugram that have actively considered traffic calming measures as part of their Heathy Street design interventions show a positive shift towards safer speed. Even a 1km/h reduction in mean speed reduces the risk of a pedestrian fatal crash by ~10%.
Vehicle speeds on Healthy Streets traffic calmed by table-top crossings
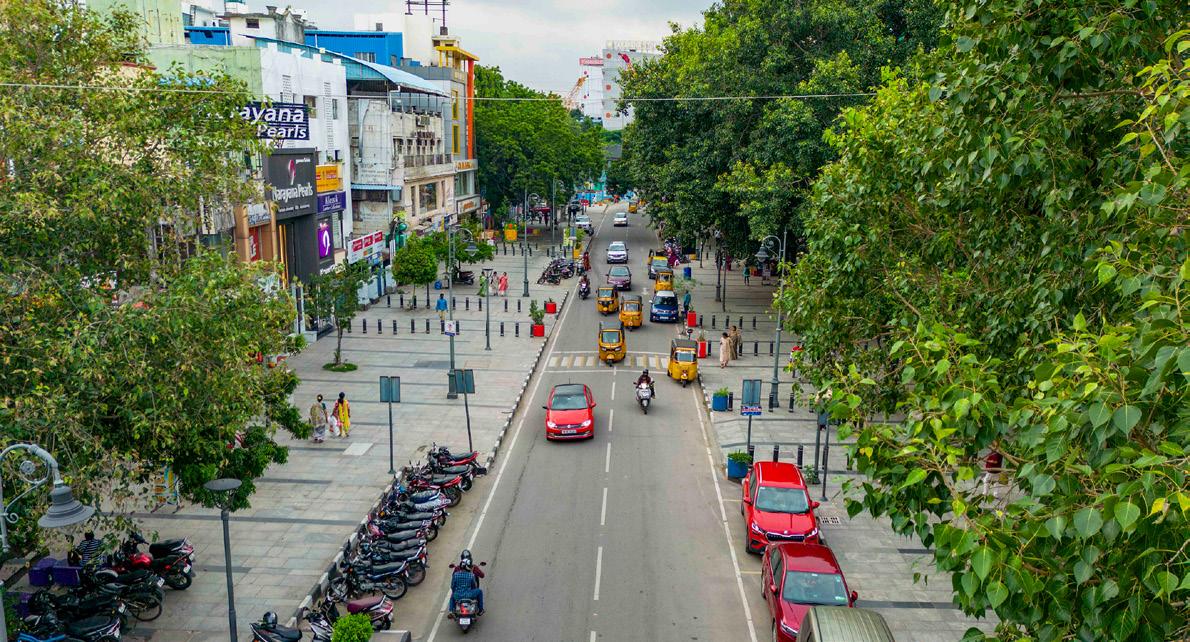
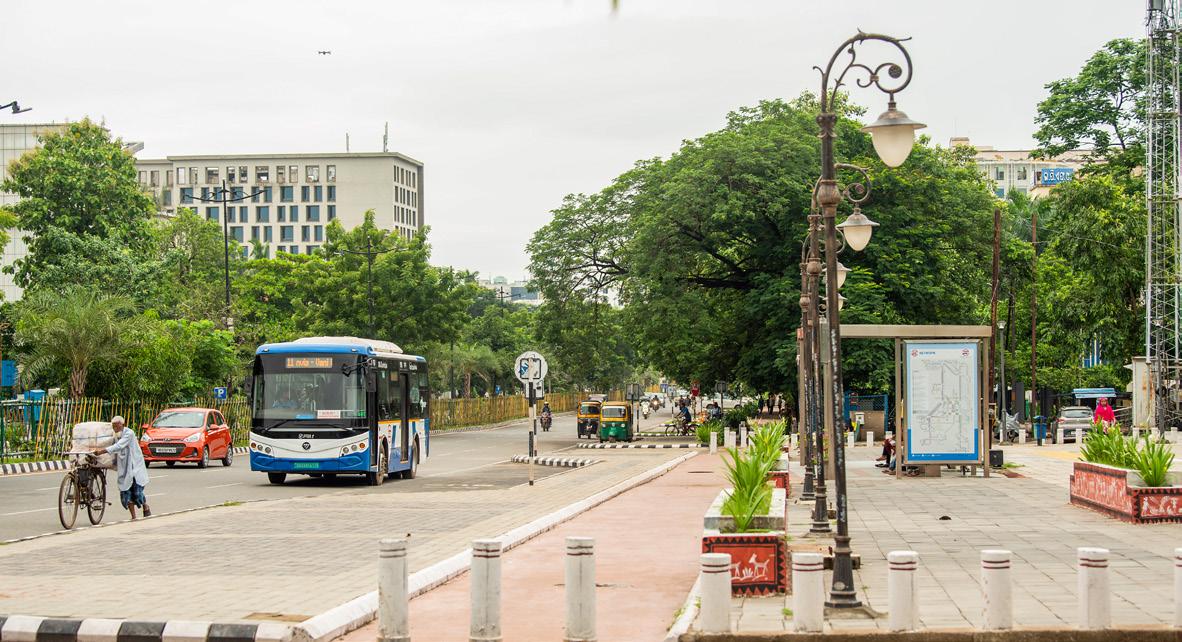
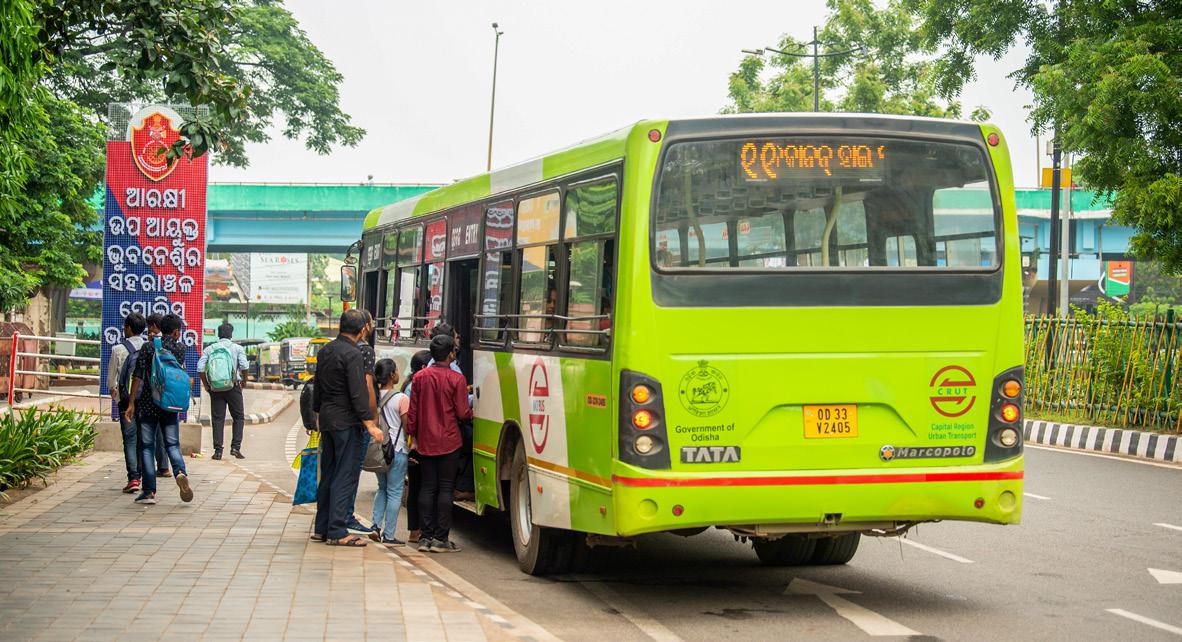
The findings from traffic crash data further reiterates the safety benefits of Healthy Street interventions.
In Coimbatore, between 2021 and 2025, the total number of accidents in Mettupalayam road increased nearly fourfold from 28 to 110. This indicates a clear decline in road safety over time. While the Unwalkable Street recorded 25 fatalities in 2025, the Healthy Street saw only 4 fatalities, with zero fatalities reported from 2021 to 2024. This highlights the effectiveness of safer street design and traffic calming measures on Healthy Streets.
In Gurugram, Sub. Major Laxmichand Road before Healthy Street interventions, recorded three fatalities in 2018 and two fatalities in 2019. After improvements, zero fatalities have been reported for the past five years. Traffic calming measures including tabletop crossings, well painted road markings and enforcement measures such as Variable Message Signs (VMS) with real time speed displays along the Healthy Streets have encouraged safe speeds, reducing the likelihood of crashes and fatalities.
Across all 10 cities surveyed, Healthy Streets delivered a consistent 26 percentage point safety advantage, with women reporting feeling secure in the streets. The data showed that walking and usage of the street increased by 1.5x times among women, 2x among the elderly and 1.6x among children. These numbers represent a fundamental shift towards inclusive public spaces. When streets feel safe, people stay longer, interact more, and build community.
An important take-away is how shopkeepers’ participation in maintenance in Healthy Streets was nearly four times more than that in the Non-Healthy Streets: this signals a sense of civic ownership and collective pride. Thus, Healthy Streets help bring people together, creating active, inclusive and resilient urban environments where everyone benefits.
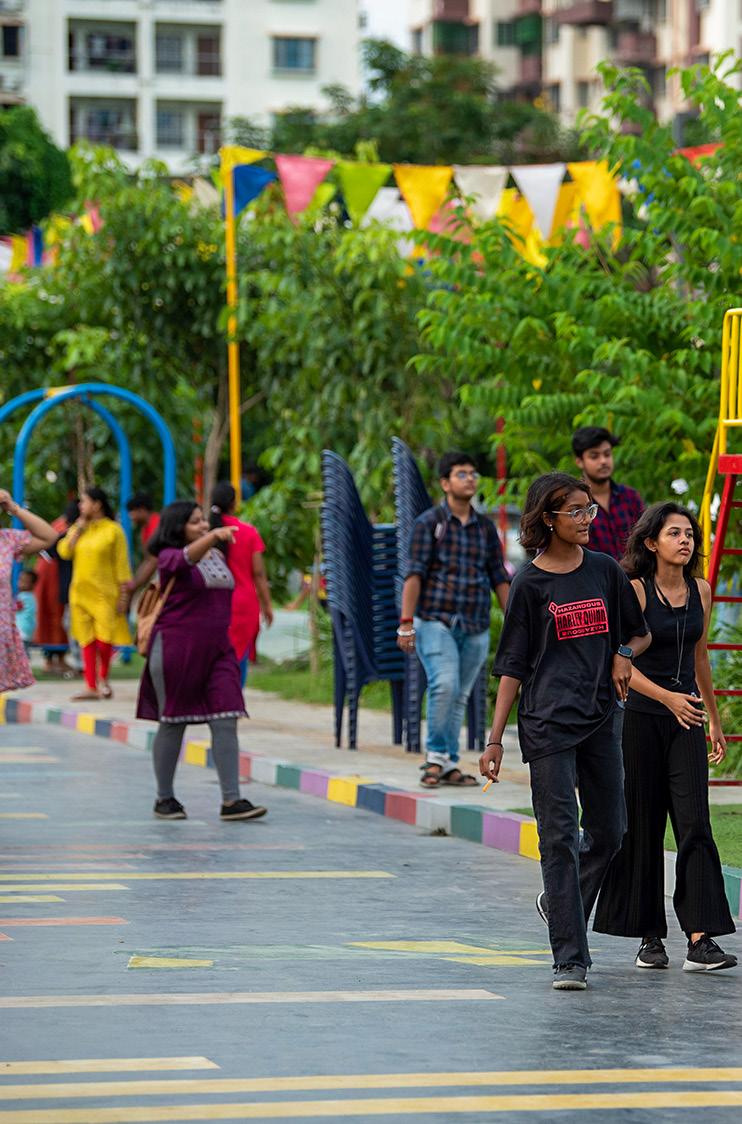
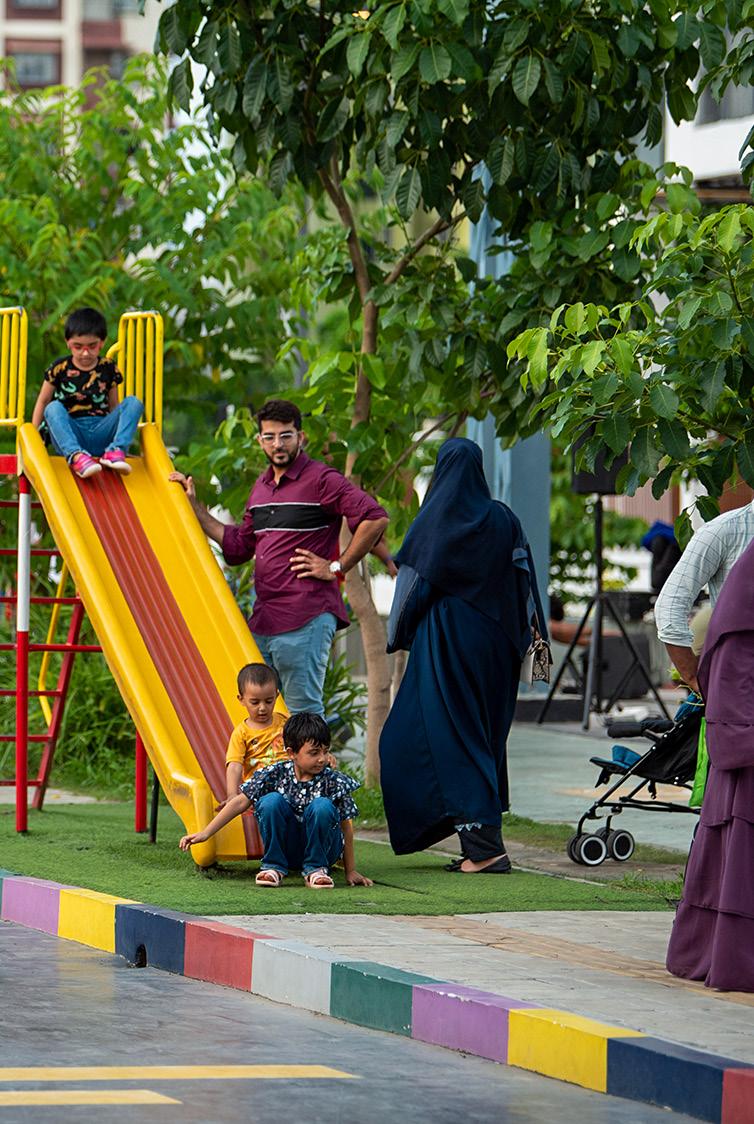
In short, Healthy Streets do more than move people. They bring people together, creating active, inclusive, and resilient urban environments where everyone belongs.
Healthy Streets attract more women, children, and the elderly
1.5× MORE WOMEN |
1.6× MORE CHILDREN |
2.1× MORE ELDERLY
Healthy Streets designed for people draw people who need them most: improving inclusivity, comfort, and accessibility, resulting in 36% more pedestrians and a balanced public space usage across age and gender groups.
Healthy Streets get more people walking, for longer
82% OF REGULAR VISITORS WALK MORE AFTER IMPROVEMENTS
Healthy Streets significantly increase walking frequency and dwell time. Mean dwell time reaches 89 minutes.
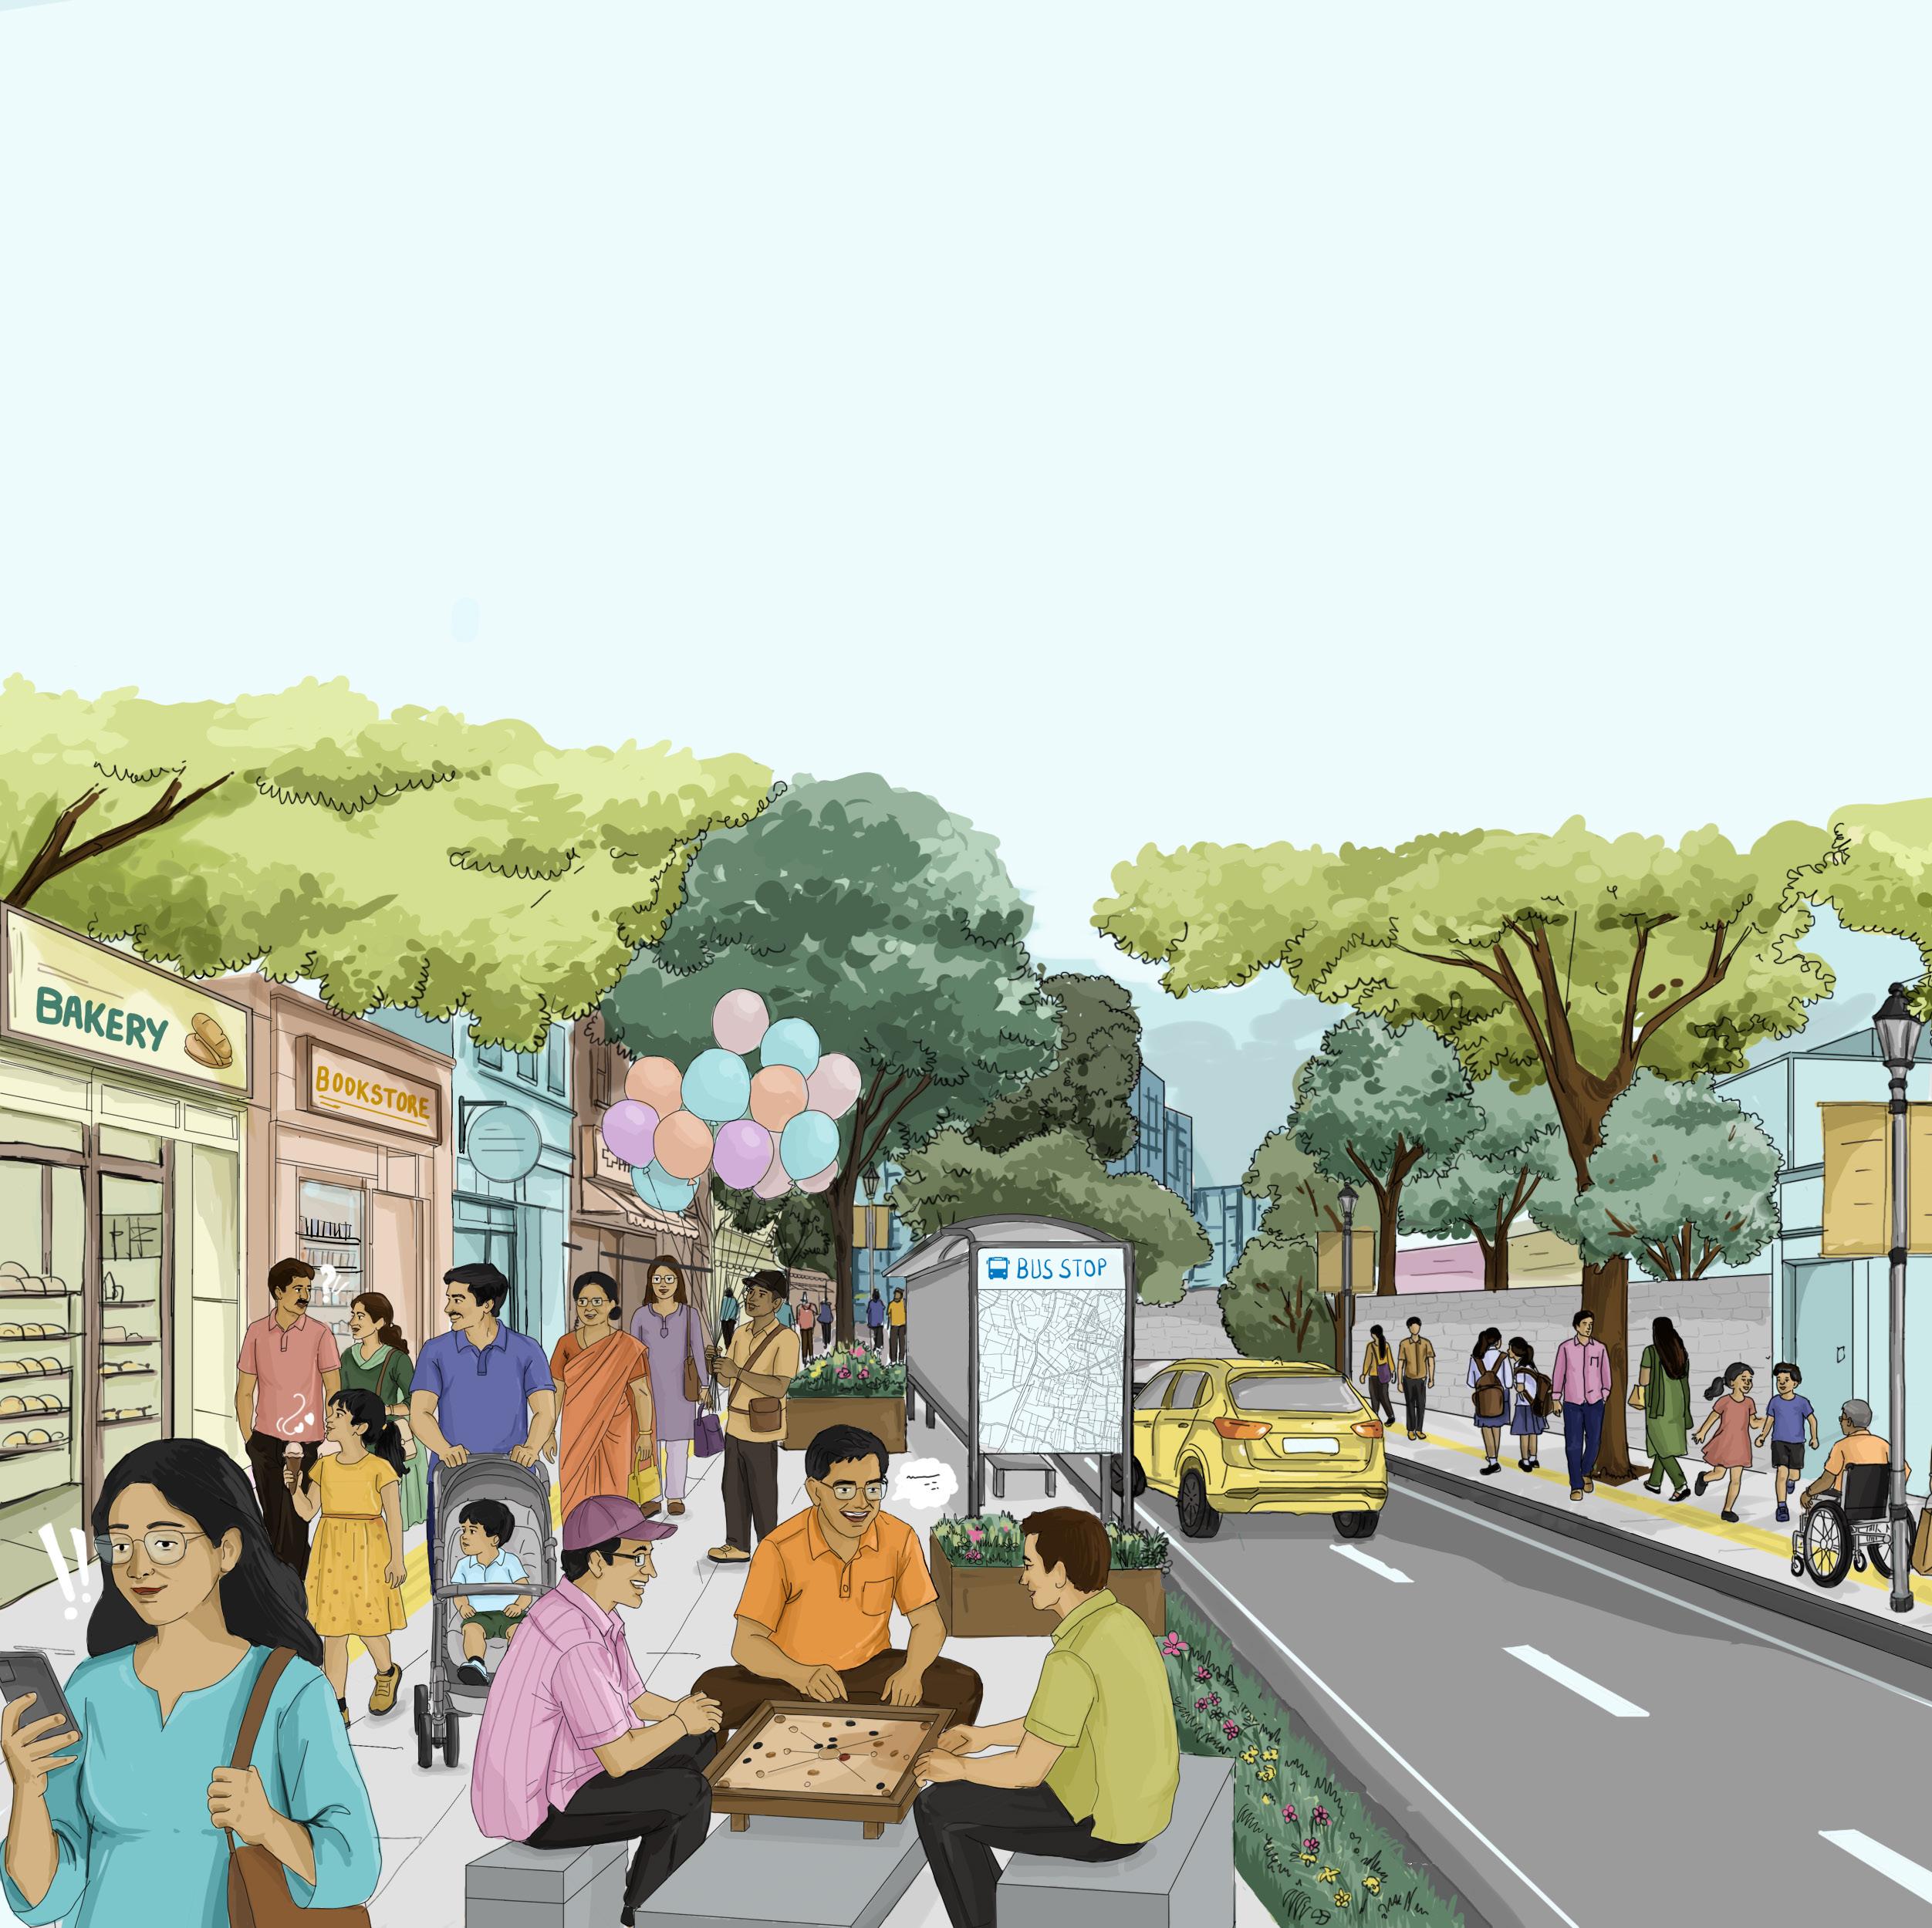
Healthy Streets create positive user experience and drive social activity
92% OF USERS REPORT POSITIVE OVERALL EXPERIENCE | 89% ENJOY THE STREET MORE NOW
Footpaths are the most valued street feature (58%), followed by cleanliness (47%) and seating (43%). Healthy Streets generate new social behaviour: gatherings, fitness walks, and family outings that did not exist before.
Healthy Streets create safer environments for women and children
89% WOMEN AND 62% CHILDREN FEEL SAFER ON HEALTHY STREETS
1.5× more women walk on Healthy Streets. Better lighting, active frontages, traffic calming, and organised street design create safer environments.
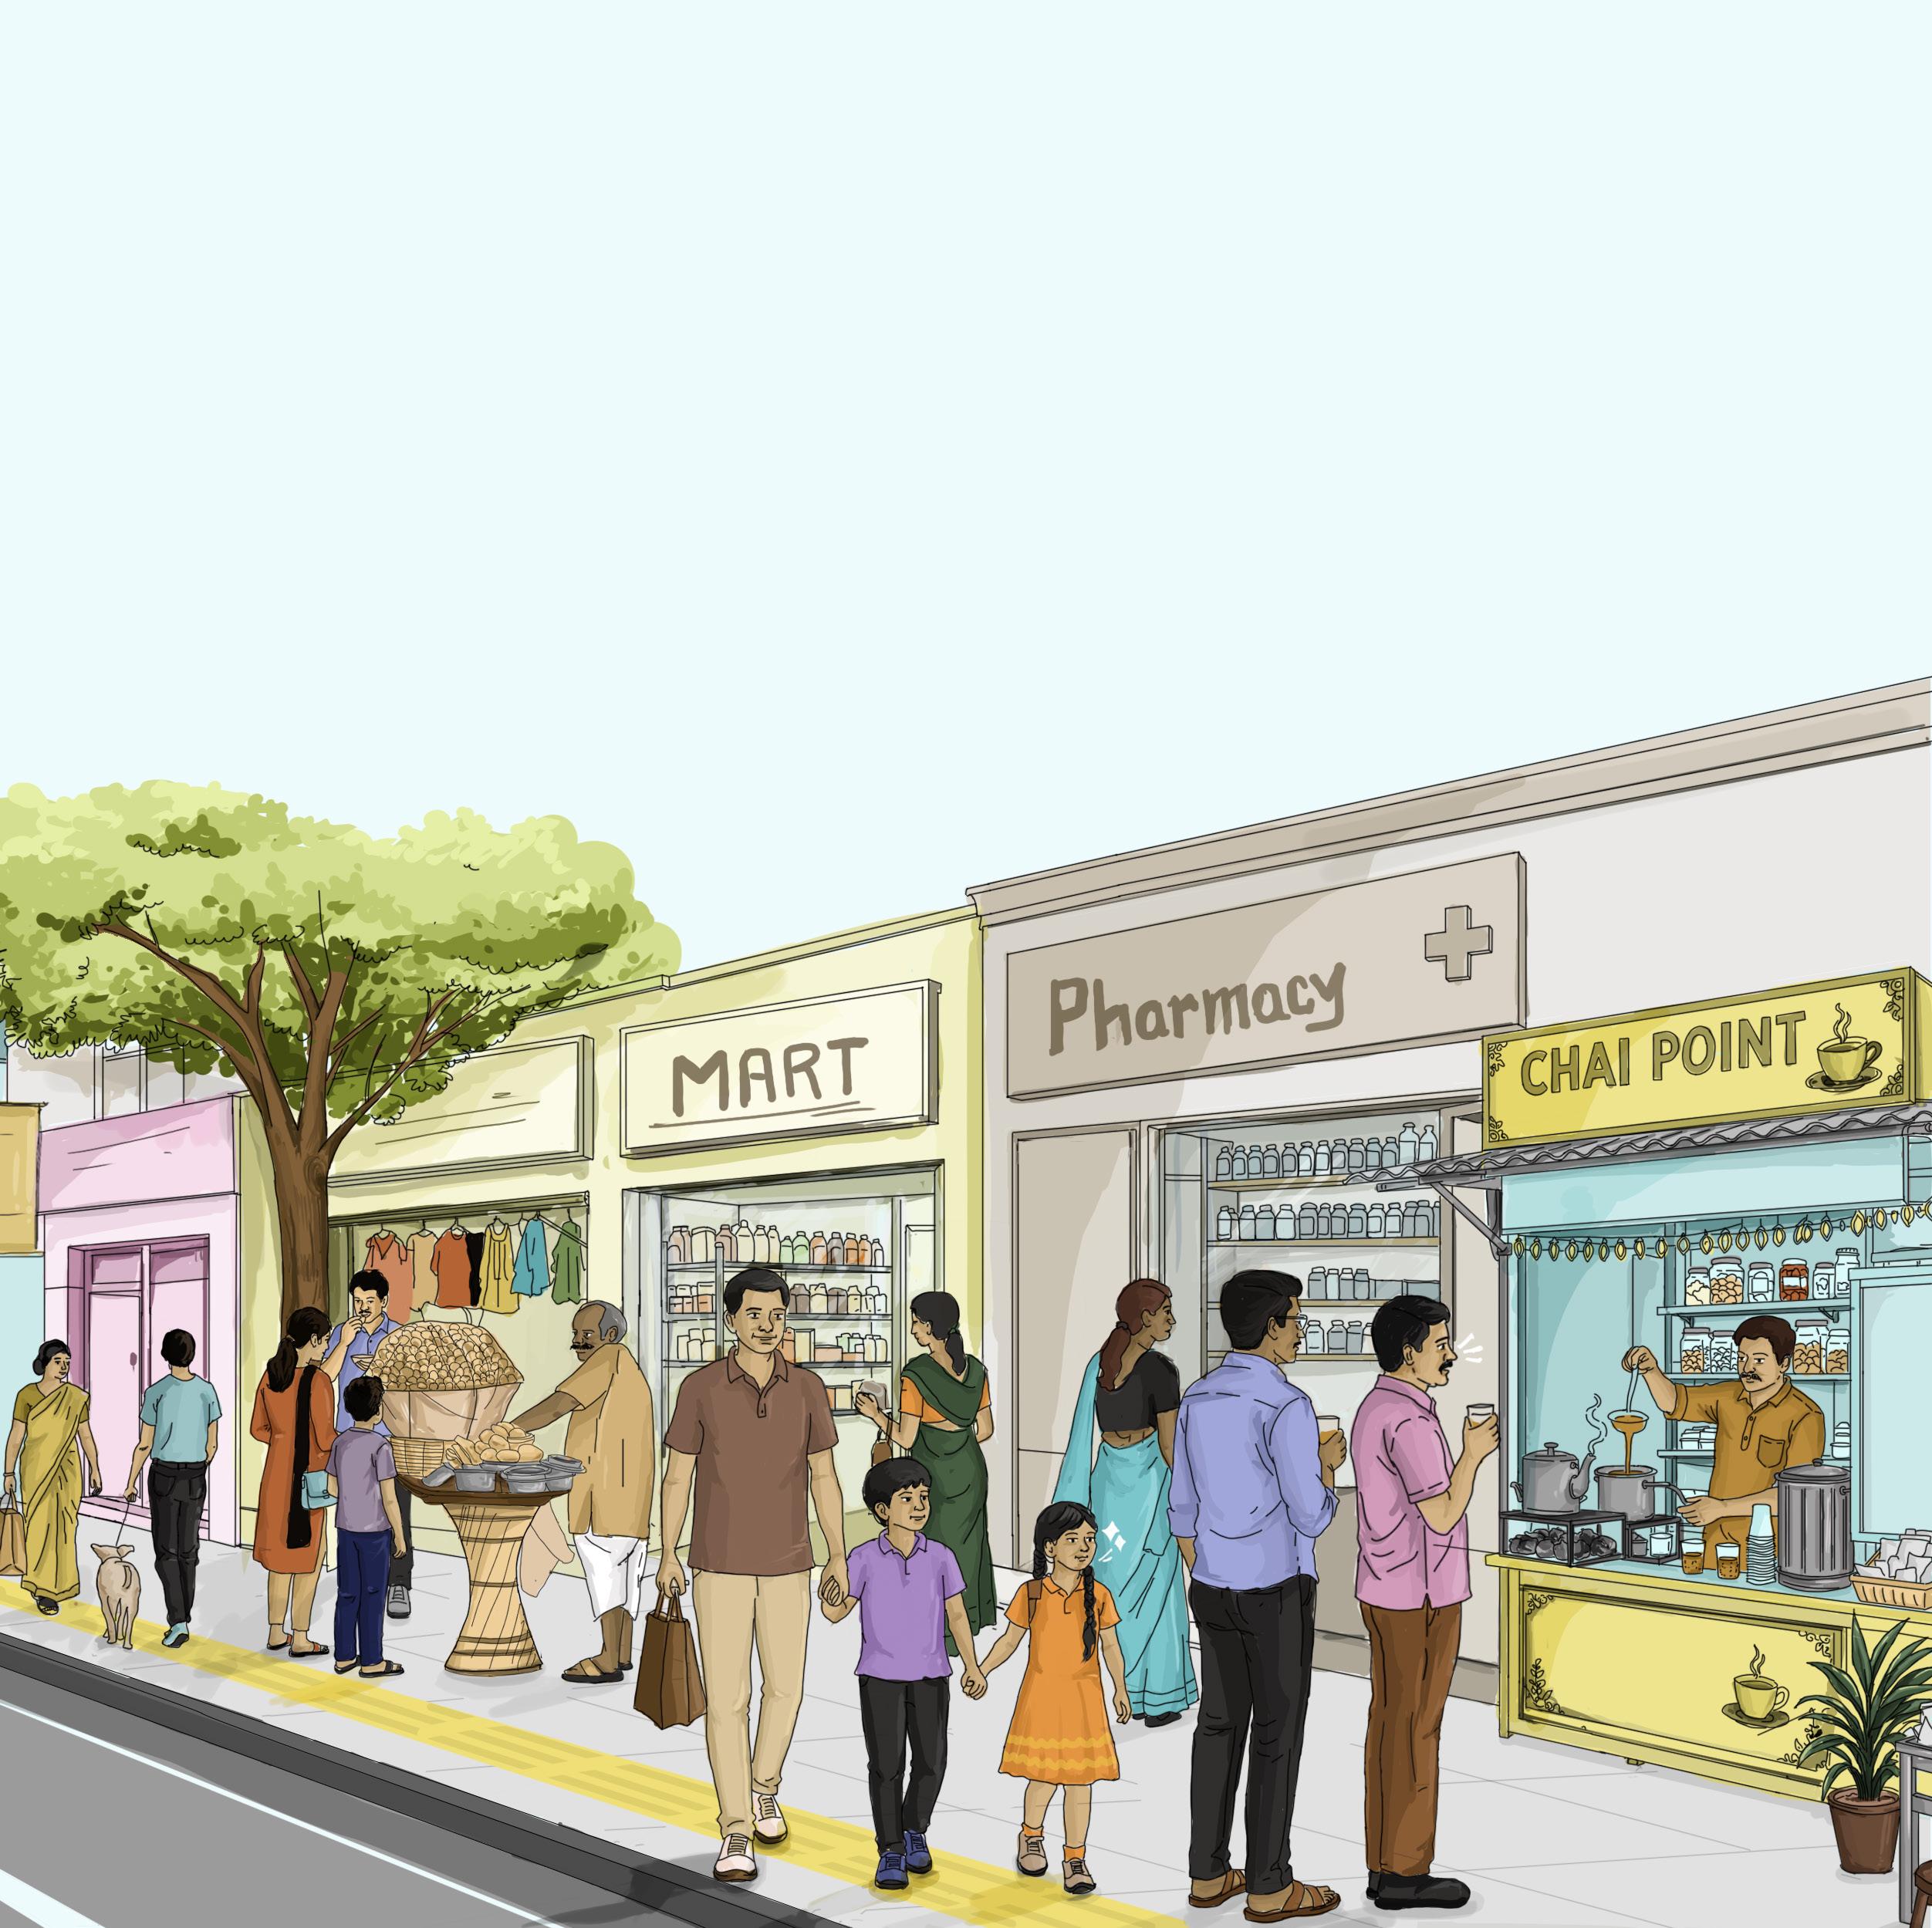
Healthy Streets inspire civic pride and collective maintenance
38% OF HEALTHY STREETS SHOPKEEPERS ACTIVELY ENGAGE IN MAINTENANCE
Only 10% of shopkeepers do so on Unwalkable Streets. Shopkeepers actively contribute to maintenance, cleanliness, and upkeep when streets are safe, attractive, and well-designed.
Healthy Streets reduce road crashes through traffic calming and safer speeds
5‑7 KMPH AVERAGE SPEED REDUCTION ACROSS HEALTHY STREETS
Traffic calming measures on Healthy Streets consistently reduce vehicle speeds toward safer pedestrian thresholds enough to cut pedestrian fatal crash risk by 50-70%.
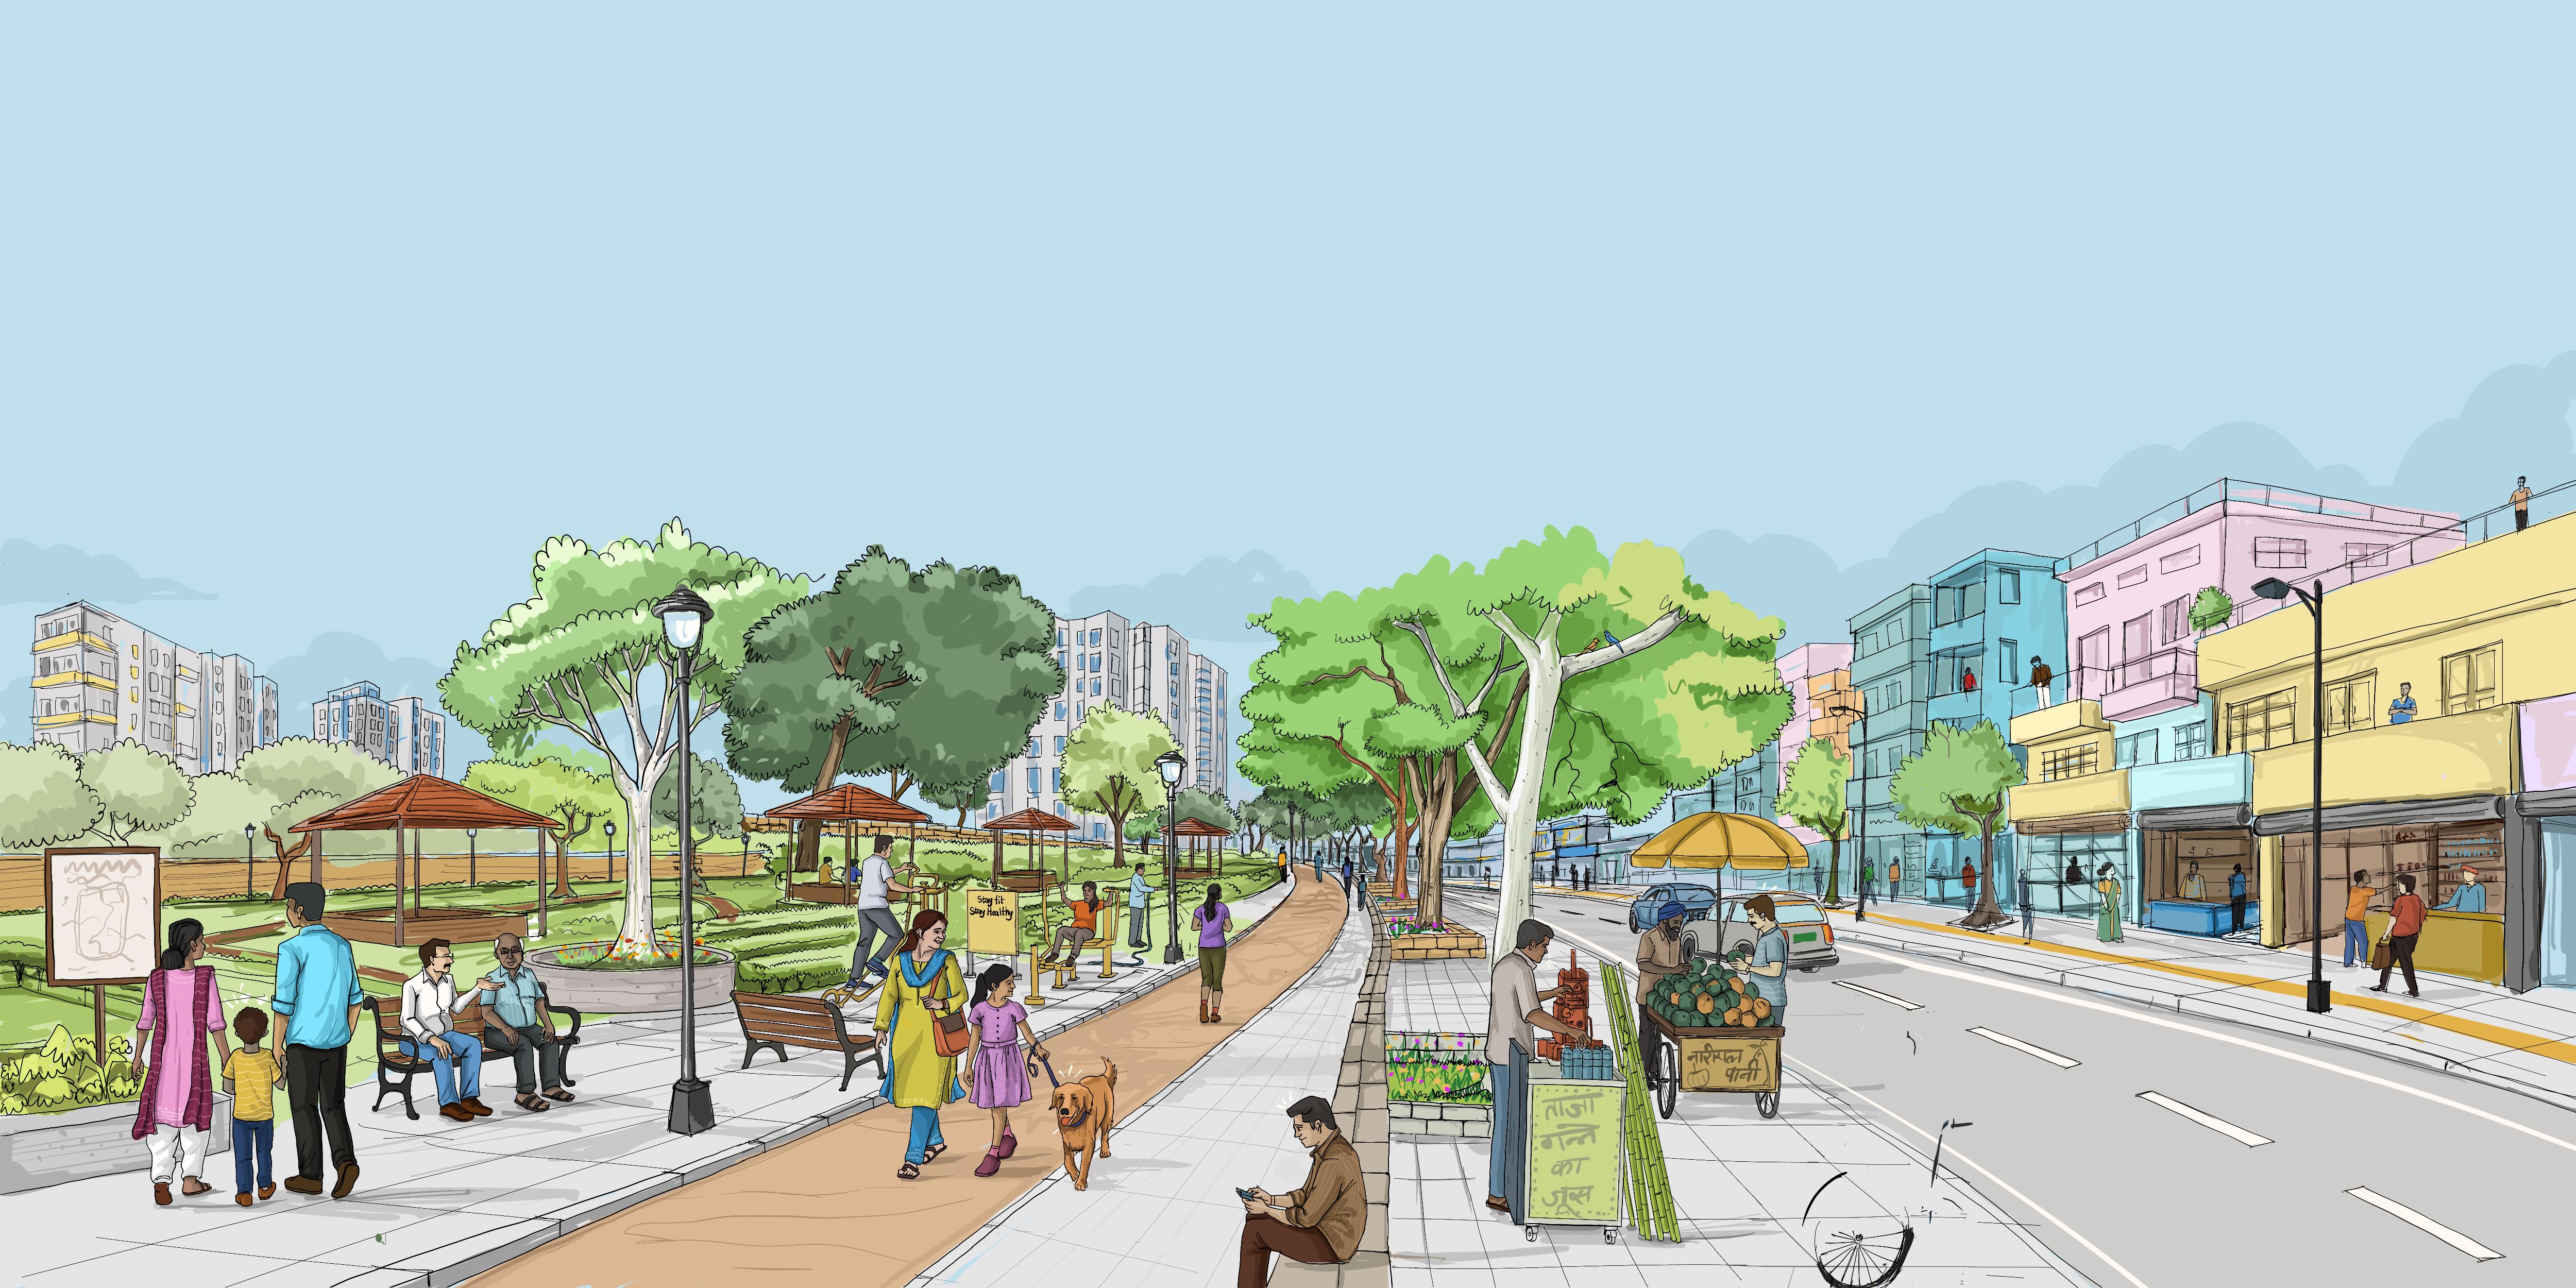
The environmental benefits of Healthy Streets go beyond mobility.
Pedestrian-friendly street environments with shade and tree cover contribute to cleaner and more comfortable urban conditions through reduced vehicular emissions, lower particulate matter (PM) levels, and improved thermal comfort, creating more sustainable street environments.
I Healthy Streets deliver cleaner air and long‑term health dividends
The findings from our on-ground assessments across 10 cities show significant reductions in PM2.5 and PM10 levels in all Healthy Streets, indicating tangible improvements in the street-level environment.
On an average, PM2.5 levels are lower by 22% in Healthy Streets and PM10 levels are lower by 23% when compared to the Unwalkable Streets.

Comparison of average PM2.5 (µg/m3) levels between Healthy Streets and Unwalkable Streets
Unwalkable Streets
Healthy Streets
Bhubaneswar
Chennai
Coimbatore
Pimpri
Chinchwad
Ahmedabad
Bengaluru
Gangtok
Srinagar
Kochi
Comparison of average PM10 (µg/m3) levels between Healthy Streets and Unwalkable
Unwalkable Streets
Healthy Streets
Source: On-ground assessments
PM1 levels being 23% lower on Healthy Streets is a significant respiratory health dividend. Reduction in fine particulate matter that penetrates deepest into the lungs and bloodstream delivers long-term respiratory and cardiovascular health benefits, rarely captured in conventional costbenefit analyses.
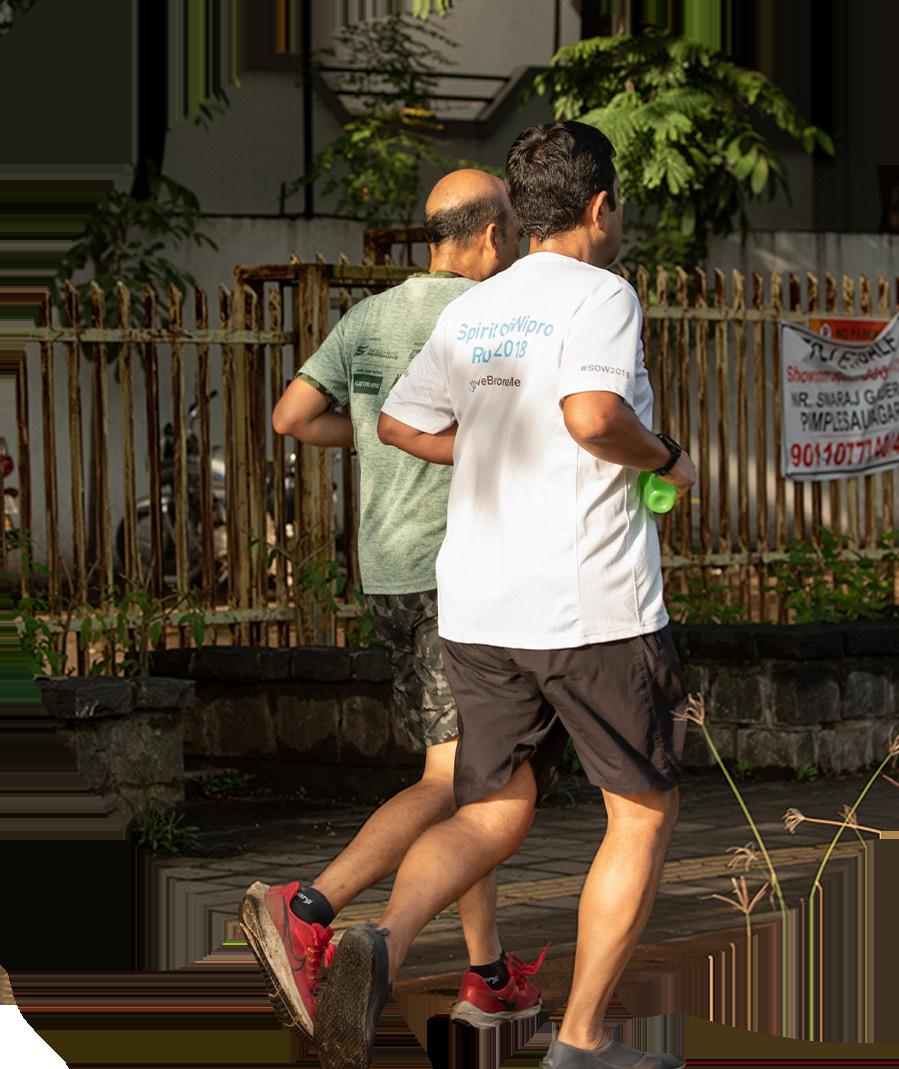
Bhubaneswar
Coimbatore
These improvements can be attributed to several design and management factors:
Improved dust control
Better surface conditions reduce the availability of loose dust.
Enhanced microclimatic conditions
Tree cover and other shading elements support calmer, cleaner air near the ground.
This consistent reduction in PM10 and PM2.5 levels are also directly tied to the quality of street design and management,
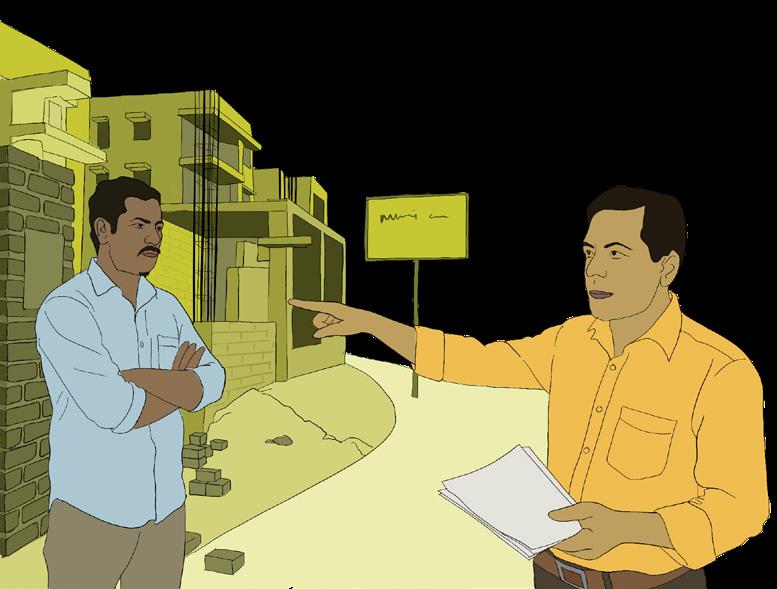
Effective encroachment management
Reduced vehicular turbulence
Smoother traffic flow and street geometry help limit the resuspension of road dust.
Continuous paving
Unbroken surfaces prevent dust accumulation in cracks and edges.
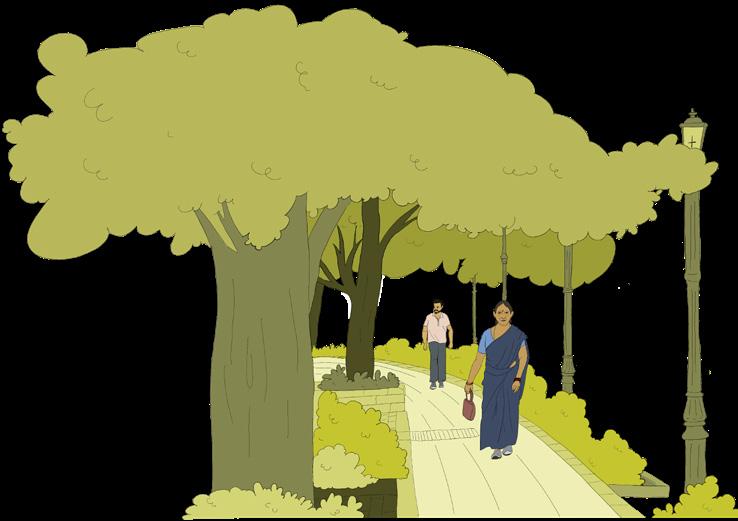
Welldesigned and continuous footpaths

Regular and efficient street maintenance/ cleaning
II
Healthy Streets cut emissions, one commute at a time
Healthy Streets influence how people travel on a daily basis, encouraging a shift away from private vehicles towards more sustainable modes, reducing transport-related emissions.
The perception surveys conducted among shopkeepers state that, 43% of Healthy Streets shopkeepers now walk or cycle to work. The effect is stronger among those who experienced the street transformation (48%) than those who arrived after it (32%). If Unwalkable Streets were improved, NMT mode share among shopkeepers is expected to rise from 30% to 42%, almost entirely displacing two-wheeler trips.
Healthy Streets witness 14% more walking trips and 3.6% lesser vehicular movement than Unwalkable Streets. These findings highlight the role of pedestrian infrastructure in reducing motorised short trips for daily commuting.
Emission estimates based on peak-hour traffic volumes further reinforce this trend, showing clear reductions in emissions in Healthy Streets of all 10 cities.
49 KG/KM LESSER EMISSIONS ON HEALTHY STREETS
Based on onehour peak traffic volume on Healthy Streets and Unwalkable Streets,
102 KG/KM LESSER EMISSIONS ON HEALTHY STREETS
56 KG/KM LESSER EMISSIONS ON HEALTHY STREETS
*Map for representation purpose only
Bengaluru:
Srinagar:
Coimbatore
Private cars remain the single largest contributor to transport emissions, accounting for nearly 46% of total emissions even on Healthy Streets. This underlines the need to further reduce private vehicle dependence through a combined strategy of strengthening public transport and NMT, while discouraging private vehicle use.
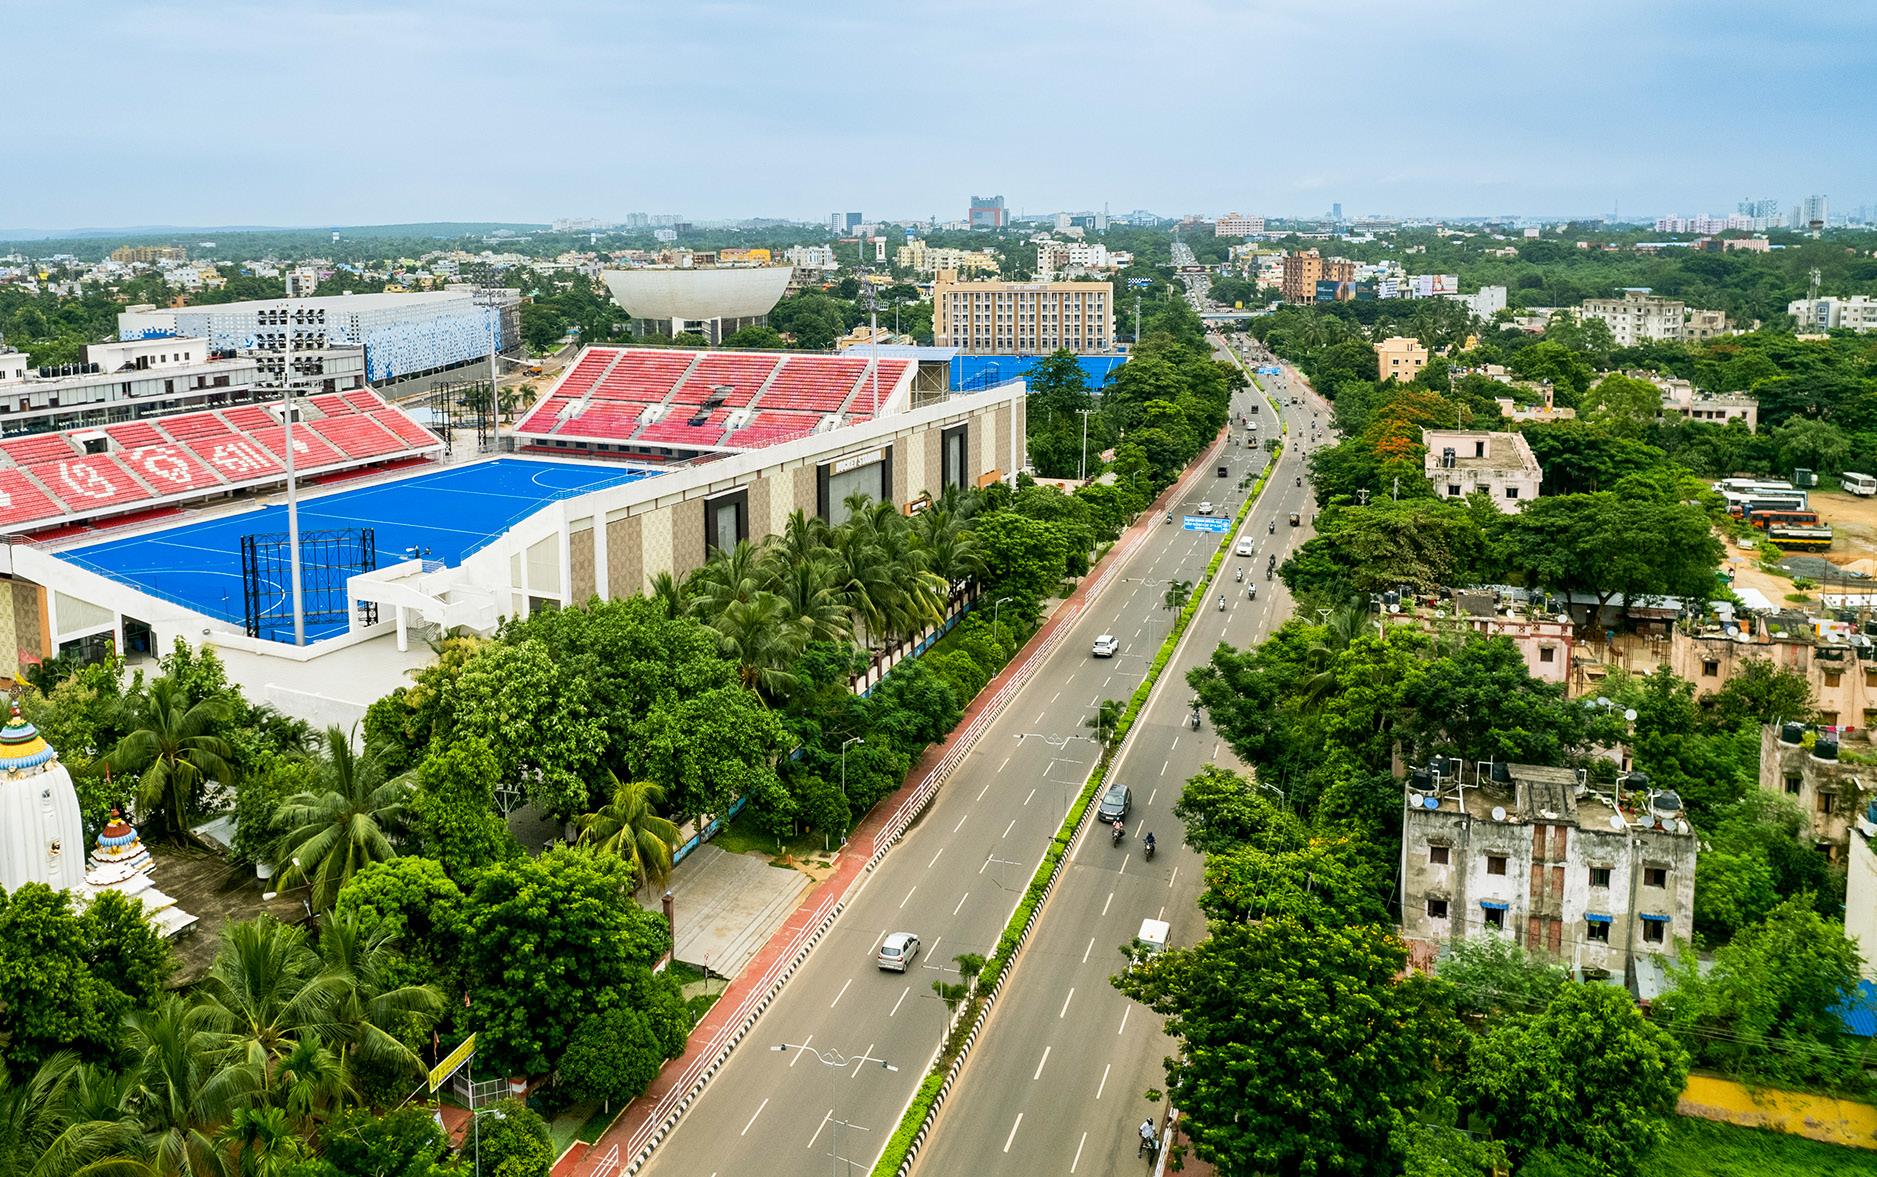
Goods vehicles, LCV (Light Commercial Vehicle) and HCV (Heavy Commercial Vehicle) are 27% lower on Healthy Streets, directly contributing to nearly 75 kg/km lower emissions during a one-hour peak traffic period alone, while also creating a cleaner, less freight-dominated street environment, making the streets safer for all user categories.
III Healthy Streets improve thermal comfort
Across all 10 cities, environmental quality emerged as one of the most consistently valued dimensions of street experience.
Around
of respondents highlighted shade, greenery, cleanliness, and overall environmental comfort as key positive features of Healthy Streets, ranking them alongside safety and accessibility as a primary driver of preference. 62%
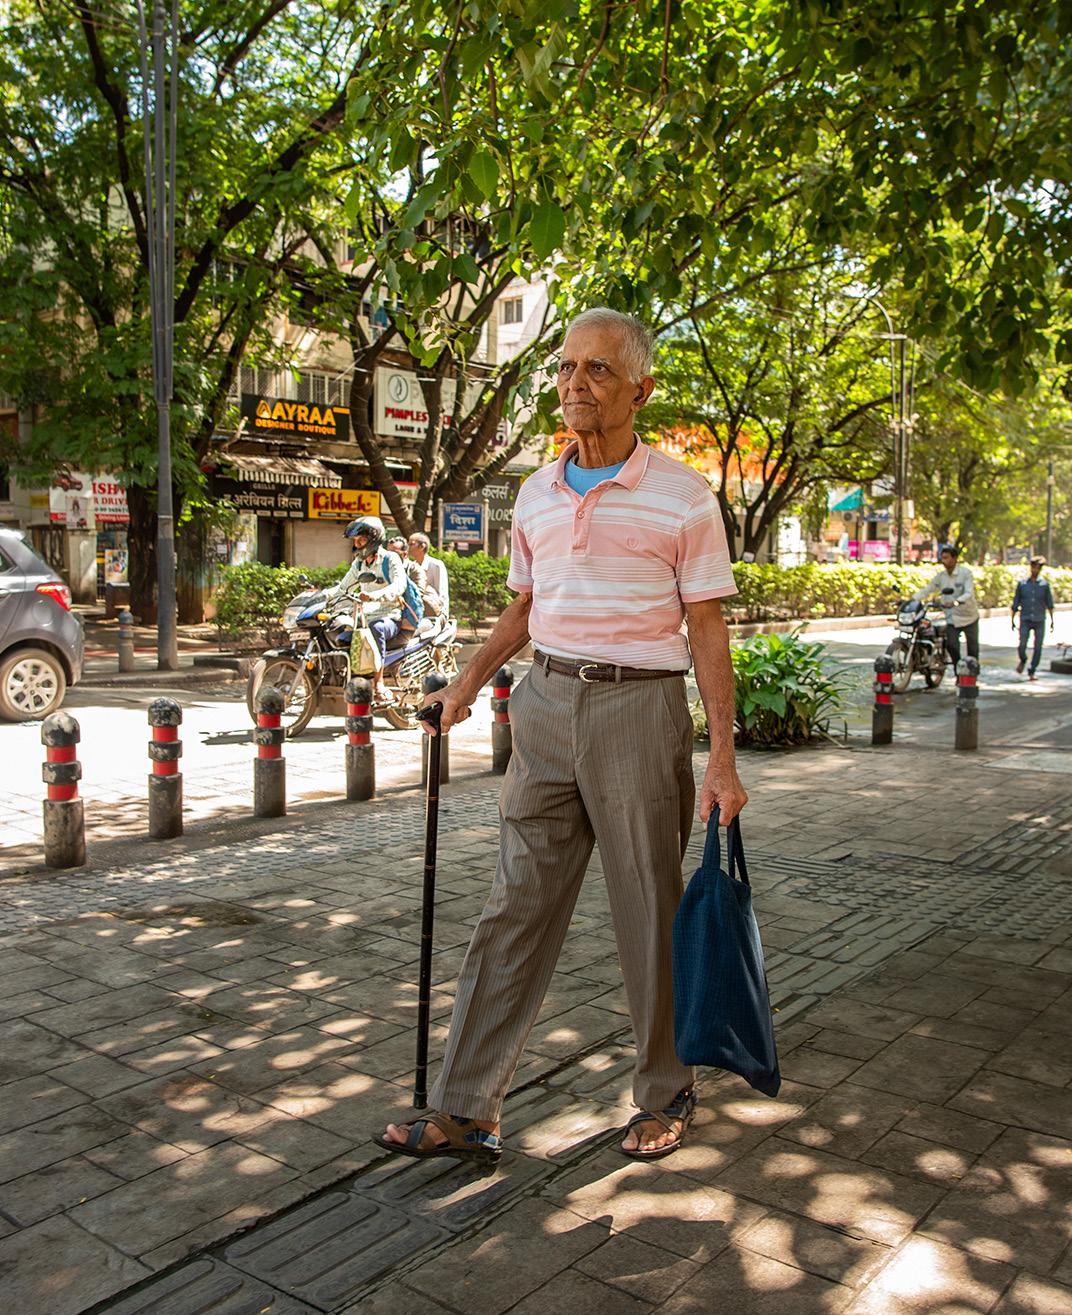
This reflects a direct design outcome: Healthy Streets, by allocating more of the RoW to tree cover, pedestrian infrastructure, permeable surfaces/ material choices structurally produce cooler, greener, and more livable street environments than their Unwalkable counterpart.
The data points this out sharply. The median tree cover across Healthy Streets is 29% of total RoW, against only 9% on Unwalkable Streets; meaning Healthy Streets carry more than three times the canopy cover when compared to Unwalkable Streets. This is not a marginal difference; it represents a fundamentally different approach to how public street space is allocated, and how existing tree cover is included in the street design.
SHADED HEALTHY STREETS CARRIAGEWAYS
Average reduction in surface temperature by ~9.5°C
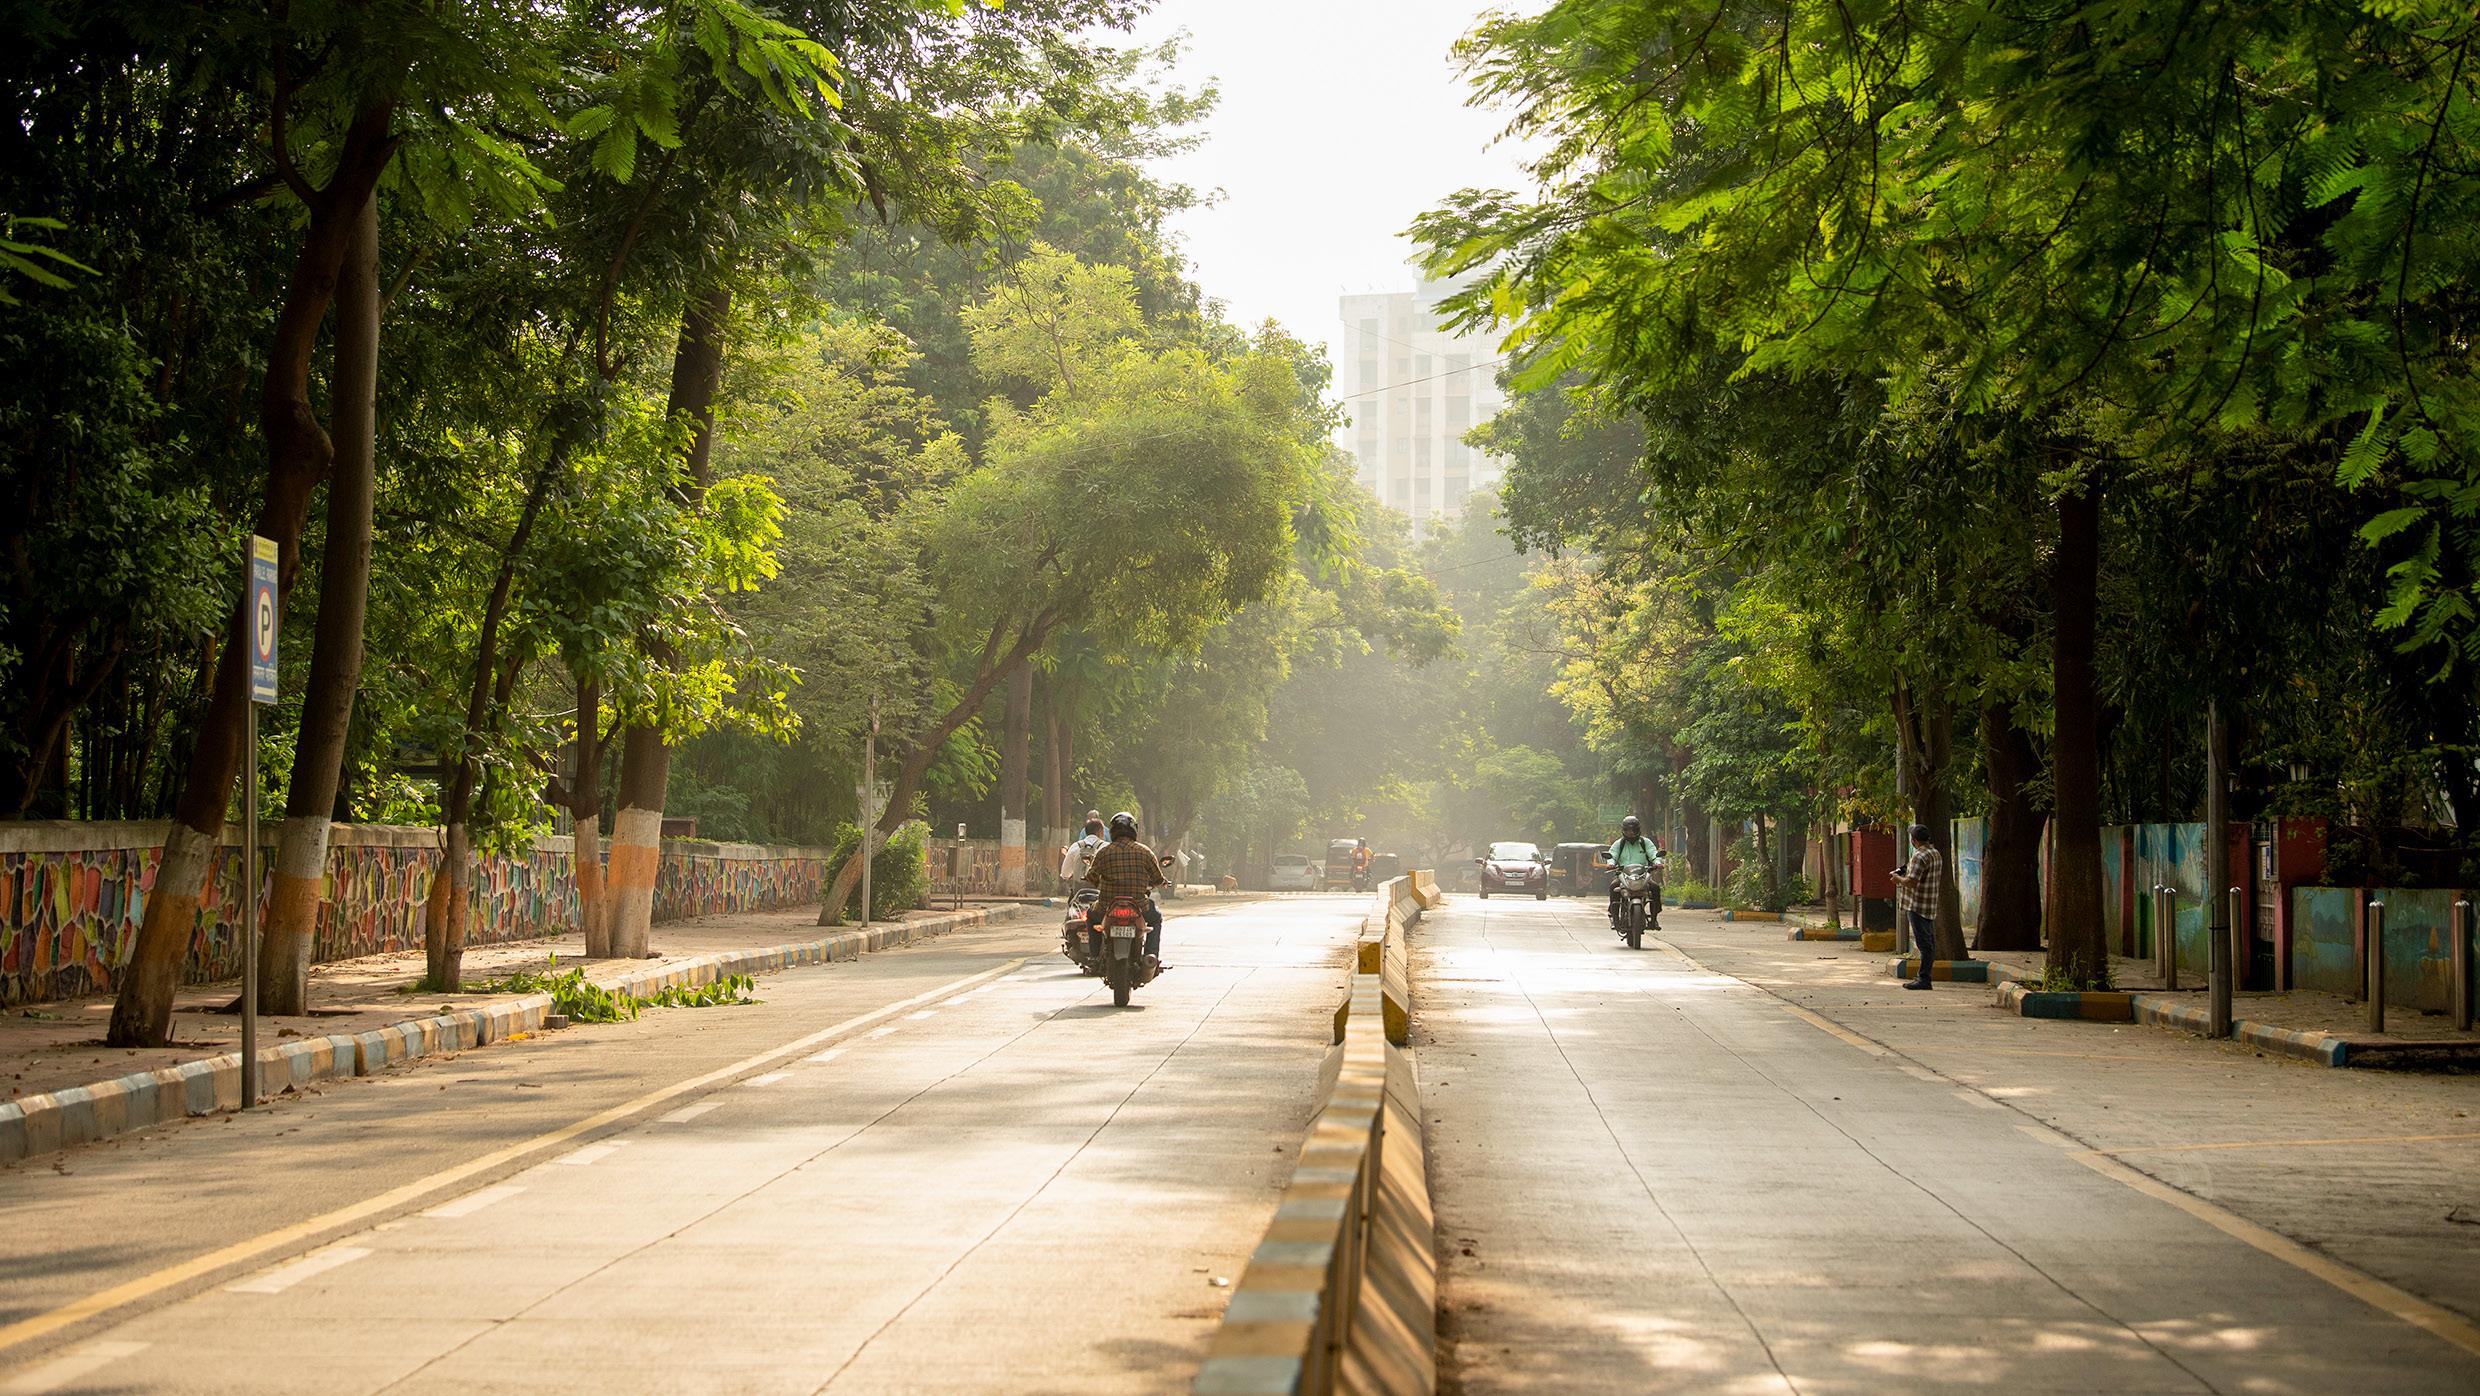
SHADED HEALTHY STREETS FOOTPATHS
Average reduction in surface temperature by ~12°C
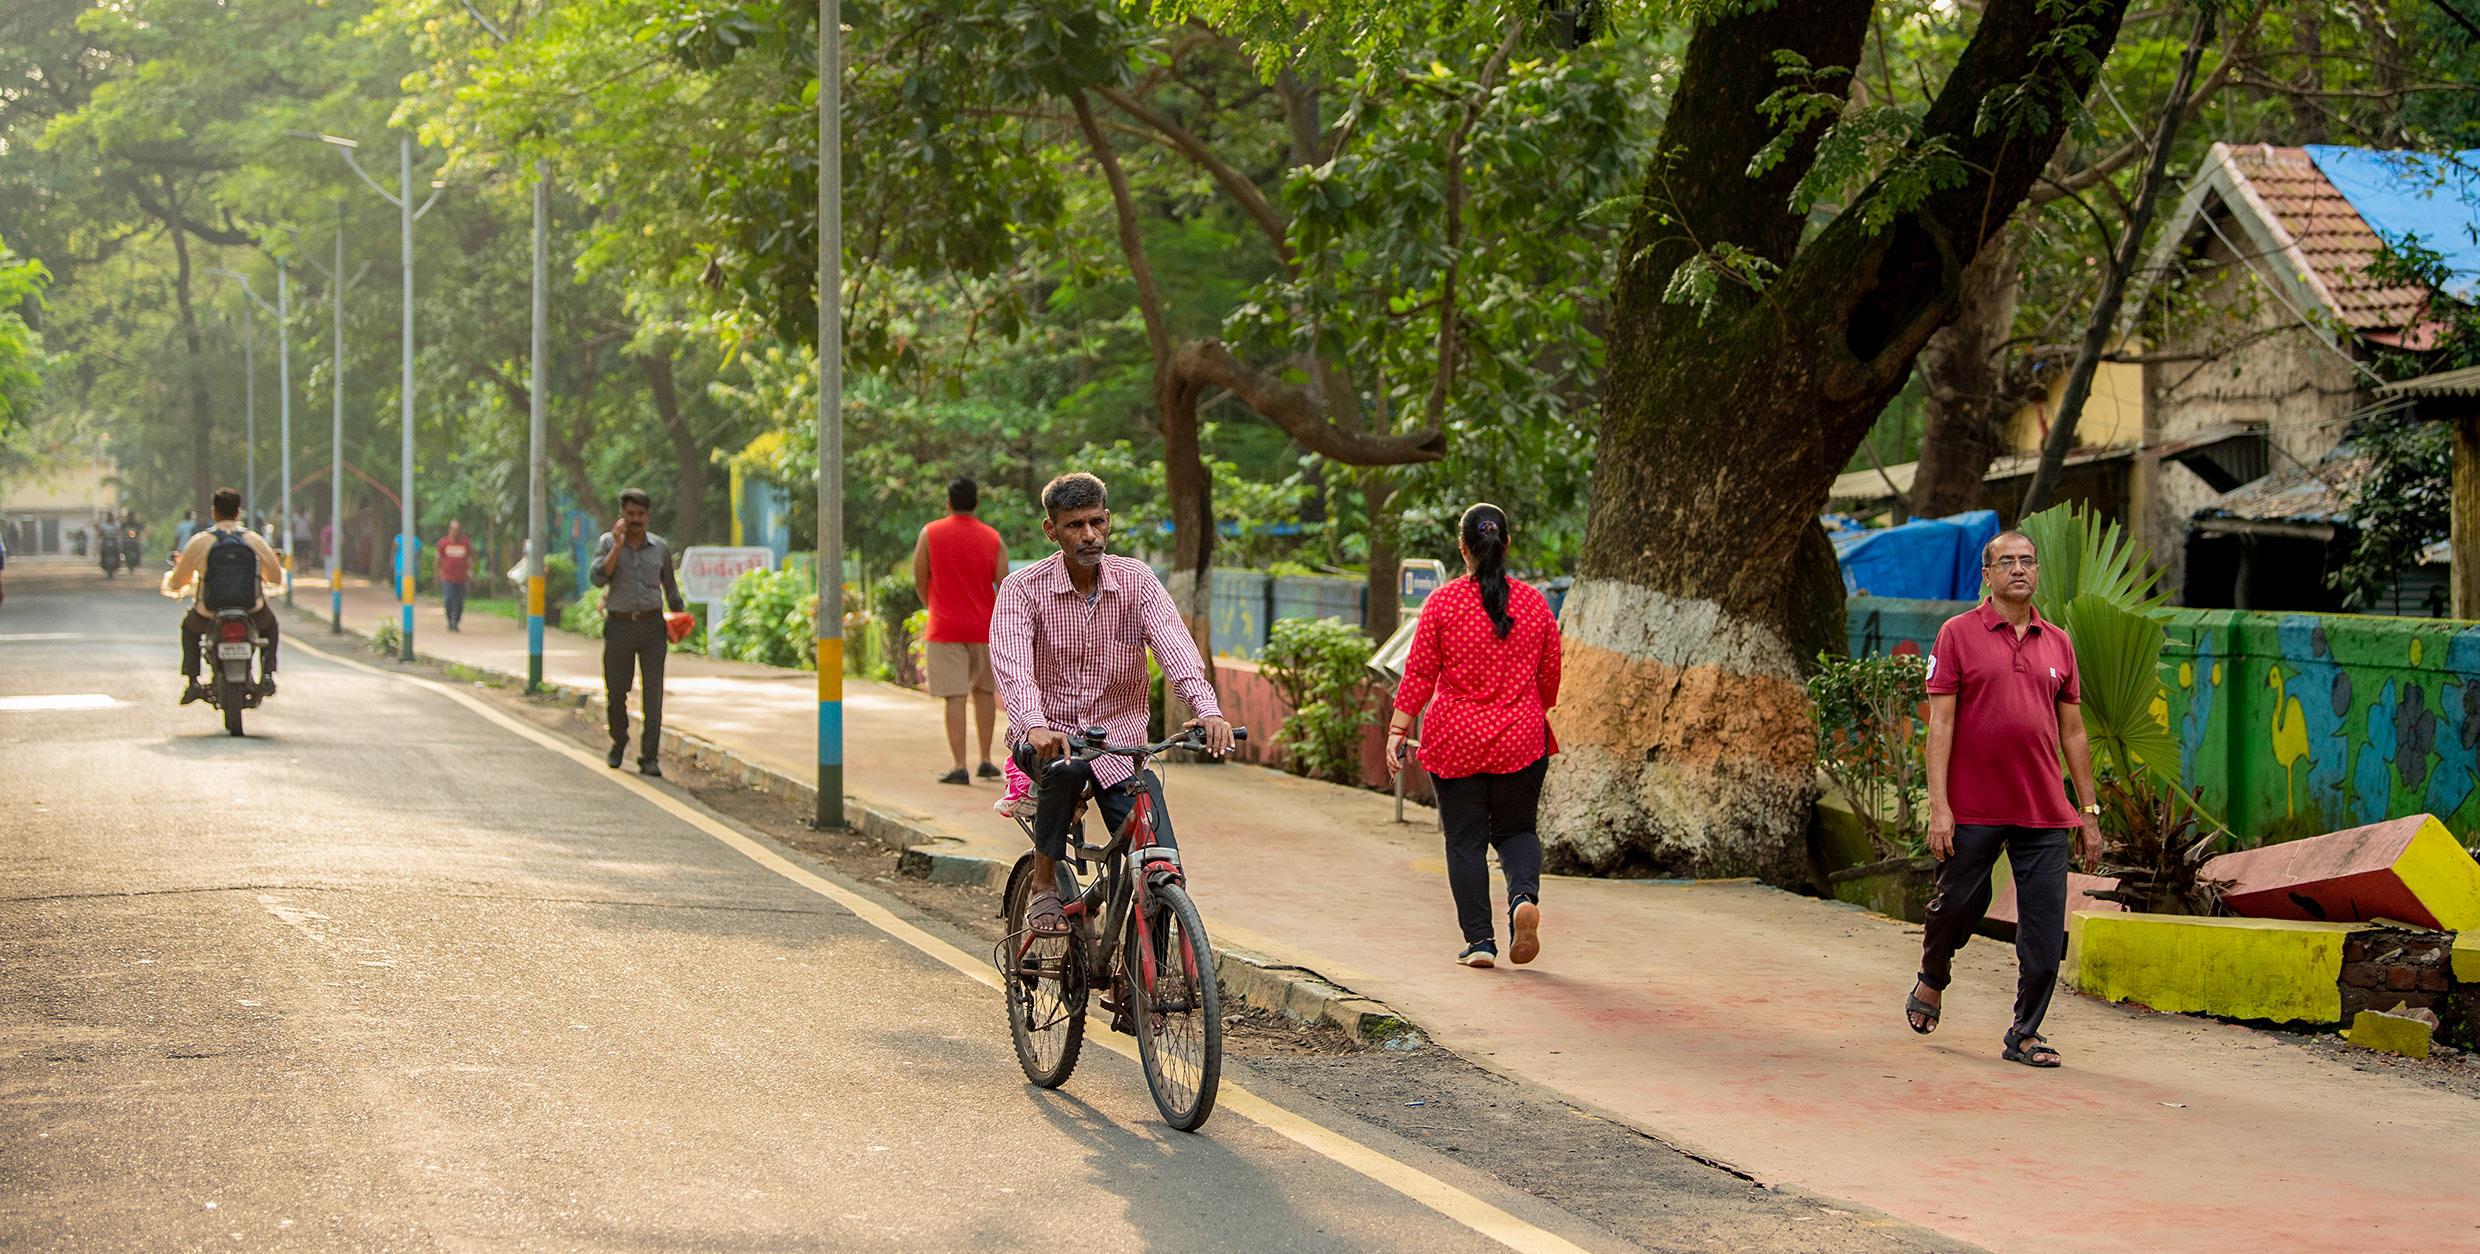
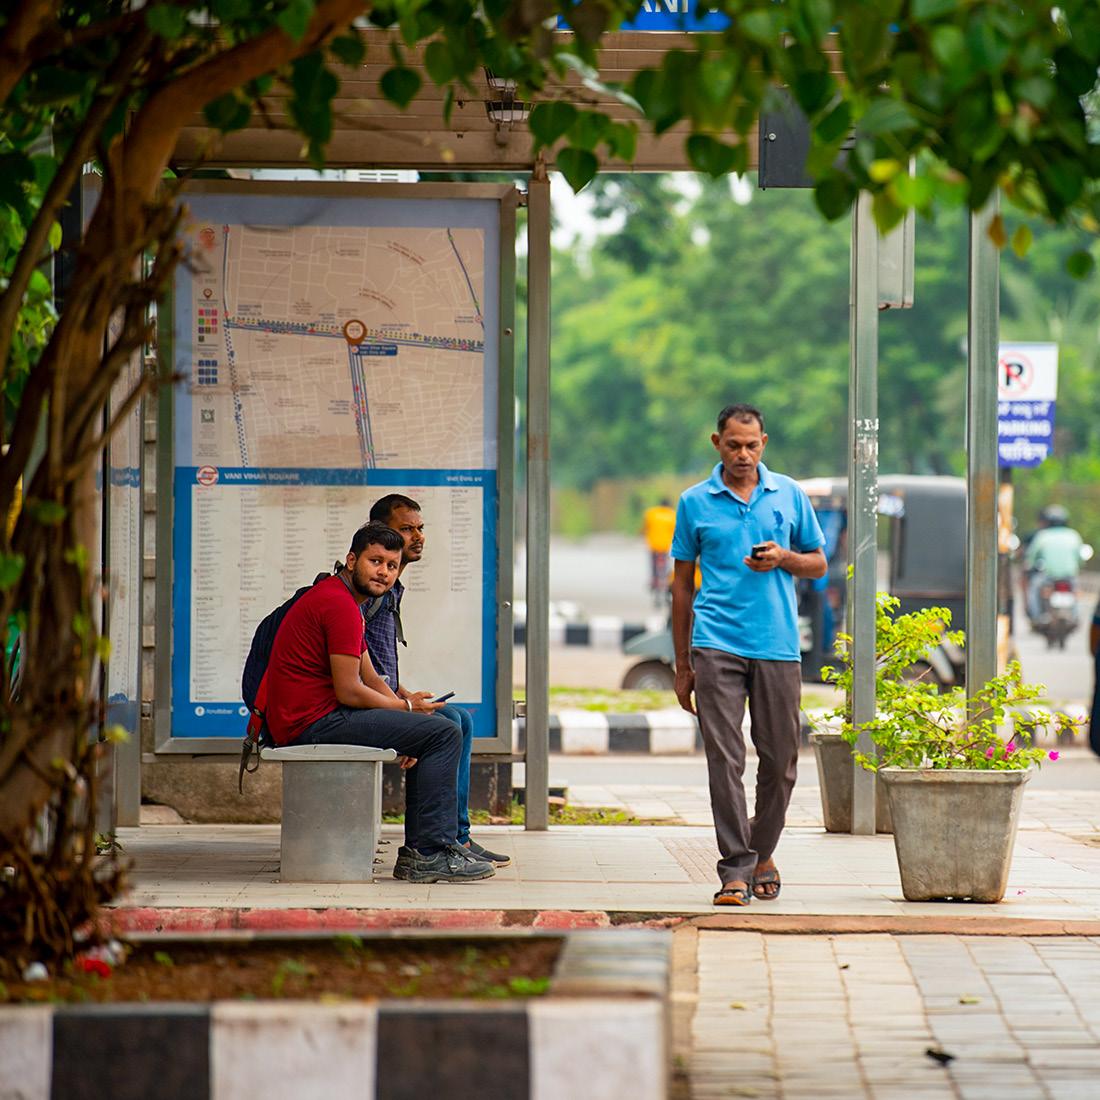
Shaded vs Unshaded Footpath Surface Temperature
Church Street, BengaluruUnshaded 49°C
Shaded 22.6°C
Consistent cooling effect from tree canopy on pedestrian surfaces MG road, Gangtok- cooler base climate, even moderate shade is meaningful
City-Wise Highlights - Footpath Surface Temperature
BENGALURU Church Street - 12th
Main, Indiranagar
DB RoadMettupalayam Road
Linear Garden RoadWakad - Bhosari Road
Smart Janpath RoadPuri - Cuttack Road
Science City RoadSola Road
Pondy BazaarSouth Usman Road
Source: On-ground assessments
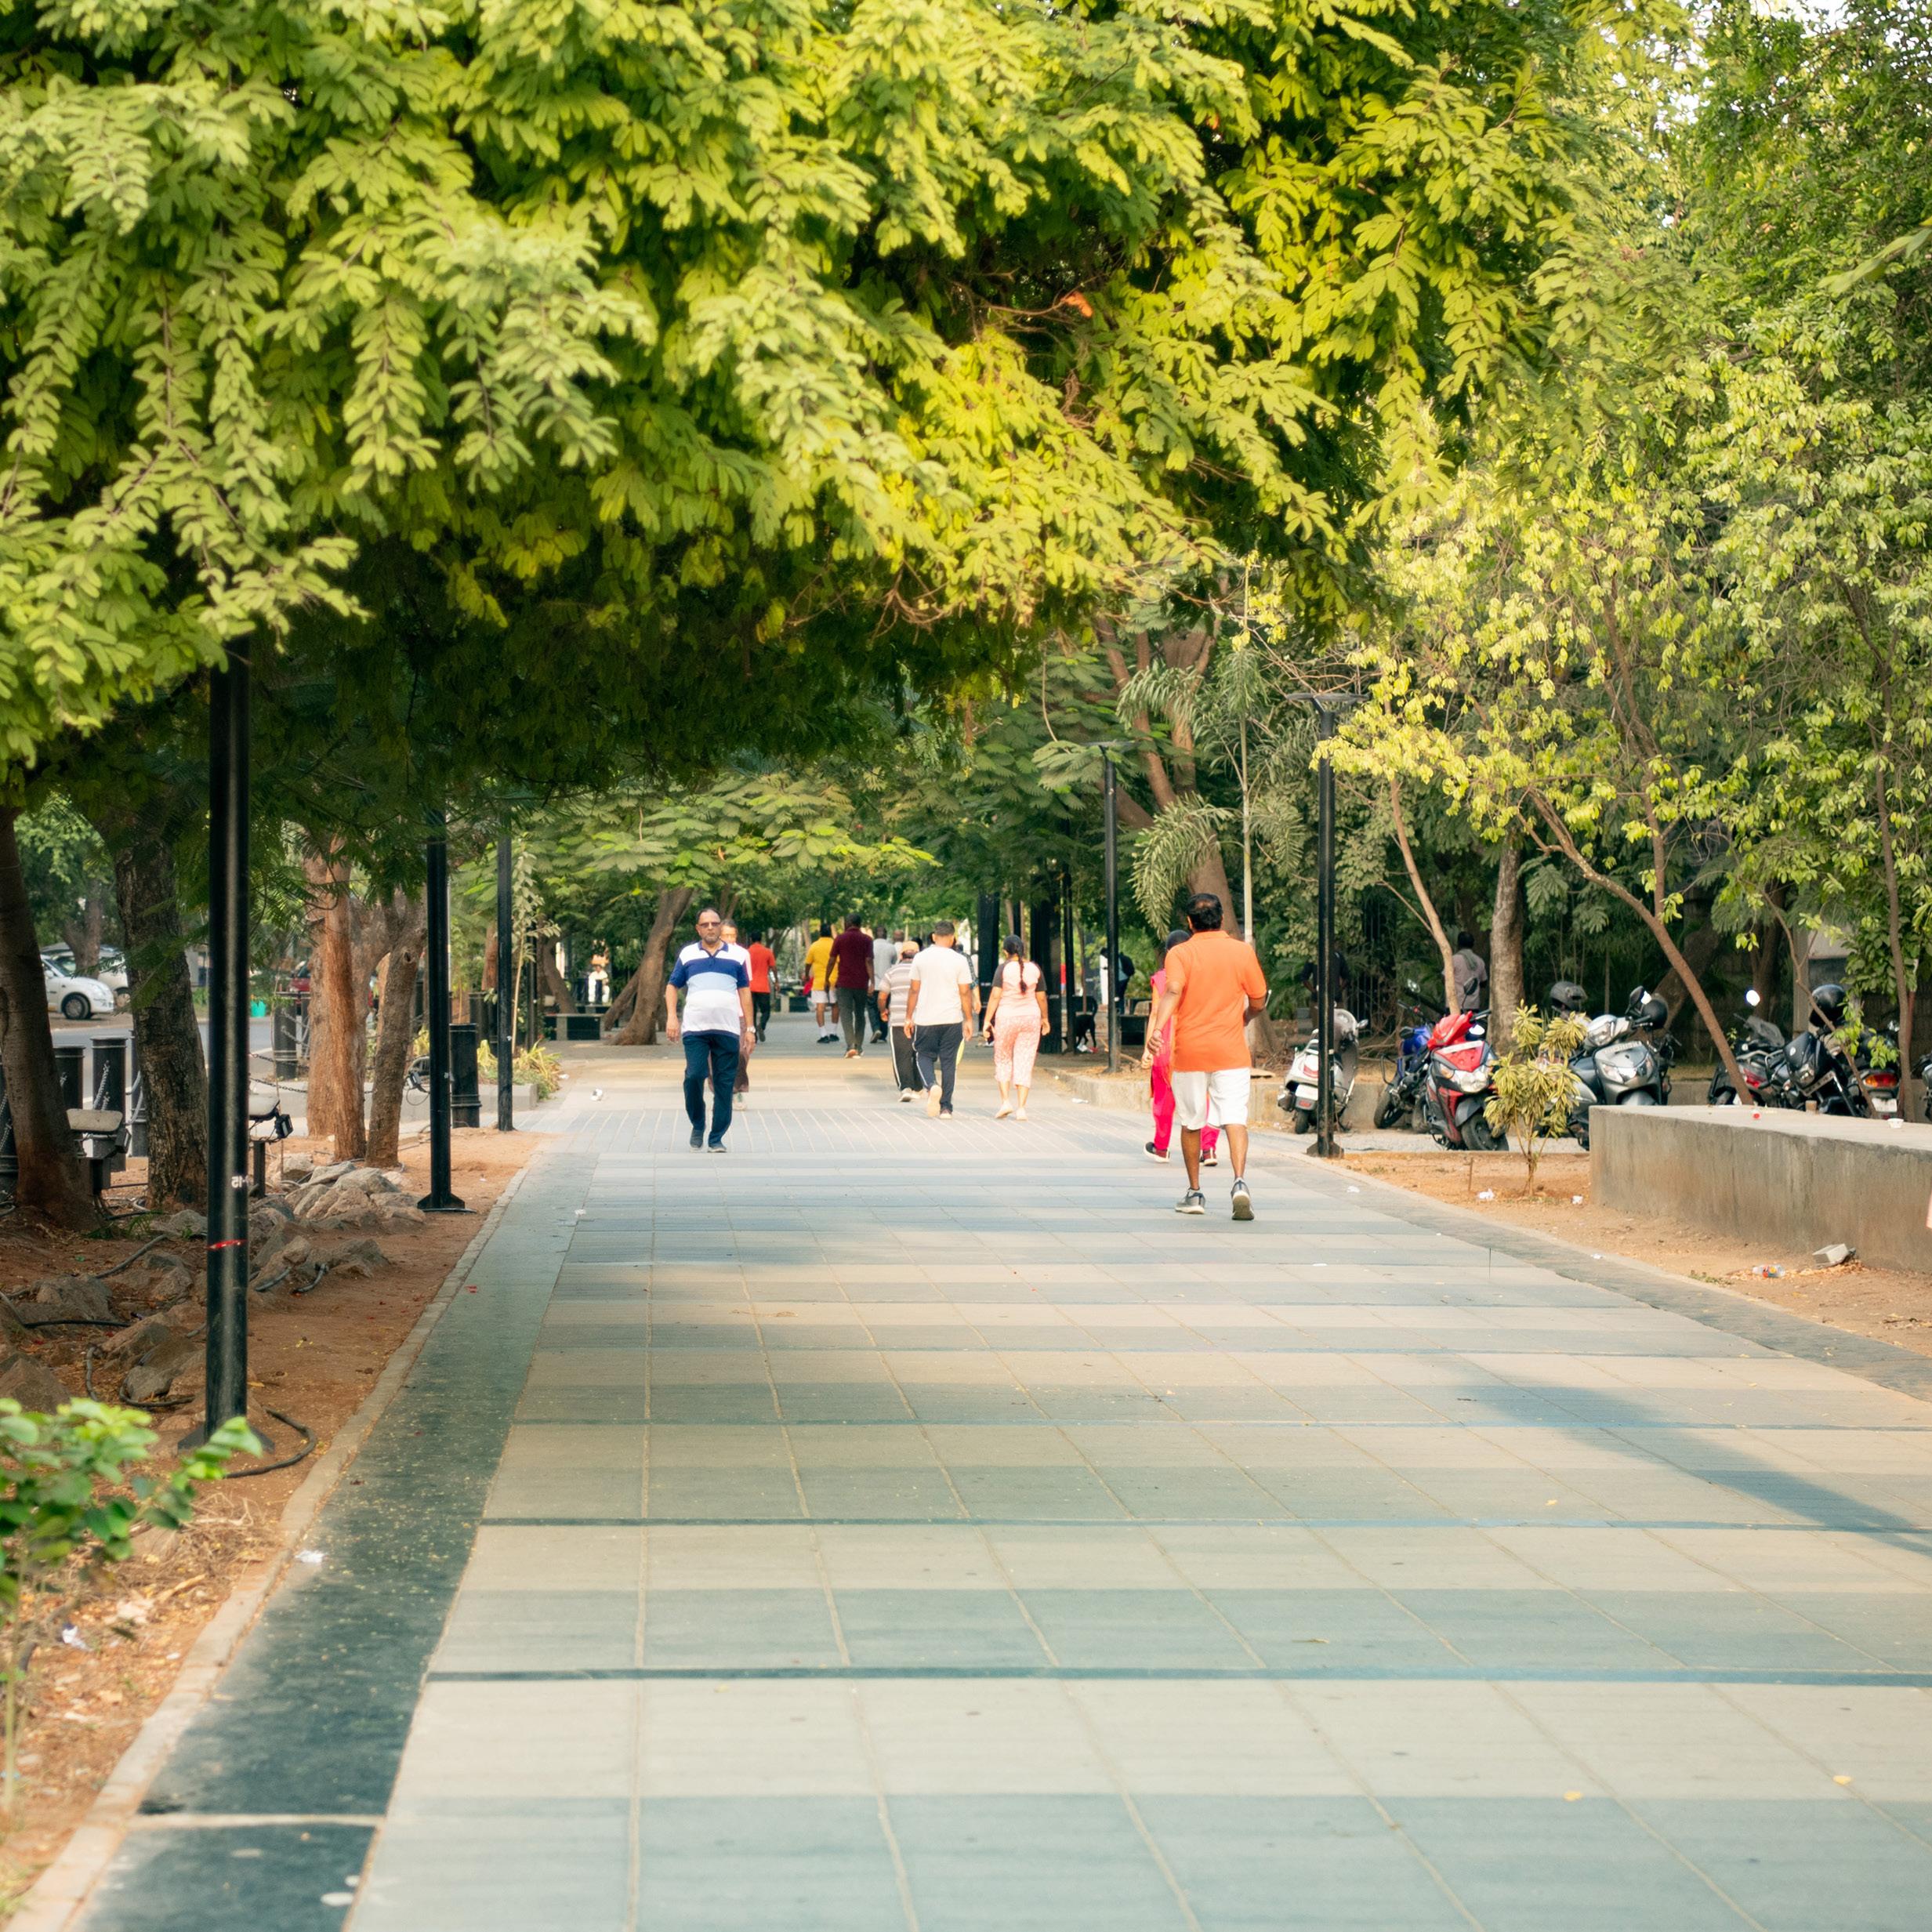
CITY HIGHLIGHTS TREE COVER DIFFERENTIAL
Chennai leads all cities with 70% tree cover on Pondy Bazaar, its Healthy Street corridor, against only 5% on the Unwalkable Street South Usman Road. This 65 percentage point gap is the largest in the study and reflects Pondy Bazaar’s deliberate design investment to advance its continuous canopy. For a city that regularly records among the highest urban heat island intensities in India, this differential has direct public health consequences during the summer months.
Healthy Street Unwalkable Street
5% 70%
South Usman Road Pondy Bazaar
65% gap
COIMBATORE AND BHUBANESWAR
follow closely, with Healthy Street tree cover of 63% and 58% respectively, against Unwalkable Street figures of 27% and 5%. Bhubaneswar’s near-zero
Unwalkable Street canopy (5%) on the Puri-Cuttack Road makes the counterpart, Smart Janpath corridor’s 58% cover a particularly stark contrast; where on one hand the pedestrians experience the comfort of a shaded walking environment vs the discomfort of an exposed arterial that makes walking uncomfortable.
An average surface temperature difference of 2 degree Celsius between shaded footpath areas in Healthy Street and Unwalkable Street across these three cities shows the direct contribution of tree cover in reducing surface temperatures.
Carriageway temperatures
Healthy Streets carriageways across multiple cities record higher surface temperatures than footpaths, attributable predominantly to the heat-absorbing properties of bitumen and the relative lack of overhead shading on wide traffic lanes.
Bengaluru (-3.1°C) and Gangtok (-4 °C) show reduced carriageway surface temperatures when compared to their Unwalkable Street counterparts. This is attributable in part to the use of higher-albedo surface materials such as cobblestone and concrete tiles, which reflect more solar radiation than conventional bitumen,
Puri-Cuttack Road
Mettupalayam Road
demonstrating that surface material choice is a meaningful secondary thermal design lever alongside tree canopy and shade.

IV Healthy Streets lower noise pollution for better health and comfort
Across the 10 cities studied, Healthy Streets recorded measurably lower ambient noise levels than their conventional street counterparts, with an average reduction of 3.7 decibels (dB) during peak hours.
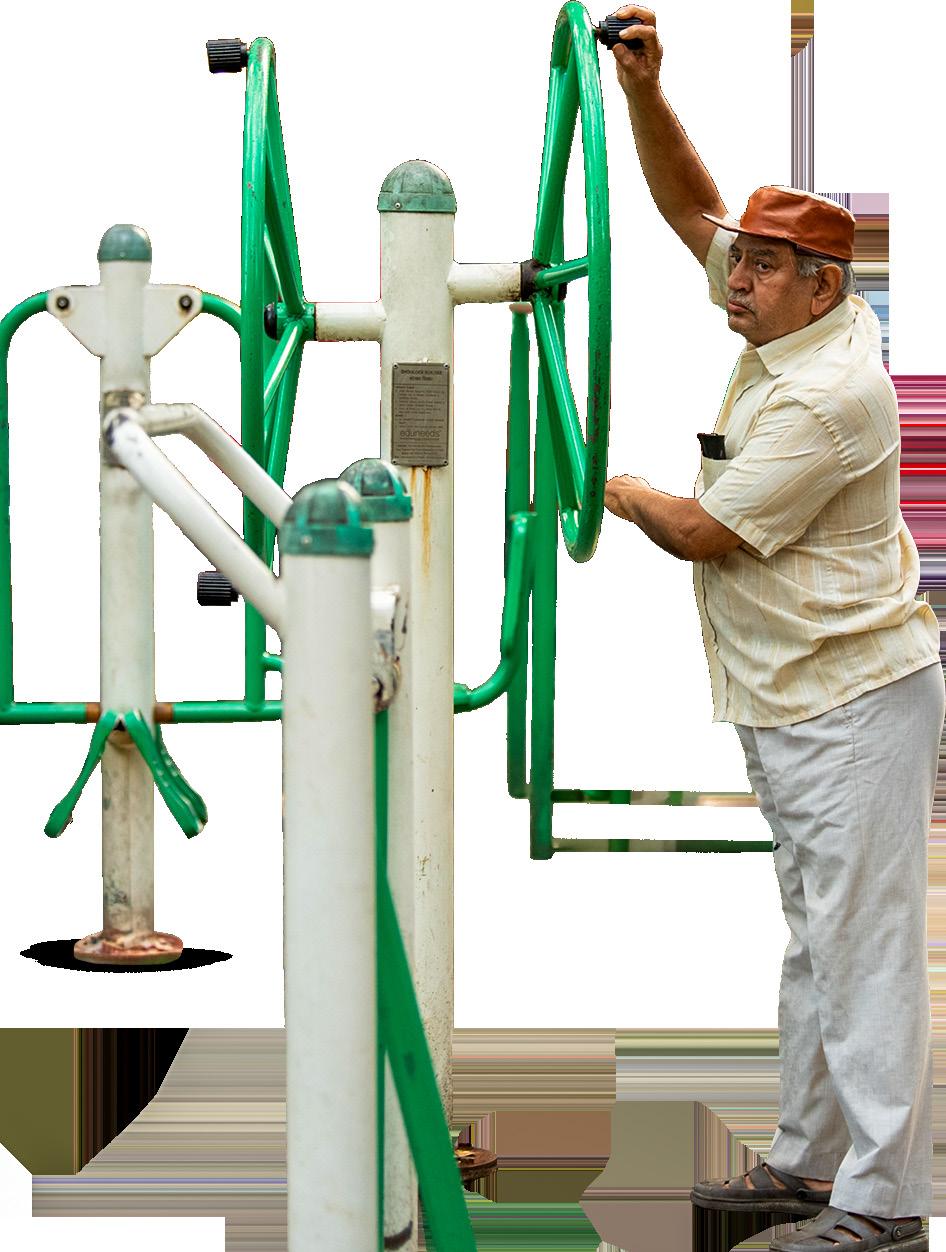
The effect is most pronounced in Chennai, where Pondy Bazaar recorded a 20.9% reduction in decibel levels compared to the Unwalkable Street, a significant margin given that even a 3 dB reduction represents a halving of sound energy.
Cities including Bhubaneswar, Coimbatore, Kochi, Ahmedabad, Bengaluru, and Gangtok all show Healthy Street readings consistently below their Unwalkable Street baselines, pointing to a pattern rather than isolated outcomes. The reduction is attributable to the combined effect of lower goods vehicle volumes during peak hours (27% fewer on Healthy Streets by count), reduced throughtraffic, organised parking that removes idling and manoeuvring behaviour, and wider footpaths that physically separate pedestrians from the vehicle carriageway.
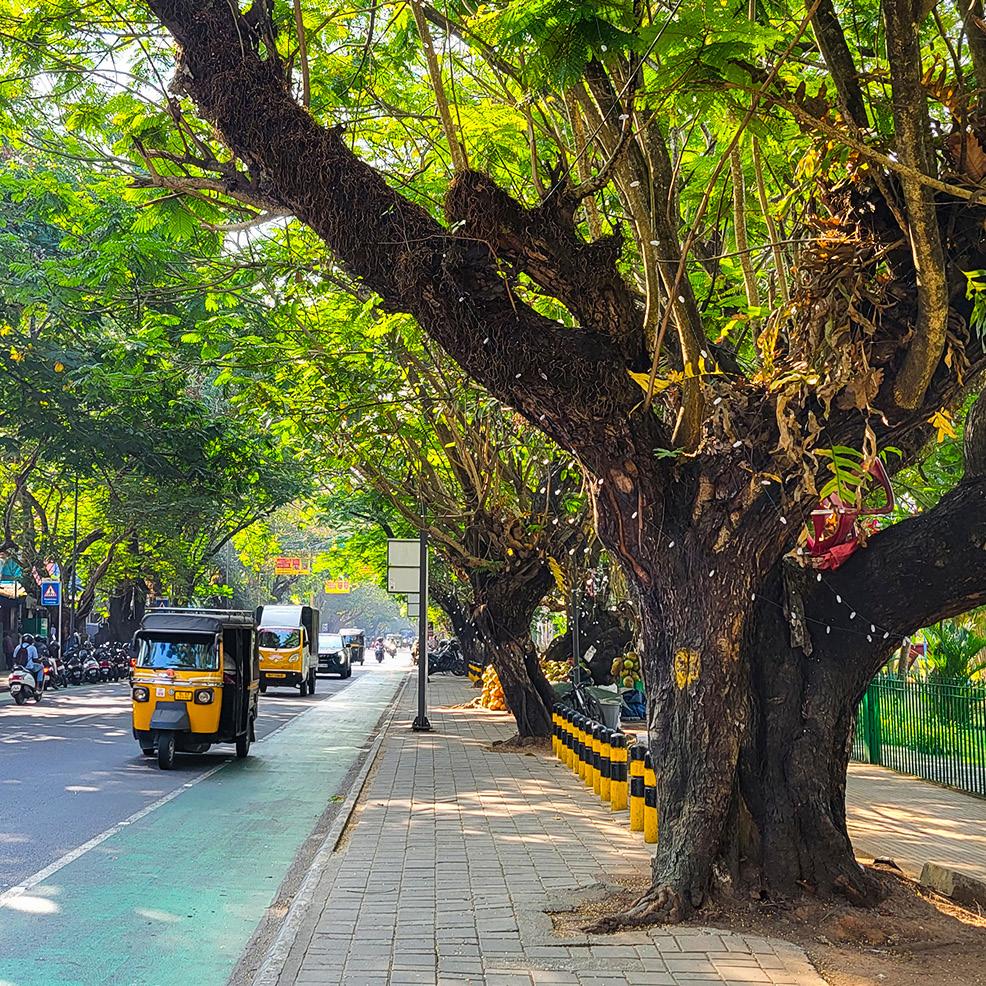
Together, these findings make a compelling case: Healthy Streets deliver measurable environmental dividends: from cleaner air and lower emissions to cooler, more comfortable public spaces. The 22–23% reductions in PM2.5, PM10, and PM1 translate directly into long-term respiratory and cardiovascular health benefits. The 43.2% shift toward walking and cycling among shopkeepers, combined with 27% fewer goods vehicles, demonstrates that pedestrian-friendly design actively curbs motorised trips and their associated emissions.
The consistent 9-12 °C cooling effect from tree shade and the use of the right surface materials shows that thermal comfort can be achieved with thoughtful planning and design.
Across all 10 cities, environmental factors emerged as one of the most valued aspects of Healthy Streets— underscoring that streets designed for people are also streets designed for a healthier, more sustainable urban future.
Healthy Streets deliver cleaner air and long‑term health dividends
AQI 27% BETTER ON HEALTHY STREETS · PM1, PM2.5 AND PM10 22‑23% LOWER
Healthy Streets recorded consistently better air quality across all cities studied. Improved dust control, tree cover, and better street maintenance contributed to substantially lower particulate pollution levels.
Healthy Streets cut emissions, one commute at a time
43% OF HEALTHY STREETS SHOPKEEPERS NOW WALK OR CYCLE TO WORK: 14% MORE WALKING TRIPS
Healthy Streets shift everyday travel behaviour toward walking and cycling. 27% fewer freight vehicles at peak hours contribute to measurable emission reductions.
Healthy Streets improve thermal comfort
SHADE REDUCES FOOTPATH
TEMPERATURE BY ~12°C AND CARRIAGEWAY
TEMPERATURE BY ~9.5°C
62% of users cite shade, greenery, and environmental comfort as key strengths of Healthy Streets.
Healthy Streets lower noise pollution for better health and comfort
AVERAGE 3.7 DB REDUCTION ON HEALTHY STREETS DURING PEAK HOURS
Healthy Streets consistently record lower ambient noise levels during peak hours due to reduced freight traffic, organised parking eliminating idling, and wider footpaths separating pedestrians from vehicular traffic.
Impact numbers from other Indian cities
The impact numbers in this sections is compiled from the ITDP India / MoHUA ‘Streets For People: Pathways of Change from India’s Smart Cities’ publication (2024). The data is based on the information shared by cities.
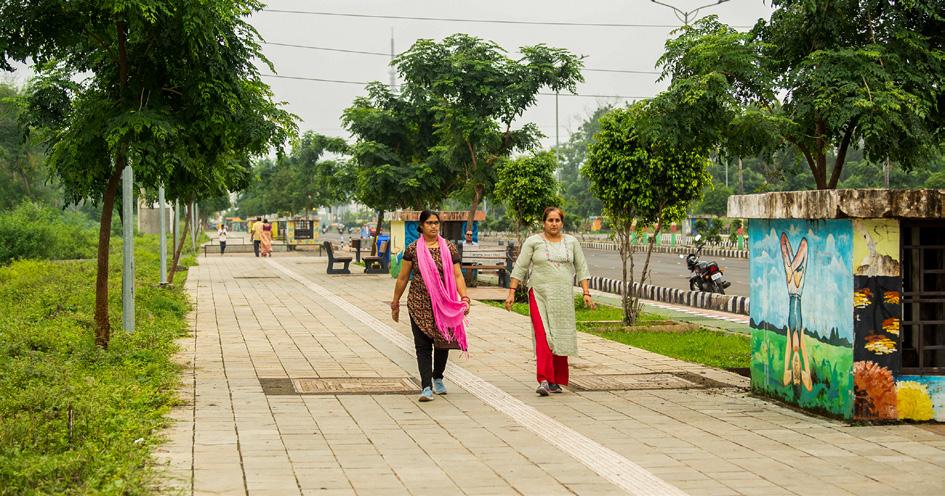
i. ATAL PATH, BHOPAL
• Around 27,500 sq m was reclaimed from vehicular space for Non-Motorised Transport (NMT) infrastructure — footpaths, cycle tracks, and green verges.
• 15% increase in sales for local businesses in the area post implementation of the project.
• Residential property prices saw an increase of 15% over the last few years following the transformation.
Reclaimed Street Space
sq m 15% 15%
*Map for representation purpose only
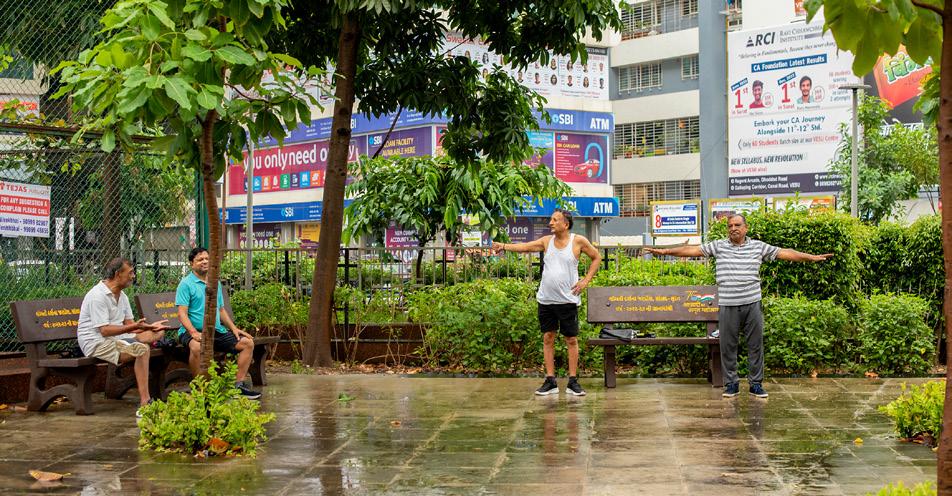
ii. CANAL CORRIDOR, SURAT
• Footfall and recreational activities increased manyfold after implementation. Weekend footfall reaches around 3,000 people per day.
• 75,000 sq m of space was transformed as a linear garden; 7,500+ sq m reclaimed for pedestrians and cyclists.
• The canal corridor project is designed to be self-sustaining — operation and maintenance is funded through revenues from the food zone, advertisement rights, and parking.
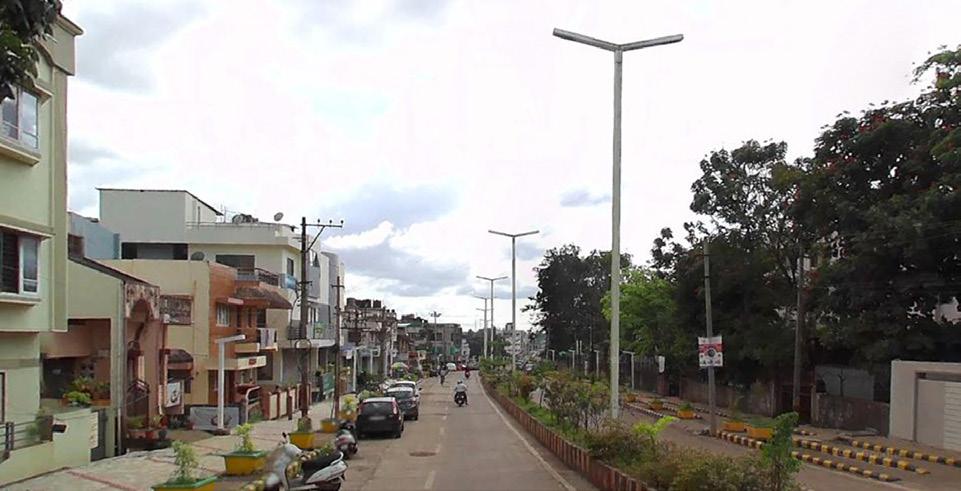
iii. DHARMNATH MARG, BELGAVI
• Cycling count per hour increased from 372 to 425 after the implementation of a dedicated cycle track.
• 4,252 sq m of space reclaimed for pedestrians and cyclists.
• Pedestrian count increased from 970 to 1,050 pedestrians per hour after implementation of a dedicated and seamless footpath.
3,000+ 425 Cyclists/Hr
Weekend Visitors Per Day Growth in Active Mobility
75,000 sq m
4,252 sq m
Urban Green Space Transformed Space Reclaimed for Walking & Cycling Pedestrian & Cycle Infrastructure Added Increased Walking Activity
7,500+ sq m 1,050 Pedestrians/Hr
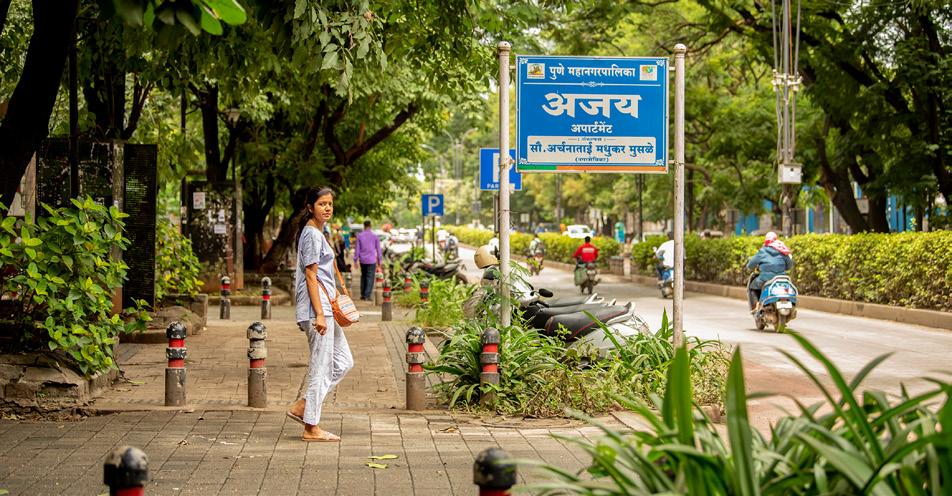
iv. AUNDH STREETS, PUNE
• Pedestrian count has increased from 1,468 to 3,670 per hour — a 2.5x increase.
• Cycling has increased from 546 to 1,290 per hour — a 2.4x increase.
• 12,000 sq m of space reclaimed for pedestrians.
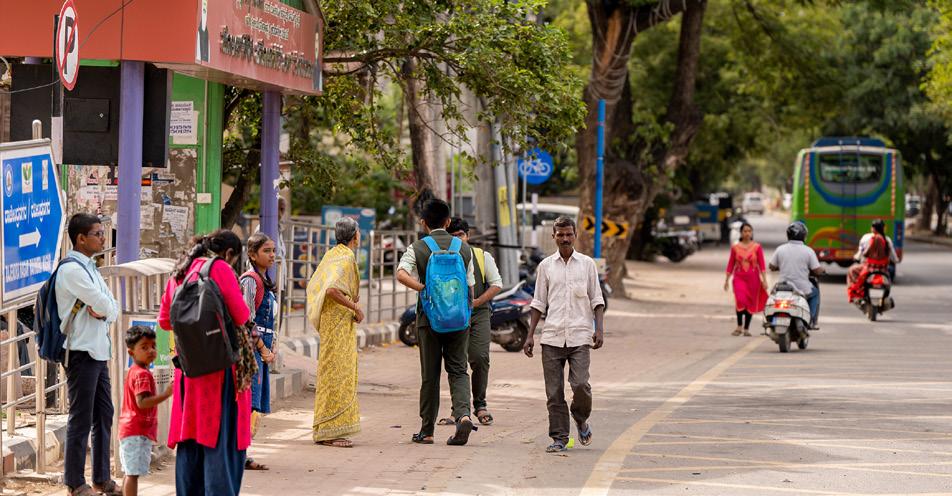
v. CONSERVANCY LANES, SHIVAMOGGA
• Retail shop owners reported an increase in sales of 10–15% from December 2021 compared to the same period in 2019 and 2020.
• Improved quality of life: Public sanitation facilities now widely used, discouraging open urination and defecation.
• Enhanced cleaner and hygienic conditions: Littering and garbage dumping reduced.
• Reduced on-street parking: Many conservancy lanes converted to parking areas at a nominal fee, reducing tendencies of on-street parking.
3,670 Pedestrians/Hr
Increased Walking Activity
1,290 Cyclists/Hr
12,000 sq m
Increased Cycling Activity Space Reclaimed for Pedestrians
10–15% Sales Growth
Increase in Retail Business Activity
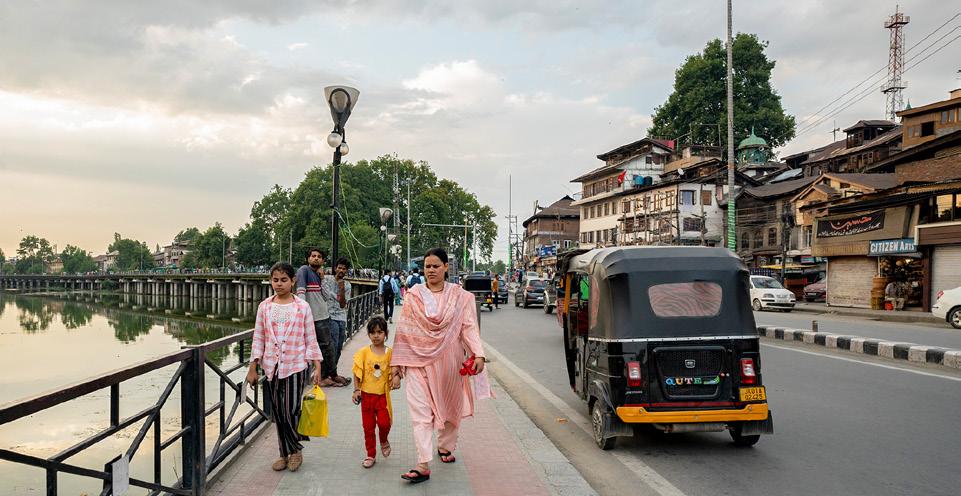
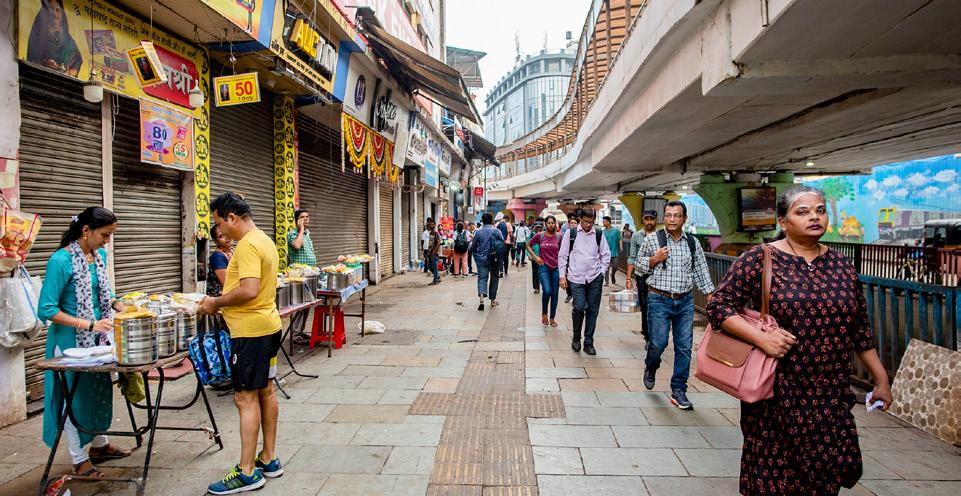
• 6,000 sq m of area reclaimed for pedestrians and cyclists after pedestrianisation.
• The street has become a hotspot for tourists and citizens, substantially increasing footfall. The street has become livelier for shopping and social interactions.
• Revenue generation: The redevelopment has greatly increased shopping activity, boosting the local economy and substantially increasing revenue generation.
6,000 sq m
Space Reclaimed for Walking & Cycling
• Pedestrian footfall has increased significantly — from 2,000 to 6,500 persons per hour.
• People-carrying capacity of the street increased by 4,500 people per hour.
6,500 Pedestrians/Hr
Increased Footfall Activity
4,500 People/Hr
Enhanced People-Carrying Capacity
vi. POLO VIEW STREET, SRINAGAR, JAMMU & KASHMIR
vii. THANE STATION ROAD, THANE
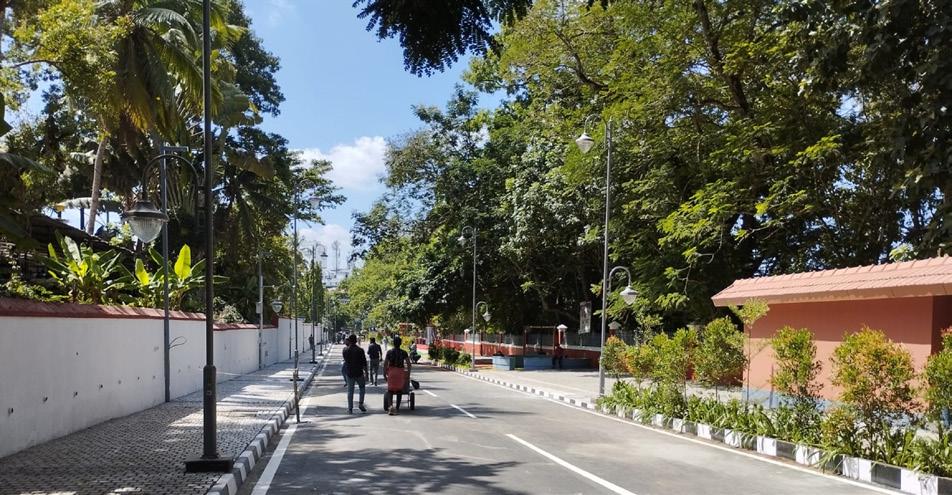
viii. MANAVEEYAM VEEDHI, THIRUVANANTHAPURAM
• Reclaiming 2,340 sq m for pedestrians: the street has witnessed a surge in footfall from 100 counts per hour to 15,000 counts per hour.
• The development has led to a substantial reduction of anti-social activities and substance abuse.
• The street now serves as a creative canvas for differently-abled students to express their art through wall graffiti.
• Enhanced nightlife activities while boosting the local economy.
15,000 Pedestrians/Hr
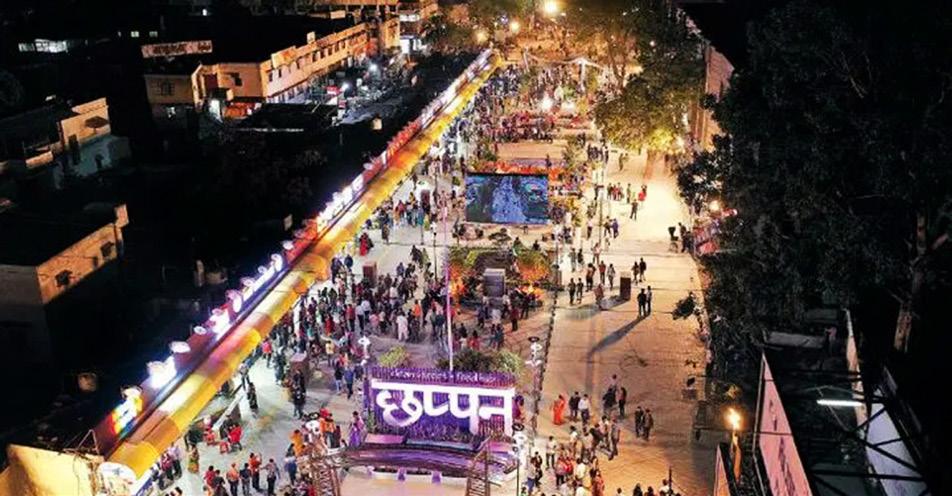
ix. CHAPPAN DUKAN, INDORE
• Daily footfall increased from 6,000 to 15,000 per day — a 2.5x increase.
• Revenue from Chappan Dukan is around 40% of the annual ₹5,000 crore turnover from food markets in the city.
• City stands to gain revenue from a betterment charge (5% of guideline value over 3 years), on-street and off-street parking charges, and a premium on digital advertisement rights for 10 years.
• 4,050 sq m of space reclaimed for pedestrians.
4,050 sq m
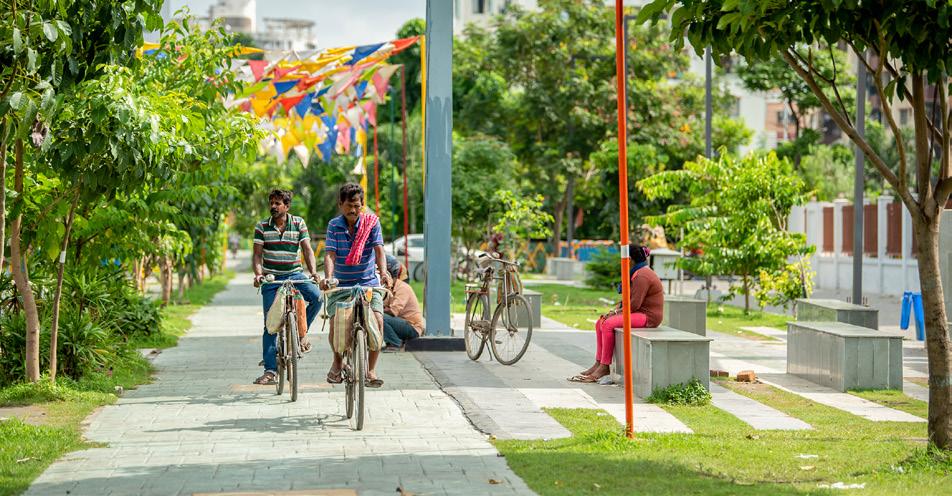
x. STREET 106, NEW TOWN KOLKATA
• Revenue from food truck rentals: around ₹1 lakh on weekdays; over ₹2 lakhs on weekends.
• Footfall: 250–300 persons per day on weekdays, increasing to 1,000–1,500 on weekends.
• 1,275 sq m of space reclaimed for pedestrians and cyclists.
• 1.86% improvement in AQI index; 28.83% reduction in PM10 levels
1. Ahmedabad
Healthy Street: Science City Road | Mixed-use: Institutional, Commercial, Leisure
Typology
Unwalkable Street: Sola Road | Mixed-use: Institutional, Commercial, Transit Corridor
Footpath Carriageway Other Elements
Healthy Streets 13%
Unwalkable Streets
5% on-street parking 5% in poor condition
34% unused shoulder space & 11% on street parking
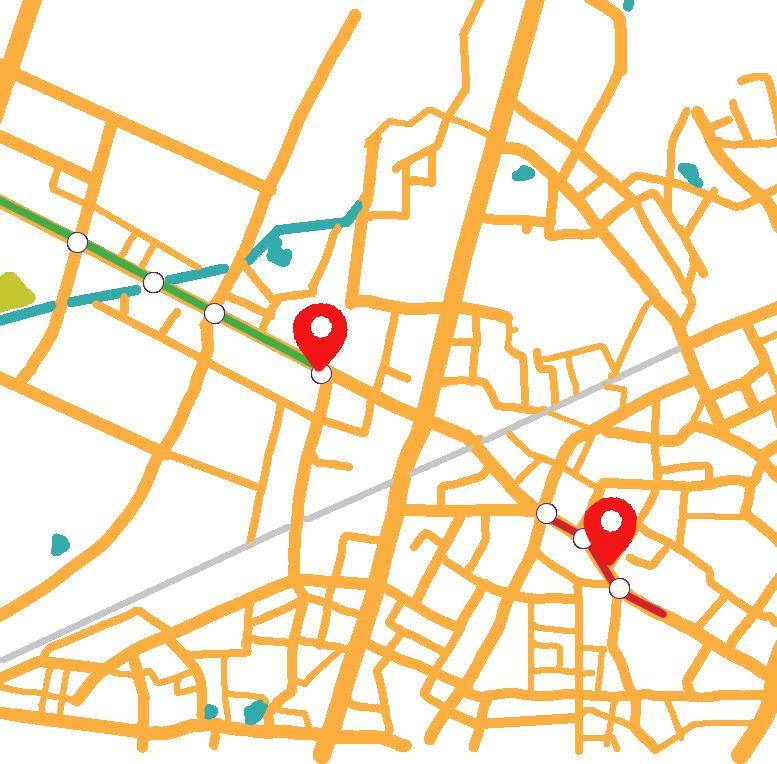
Science City Road allocates 13% of its right of way to footpaths and organises its remaining space, while Sola Road leaves a significant portion as undesigned shoulder space with limited pedestrian provision.
Healthy Street interventions:
footpaths
Economic Healthy Street outpaces by 2.5 times on commercial rents. Healthy Street ₹108/sq ft vs Unwalkable street ₹60/sq ft
Social
9 out of 10 respondents reported feeling safer at night on Healthy Street after the improvements
Environmental
403 trees on Healthy Street vs 64 on Unwalkable street.
2. Bengaluru
Healthy Street:
Church Street | Mixeduse / Commercial: Retail, Hospitality, Leisure
Healthy Streets
Unwalkable Streets
Unwalkable Street: 12th Main Road, Indiranagar | Mixed use: Commercial / Residential
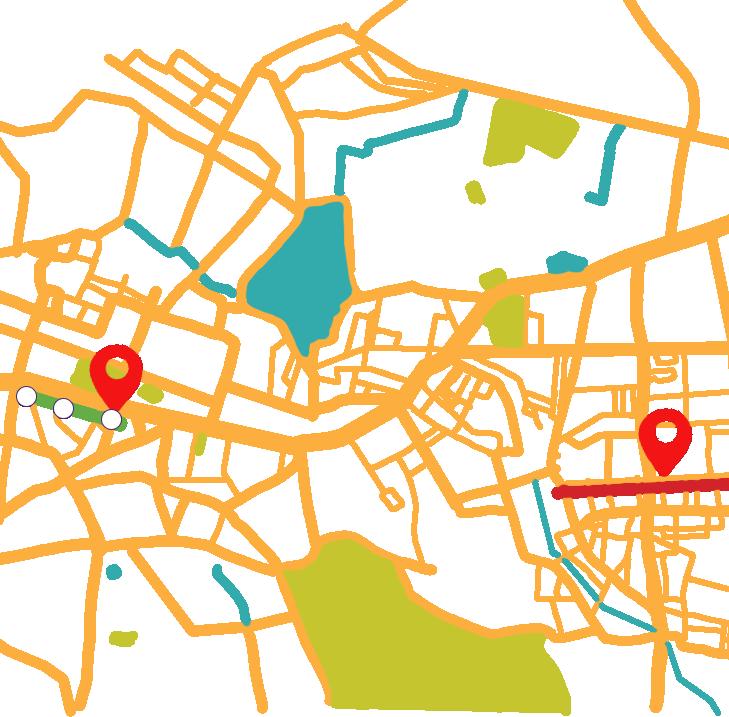
Church street is among the few streets that flips the usual script of cars first. Here, walking space edges out driving space.
Healthy Street interventions:
Economic
Church Street’s commercial guideline value is at ₹21,368/ sq ft driven by postpedestrianisation attracting premium (F&B), branded retail, startups.
Social
The percentage of respondents who witnessed or experienced accidents reduced from 82.2% on the Unwalkable street to 48.5% on the Healthy Street.
Environmental
7% of the RoW in the Unwalkable street is consumed by informal parking which Healthy Street converts to green buffers and pedestrian use.
3. Bhubaneswar
Healthy Street: Smart Janpath | Mixeduse: Retail Commercial | Institutional | Hospitality
Typology
Healthy Streets
Unwalkable Streets
Unwalkable Street: CuttackPuri Road | Arterial Mixed use: Retail Commercial | Institutional | Hospitalityl
26% 42% & 7% service lane
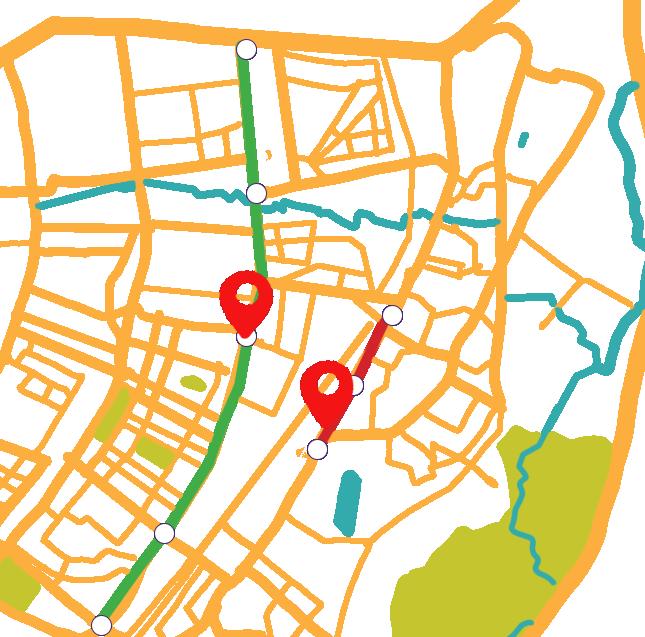
8% cycle track, 7% furniture zone, 5% designated vending, 3% on-street parking 2 % utilities corridor
0% 54% 33% unused shoulder space & 13% for on-street parking and storm water drain
Healthy Street interventions:
Smart Janpath distributes its right of way across seven distinct uses including cycle tracks, vending zones, and a utility corridor, reflecting a comprehensive approach to street space allocation.
Economic
Commercial rents fare ₹79.8/sq ft in the Healthy Street vs ₹34.6/sq ft in Unwalkable street — 131% premium driven by walk and cycle friendly infrastructure.
Social
Nearly 9 in 10 public transport users reported feeling safe on the Healthy Street, compared to only 5 in 10 on Unwalkable street
Environmental
Smart Janpath road has 150 trees per km – a striking contrast to the Unwalkable street which has only 14 trees per km
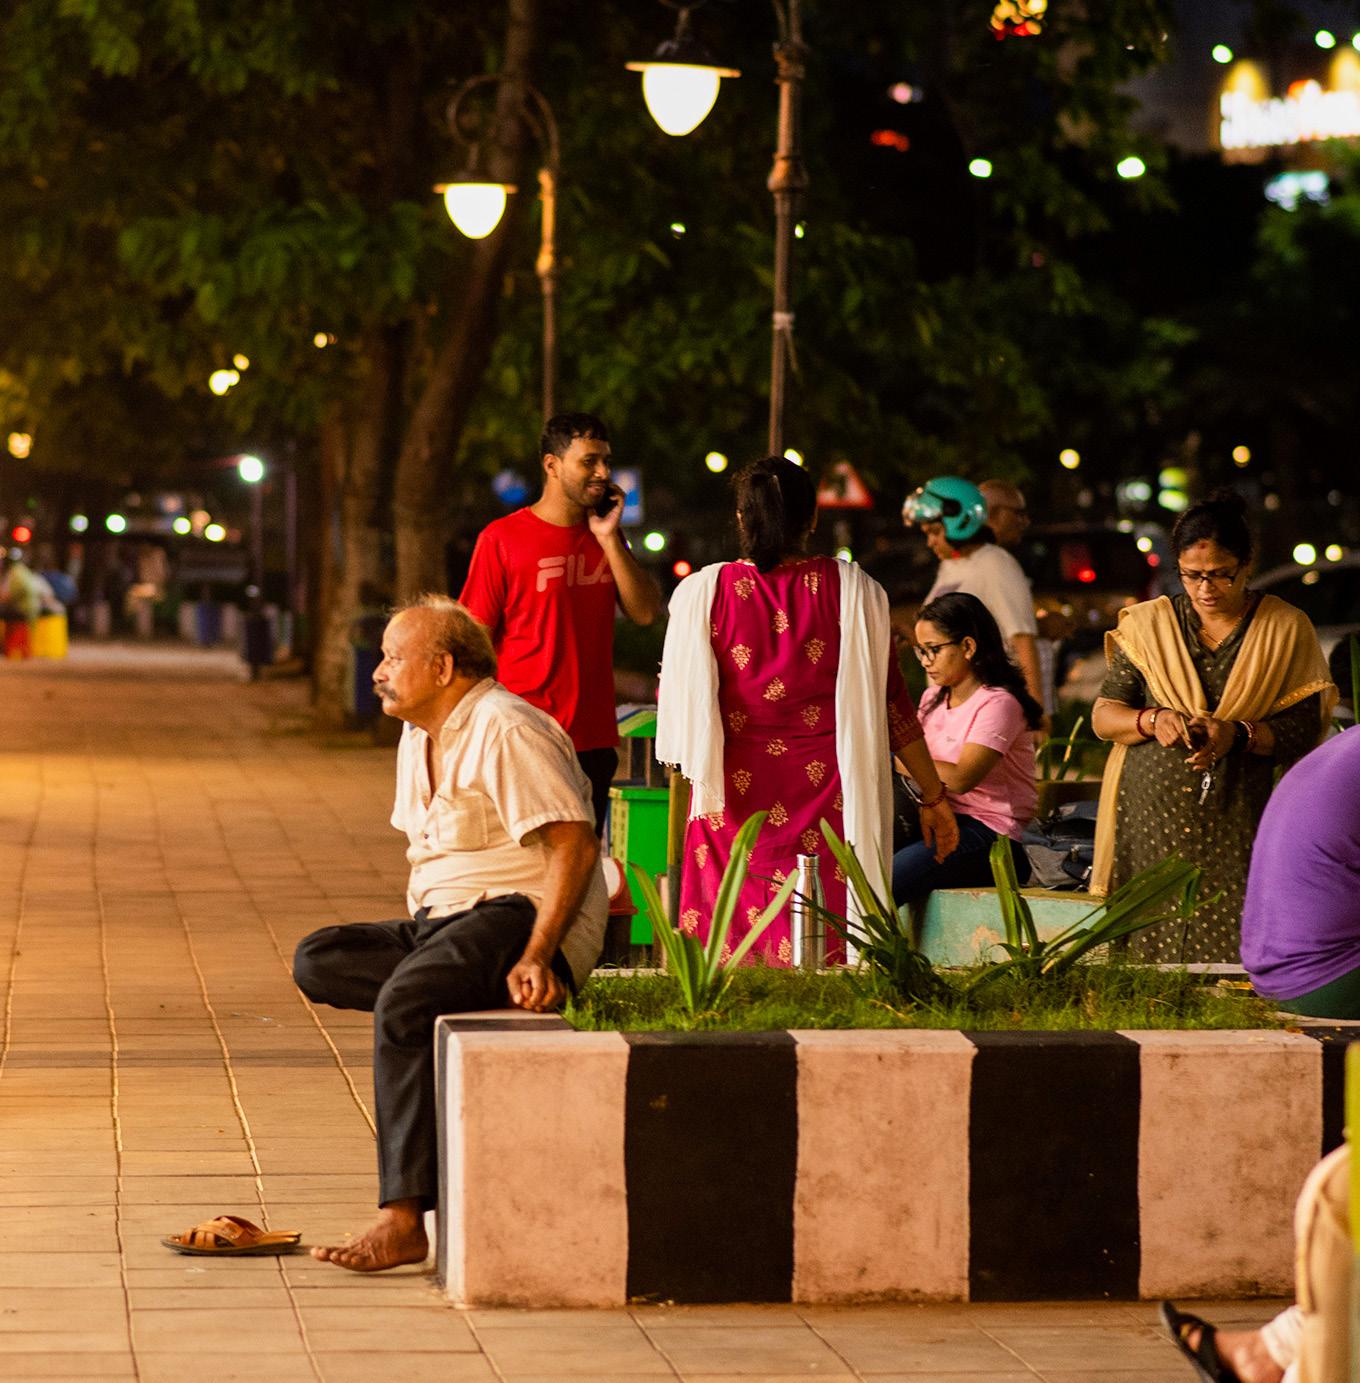
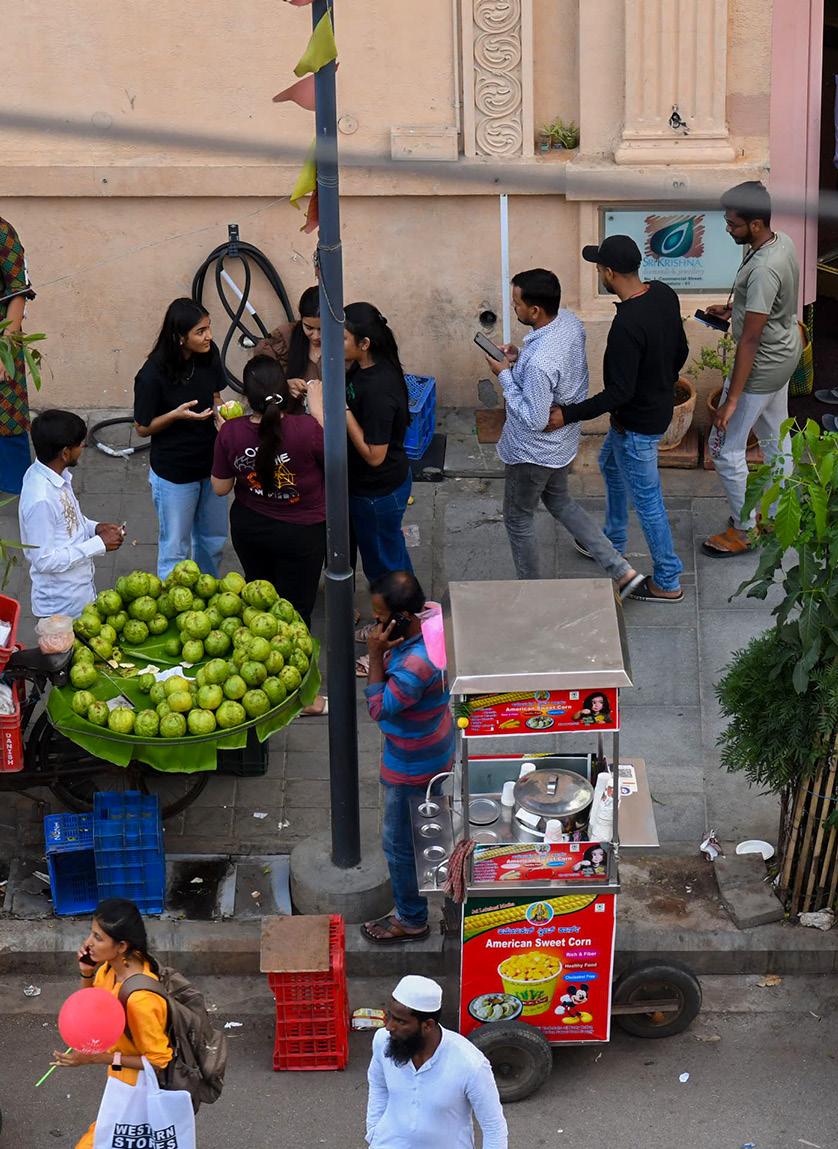
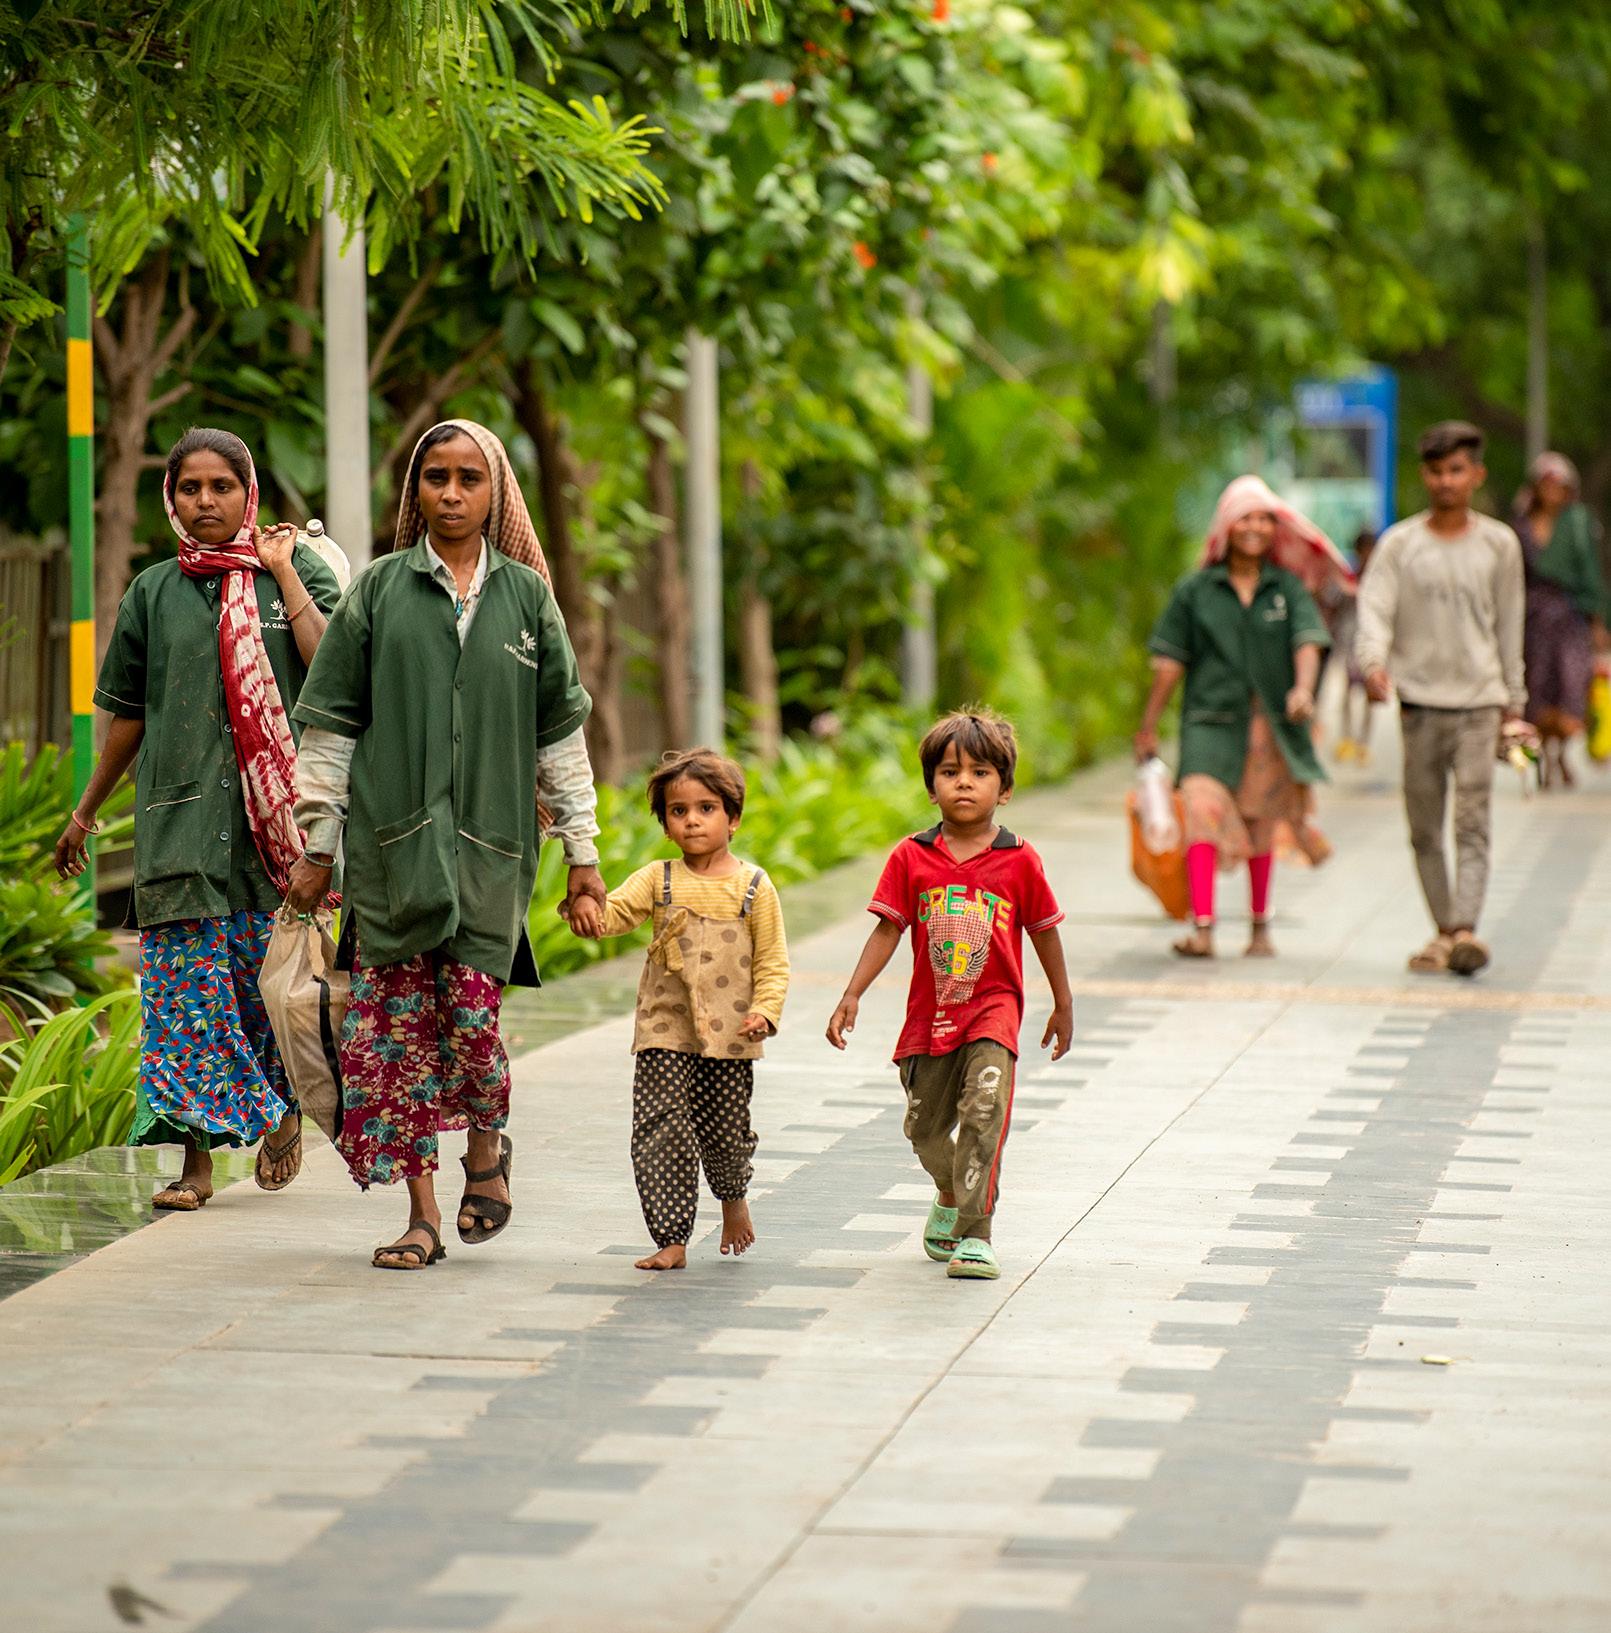
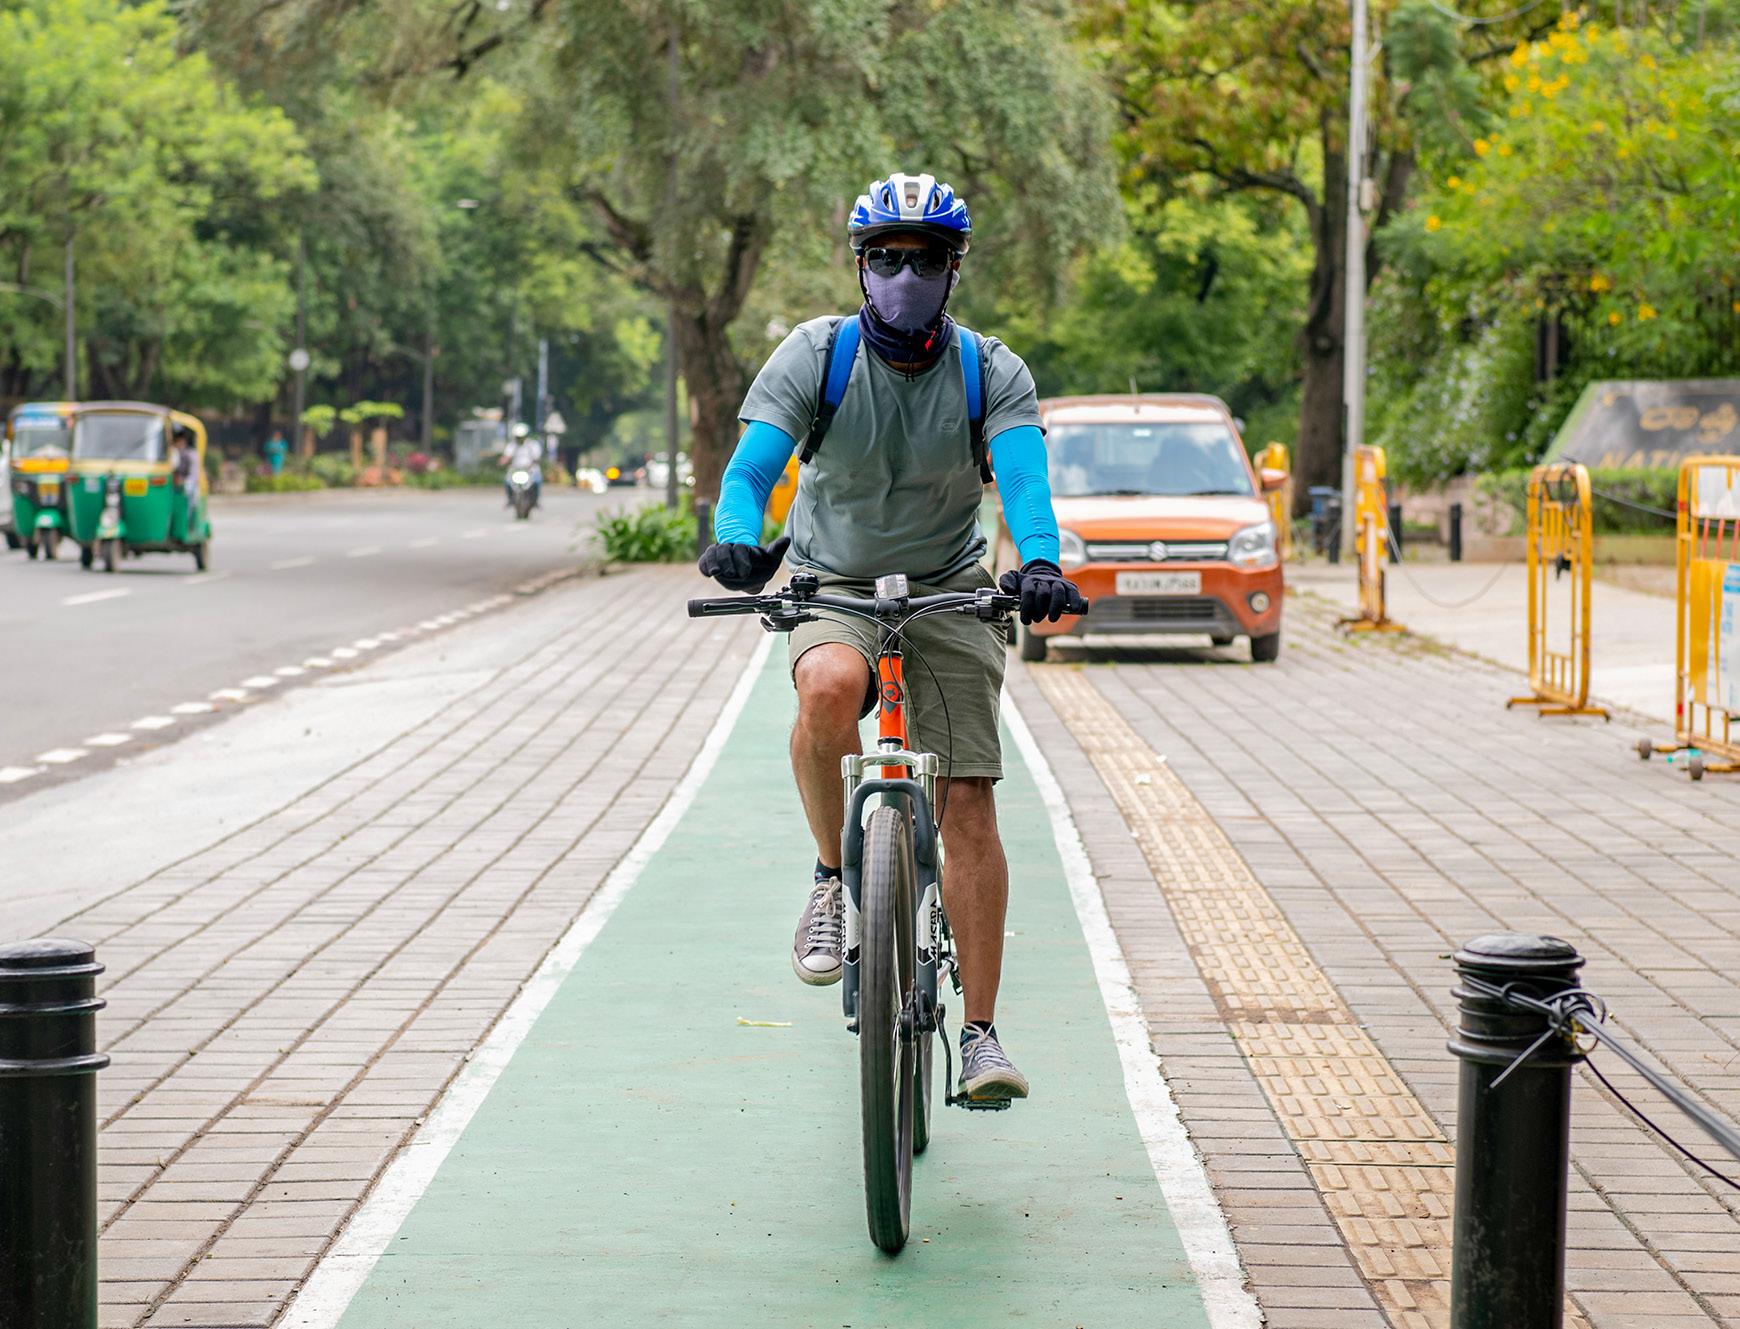
BHUBANESWAR
4. Chennai
Healthy Street:
Pedestrian Plaza, Pondy Bazaar | Mixed use: Commercial/Retail
Typology
Healthy Streets
Unwalkable Streets
Unwalkable Street: South Usman Road | Mixed use: Commercial/ Retail
Footpath Carriageway Other Elements
Healthy Street interventions:
Economic
Commercial rents are driven by the pedestrian infrastructure for Pondy Bazaar: ₹64/sq ft for retail spaces to ₹200/ sq ft for high-end showrooms, whereas Unwalkable street is at ₹46/sq ft.
Pedestrian Plaza
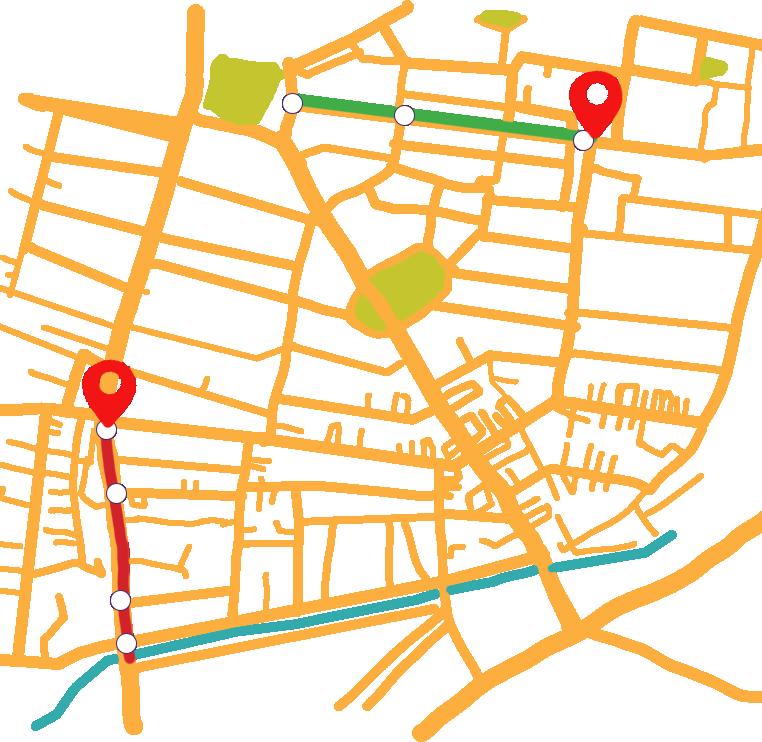
South Usman Road
Pondy Bazaar and South Usman Road sit within the same T. Nagar neighbourhood, yet their right of way allocation reflects fundamentally different priorities, 60% pedestrian space on the former against 81% carriageway on the latter.
Social
Around 9 in 10 respondents report feeling safer while crossing the Healthy Street, compared to less than 5 in 10 on the Unwalkable street
Environmental
Pondy Bazaar recorded a 20.9% reduction in noise levels during the morning peak hour, compared to the Unwalkable street, mainly due to reduced traffic-related noise
5.Coimbatore
Healthy Street: Diwan Bahadur (DB) Road | Commercial/ Retail
Typology
Healthy Streets
Unwalkable Streets
in
Unwalkable Street: Mettupalayam Road | Mixed use: Commercial/Retail | Residential

DB Road allocates over a third of its right of way to footpaths. Mettupalayam Road, by contrast, leaves the equivalent space as an undesigned shoulder, with pedestrian infrastructure accounting for just 1.5% of its width.
Healthy Street interventions:
Adequate footpaths
Economic
Commercial rents in the Healthy Street are at ₹90/ sq ft showing a 70% premium over Unwalkable street
Social
87% of users perceived the Healthy Streets as safer for children, compared to 30.5% on Unwalkable street
Organised underground utilities
Environmental
Average AQI drop from 243 in Unwalkable street to 114 in the Healthy Street, the highest reduction observed across all 10 cities
6. Gangtok
Healthy Street: MG Marg | Commercial/Retail
Typology
Healthy Streets
Comparator Street
Comparator Street:
Singtam Chungthang Road
(The stretch from MG Marg junction to Pani House Road junction) | Commercial/Retail
Footpath Carriageway Other Elements
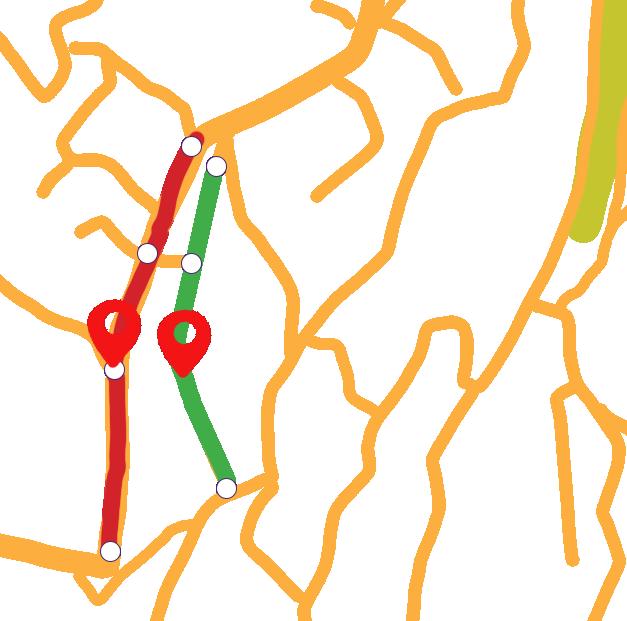
MG Marg represents a complete reallocation of street space — the entire right of way is given over to pedestrian use, with no carriageway provision for private vehicles
Healthy Street interventions:
Fully pedestrianised
management
Amenities
Economic
Commercial rents in MG Marg are at ₹151/sq ft: 228% above Unwalkable street (₹46/sq ft)
Social
98.8% of street users in the Healthy Street reported feeling safe in terms of law and order, compared to 61.6% in the Unwalkable street
Environmental
PM2.5 and PM10 levels are lower by 38-40% in the Healthy Street compared to the Unwalkable street, the highest reduction observed across all 10 cities
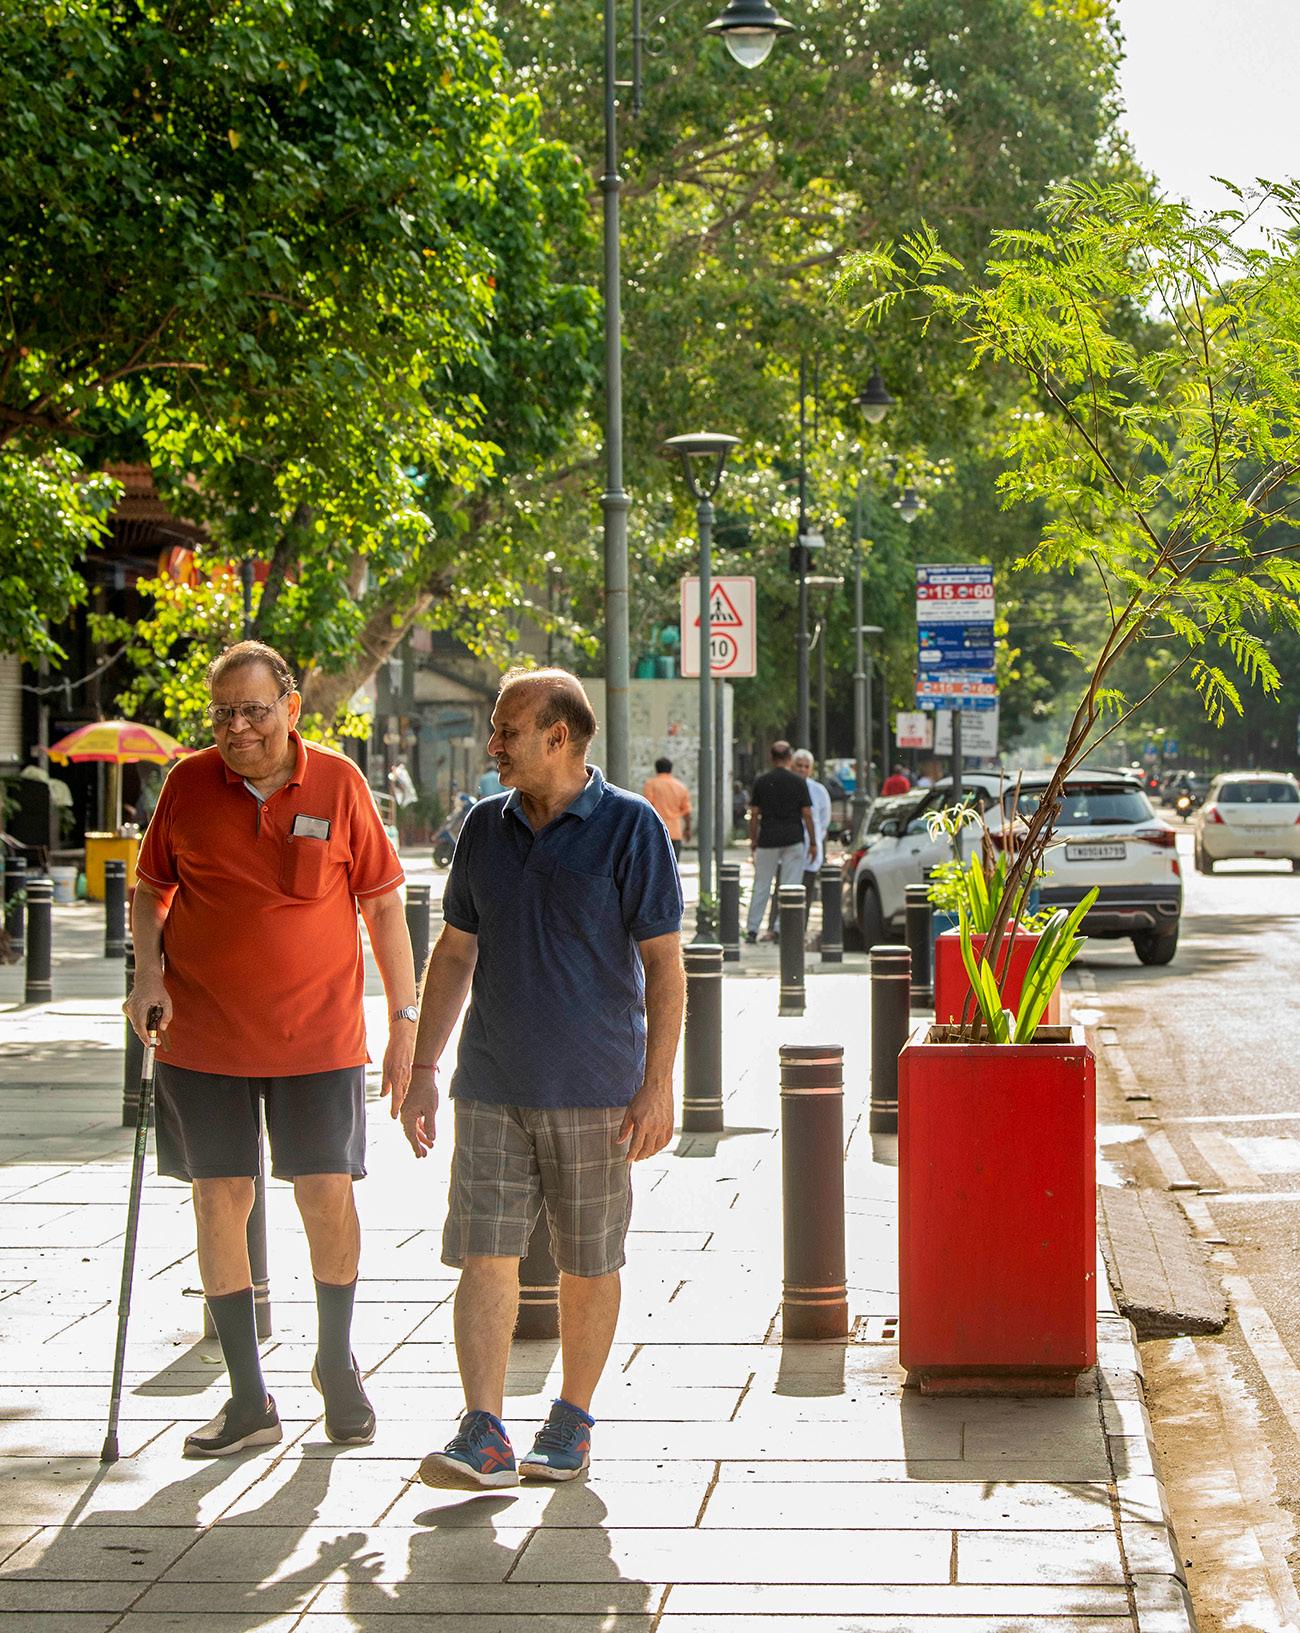
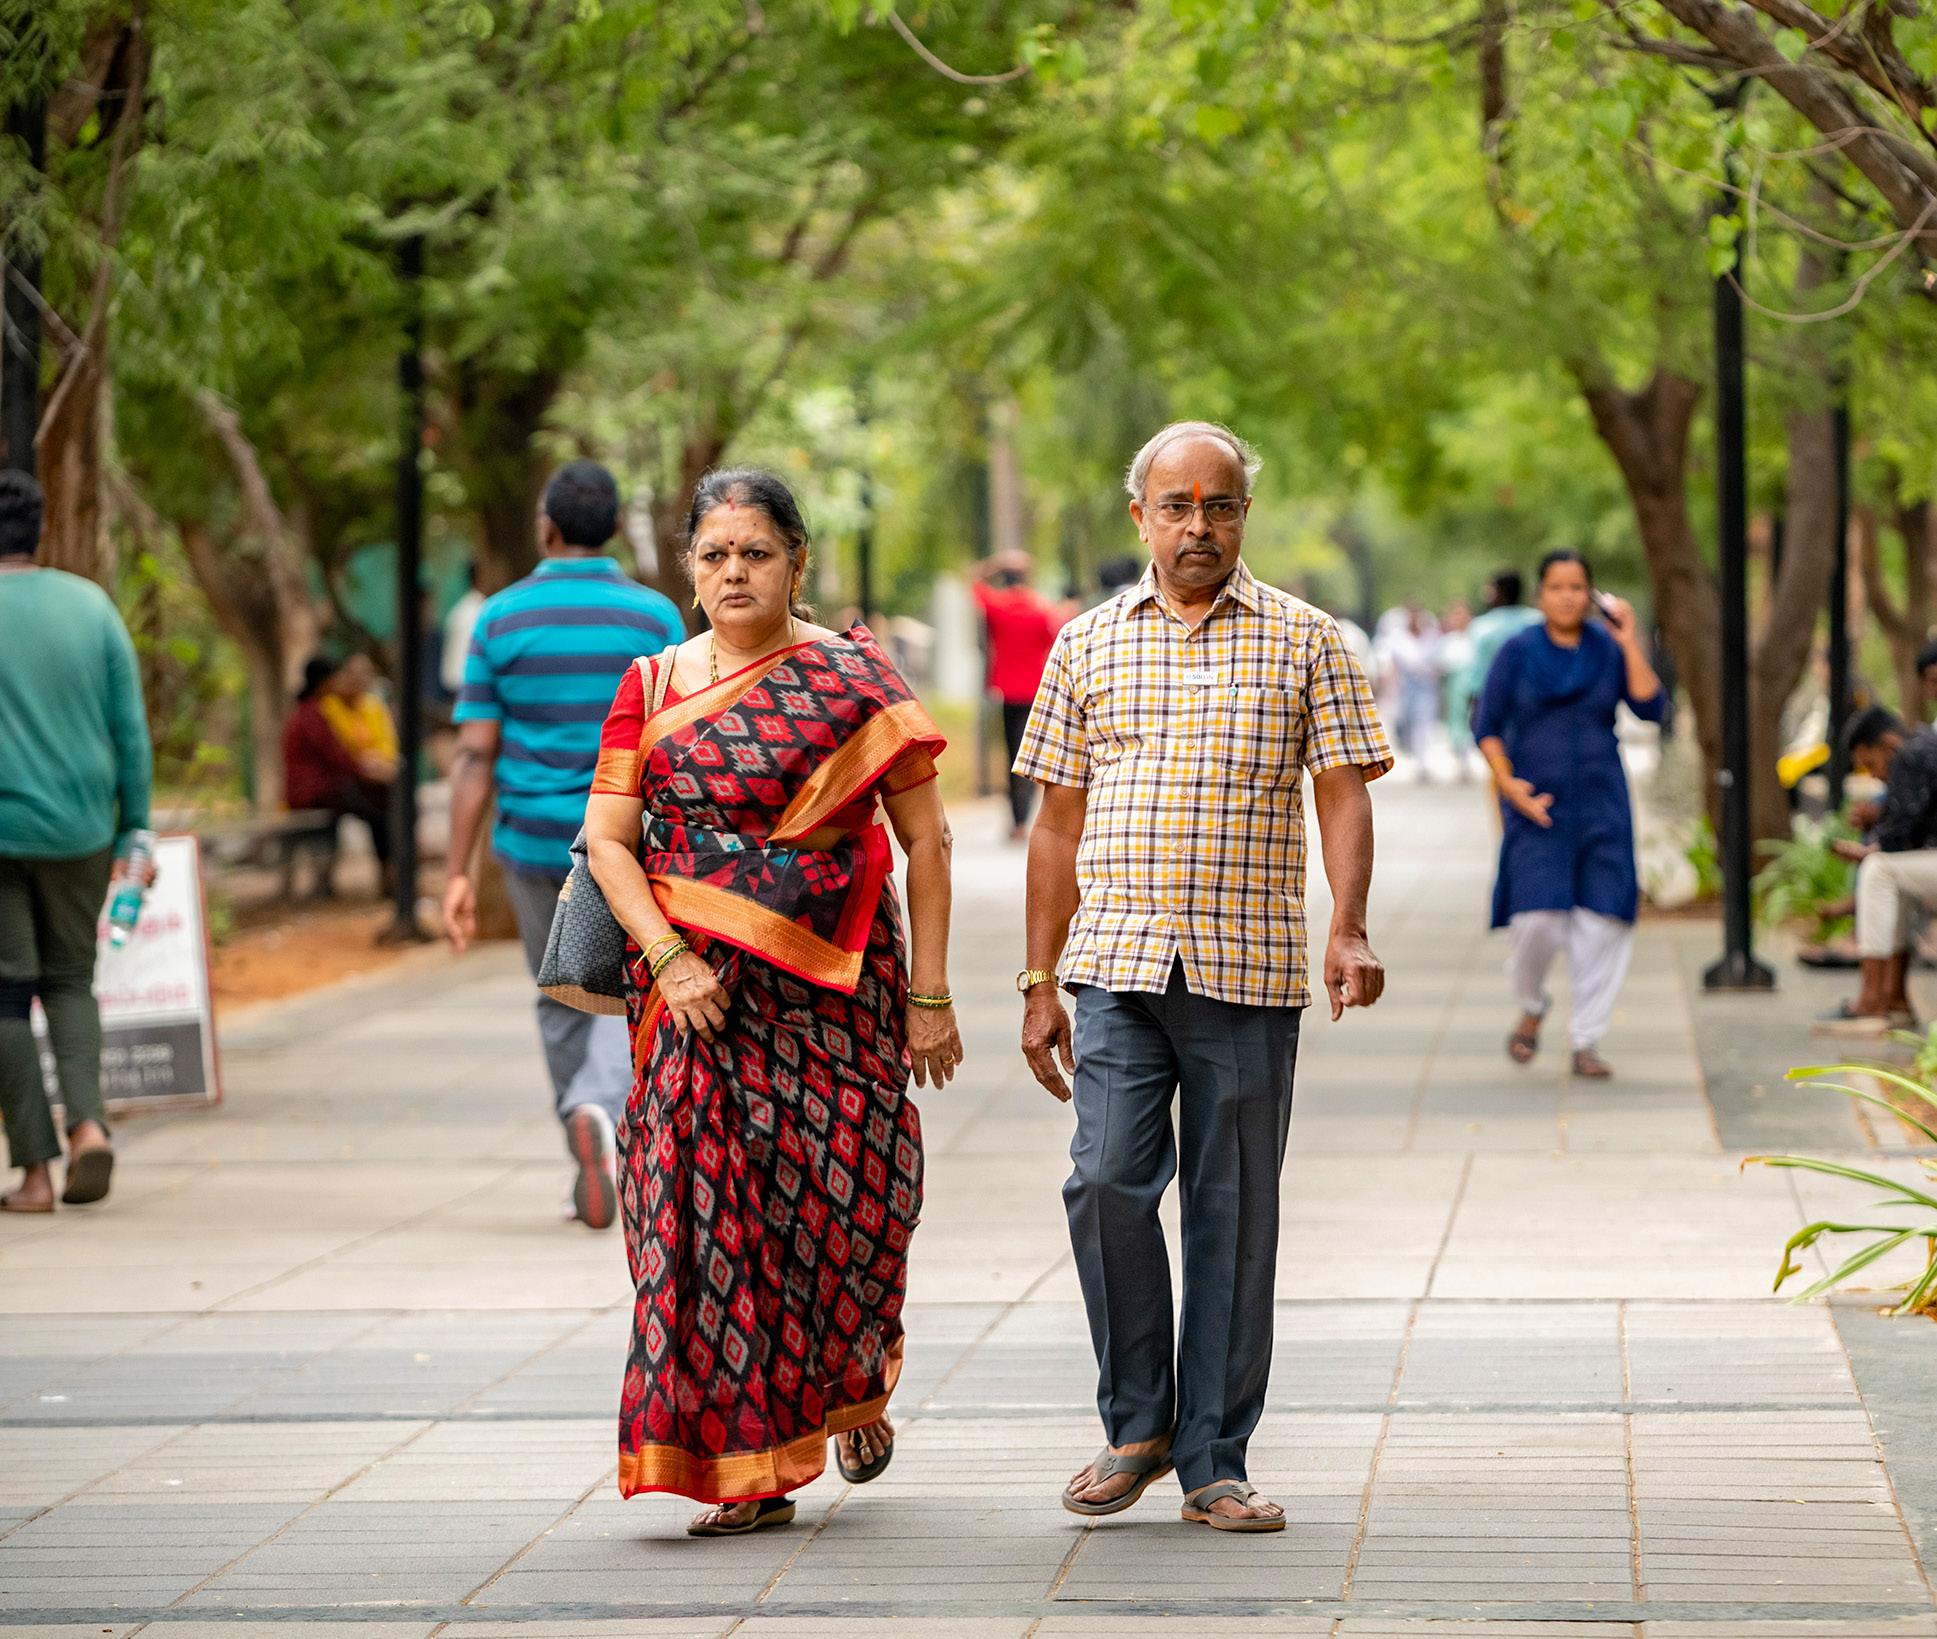
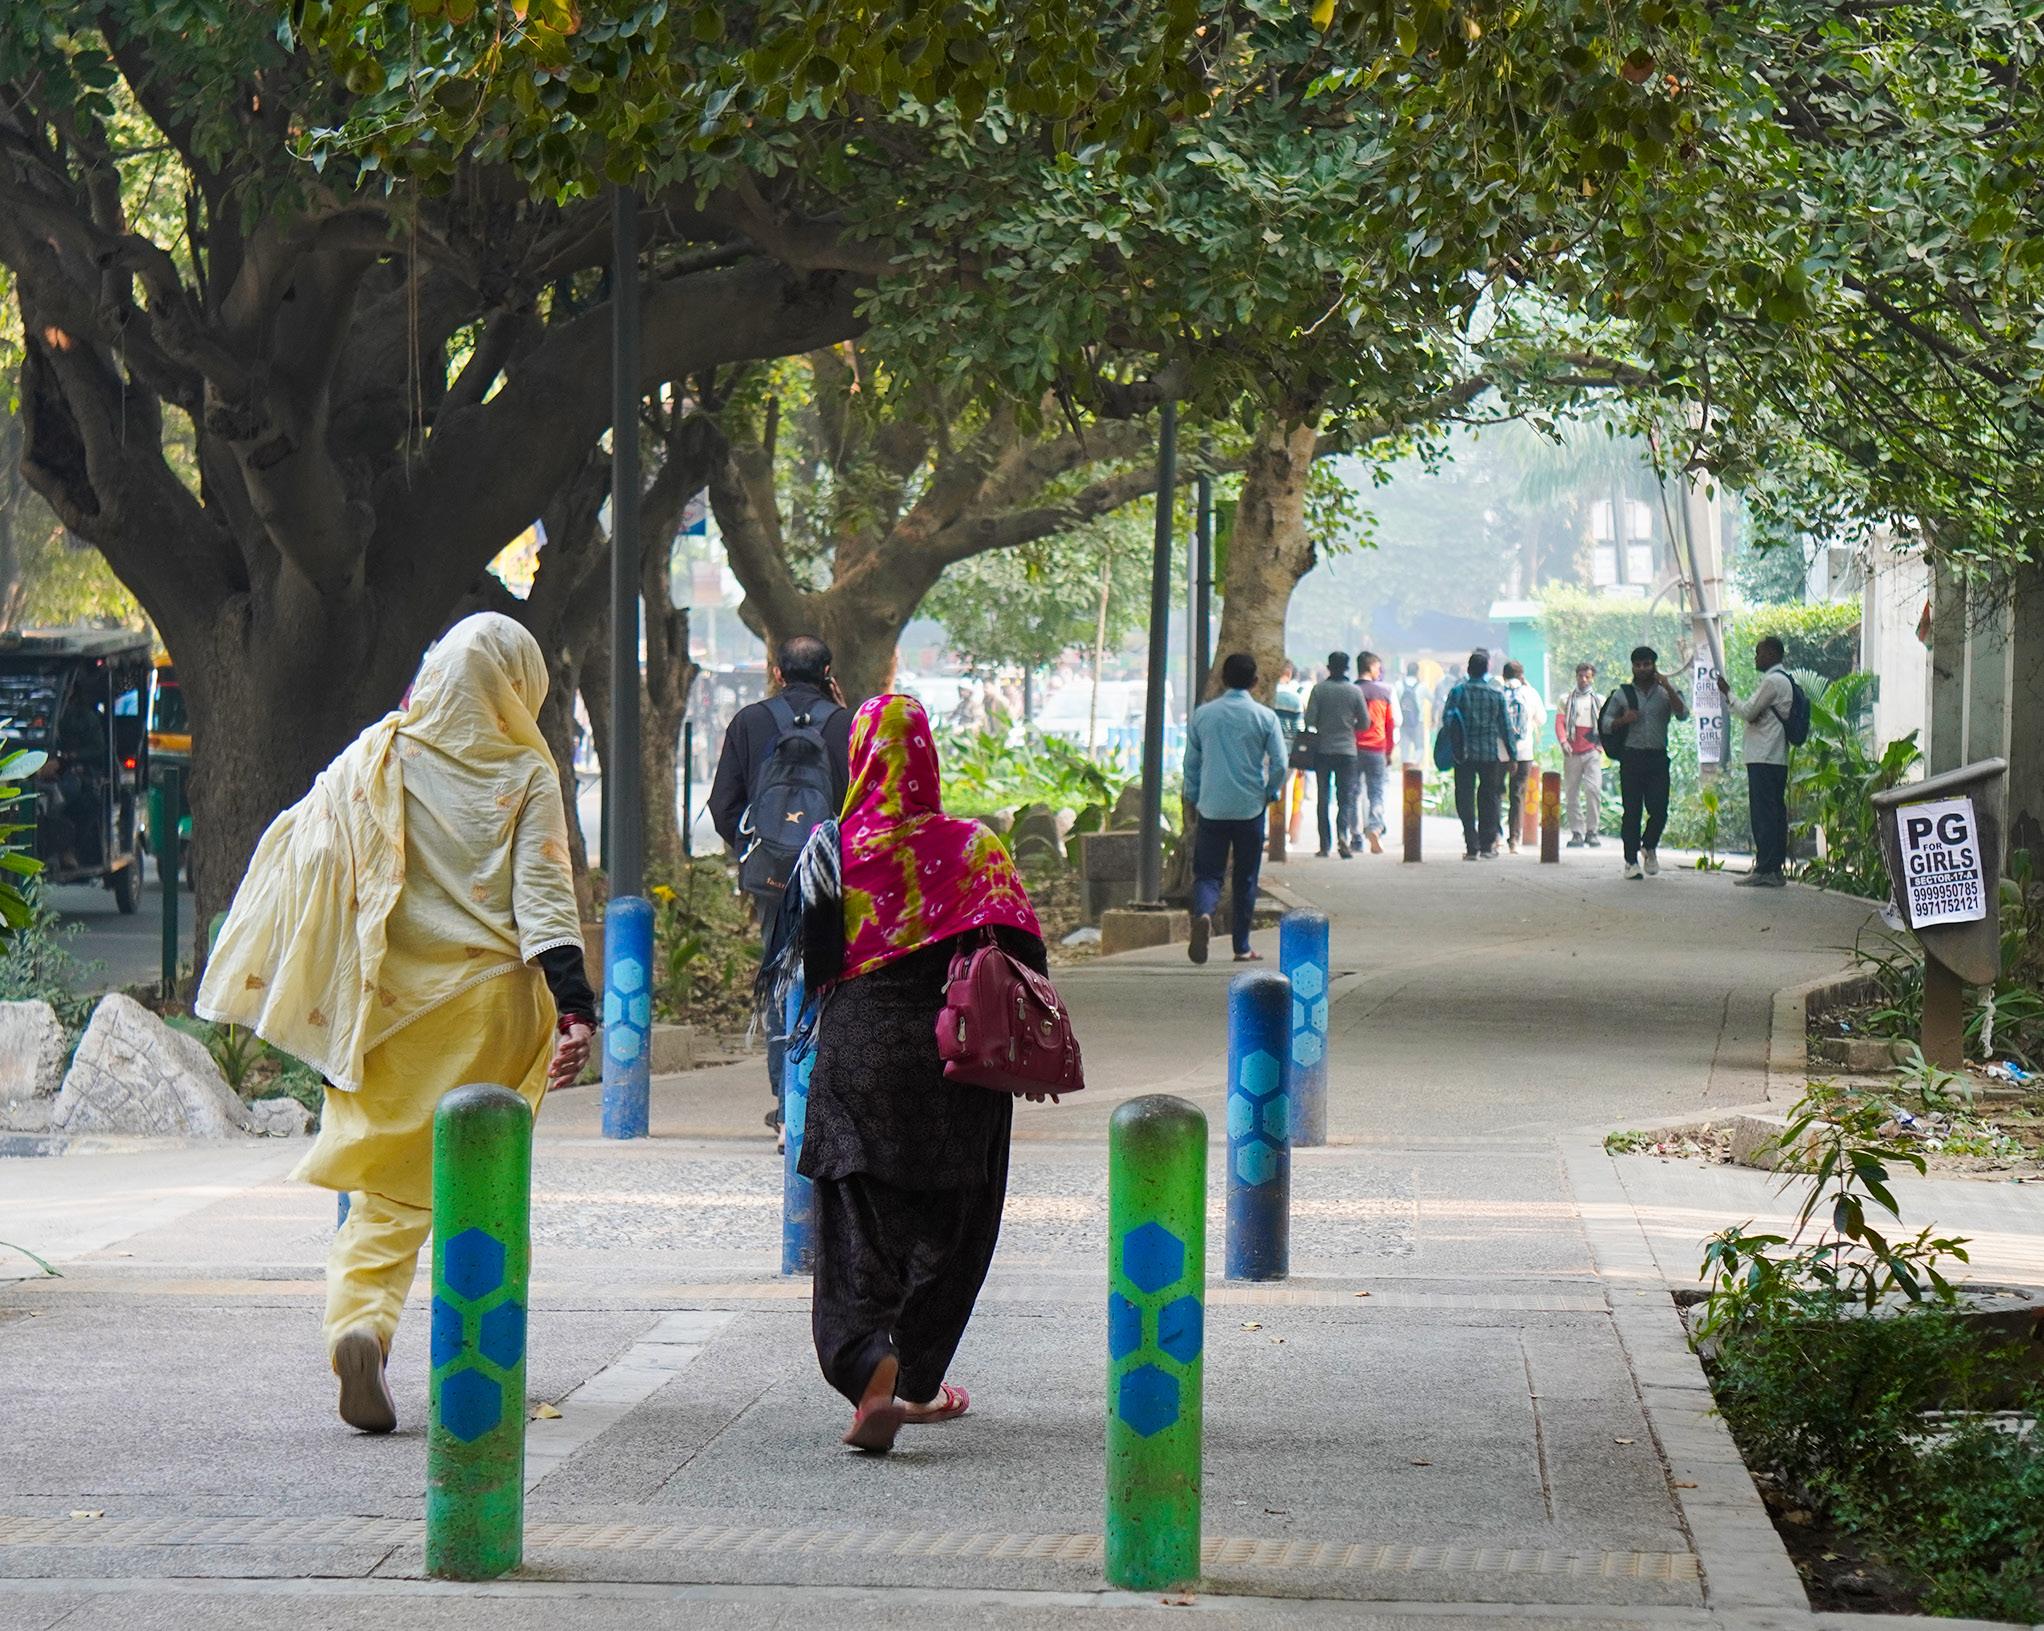
GURUGRAM
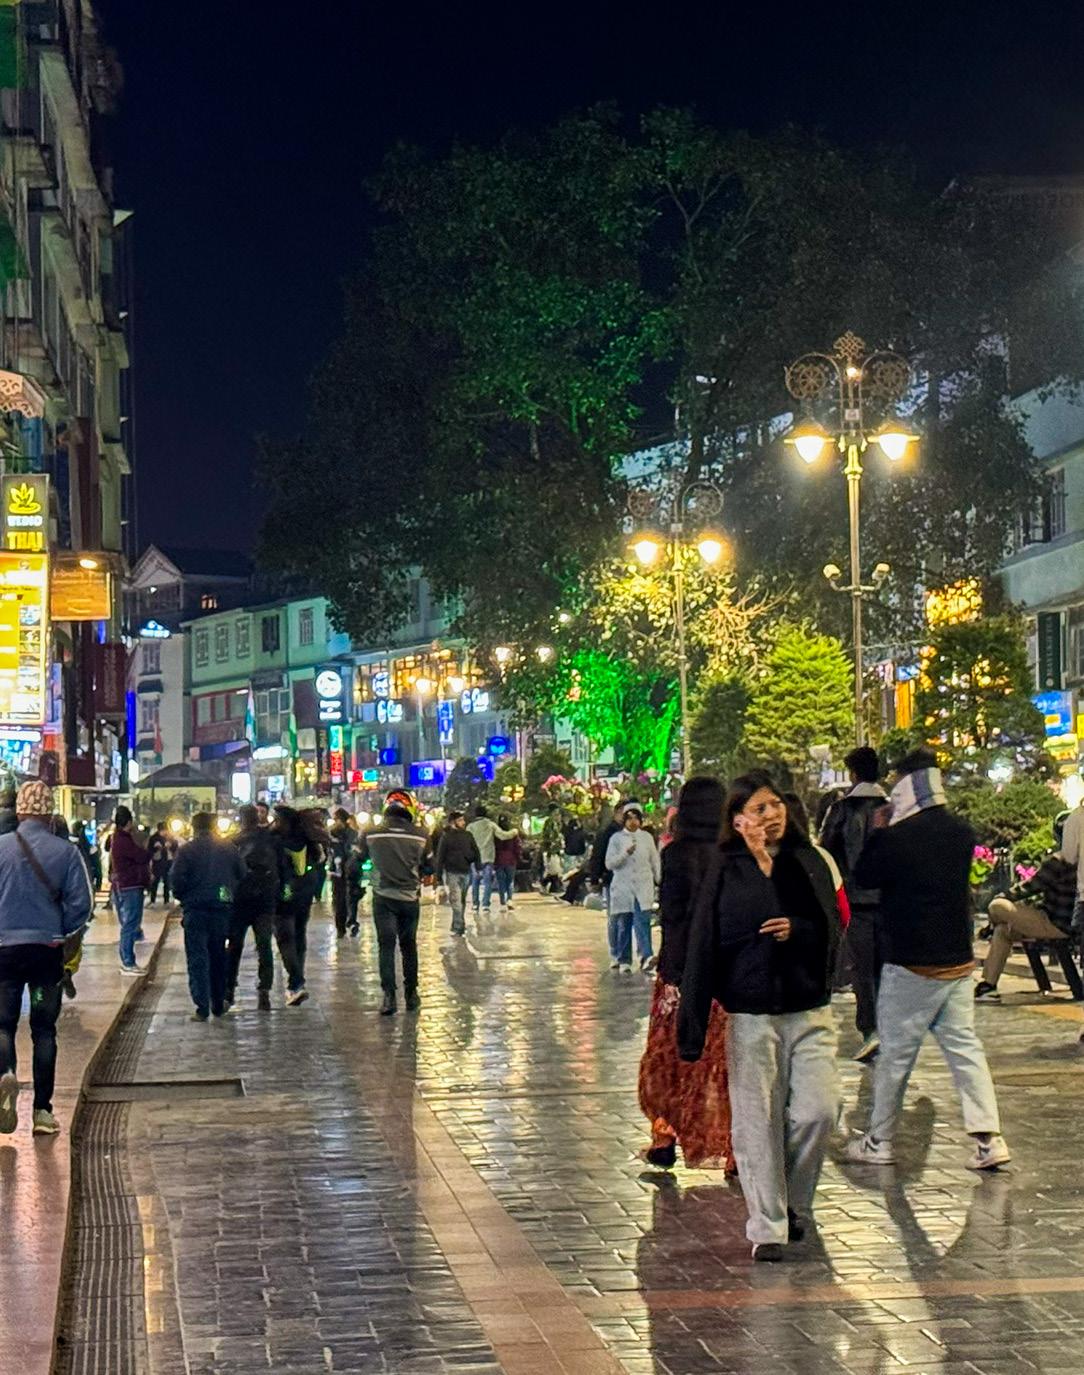
CHENNAI
7. Gurugram
Healthy Street:
Sub. Major Laxmichand Road | Mixed-use:
Institutional/Commercial
Typology
Healthy Streets
Unwalkable Street:
Rao Gajraj Singh Marg | Mixed use: Institutional/ Commercial
Rao Gajraj Singh Marg
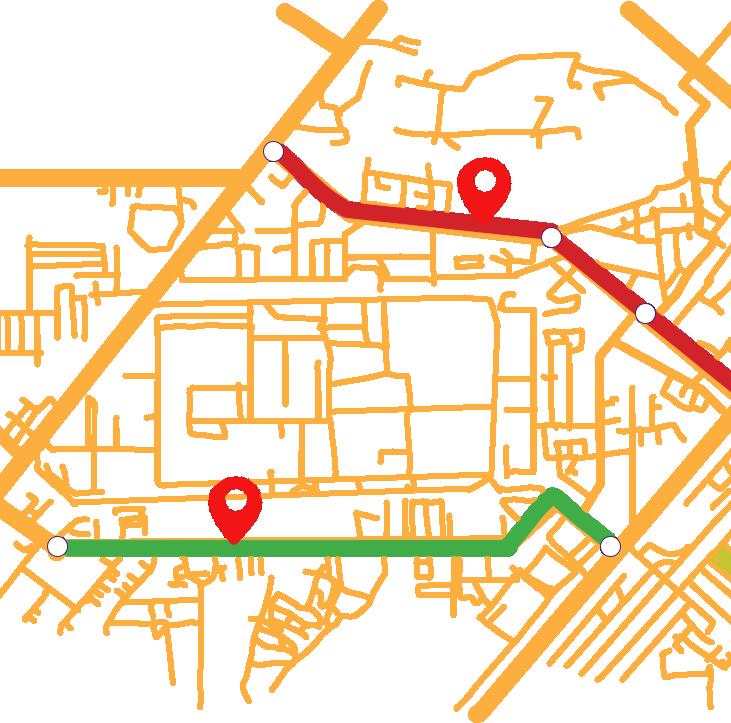
Footpath Carriageway Other Elements
26% 33% 24% green buffer, 17% swales 0% 42% 19% parking, 39% unused, shoulder space
Healthy Street interventions:
Unwalkable Streets Green buffers/ Swales
Economic
Both streets had identical circle rates in 2022-23. Divergence coincides directly with infrastructure improvements; the Healthy Street’s circle rates grew 20% in 2023-24 onwards, double the 10% annual growth on the Unwalkable street
Laxmichand Road Enforcement for pick-up and drop off bays
Social
95% of street users reported a positive overall experience in the Healthy Street, compared to 59% in the Unwalkable street
Sub. Major Laxmichand Road integrates green infrastructure as a core design component, with buffers and swales accounting for 41% of the right of way alongside dedicated footpath space.
Environmental
The Healthy Street has consciously used 11700 tonnes of Construction and Demolition (C&D) waste for base work, seating and paving.
8. Kochi
Healthy Street: Shanmugham Road-Park Avenue
| Mixed-use: Commercial / Residential/Recreational
Typology
Healthy Streets
Unwalkable Streets
Unwalkable Street: MG Road | Mixed use: Retail Commercial/ Institutional
road-Park avenue MG Road
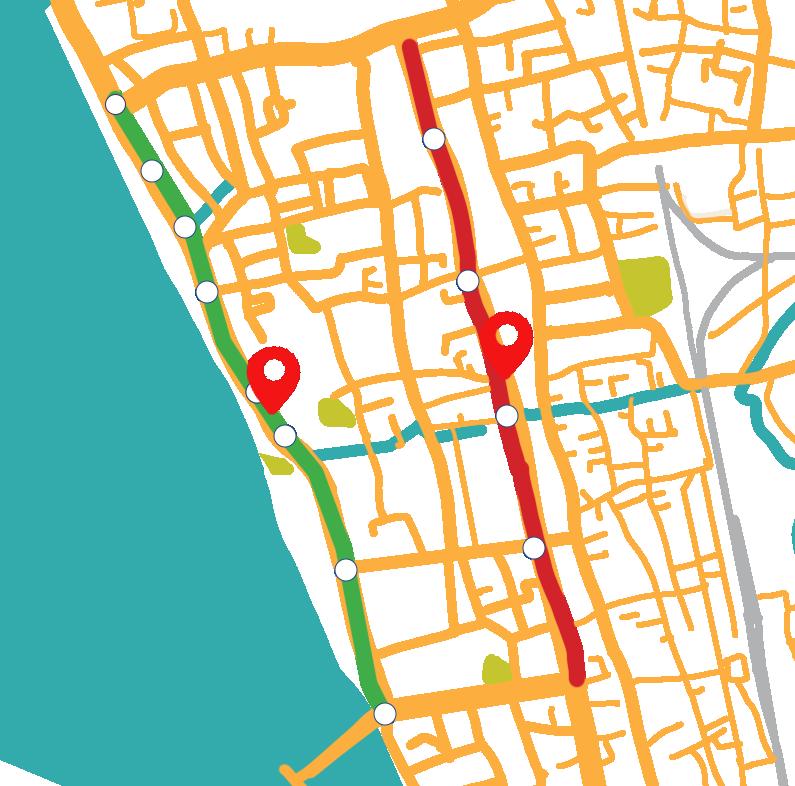
23% 70% 7% on-street parking 11% in poor condition 67% 3% parking, 19% unused, shoulder space
Healthy Street interventions:
Economic
Cycle tracks
5-year apartment appreciation 60% (Healthy Street) vs 36% (Unwalkable street). Investor confidence measurably higher on the Healthy Street despite MG Road having higher guideline values.
Social
9 in 10 Healthy Street users reported feeling safe at night, compared to only 5 in 10 in Unwalkable street
Shanmugham road-Park Avenue allocates 23% of its right of way to footpaths. MG road, despite having a comparable overall width, allocates less than half of that to pedestrian space, with a significant portion left as undesigned shoulder.
Environmental
96 trees on the Healthy Street vs zero on the Unwalkable street.
9. Pimpri Chinchwad
Healthy Street: Linear Garden Road | Mixed-use: Residential/ Recreational
Typology
Healthy Streets
Unwalkable Streets
Unwalkable Street: Nashik Road | Mixed use: Transit Corridor
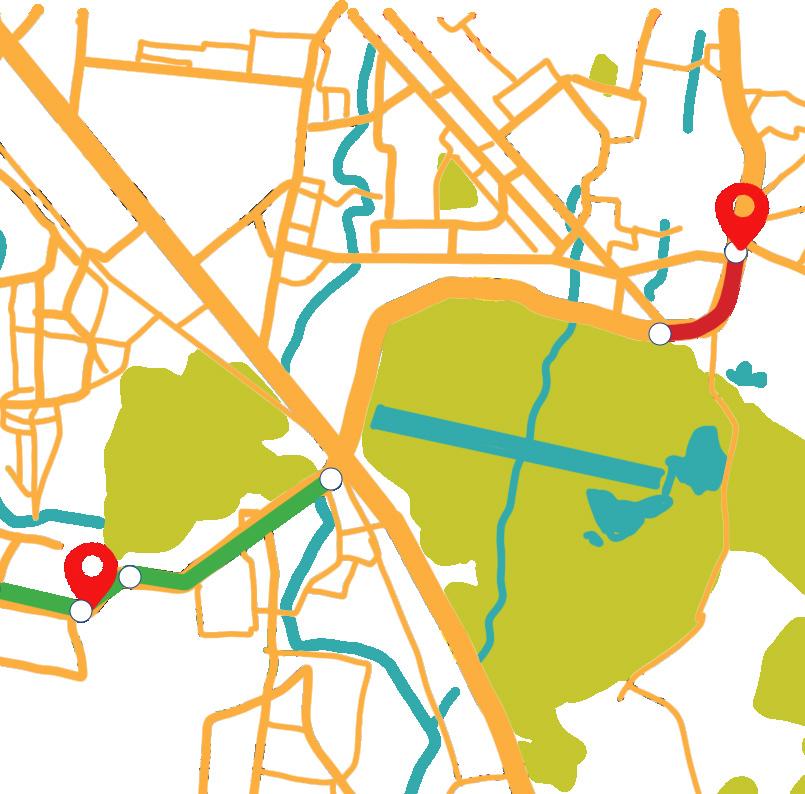
Footpath Carriageway Other Elements
8% cycle track, 5% on-street parking, 4% green buffer
8% in poor condition
Healthy Street interventions:
27% unused shoulder space, 4% parking
Economic
Unwalkable Street’s 10year property appreciation (12.4%) trails the Healthy Street (42.3%) by 3×. The divergence is structural — driven by the Linear Garden park and quality footpath infrastructure, not macro demand alone.
Social
Nearly 48% of street users in the Healthy Street reported fitness activities such as walking and using outdoor gym facilities as their primary purpose of visit.
The Linear garden road allocates dedicated space to footpaths, cycle tracks, parking, and green buffers, while the comparable Nashik Road leaves 27% of its right of way as undesigned shoulder.
Environmental
38,000 sq m space from the park and front margins of the private properties were incorporated into the public realm to increase the available pedestrian space.
Nashik Road
Linear Garden Road
10. Srinagar
Healthy Street: Lal Chowk | Retail Commercial/ Recreational
Typology
Healthy Streets
Unwalkable Streets
Unwalkable Street: Rajbagh Hospital Bund Road | Mixed use –Commercial/Residential
Footpath Carriageway Other Elements
38% 50% 3% on-street parking, 9% vending
78% 3% parking, 19% unused, shoulder space
Healthy Street interventions:
Economic
Commercial Property
Appreciation: ₹58,532/ sq ft (Healthy Street) vs ₹32,407 (Unwalkable street) — an 81% premium driven by street improvements under the same macro context.
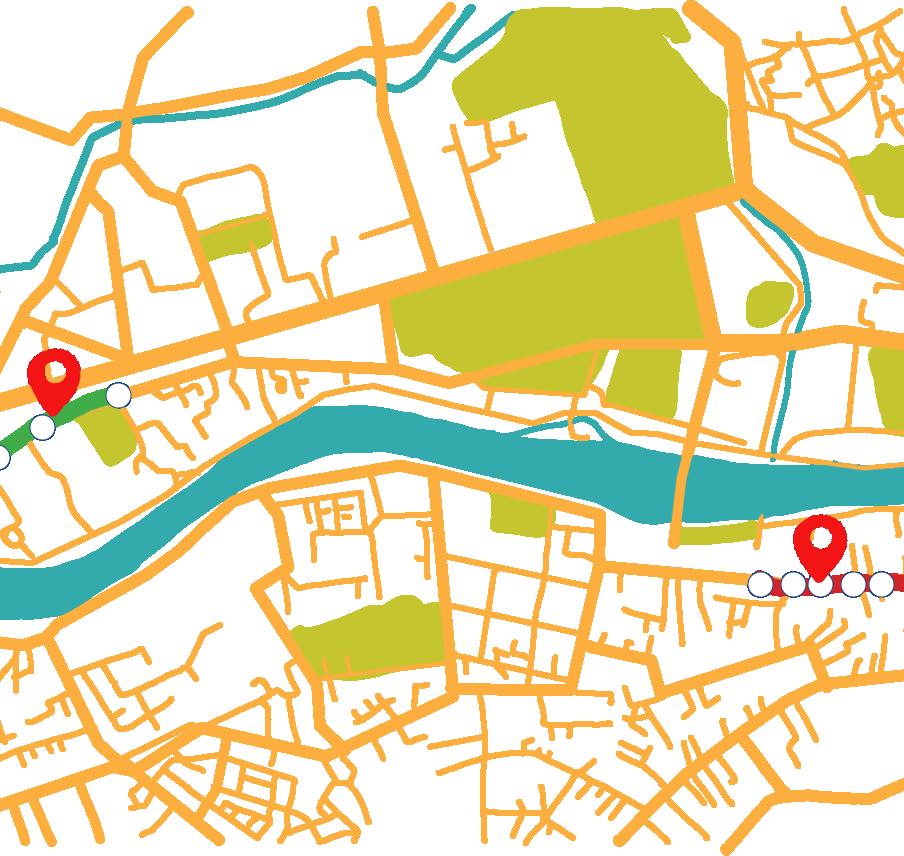
Lal Chowk allocates 38% of its right of way to footpaths. Rajbagh Hospital Bund Road provides no formal pedestrian infrastructure, with 78% allocated to carriageway and the remainder divided between informal parking and shoulder space.
Social
9 in 10 Healthy Street users reported feeling safe in terms of law and order after the improvements, compared to 5 in 10 street users in Unwalkable street.
Environmental
Healthy Street records 49 kg/km lower emissions in one hour compared to Unwalkable street, based on peak-hour traffic volume
Lal Chowk
TRANSFORMATION AT SCALE: PRIME MINISTER’S BHARAT JANPATH
YOJANA
Existing challenges in scaling from pilots to city-wide transformations
Existing challenges in scaling from pilots to city-wide transformations 5.1
The common bottlenecks faced by cities in scaling transformations are:
BOTTLENECK 1:
Lack of a long-term vision and roadmap for scaling up street transformation:
• One of the foremost challenges faced by cities is the absence of a comprehensive long-term vision and roadmap for urban mobility including the scale-up of street transformation. While individual projects may be successful, without a broader strategic plan, cities risk fragmented efforts and missed opportunities for synergy.
• To address this challenge, cities must invest in robust urban mobility master plans that outline clear goals and strategies for sustainable transport ensuring that projects are aligned with a broader vision for a sustainable urban future.
BOTTLENECK 2:
Personnel changes and lack of political will:
• Frequent transfers and transitions of key officials and the lack of consistent political will can disrupt the continuity of projects and hinder long-term progress. Additionally, there is often a shortage of qualified personnel within the government to lead and administer complex urban transformation projects.
• To mitigate this challenge, cities should adopt policies, guidelines, and plans that mandate consistent budget allocation to low-carbon projects, irrespective of changes in leadership. By institutionalising a commitment to sustainability, cities can ensure that projects continue to receive the support and funding they need, regardless of administrative shifts.
BOTTLENECK 3:
Chronic underfunding and misallocation of resources:
• There is a lack of dedicated fund allocation for non-motorised transport (NMT) at national and sub-national levels.
• Government funds in the transport sector are disproportionately prioritised for highways and flyovers, not safe streets.
• Even cities like Pune and Pimpri Chinchwad allocate only 15-20% of their total budget to transportation. This is insufficient to meet sustainable mobility goals.
• Tier 2 and 3 cities have limited municipal funds and borrowing capacity, making them dependent on state and national schemes.
• Cities will have to find the right expertise to help unlock innovative financing instruments, be it bonds, value capture, public-private partnerships (PPP) or even revenue generation through measures such as parking management.
BOTTLENECK 4:
Absence of a legislative framework:
• India lacks enforceable regulations mandating pedestrian and cyclist-friendly infrastructure.
• While Section 138(1A) of the Motor Vehicle Act, 1988 empowers states to make rules for pedestrian safety, most states have not acted on this.
• Policies like the National Urban Transport Policy (NUTP, 2006) and guidelines from the Indian Roads Congress (IRC) remain nonbinding, leading to patchy and inconsistent implementation.
BOTTLENECK 5:
Lack of technical capacity at the city level:
• There is a significant gap in the capability to conceptualise, design, and implement highquality NMT and public transport integration projects especially in Tier II and Tier III cities.
• This leads to poor utilization of scarce resources, low-quality infrastructure, and an inability to access and manage innovative funding sources.
• To overcome this capacity constraint, cities must either hire technical experts to prepare DPRs in-house or seek technical assistance from experienced organisations and development partners. Simultaneously, there is a pressing need to invest in capacity development for the city’s engineering teams and local contractors to ensure the high-quality implementation of projects.
BOTTLENECK 6:
Lack of coordination between planning and implementing agencies:
• Efforts to transform streets often involve multiple agencies, each with its own priorities and mandates. The lack of seamless integration and coordination between these agencies can result in poor quality implementation and the suboptimal use of financial resources.
• To tackle this challenge, cities must create unified platforms for key stakeholders, fostering a culture of collaboration and coordination. Establishing inter-agency task forces and shared project management systems can help streamline the planning and execution of street transformation projects.
BOTTLENECK 7:
Lack of public awareness and consistent support:
• Public awareness and consistent support are essential for the success of street transformation projects. Inadequate public engagement can lead to undesirable travel behaviour and pushback against projects and policies that promote sustainability.
• Cities must invest in robust campaigns that can educate residents about the benefits of projects, build a sense of ownership, and involve them in the decision-making process.
To holistically address these bottlenecks, it is proposed to develop a Prime Minister’s Bharat Janpath Yojana, comprising a Prime Minister’s Bharat Janpath - Pedestrian Policy and a Prime Minister’s Bharat Janpath - Streets Programme, designed to work in tandem to create safe, vibrant, and pedestrian-friendly cities across India.
Prime Minister’s Bharat Janpath Yojana 5.2
The core vision of the Yojana is to reclaim India’s streets as vibrant, equitable, and sustainable public spaces that prioritise people over vehicles, affirming that the right to walk safely is integral to the Right to Life under Article 21.
The streets transformed under the Yojana will include continuous, obstruction-free footpaths, safe atgrade crossings, traffic-calming for slow speeds, protected cycle tracks, well-lit and shaded walking environments, and direct pedestrian access to public transport. They will also incorporate organised parking and vending spaces, universal accessibility, and people-friendly design to ensure streets function as safe, inclusive public spaces for all.
The reforms are structured into three interconnected components:

Foundational pillar: Prime Minister’s Bharat JanpathPedestrian Policy
This component establishes the overarching strategic framework and mandate.
• Proposed Reform: Enact a National Pedestrian Policy to provide a unified vision and strategic guidance to all levels of government (National, State, and City).
• How it Addresses the Problem:
• It creates a national consensus and mandate, moving beyond non-binding guidelines (like NUTP 2006) to a coherent, actionable framework.
• It standardises approaches across states, addressing the current wide variation in implementation.
• It provides comprehensive guidance on institutional measures, implementation, and citizen communication.
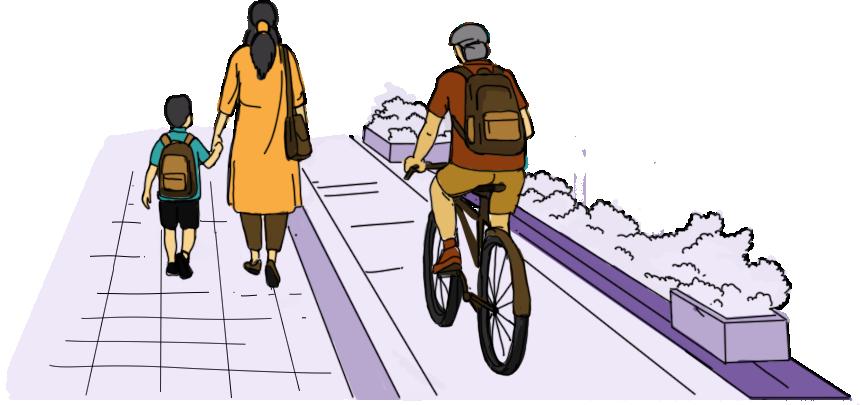
On-ground implementation:
Prime Minister’s Bharat
Janpath Yojana - Streets Programme
This is the action-oriented, catalytic component focused on delivering tangible change.
• Proposed reform:
National Street Programme to create 10,000 kilometers of safe, pedestrian-friendly streets across 100 cities. This will enhance access to essential services like schools and healthcare, boost economic opportunities, and make our cities more attractive for talent and investment through superior public infrastructure.
• How it addresses the problem:
• Network-based approach: Moves beyond isolated pilots to create functional, city-wide NMT networks, directly tackling the firstand-last-mile connectivity gap with public transport.
• Catalytic projects: Rapidly creates visible “success stories” to build public demand, demonstrate viability, capture learnings and scale-up.
• Technical support and capacity building: Establishes a national and state technical cells to bridge the lack of technical capacity in Tier II and III cities.
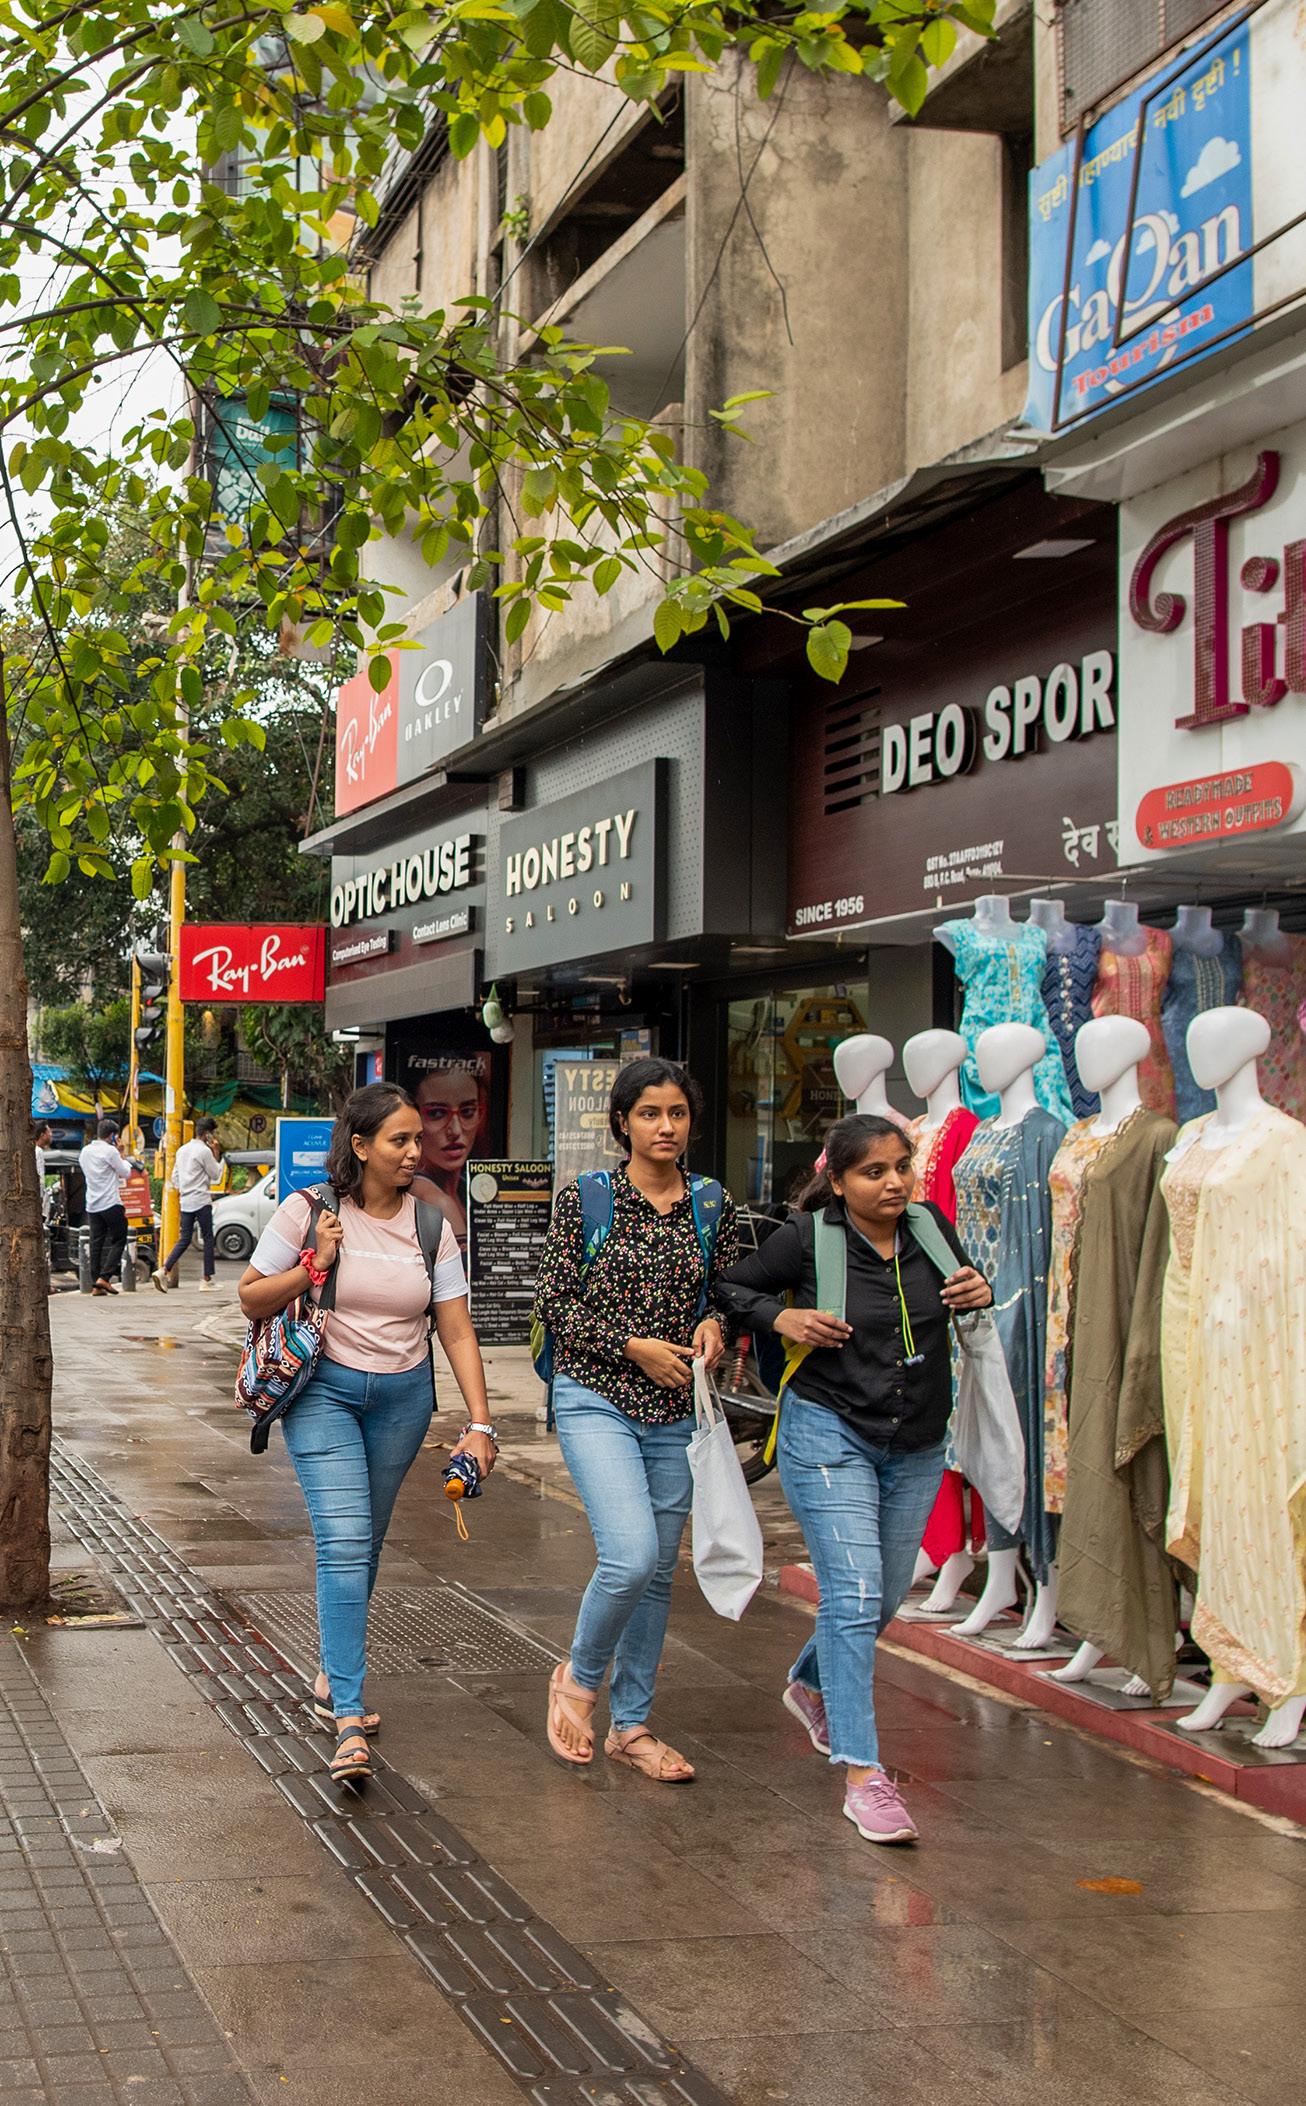
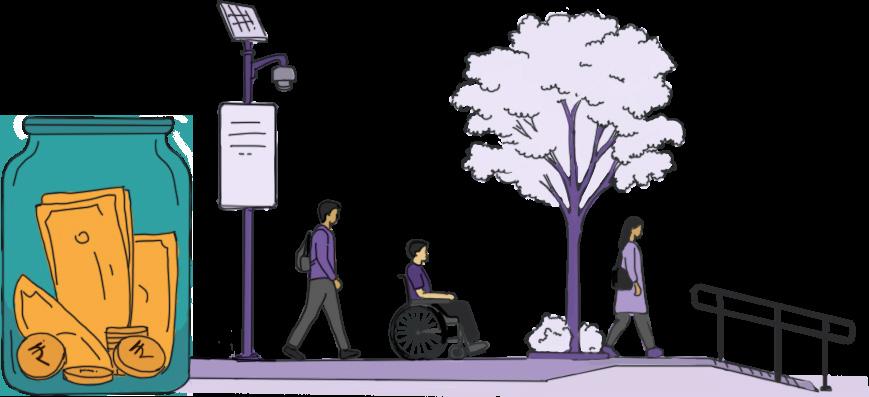
Enabling
environment:
institutional, financial, and legislative reforms
This component creates the necessary supporting ecosystem for the Yojana’s long-term success and sustainability.
3.1 Institutional reforms:
• Reform: Mandate all States to establish a State Urban Transport Cell (SUTC) and all cities to create an Active Mobility Cell.
• Problem addressed: Lack of dedicated nodal agencies and coordinated action.
3.2 Legislative and standards reform:
• Reform: Frame a “Right to Mobility” law would legally prioritise pedestrian mobility in urban planning, mandate the creation of NMT networks, and provide the framework for the Bharath Janpath Yojana.
• Reform: Amend the Motor Vehicles Act, 1988 to make it mandatory for States to frame rules for the safety of pedestrians and non-motorised transport users, within a specified timeframe.
• Problem addressed: Absence of legislation and enforceable regulations.
3.3 Funding & financing reforms:
• Reform: Create a dedicated “Healthy Streets Fund” at the national and state levels for the rollout of the programme.
• Problem addressed: Chronic underfunding and lack of dedicated fund allocation for NMT, especially in cities with limited borrowing capacity.
3.4 Monitoring & accountability reforms:
• Reform: Develop a “Pedestrian Safety and Accessibility Index” to rank cities and mandate biannual audits of implemented projects.
• Problem Addressed: Lack of performance monitoring and accountability for maintenance.
3.5 Building public support:
• Reform: Launch a nationwide “Happy Streets” awareness campaign and guide ULBs to set up communication cells.
• Problem addressed: Lack of public awareness and need for a behavioral shift towards sustainable mobility.
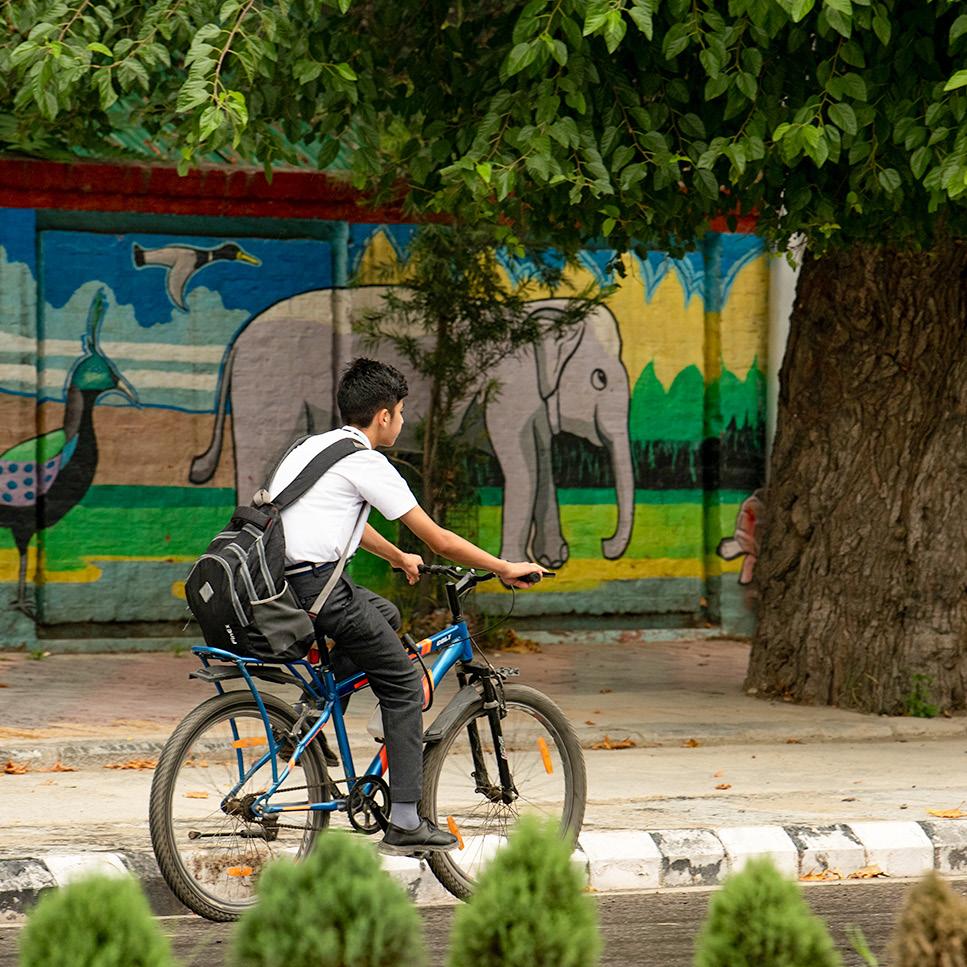
The proposed Prime Minister’s Bharat Janpath Yojana will enable cities and states to systematically design, fund and implement safe, accessible and high-quality footpaths, crossings, and walking networks across India, helping scale the economic, social and environmental impacts across cities.
Way ahead: from evidence to investment 5.3
The study was designed to produce evidence that is directly usable by city administrators, state urban development departments, and central agencies in making the investment and policy case for walking and cycling infrastructure. The following priorities guide the study’s onward application.
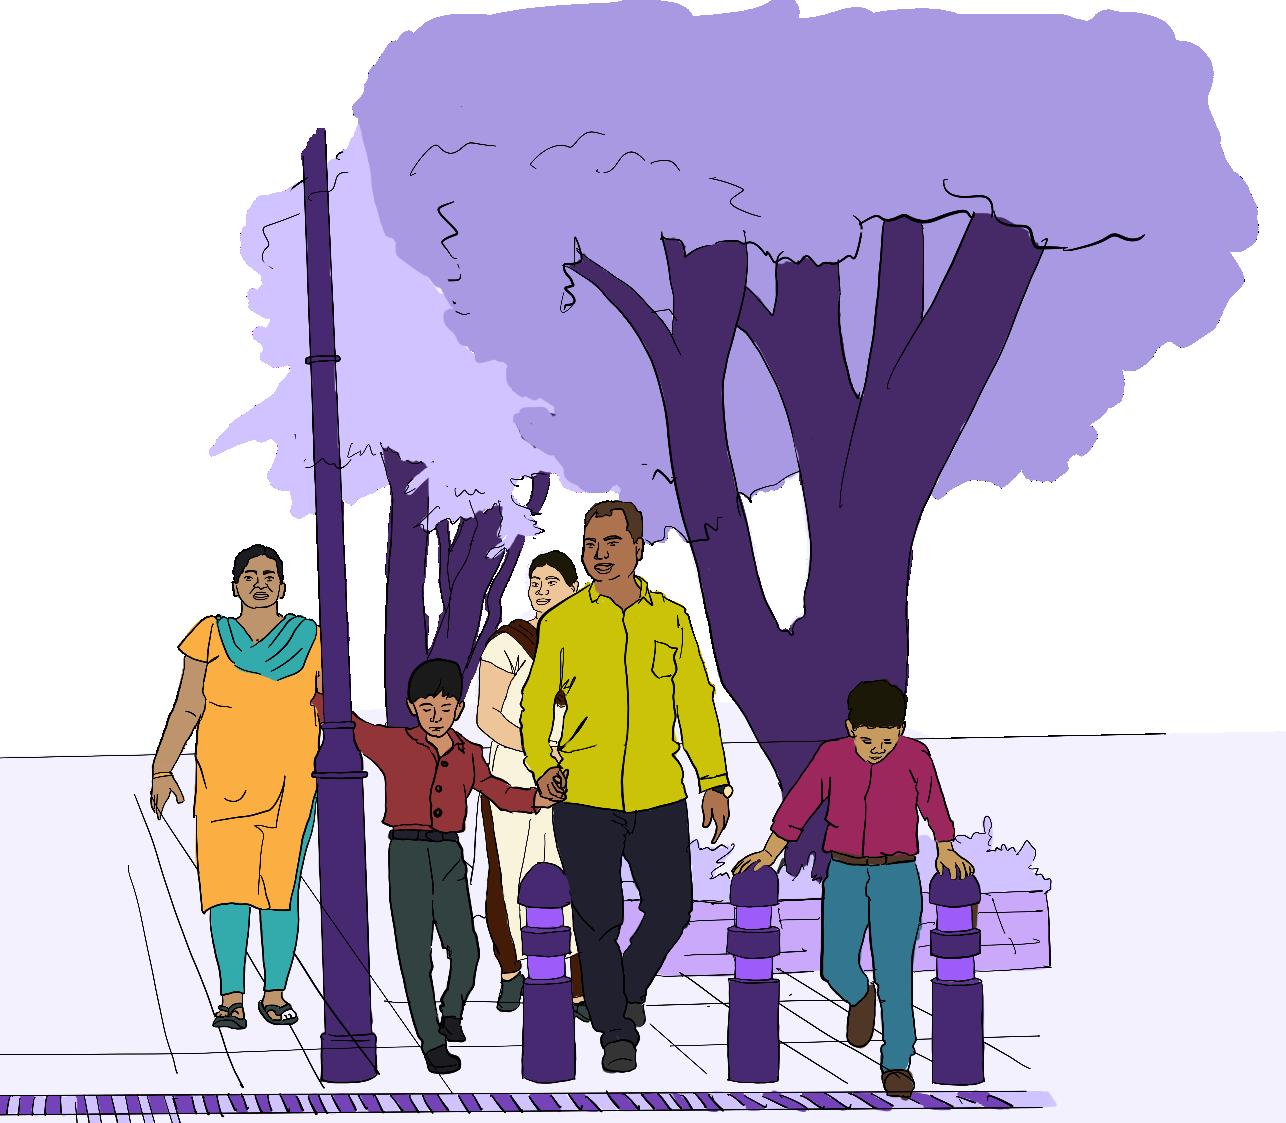
1
NATIONAL AND STATE MAINSTREAMING:
The findings are intended to inform policy direction, funding priorities, and financing decisions under urban missions, mobility strategies, and climate action plans. The multi-city, multi-indicator evidence base is designed to be directly actionable for national and state urban development agencies as well as city corporations.
TARGETED ADVOCACY AND COMMUNICATIONS:
2 3
The research will serve as an advocacy instrument across workshops, webinars, and multimedia storytelling formats— translating technical evidence into accessible narratives for urban practitioners, elected representatives, citizen groups, and media.
REPLICATION AND SCALE:
The methodology, benefits framework, and data collection protocols—is designed for replication across additional cities and street typologies, enabling a growing evidence base that strengthens the investment case over time.
But evidence alone does not build a footpath. Using the data to take decisive action is the next essential step. This can happen through dedicated programmes by the national and state governments, that bring together a unifying vision, institutional resolve, dedicated funding, and a legislative framework. The choice before every city, state, and national leader is no longer whether to invest in walking, but how quickly they will act. Every day without a safe footpath is a day a child, a worker, or an elder is denied their right to the city. A critical shift is needed to move from isolated pilots into a nationwide movement. This research aims to be a key step to accelerate that shift and reclaim streets for people.
Appendix
The impact assessment draws on primary survey data collected through structured questionnaires, administered across Healthy Streets and Unwalkable street. The survey instruments target three respondent categories — shopkeepers, street users including residents, and street vendors, capturing perceptions of safety, changes in business performance, mobility patterns, and overall street experience. While the Unwalkable street questionnaires establish a baseline by documenting current conditions, perceptions, and commute patterns on streets yet to receive improvements, the Healthy Streets questionnaires capture changes in business performance, mobility behaviour, and quality of life before and after interventions; with separate question sets for respondents who experienced the street in both states and those who encountered it only postimprovement.
Please find the survey questionnaire set on itdp.in. for reference to the study methodology and for use in future assessments.
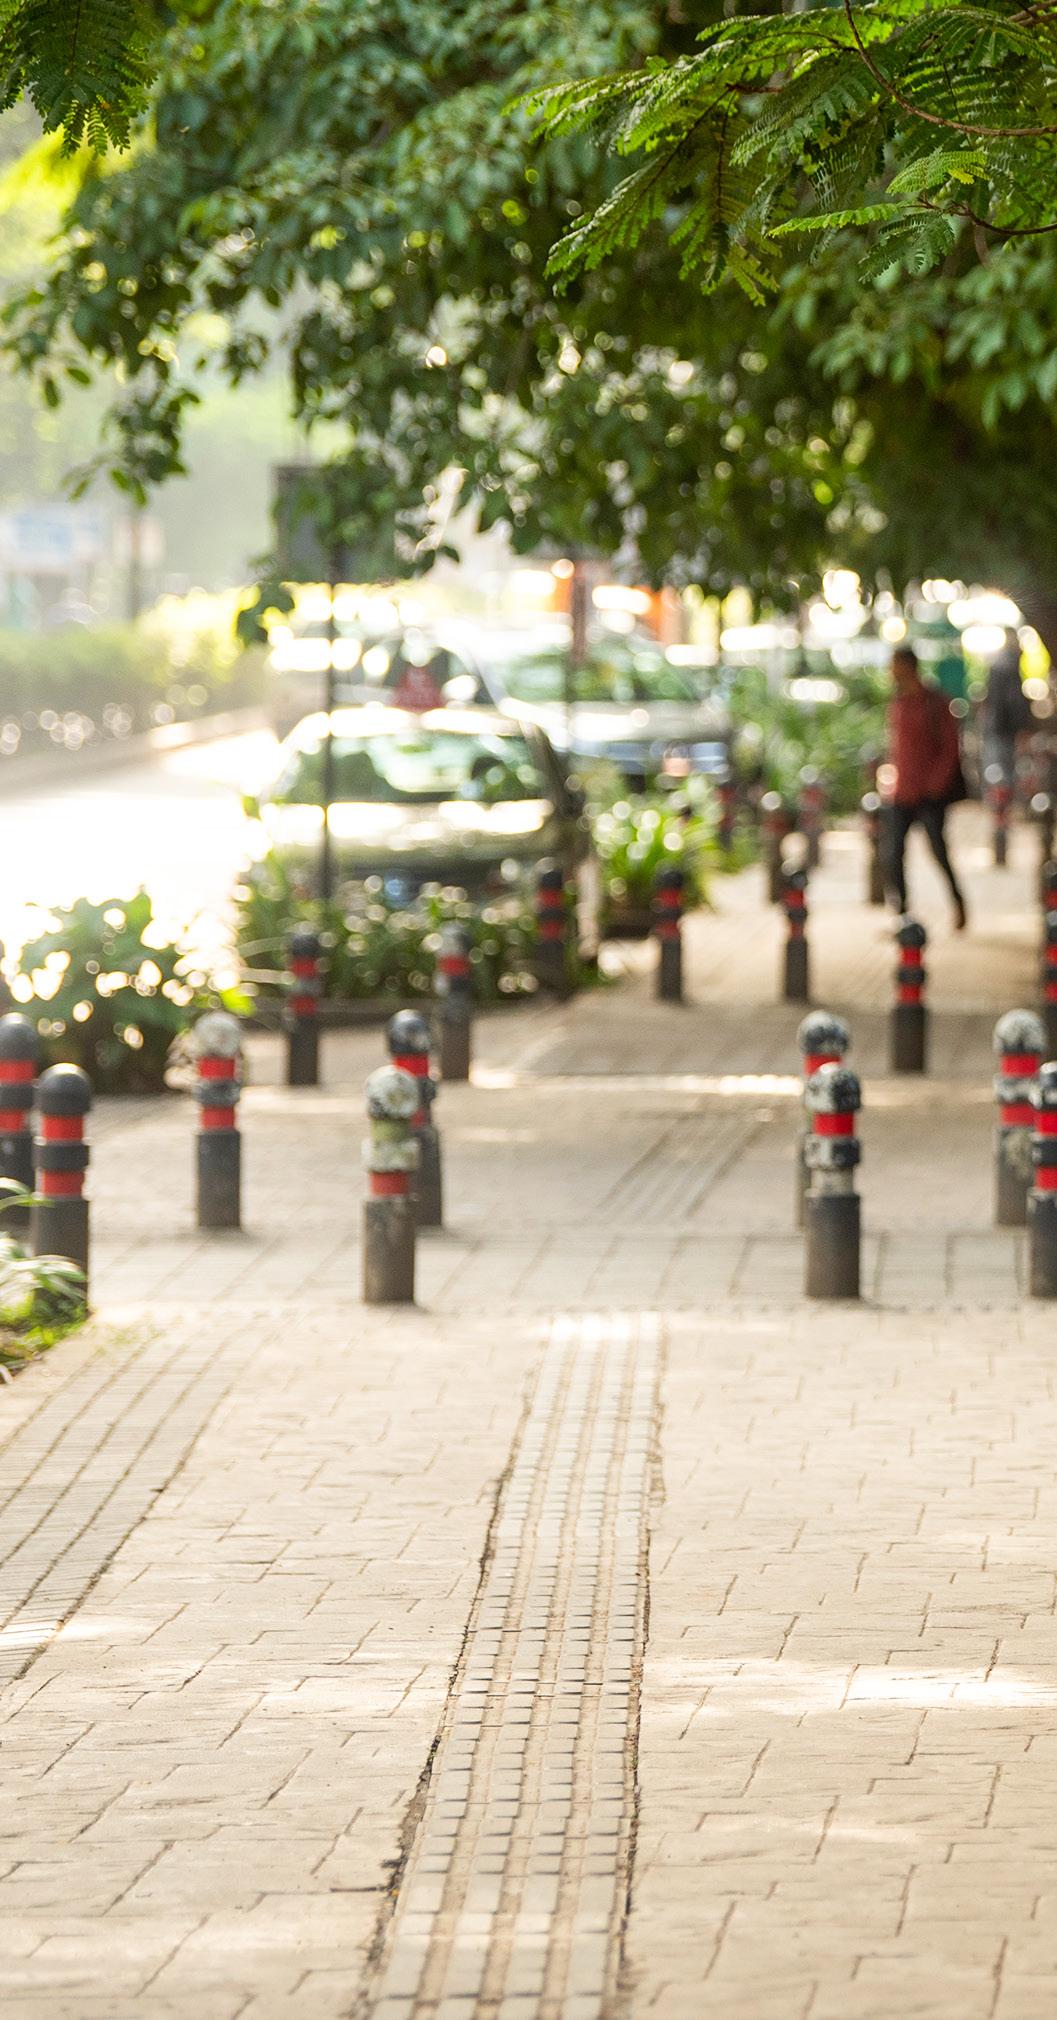
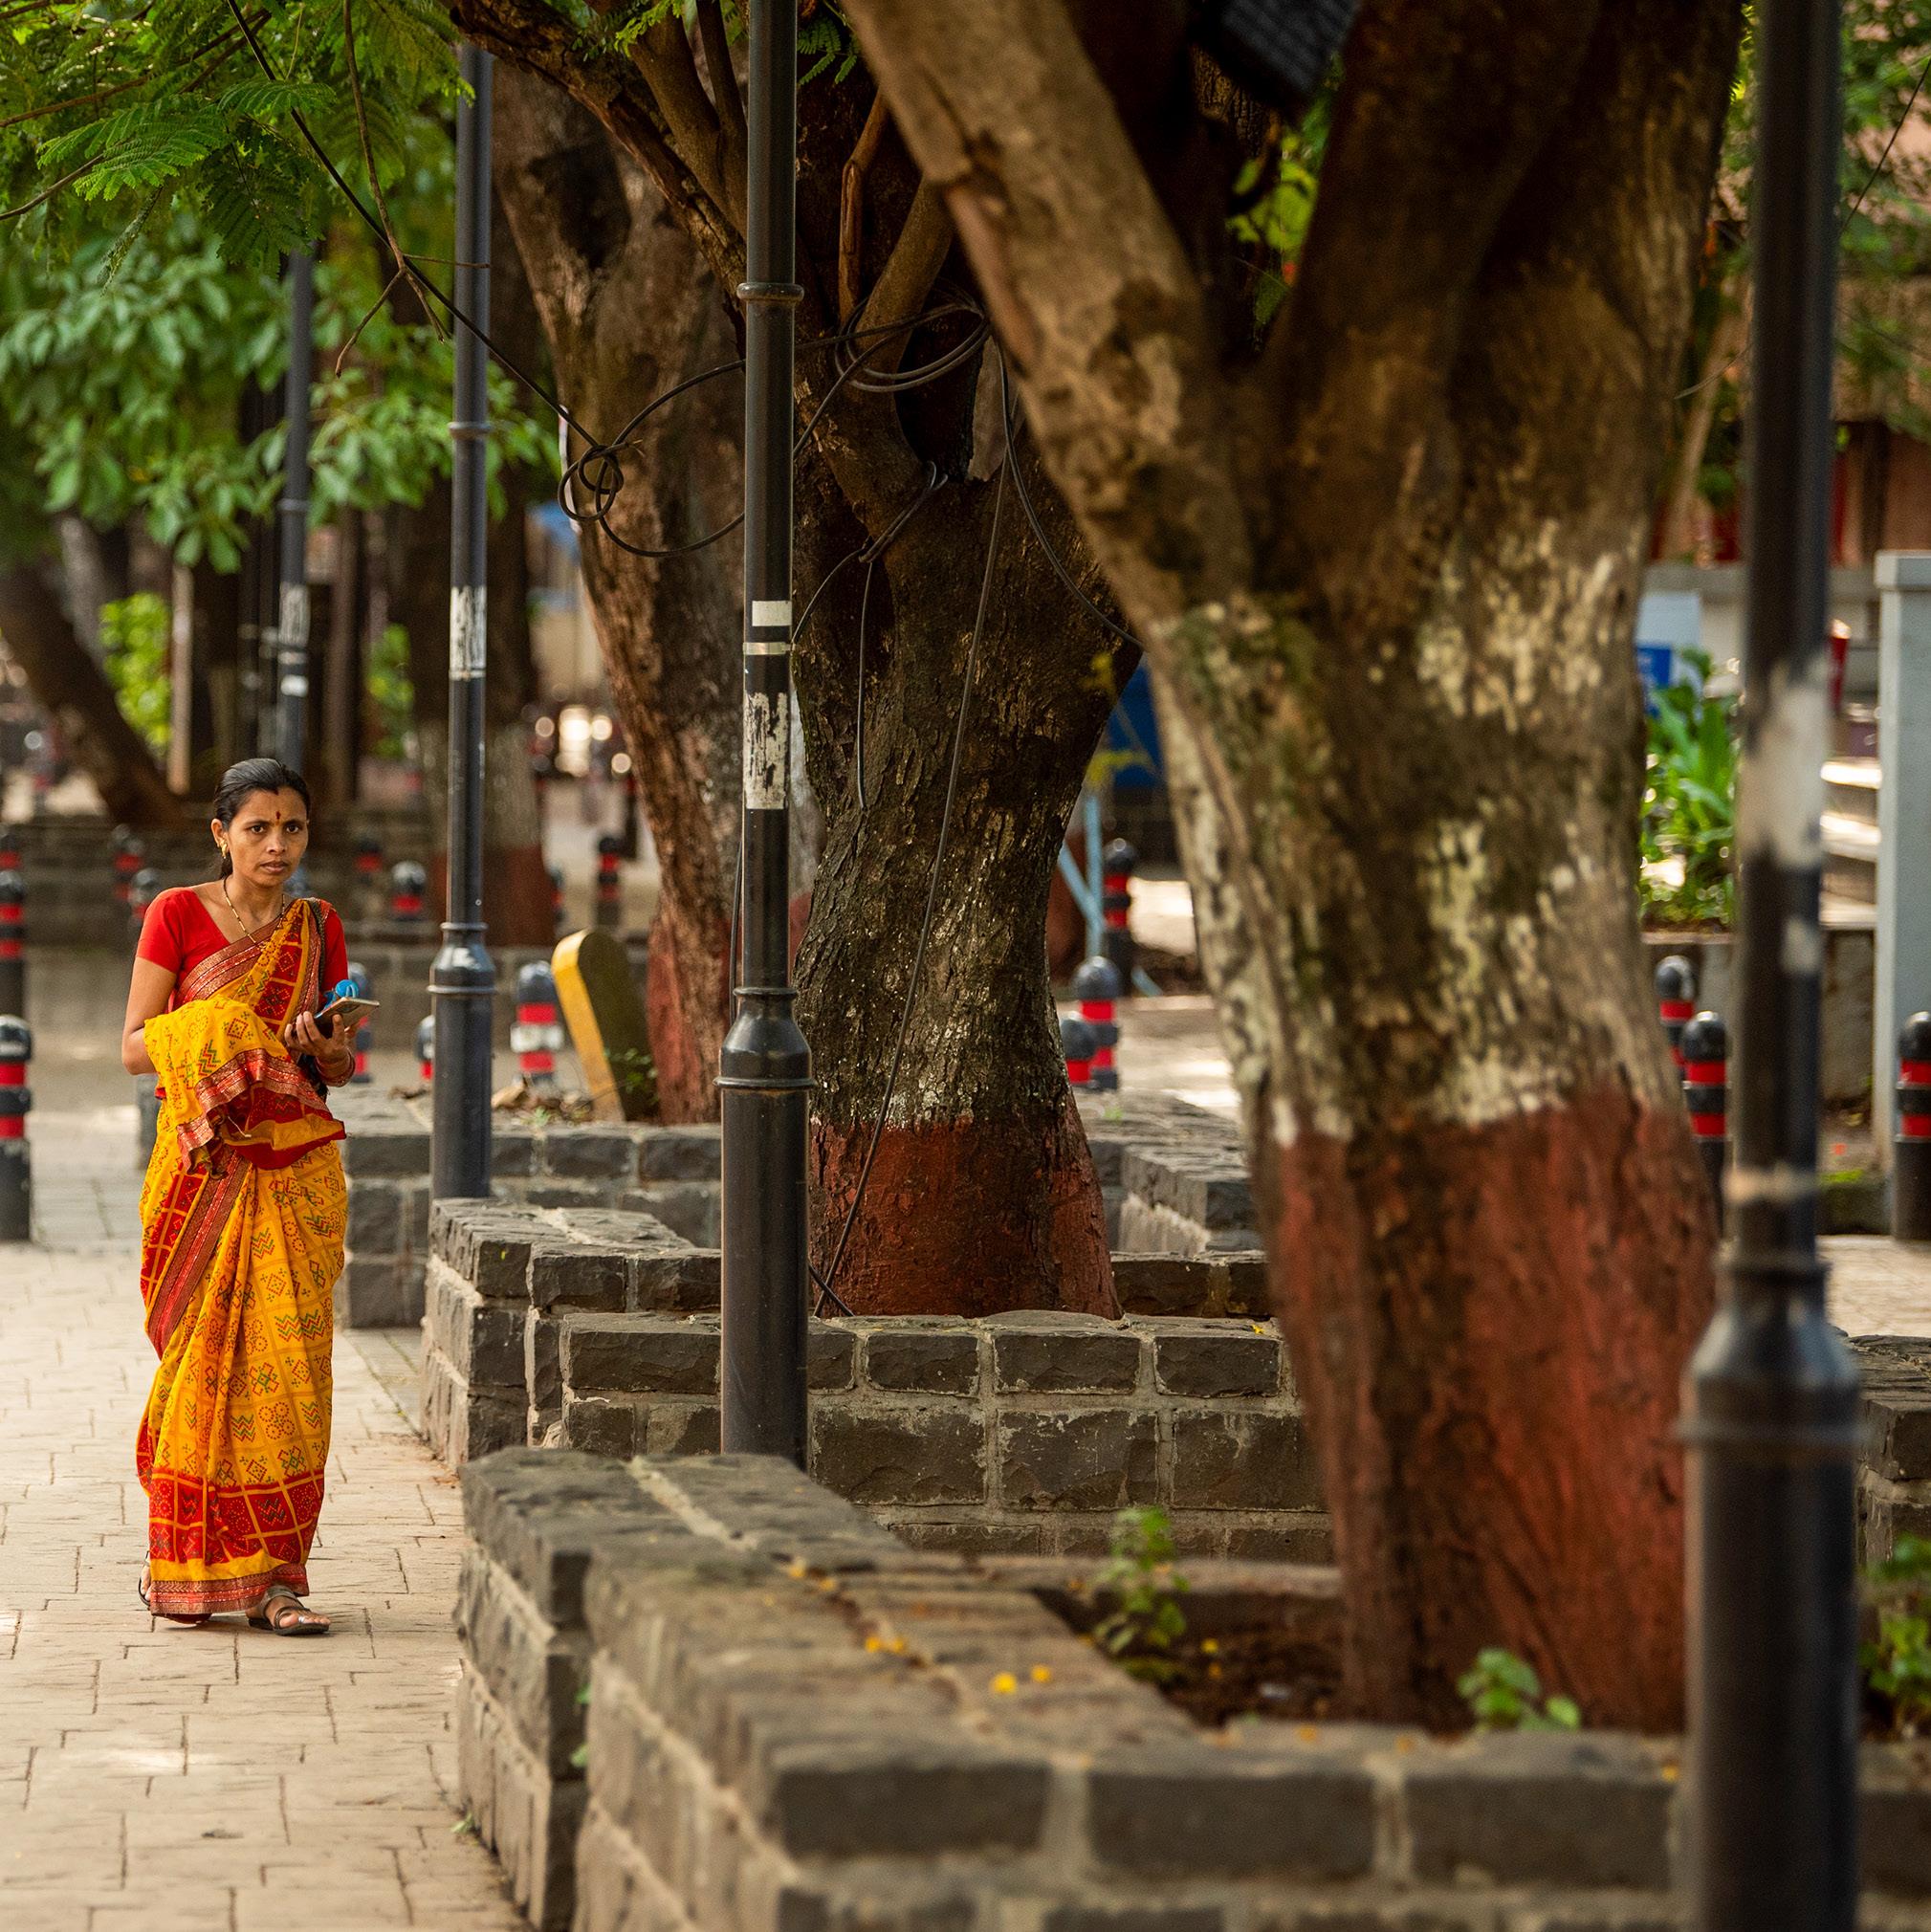
References
This chapter compiles all citations, data sources, and secondary references used in The Healthy Street Dividend. Sources are organised thematically below.
A. Endnotes
[1] Ministry of Road Transport and Highways (MoRTH), Government of India. (2023). Accidental Deaths & Suicides in India (ADSI) –2023. New Delhi: Transport Research Wing, MoRTH.
[2] GDCI, Case Study: Plaza Programme; New York City, USA Retrieved from: https:// globaldesigningcities.org/publication/globalstreet-design-guide/streets/pedestrian-priorityspaces/pedestrian-plazas/case-study-plazaprogramme-new-york-city-usa/
[3] https://www.timessquarenyc.org/businesscommunity/market-research-data
[4] The Economic Benefits of Sustainable Streets, 2014; Retrieved from https://ssti.us/wp-content/ uploads/sites/1303/2014/01/dot-economicbenefits-of-sustainable-streets-1.pdf
[5] https://www.livingstreets.org.uk/policy-reportsand-research/high-streets/
[6] World Economic Forum. (2024). Ciclovía at 50: What We Can Learn from Bogotá's Open Streets Initiative.
[7] Centre for Public Impact. (2016). TransMilenio: Renewing Bogotá's Transport System. Public Impact Fundamentals.
[8] Ministry of Road Transport and Highways (MoRTH), Government of India. (2023). Road Accidents in India – 2023. New Delhi: Transport Research Wing, MoRTH.
[9] Hussain, Q., Feng, H., Grzebieta, R., Brijs, T., & Olivier, J. (2019). The Relationship between Impact Speed and the Probability of Pedestrian Fatality during a Vehicle-Pedestrian Crash: A Systematic Review and Meta-Analysis. Accident Analysis & Prevention, 129, 241–249.
B. Air Quality Standards and Guidelines
• Central Pollution Control Board (CPCB), Government of India. National Ambient Air Quality Standards (NAAQS). New Delhi: CPCB, Ministry of Environment, Forest and Climate Change.
• World Health Organisation (WHO). (2021). WHO Global Air Quality Guidelines: Particulate Matter (PM2.5 and PM10), Ozone, Nitrogen Dioxide, Sulfur Dioxide and Carbon Monoxide.
C. Road Safety Data
• Ministry of Road Transport and Highways (MoRTH), Government of India. (2023). Road Accidents in India - 2023. New Delhi: Transport Research Wing, MoRTH.
• Coimbatore City Police. (2025). Traffic Crash Records - Mettupalayam Road and Diwan Bahadur (DB) Road (2021-2025). [Secondary data obtained through city agency consultation, ITDP India, 2025-26.] Note: ‘Mettupalayam Road’ in this study refers to the stretch from the flower market to the city boundary.
• Raahgiri Foundation / Municipal Corporation of Gurugram. Traffic Fatality Records - Sub. Major Laxmichand Road (2018-2024). [Secondary data obtained through city agency and stakeholder consultation, ITDP India, 2025-26.]
D. Fiscal and
Revenue
Data from City Agencies
All secondary data in this section was obtained through formal data requests and stakeholder consultations by ITDP India during 2025-26.
• Ahmedabad Municipal Corporation (AMC). Property Tax Assessment Records - Science City Road Corridor (2021-22 to 2025-26). [Secondary data obtained through city agency consultation, ITDP India, 2025-26.]
• Bhubaneswar Smart City Limited (BSCL). Operational Revenue Data - Smart Janpath Road. [Secondary data obtained through city agency consultation, ITDP India, 2025-26.]
• Greater Chennai Corporation (GCC) / Chennai Smart City Limited. Utility Corridor Maintenance and Parking Data - Pondy Bazaar Pedestrian Plaza. [Secondary data obtained through city agency consultation, ITDP India, 2025-26.]
• Srinagar Smart City Ltd. Parking Revenue Data - Lal Chowk Off-Street Parking Facilities (20242025). [Secondary data obtained through city agency consultation, ITDP India, 2025-26.]
E. National Policy and Regulatory Frameworks
• Ministry of Housing and Urban Affairs (MoHUA), Government of India. (2006). National Urban Transport Policy (NUTP). New Delhi: MoHUA.
• Ministry of Housing and Urban Affairs (MoHUA) / ITDP India. (2024). Streets for People: Pathways of Change from India’s Smart Cities. New Delhi: MoHUA.
• Government of India. (1988). The Motor Vehicles Act, 1988. New Delhi: Ministry of Road Transport and Highways. [As amended up to 2019.]
• Indian Roads Congress (IRC). IRC:103-2022 – Guidelines for Pedestrian Facilities (Second Revision). New Delhi: IRC.
F. International
Evidence and Benchmarks
• New York City Department of Transportation (NYCDOT). (2012). Measuring the Street: New Metrics for 21st Century Streets. New York: NYCDOT.
• Transport for London (TfL). Walking Action Plan and Cycling Infrastructure Programme Evaluation. London: Transport for London.
• TransMilenio S.A. / District Government of Bogotá. TransMilenio BRT System and CicloVía Programme Evaluation Reports. Bogotá: District Government.
• Streets and Mobility Framework. Singapore: URA.
• Gehl, J. (2010). Cities for People. Washington DC: Island Press.
• Litman, T. (2024). Evaluating Active Transport Benefits and Costs. Victoria, BC: Victoria Transport Policy Institute.
• ITDP (2024). Steps to Sustainability - the impacts of new footpaths on mode choice in Chennai, India
Glossary
The following terms are used throughout The Healthy Street Dividend. Terms are listed alphabetically. Where relevant, brief contextual notes explain how each term is applied in this study.
A.AQI (Air Quality Index)
A standardised index used to communicate the level of air pollution at a given location. In India, AQI is calculated by the Central Pollution Control Board (CPCB) across six pollutants: PM2.5, PM10, NO₂, SO₂, CO, and O₃.
Active Mobility
Human-powered forms of travel, principally walking and cycling. Active mobility is used interchangeably with NMT (Non-Motorised Transport) in this study.
experienced the street before improvements and newer users who encountered it only after improvements, enabling a direct assessment of how conditions and behaviour have changed.
C.
Carriageway
The portion of a street surface designated for vehicular movement. Carriageway width is a primary metric in the Right of Way (RoW) allocation analysis.
D. B.
Before-After Comparison
One of two comparative frameworks used in this study. Surveys on Healthy Streets captured responses from both long-term users who
dB (Decibel)
The unit of measurement for sound intensity.
Dwell Time
The amount of time a person spends on a street or in a public space during a single visit. Used as a proxy for the quality and attractiveness of the street environment.
E.
ECS (Equivalent Car Space)
A standard unit of parking capacity. One ECS is the space required for one car.
Emission Estimate
A calculated figure for transport-related greenhouse gas or air pollutant output, based on peak-hour vehicle counts by category.
F.
FGD (Focus Group Discussion)
A qualitative data collection method involving facilitated discussion with a small group of stakeholders. In this study, FGDs were conducted in local languages with shopkeeper unions, Resident Welfare Associations (RWAs), and real estate agents across 10 cities.
Footfall
The number of people entering or passing through a location, used as a measure of pedestrian activity.
Footpath
A designated, paved pathway along the side of a road intended for pedestrian use.
G.
Green Buffer
A planted strip, typically located between the carriageway and footpath, providing shade, visual separation, stormwater management, and thermal comfort.
Guideline Value / Circle Rate
The minimum per-square-foot price at which a property may be registered, as notified annually by state governments. Used in this study to establish a macro land market baseline, allowing rental and transaction premiums associated with Healthy Streets to be distinguished from city-wide appreciation trends.
H.
Healthy Street
The primary study typology: a street with pedestrianoriented infrastructure including wide, continuous footpaths; organised and managed on-street parking; traffic-calming measures; universal accessibility features; street furniture; greenery; and improved lighting.
Healthy Street–Unwalkable street Comparison
The primary analytical framework of this study. Healthy Streets are systematically compared with Unwalkable Streets within the same city, broadly matched on land-use mix, built-use character,
street typology, and RoW width, so that observed differences in outcomes can be attributed, as far as possible, to the quality of street infrastructure.
K.
KII (Key Informant Interview)
A qualitative research method used alongside FGDs to gather expert perspectives from urban planners, real estate professionals, and community representatives. KIIs provided contextual depth and validated findings from the broader survey and field data.
L.
Healthy and Unwalkable Streets on the same day to ensure comparability.
Lifecycle Cost
The total cost of owning and maintaining an asset over its full operational life, including capital investment, operations and maintenance (O&M), repair, and utility management.
M.
Modal Share
The proportion of total trips made by a given mode of transport.
MoHUA (Ministry of Housing and Urban Affairs)
The nodal central government ministry responsible for urban planning and development policy in India. Lane Diet
A traffic-calming technique that reduces the number or width of vehicle lanes on a road in order to slow traffic, reduce conflict points, and reallocate space to pedestrians, cyclists, or greenery.
Last-Mile Connectivity
The link between a public transport node (metro station or bus stop) and a traveller’s origin or destination, typically completed on foot.
Leq (Equivalent Continuous Sound Level)
A measure of average noise exposure over a specified period, expressed in decibels (dB). In this study, Leq was recorded at 10-minute intervals during peak hours at consistent locations on both
N.
NAAQS (National Ambient Air Quality Standards)
Standards for permissible pollutant concentrations in ambient air, as notified by the Central Pollution Control Board (CPCB), Government of India.
NMT (Non-Motorised Transport)
Modes of travel that do not use motorised engines, principally walking and cycling. NMT infrastructure — footpaths, cycle tracks, and crossing facilities — is the defining feature of Healthy Streets and the primary policy lever discussed in this study.
Noise Pollution
Excessive or harmful levels of ambient sound in the urban environment.
NUTP (National Urban Transport Policy)
India’s national framework for urban transport, issued in 2006 by MoHUA. The NUTP provides guidance on promoting sustainable and equitable mobility but is non-binding, a limitation highlighted in this study as a structural barrier to consistent Healthy Street implementation.
O.
O&M (Operations and Maintenance)
Recurring expenditures required to keep street infrastructure functional after capital investment, including repairs, cleaning, lighting, upkeep, landscaping, and drainage management.
On-Street Parking
Parking spaces provided within the Right of Way of a street, typically along the kerb. Healthy Streets feature organised, demarcated, and managed onstreet parking.
P.
Particulate Matter (PM1, PM2.5, PM10)
Airborne particles classified by aerodynamic diameter: PM1 (≤1 micron), PM2.5 (≤2.5 microns),
and PM10 (≤10 microns). Finer particles penetrate deeper into the respiratory system, with PM1 reaching the bloodstream.
Pedestrian Safety and Accessibility Index
A performance monitoring tool proposed under the Prime Minister’s Bharat Janpath Yojana that would rank cities on the quality of their pedestrian infrastructure and mandate bi-annual audits of implemented Healthy Street projects. Intended to address the current absence of performance accountability in NMT investment.
Pedestrianisation
The process of restricting or eliminating motor vehicle access to a street or area, converting it exclusively or primarily for pedestrian use.
Pre-improvements visitors
Street users who have experienced the street both before and after the Healthy Street improvements.
Property Tax
A tax levied by Urban Local Bodies (ULBs) on property owners based on assessed values.
85th Percentile Speed
A traffic engineering metric representing the speed at or below which 85% of vehicles are travelling in free-flow conditions.
R. T.
Right of Way (RoW)
The total width of land allocated to a street corridor, encompassing carriageway, footpaths, cycle tracks, parking lanes, green buffers, and utility corridors.
RWA (Resident Welfare Association)
A formal or informal body representing the interests of residents in a defined neighbourhood or housing complex.
SPV (Special Purpose Vehicle)
A distinct legal entity created to execute a specific project or programme.
Street Vendor
A person who sells goods or services in a public street or space without a permanent built structure. Street vendors represent an important segment of India’s informal economy.
SUTC (State Urban Transport Cell)
A state-level institutional unit proposed under the Prime Minister’s Bharat Janpath Yojana to coordinate urban transport planning and provide technical assistance to cities in implementing NMT and Healthy Street programmes. Intended to address the lack of technical capacity, particularly in Tier 2 and 3 cities.
Table-Top Crossing (Raised Pedestrian Crossing)
A traffic-calming measure in which a pedestrian crossing is raised to footpath level, forcing vehicles to slow down when crossing.
TOD (Transit-Oriented Development)
An urban planning approach that concentrates mixed-use development around public transport nodes to maximise accessibility and reduce private vehicle dependence.
Traffic Calming
Physical street design measures that reduce vehicle speeds and volumes to improve safety for all users. Measures observed on Healthy Streets in this study include table-top crossings, lane diets, cobblestone treatments, and signalised junctions.
Turnover (Annual Shopkeeper Turnover)
The total value of goods or services sold by a business over a year. A primary economic outcome measure in this study.
Turnover Premium
The sustained difference in mean annual shopkeeper turnover between Healthy Streets and comparable Unwalkable Streets, after controlling for baseline economic growth. In this study, even when Unwalkable street turnover is adjusted upward to reflect India’s nominal GDP growth rate of
approximately 10% CAGR — representing the best-case counterfactual of what Unwalkable street shopkeepers would have earned without any street improvement: Healthy Streets still maintain a higher mean annual turnover. This premium indicates that the street environment itself is a durable economic driver, not merely a beneficiary of broader urban growth. The concept is distinct from the before-after rise in Healthy Street turnover, which measures the annual gain for individual shopkeepers following improvements; the turnover premium measures the structural Healthy Street advantage over Unwalkable street at a point in time.
U.
ULB (Urban Local Body)
The elected municipal government of an urban area in India, responsible for local infrastructure, service delivery, and revenue collection. ULBs are the primary implementing agencies for Healthy Street interventions and the direct beneficiaries of the fiscal returns — expanded tax bases, new parking revenue streams, and reduced lifecycle maintenance costs — documented in this study.
Underground Utility Corridor
An organised, dedicated space within the street substructure for routing utility services (water, sewage, electricity, telecom) in a single, coordinated trench.
Universal Accessibility / Universal Design
The design of streets, infrastructure, and public spaces to be usable by all people, regardless of age, disability, or physical ability and without the need for adaptation. Barrier-free ramps, tactile paving, and adequate footpath widths are examples.
Unwalkable Street
The comparison typology in this study: a street lacking dedicated pedestrian infrastructure such as footpaths, organised parking, or traffic calming. Unwalkable streets represent the baseline condition against which Healthy Street outcomes are measured. They are selected to match Healthy Streets in land use, connectivity, and RoW width to ensure comparability.
V.
Value Capture
A financing mechanism by which public agencies recover a portion of the increase in land or property values generated by a public infrastructure investment.
Volume Count
A point-in-time survey of the number of pedestrians and/or vehicles passing a given location, disaggregated by mode and demographic category (e.g. two-wheelers, cars, women, children, elderly).
Vulnerable Road Users
Pedestrians, cyclists, and others at greater risk of injury in road environments due to lack of physical protection.