Cavitation Abrasive Surface Finishing for Additively Manufactured Ti-6Al-4V Vanessa Bradshaw¹, Nick Engstrom¹, Dwayne Arola¹,², Daniel Sanders²,³, Ramulu Mamidala¹,² 1 Materials Science & Engineering, University of Washington, Seattle, 2 Mechanical Engineering, University of Washington, Seattle, 3 Sugino Machine Ltd, Wixom, MI
Abstract Laser powder bed fusion (LPBF) produces metal components such as Ti-6Al-4V with surface defects that degrade fatigue performance. Cavitation Abrasive Surface Finishing (CASF) significantly improved surface texture and reduced stress concentration factors across all surface conditions, with the lowest values observed for vertical surfaces. Preliminary fatigue testing showed a substantial improvement in fatigue life for CASF-treated specimens, though failures continued to initiate at surface-connected defects. These results demonstrate the potential for CASF to mitigate defect-driven fatigue failure with further optimization.
Introduction Laser Powder Bed Fusion LPBF is an additive manufacturing (AM) process which fuses metal powder layer by layer to produce solid metal parts. Due to the manufacturing process, parts produced via LPBF commonly have undesirable surface properties resulting from the presence of unfused metal particles on the surface.
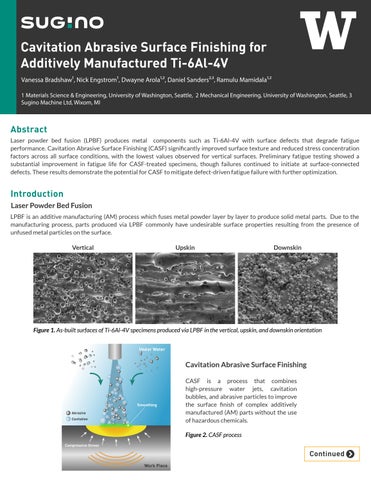
Vertical
Upskin
Downskin
Figure 1. As-built surfaces of Ti-6Al-4V specimens produced via LPBF in the vertical, upskin, and downskin orientation
Cavitation Abrasive Surface Finishing CASF is a process that combines high-pressure water jets, cavitation bubbles, and abrasive particles to improve the surface finish of complex additively manufactured (AM) parts without the use of hazardous chemicals. Figure 2. CASF process
Continued