May 6, 2026
Arcadis Professional Services (Canada) Inc. Suite 300, 10120 103 Avenue Edmonton, Alberta T5J 3R6 Canada Phone: 780 428 4000 www.arcadis.com
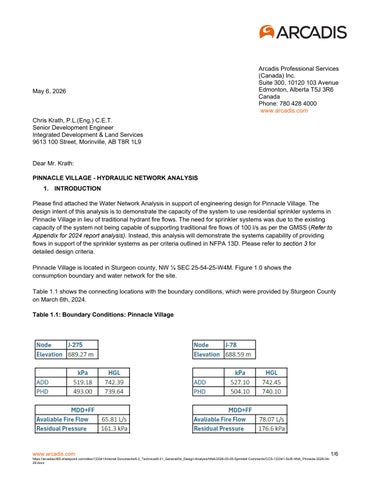
Chris Krath, P.L.(Eng.) C.E.T. Senior Development Engineer Integrated Development & Land Services 9613 100 Street, Morinville, AB T8R 1L9 Dear Mr. Krath: PINNACLE VILLAGE - HYDRAULIC NETWORK ANALYSIS 1. INTRODUCTION Please find attached the Water Network Analysis in support of engineering design for Pinnacle Village. The design intent of this analysis is to demonstrate the capacity of the system to use residential sprinkler systems in Pinnacle Village in lieu of traditional hydrant fire flows. The need for sprinkler systems was due to the existing capacity of the system not being capable of supporting traditional fire flows of 100 l/s as per the GMSS (Refer to Appendix for 2024 report analysis). Instead, this analysis will demonstrate the systems capability of providing flows in support of the sprinkler systems as per criteria outlined in NFPA 13D. Please refer to section 3 for detailed design criteria. Pinnacle Village is located in Sturgeon county, NW ¼ SEC 25-54-25-W4M. Figure 1.0 shows the consumption boundary and water network for the site. Table 1.1 shows the connecting locations with the boundary conditions, which were provided by Sturgeon County on March 6th, 2024. Table 1.1: Boundary Conditions: Pinnacle Village
www.arcadis.com
https://arcadiso365.sharepoint.com/sites/133341/Internal Documents/6.0_Technical/6.01_General/04_Design-Analysis/HNA/2026-05-05-Sprinklet Comments/CCS-133341-SUB HNA_Pinnacle-2026-0429.docx
1/6
Chris Krath, P.L.(Eng.) C.E.T. – April 29th, 2026
The HGL used for the MDD scenario was calculated using the provided residual pressures in Table 1.1 to first calculate the added head.
Where;
ℎ=
𝑃𝑃 𝜌𝜌𝑔𝑔
P is pressure in Pascals ρ is the density of water (1000 kg/m3) g is the acceleration due to gravity (9.81 m/s2) Both respective boundary points calculated values of head close to 705 m, so this was used for both as per best design practice.
www.arcadis.com
https://arcadiso365.sharepoint.com/sites/133341/Internal Documents/6.0_Technical/6.01_General/04_Design-Analysis/HNA/2026-05-05-Sprinklet Comments/CCS-133341-SUB HNA_Pinnacle-2026-0429.docx
2/6
Chris Krath, P.L.(Eng.) C.E.T. – April 29th, 2026
2. WATER DEMANDS The Sturgeon County General Municipal Servicing Standards are currently going through updates to the design demand criteria. Sturgeon County directed Arcadis to use the following consumption demands for this analysis. Note that fire flow testing was administered in the report to model the usage of residential sprinklers as per NFPA 13D. The following demands were utilized in the report. •
Average Day Demand (ADD)
300 L/c/d
•
Maximum Day Demand (MDD)
600 L/c/d
•
Peak Hour demand (PHD)
900 L/c/d
Table 2.1 shows the peak hour and maximum day demands used in the model, based on the zoning and consumption boundaries shown in Figure 1.0.
Table 2.1: Water Demand
JUNCTION/ZONE J-1 J-2 J-3 J-4 J-5 J-6 J-7 J-8 J-9 J-10 J-11 J-12 J-13 J-14 J-15 J-16 J-17
R7 R7 R7 R7 R7 R7 R7 R7 R7 R7 R7 R7 R7 R7 R7 R7 R7
www.arcadis.com
Area (Ha)
MAX DAY Units NO. OF Persons/ POPULATION DEMAND / Ha UNITS UNIT (l/s)
Total
0 9 7 10 0 9 11 12 0 10 9 7 8 8 0 0 0 100.00
3.50 3.50 3.50 3.50 3.50 3.50 3.50 3.50 3.50 3.50 3.50 3.50 3.50 3.50 3.50 3.50 3.50
0 32 25 35 0 32 39 42 0 35 32 25 28 28 0 0 0 351
0.00 0.22 0.17 0.24 0.00 0.22 0.27 0.29 0.00 0.24 0.22 0.17 0.19 0.19 0.00 0.00 0.00 2.44
PEAK HOUR DEMAND (l/s)
AVERAGE DAY DEMAND (l/s)
0.00 0.33 0.26 0.36 0.00 0.33 0.40 0.44 0.00 0.36 0.33 0.26 0.29 0.29 0.00 0.00 0.00 3.66
0.00 0.11 0.09 0.12 0.00 0.11 0.13 0.15 0.00 0.12 0.11 0.09 0.10 0.10 0.00 0.00 0.00 1.22
https://arcadiso365.sharepoint.com/sites/133341/Internal Documents/6.0_Technical/6.01_General/04_Design-Analysis/HNA/2026-05-05-Sprinklet Comments/CCS-133341-SUB HNA_Pinnacle-2026-0429.docx
3/6
Chris Krath, P.L.(Eng.) C.E.T. – April 29th, 2026
3. RESULTS Modeling results are summarized in Table 3.1. Figure 1.0 shows the pipe layout and diameter for each scenario. AVERAGE DAY DEMAND (ADD) The lowest and highest pressures respectively were found to be 503 and 549 kPa at nodes J-18 and J-15. The velocities within the watermains are all under 1.5 m/s and headloss gradients were lower than 2.0 m/km. PEAK HOUR DEMAND (PHD) The lowest and highest pressures respectively were found to be 477 and 522 kPa at nodes J-18 and J-15. The velocities within the watermains are all under 1.5 m/s and headloss gradients were lower than 2.0 m/km except for P-1(1) which was 2.846 m/km. This pipe is a long run and thus has higher then average frictions/headloss. The headloss is not high enough to be considered a major concern for the lifetime of the pipe, but there are some mitigation measures which could be taken such as upsizing. MAXIMUM DAY DEMAND (MDD)+2.50 l/S FIRE FLOW The maximum day demand scenario was analyzed for the usage of residential sprinklers using design criteria from NFPA 13D. The design criteria are as follows: • The system must provide enough water to supply at least two sprinklers simultaneously for a duration of ten minutes. For this analysis a minimum flow of 40 gpm / 2.50 l/s was utilized in the model. The hydraulic calculations require an additional 10% safety margin. • Achieve the minimum sprinkler operating pressure of 7 psi (48 kPa) at the most remote sprinkler heads. In practice, the operating pressure usually falls between 20-50 psi (140 – 350 kPa) so this report will demonstrate that all nodes operate within that range in the fire flow scenario. • Overcome friction losses in the system. The current model achieves all the above at all respective nodes when utilizing the current provided boundary conditions.
www.arcadis.com
https://arcadiso365.sharepoint.com/sites/133341/Internal Documents/6.0_Technical/6.01_General/04_Design-Analysis/HNA/2026-05-05-Sprinklet Comments/CCS-133341-SUB HNA_Pinnacle-2026-0429.docx
4/6
Chris Krath, P.L.(Eng.) C.E.T. – April 29th, 2026
Summary of Findings • • • •
The water network model exhibits adequate pressures as per the GMSS for the Average Daily and Peak Hourly demand scenarios respectively. All pipes within the ADD and PHD scenario exhibit velocities below 1.5 m/s. Disregarding the dead end pipes (utilized for future connections) there are a few pipe runs that exhibit lower than average velocities but this will not affect potability or hydraulic function. All pipes in the ADD scenario exhibit adequate headlosses. There is one run of pipe in the PHD scenario which exhibits higher than average headlosses/friction due to its length but does not pose any concern for the average lifetime of the pipe. The system demonstrates capacity for supporting residential sprinkler systems as per the criteria outlined in NFPA 13D including: o The system provides flow for MDD+2.50 l/s in excess of the 10% safety factor at all nodes, including the most remote at J-11, J-13 and J-17 for a duration of 10 minutes. o The system provides the minimum operating residual pressure of 140 kPa at all nodes during fire flow. o Overcome friction losses within the system.
MDD
Table 3.1: Summary of Results Minimum Pressure (KPa)
At Node
Maximum Pressure (KPa)
At Node
Maximum Velocity (m/s)
Maximum Headloss Gradient (m/km)
ADD
503
J-18
549
J-15
0.217
0.371
PHD
477
J-18
522
J-15
0.652
2.846
140
J-18
167
J-15
0.048
0.023
MDD + 2.5 l/s FF
www.arcadis.com
https://arcadiso365.sharepoint.com/sites/133341/Internal Documents/6.0_Technical/6.01_General/04_Design-Analysis/HNA/2026-05-05-Sprinklet Comments/CCS-133341-SUB HNA_Pinnacle-2026-0429.docx
5/6
Chris Krath, P.L.(Eng.) C.E.T. – April 29th, 2026
If you have any questions concerning this or require any additional information, please contact the undersigned at (780) 428-4000.
ARCADIS
Nader Zein E.I.T. Project Engineer in Training Reviewed by:
Ryan Tomas P.Eng. Business Unit Director - Civil/Land Development
www.arcadis.com
https://arcadiso365.sharepoint.com/sites/133341/Internal Documents/6.0_Technical/6.01_General/04_Design-Analysis/HNA/2026-05-05-Sprinklet Comments/CCS-133341-SUB HNA_Pinnacle-2026-0429.docx
6/6
48
49
50
51
52
53
54
47
46 24
18
19
20
21
22
P-20 200 mm
55
BLK 1
17
57
25
P59
62
61
60
40
41
44
43
42
17
20
0m
J-7
P-8 200 mm
12
m
11 BLK 2
9
10
15
68 69
67
Stage 1
39
64 BLK 1 70
Stage 2
38 BLK 1
J-4
28
71
6 BLK 2
16
37
P-13 200 m m
29 BLK 1
36
P-5 200 mm
J-11
35
J-10
34 30
33
12 BLK 1
18 17 5
11
32
73 74
P-12 200 mm
75 76
10 1
J-2
78 BLK 1
81 82
4
J-3
P-10 200 mm
1 2
3
4
P-2 200 m
m
R-1
Road
J-8
J-1
P-1(2) 200 mm
BLK 1 5
6
7
9
1 P-1 mm 200
idge
3
P-3 200 m
80
tle R
P-4 200 mm
m
79
Tres
2 BLK 2
31
77
Legend
J-16 P-22 J-18 200 mm
66
72
13
7 15
100 Lots
65
11 Lots
27
14
14
13
P-9(2)
P-14 200 mm
8
P-9(1)
J-5
200 mm
J-15 200 mmP-18
63
16
26
P-6 200 mm
Starkey Road
58
1 : 3000
J-6
45
NW 25-54-25-4
J-14
200 mm
P-16 200 mm
J-12
200 mm P-15
J-13
P-7 200 mm
C:\Users\zeinn1754\ARCADIS\133341 Pinnacle Village - Internal Documents (1)\6.0_Technical\6.01_General\04_Design-Analysis\HNA\2026-05-05-Sprinklet Com
J-17 23 56
EMERGENCY ACCESS
8
J-9
P-1(1)
200 mm
P
innaFigure 1.0 Stage Boundary cle P Consumption Boundary Water Demand Boundary oint R-1 Reservoir & Number & Water Network J-1 Junction Node & Number Preliminary HYD. Location Pinnacle Village P-1 Pipe Size & Number Date: April 2026 200 mm
ARCADIS PROFESSIONAL SERVICES (CANADA) INC #300, 10120 103 Avenue Edmonton AB T5J 3R6 Canada tel 780 428 4000 www.arcadis.com
R-2
Peak Hour Demand
Active Scenario: PHD Scenario Summary Report Scenario: PHD Scenario Summary ID Label Notes Active Topology Physical Demand Initial Settings Operational Age Constituent Trace Fire Flow Energy Cost Transient Pressure Dependent Demand Failure History SCADA User Data Extensions Steady State/EPS Solver Calculation Options Transient Solver Calculation Options
59 PHD <I> Base Active Topology PHD PHD PHD <I> Base Operational <I> Base Age <I> Base Constituent <I> Base Trace <I> Base Fire Flow <I> Base Energy Cost <I> Base Transient <I> Base Pressure Dependent Demand <I> Base Failure History <I> Base SCADA <I> Base User Data Extensions <I> Base Calculation Options <I> Base Calculation Options
Hydraulic Summary Time Analysis Type Friction Method Accuracy Trials
Pinnacle HNA - 2024.wtg 2026-05-06
Steady State HazenWilliams 0.001 40
Use simple controls during steady state? Is EPS Snapshot? Start Time Calculation Type
Bentley Systems, Inc. Haestad Methods Solution Center 76 Watertown Road, Suite 2D Thomaston, CT 06787 USA +1-203-755-1666
True False 12:00:00 AM Hydraulics Only
WaterCAD [23.00.00.16] Page 1 of 1
Active Scenario: PHD FlexTable: Junction Table Label J-1 J-2 J-3 J-4 J-5 J-6 J-7 J-8 J-9 J-10 J-11 J-12 J-13 J-14 J-15 J-16 J-17 J-18
Pinnacle HNA - 2024.wtg 2026-05-06
Elevation (m)
Demand (L/s) 688.8 688.7 689.1 688.3 688.2 688.5 688.8 689.5 688.5 688.4 689.1 688.3 688.5 688.8 686.3 690.1 689.2 691.0
Hydraulic Grade (m) 0.00 0.33 0.26 0.36 0.00 0.33 0.40 0.44 0.00 0.36 0.33 0.26 0.29 0.29 0.00 0.00 0.00 0.00
739.7 739.7 739.7 739.7 739.7 739.7 739.7 739.7 739.8 739.7 739.7 739.7 739.7 739.7 739.7 739.7 739.7 739.7
Bentley Systems, Inc. Haestad Methods Solution Center 76 Watertown Road, Suite 2D Thomaston, CT 06787 USA +1-203-755-1666
Pressure (kPa) 498 499 496 503 504 501 498 492 502 502 495 503 501 498 522 486 494 477
WaterCAD [23.00.00.16] Page 1 of 1
Active Scenario: PHD FlexTable: Pipe Table Label
P-1 (1) P-1 (2) P-2 P-3 P-4 P-5 P-6 P-7 P-8 P-9 (1) P-9 (2) P-10 P-11 P-12 P-13 P-14 P-15 P-16 P-17 P-18 P-20 P-22
Start Node
Stop Node
R-2
J-9
103
200 PVC
120.0
20.47
0.652
2.846
J-9
J-1
248
200 PVC
120.0
8.90
0.283
0.609
J-1 R-1 J-2 J-3 J-4 J-5 J-6
R-1 J-2 J-3 J-4 J-5 J-6 J-7
28 39 64 89 52 42 134
200 200 200 200 200 200 200
PVC PVC PVC PVC PVC PVC PVC
120.0 120.0 120.0 120.0 120.0 120.0 120.0
8.90 -7.92 -6.89 -0.30 -0.66 -3.55 -3.88
0.283 0.252 0.219 0.010 0.021 0.113 0.124
0.610 0.489 0.380 0.001 0.006 0.110 0.131
J-7
J-16
92
200 PVC
120.0
-4.28
0.136
0.157
J-16
J-8
92
200 PVC
120.0
-4.28
0.136
0.157
J-8 J-9 J-2 J-10 J-10 J-12 J-12 J-14 J-15 J-7 J-16
J-3 J-8 J-10 J-11 J-12 J-13 J-14 J-15 J-5 J-17 J-18
138 74 162 85 136 91 111 73 50 46 42
200 200 200 200 200 200 200 200 200 200 200
120.0 120.0 120.0 120.0 120.0 120.0 120.0 120.0 120.0 120.0 120.0
6.85 11.57 -1.36 0.33 -2.05 0.29 -2.60 -2.89 -2.89 0.00 0.00
0.218 0.368 0.043 0.011 0.065 0.009 0.083 0.092 0.092 0.000 0.000
0.375 0.990 0.019 0.001 0.040 0.002 0.062 0.076 0.075 0.000 0.000
Pinnacle HNA - 2024.wtg 2026-05-06
Length (m)
Diameter (mm)
Material
PVC PVC PVC PVC PVC PVC PVC PVC PVC PVC PVC
HazenWilliam sC
Flow (L/s)
Velocity (m/s)
Bentley Systems, Inc. Haestad Methods Solution Center 76 Watertown Road, Suite 2D Thomaston, CT 06787 USA +1-203-755-1666
Headloss Gradient (m/km)
WaterCAD [23.00.00.16] Page 1 of 1
Active Scenario: PHD FlexTable: Reservoir Table Label R-1 R-2
Pinnacle HNA - 2024.wtg 2026-05-06
Elevation (m) 739.6 740.1
Flow (Out net) (L/s) -16.82 20.47
Flow (In net) (L/s)
Hydraulic Grade (m)
16.82 -20.47
Bentley Systems, Inc. Haestad Methods Solution Center 76 Watertown Road, Suite 2D Thomaston, CT 06787 USA +1-203-755-1666
739.6 740.1
WaterCAD [23.00.00.16] Page 1 of 1
Average Day Demand
Active Scenario: ADD Scenario Summary Report Scenario: ADD Scenario Summary ID Label Notes Active Topology Physical Demand Initial Settings Operational Age Constituent Trace Fire Flow Energy Cost Transient Pressure Dependent Demand Failure History SCADA User Data Extensions Steady State/EPS Solver Calculation Options Transient Solver Calculation Options
169 ADD <I> Base Active Topology ADD ADD ADD <I> Base Operational <I> Base Age <I> Base Constituent <I> Base Trace <I> Base Fire Flow <I> Base Energy Cost <I> Base Transient <I> Base Pressure Dependent Demand <I> Base Failure History <I> Base SCADA <I> Base User Data Extensions <I> Base Calculation Options <I> Base Calculation Options
Hydraulic Summary Time Analysis Type Friction Method Accuracy Trials
Pinnacle HNA - 2024.wtg 2026-05-06
Steady State HazenWilliams 0.001 40
Use simple controls during steady state? Is EPS Snapshot? Start Time Calculation Type
Bentley Systems, Inc. Haestad Methods Solution Center 76 Watertown Road, Suite 2D Thomaston, CT 06787 USA +1-203-755-1666
True False 12:00:00 AM Hydraulics Only
WaterCAD [23.00.00.16] Page 1 of 1
Active Scenario: ADD FlexTable: Junction Table Label J-1 J-2 J-3 J-4 J-5 J-6 J-7 J-8 J-9 J-10 J-11 J-12 J-13 J-14 J-15 J-16 J-17 J-18
Pinnacle HNA - 2024.wtg 2026-05-06
Elevation (m)
Demand (L/s) 688.8 688.7 689.1 688.3 688.2 688.5 688.8 689.5 688.5 688.4 689.1 688.3 688.5 688.8 686.3 690.1 689.2 691.0
Hydraulic Grade (m) 0.00 0.11 0.09 0.12 0.00 0.11 0.13 0.15 0.00 0.12 0.11 0.09 0.10 0.10 0.00 0.00 0.00 0.00
742.4 742.4 742.4 742.4 742.4 742.4 742.4 742.4 742.4 742.4 742.4 742.4 742.4 742.4 742.4 742.4 742.4 742.4
Bentley Systems, Inc. Haestad Methods Solution Center 76 Watertown Road, Suite 2D Thomaston, CT 06787 USA +1-203-755-1666
Pressure (kPa) 525 526 522 529 530 528 525 518 528 529 522 530 528 525 549 512 521 503
WaterCAD [23.00.00.16] Page 1 of 1
Active Scenario: ADD FlexTable: Pipe Table Label
P-1 (1) P-1 (2) P-2 P-3 P-4 P-5 P-6 P-7 P-8 P-9 (1) P-9 (2) P-10 P-11 P-12 P-13 P-14 P-15 P-16 P-17 P-18 P-20 P-22
Start Node
Stop Node
R-2
J-9
103
200 PVC
120.0
6.82
0.217
0.371
J-9
J-1
248
200 PVC
120.0
2.96
0.094
0.079
J-1 R-1 J-2 J-3 J-4 J-5 J-6
R-1 J-2 J-3 J-4 J-5 J-6 J-7
28 39 64 89 52 42 134
200 200 200 200 200 200 200
PVC PVC PVC PVC PVC PVC PVC
120.0 120.0 120.0 120.0 120.0 120.0 120.0
2.96 -2.62 -2.29 -0.10 -0.22 -1.18 -1.29
0.094 0.084 0.073 0.003 0.007 0.038 0.041
0.079 0.063 0.050 0.000 0.000 0.016 0.017
J-7
J-16
92
200 PVC
120.0
-1.42
0.045
0.020
J-16
J-8
92
200 PVC
120.0
-1.42
0.045
0.020
J-8 J-9 J-2 J-10 J-10 J-12 J-12 J-14 J-15 J-7 J-16
J-3 J-8 J-10 J-11 J-12 J-13 J-14 J-15 J-5 J-17 J-18
138 74 162 85 136 91 111 73 50 46 42
200 200 200 200 200 200 200 200 200 200 200
120.0 120.0 120.0 120.0 120.0 120.0 120.0 120.0 120.0 120.0 120.0
2.28 3.85 -0.45 0.11 -0.68 0.10 -0.87 -0.97 -0.97 0.00 0.00
0.073 0.123 0.014 0.004 0.021 0.003 0.028 0.031 0.031 0.000 0.000
0.049 0.130 0.002 0.000 0.005 0.000 0.008 0.010 0.009 0.000 0.000
Pinnacle HNA - 2024.wtg 2026-05-06
Length (m)
Diameter (mm)
Material
PVC PVC PVC PVC PVC PVC PVC PVC PVC PVC PVC
HazenWilliam sC
Flow (L/s)
Velocity (m/s)
Bentley Systems, Inc. Haestad Methods Solution Center 76 Watertown Road, Suite 2D Thomaston, CT 06787 USA +1-203-755-1666
Headloss Gradient (m/km)
WaterCAD [23.00.00.16] Page 1 of 1
Active Scenario: ADD FlexTable: Reservoir Table Label R-1 R-2
Pinnacle HNA - 2024.wtg 2026-05-06
Elevation (m) 742.4 742.5
Flow (Out net) (L/s) -5.59 6.82
Flow (In net) (L/s)
Hydraulic Grade (m)
5.59 -6.82
Bentley Systems, Inc. Haestad Methods Solution Center 76 Watertown Road, Suite 2D Thomaston, CT 06787 USA +1-203-755-1666
742.4 742.5
WaterCAD [23.00.00.16] Page 1 of 1
Max Day Demand + 2.5 l/s Fire Flow
Active Scenario: MDD+2.5L/S Scenario Summary Report Scenario: MDD+2.5L/S Scenario Summary ID Label Notes Active Topology Physical Demand Initial Settings Operational Age Constituent Trace Fire Flow Energy Cost Transient Pressure Dependent Demand Failure History SCADA User Data Extensions Steady State/EPS Solver Calculation Options Transient Solver Calculation Options
61 MDD+2.5L/S <I> Base Active Topology <I> MDD MDD MDD+2.50L/S <I> Base Operational <I> Base Age <I> Base Constituent <I> Base Trace 2.50L/S <I> Base Energy Cost <I> Base Transient <I> Base Pressure Dependent Demand <I> Base Failure History <I> Base SCADA <I> Base User Data Extensions Fire Flow <I> Base Calculation Options
Hydraulic Summary Time Analysis Type Friction Method Accuracy Trials
Pinnacle HNA - 2024.wtg 2026-05-06
Steady State HazenWilliams 0.001 40
Use simple controls during steady state? Is EPS Snapshot? Start Time Calculation Type
Bentley Systems, Inc. Haestad Methods Solution Center 76 Watertown Road, Suite 2D Thomaston, CT 06787 USA +1-203-755-1666
True False 12:00:00 AM Fire Flow
WaterCAD [23.00.00.16] Page 1 of 1
Active Scenario: MDD+2.5L/S Fire Flow Node FlexTable: Fire Flow Results Table Label
J-1 J-2 J-3 J-4 J-5 J-6 J-7 J-8 J-9 J-10 J-11 J-12 J-13 J-14 J-15 J-16 J-17 J-18
Satisfies Fire Flow Constraints? True True True True True True True True True True True True True True True True True True
Pinnacle HNA - 2024.wtg 2026-05-06
Fire Flow (Needed) (L/s) 2.50 2.50 2.50 2.50 2.50 2.50 2.50 2.50 2.50 2.50 2.50 2.50 2.50 2.50 2.50 2.50 2.50 2.50
Flow (Total Available) (L/s) 144.76 91.33 69.48 60.98 57.19 52.43 42.90 57.23 90.78 54.92 38.12 61.03 43.19 59.45 60.47 37.18 42.61 30.66
Pressure (Calculated Residual) (kPa) 140 150 147 151 153 150 149 145 151 147 140 142 140 140 167 140 140 140
Bentley Systems, Inc. Haestad Methods Solution Center 76 Watertown Road, Suite 2D Thomaston, CT 06787 USA +1-203-755-1666
Pressure (kPa)
159 160 156 163 164 162 159 152 161 163 156 164 162 159 183 146 155 147
WaterCAD [23.00.00.16] Page 1 of 1
Active Scenario: MDD+2.5L/S FlexTable: Pipe Table Label
P-1 (1) P-1 (2) P-2 P-3 P-4 P-5 P-6 P-7 P-8 P-9 (1) P-9 (2) P-10 P-11 P-12 P-13 P-14 P-15 P-16 P-17 P-18 P-20 P-22
Start Node
Stop Node
R-2
J-9
103
200 PVC
120.0
0.58
0.019
0.004
J-9
J-1
248
200 PVC
120.0
-0.34
0.011
0.001
J-1 R-1 J-2 J-3 J-4 J-5 J-6
R-1 J-2 J-3 J-4 J-5 J-6 J-7
28 39 64 89 52 42 134
200 200 200 200 200 200 200
PVC PVC PVC PVC PVC PVC PVC
120.0 120.0 120.0 120.0 120.0 120.0 120.0
-0.34 1.50 0.60 0.61 0.37 0.03 -0.19
0.011 0.048 0.019 0.019 0.012 0.001 0.006
0.003 0.023 0.003 0.004 0.001 0.000 0.000
J-7
J-16
92
200 PVC
120.0
-0.46
0.015
0.002
J-16
J-8
92
200 PVC
120.0
-0.46
0.015
0.003
J-8 J-9 J-2 J-10 J-10 J-12 J-12 J-14 J-15 J-7 J-16
J-3 J-8 J-10 J-11 J-12 J-13 J-14 J-15 J-5 J-17 J-18
138 74 162 85 136 91 111 73 50 46 42
200 200 200 200 200 200 200 200 200 200 200
120.0 120.0 120.0 120.0 120.0 120.0 120.0 120.0 120.0 120.0 120.0
0.18 0.92 0.68 0.22 0.22 0.19 -0.14 -0.33 -0.33 0.00 0.00
0.006 0.029 0.022 0.007 0.007 0.006 0.005 0.011 0.011 0.000 0.000
0.001 0.009 0.005 0.001 0.001 0.001 0.000 0.002 0.001 0.000 0.000
Pinnacle HNA - 2024.wtg 2026-05-06
Length (m)
Diameter (mm)
Material
PVC PVC PVC PVC PVC PVC PVC PVC PVC PVC PVC
HazenWilliam sC
Flow (L/s)
Velocity (m/s)
Bentley Systems, Inc. Haestad Methods Solution Center 76 Watertown Road, Suite 2D Thomaston, CT 06787 USA +1-203-755-1666
Headloss Gradient (m/km)
WaterCAD [23.00.00.16] Page 1 of 1
Active Scenario: MDD+2.5L/S FlexTable: Reservoir Table Label R-1 R-2
Pinnacle HNA - 2024.wtg 2026-05-06
Elevation (m) 705.0 705.0
Flow (Out net) (L/s) 1.84 0.58
Flow (In net) (L/s)
Hydraulic Grade (m)
-1.84 -0.58
Bentley Systems, Inc. Haestad Methods Solution Center 76 Watertown Road, Suite 2D Thomaston, CT 06787 USA +1-203-755-1666
705.0 705.0
WaterCAD [23.00.00.16] Page 1 of 1
Boundary Conditions
Subdivision: Pinnacle Village Location: RL-64-54-25-4 SC Engineer: Brendan Pollmann Consultant: Arcadis Notes: Node J-78 is included and can be utilized in this assessment for the proposed secondary connection.
Boundary Node Location
Node J-275 Elevation 689.27 m
ADD PHD
kPa 519.18 493.00
Node J-78 Elevation 688.59 m HGL 742.39 739.64
MDD+FF 65.81 L/s Avaliable Fire Flow 161.3 kPa Residual Pressure
ADD PHD
kPa 527.10 504.10
HGL 742.45 740.10
MDD+FF 78.07 L/s Avaliable Fire Flow 176.6 kPa Residual Pressure
APPENDIX HNA REPORT NOVEMBER 2024
November 28, 2024
Arcadis Professional Services (Canada) Inc. Suite 300, 10120 103 Avenue Edmonton, Alberta T5J 3R6 Canada Phone: 780 428 4000 www.arcadis.com
Chris Krath, P.L.(Eng.) C.E.T. Senior Development Engineer Integrated Development & Land Services 9613 100 Street, Morinville, AB T8R 1L9
Dear Mr. Krath: PINNACLE VILLAGE - HYDRAULIC NETWORK ANALYSIS 1. INTRODUCTION Please find attached the Water Network Analysis in support of engineering design for Pinnacle Village. Pinnacle Village is located in Sturgeon county, NW ¼ SEC 25-54-25-W4M. Figure 1.0 shows the consumption boundary and water network for the site. Table 1.1 shows the connecting locations with the boundary conditions, which were provided by Sturgeon County on March 6th, 2024. Table 1.1: Boundary Conditions: Pinnacle Village
www.arcadis.com https://arcadiso365.sharepoint.com/sites/Projects1/133341/Internal Documents/6.0_Technical/6.01_General/04_Design-Analysis/HNA/2024-11-28/CCS-133341-SUB HNA_Pinnacle-2024-11-25.docx
1/4
Chris Krath, P.L.(Eng.) C.E.T. – November 28th, 2024
2. WATER DEMANDS The current Sturgeon County General Municipal Servicing Standards has been used for design criteria of this hydraulic network analysis. Note that fire flow testing was administered in the model to achieve as close to the provided fireflow and residual pressures as possible. It is known that there is limited fireflow availability here, so the report also shows the minimum HGL at the boundaries to achieve fireflow constraints as outlined in the GMSS. •
Average Day Demand (ADD)
320 L/c/d
•
Maximum Day Demand (MDD)
640 L/c/d
•
Peak Hour demand (PHD)
960 L/c/d
Table 2.1 shows the peak hour and maximum day demands used in the model, based on the zoning and consumption boundaries shown in Figure 1.0.
Table 2.1: Water Demand
JUNCTION/ZONE
Area (Ha)
Units/ Ha
NO. OF UNITS
Persons/ UNIT
POPULATION
MAX DAY DEMAND (l/s)
PEAK HOUR DEMAND (l/s)
AVERAGE DAY DEMAND (l/s)
J-1
R7
0
3.50
0
0.00
0.00
0.00
J-2
R7
13
3.50
46
0.34
0.51
0.17
J-3
R7
13
3.50
46
0.34
0.51
0.17
J-4
R7
12
3.50
42
0.31
0.47
0.16
J-5
R7
0
3.50
0
0.00
0.00
0.00
J-6
R7
13
3.50
46
0.34
0.51
0.17
J-7
R7
19
3.50
67
0.49
0.74
0.25
J-8
R7
19
3.50
67
0.49
0.74
0.25
J-9
R7
0
3.50
0
0.00
0.00
0.00
J-10
R7
13
3.50
46
0.34
0.51
0.17
J-11
R7
11
3.50
39
0.29
0.43
0.14
J-12
R7
10
3.50
35
0.26
0.39
0.13
J-13
R7
10
3.50
35
0.26
0.39
0.13
J-14
R7
11
3.50
39
0.29
0.43
0.14
J-15
R7
0
3.50
0
0.00
0.00
0.00
J-16
R7
0
3.50
0
0.00
0.00
0.00
J-17
R7
0
3.50
0
0.00
0.00
0.00
J-18
R7
0
3.50
0
0.00
0.00
0.00
413
3.06
4.59
1.53
Total
www.arcadis.com https://arcadiso365.sharepoint.com/sites/Projects1/133341/Internal Documents/6.0_Technical/6.01_General/04_Design-Analysis/HNA/2024-11-28/CCS-133341-SUB HNA_Pinnacle-2024-11-25.docx
2/4
Chris Krath, P.L.(Eng.) C.E.T. – November 28th, 2024
3. RESULTS Modeling results are summarized in Table 3.1. Figure 1.0 shows the pipe layout and diameter for each scenario.
AVERAGE DAY DEMAND (ADD) The lowest and highest pressures respectively were found to be 496 and 549 kPa at nodes J-18 and J-15. The velocities within the watermains are all under 1.5 m/s and headloss gradients were lower than 2.0 m/km.
PEAK HOUR DEMAND (PHD) The lowest and highest pressures respectively were found to be 470 and 522 kPa at nodes J-18 and J-15. The velocities within the watermains are all under 1.5 m/s and headloss gradients were lower than 2.0 m/km except for P-1(1) which was 2.909 m/km. This pipe is a long run and thus has higher then average frictions/headloss. The headloss is not high enough to be considered a major concern for the lifetime of the pipe, but there are some mitigation measures which could be taken such as upsizing.
MAXIMUM DAY DEMAND (MDD)+100 l/S FIRE FLOW The maximum day demand scenario was analyzed for 100 l/s fire flow. It was known that in the current condition, the system cannot adequately support the fireflow needs for the area. The system was iterated to get as close as possible to the provided fireflow and residual pressures to model the current scenario. In addition to this, an idealized scenario was modeled to show the minimum required hydraulic grade line at the boundaries to achieve the required fireflow servicing for the area. These HGL were found to be 713.5 and 713 respectively.
MDD
Table 3.1: Summary of Results Minimum Pressure (KPa)
At Node
Maximum Pressure (KPa)
At Node
Maximum Velocity (m/s)
Maximum Headloss Gradient (m/km)
ADD
496
J-18
549
J-15
0.219
0.379
PHD
470
J-18
522
J-15
0.659
2.909
<130
J-18
183
J-15
-
-
MDD + 100 l/s (Current)
If you have any questions concerning this or require any additional information, please contact the undersigned at (780) 428-4000.
www.arcadis.com https://arcadiso365.sharepoint.com/sites/Projects1/133341/Internal Documents/6.0_Technical/6.01_General/04_Design-Analysis/HNA/2024-11-28/CCS-133341-SUB HNA_Pinnacle-2024-11-25.docx
3/4
Chris Krath, P.L.(Eng.) C.E.T. – November 28th, 2024
ARCADIS
David Boniec-Jedras C.E.T. Project Technologist Reviewed by:
Ryan Tomas P.Eng. Business Unit Director - Civil/Land Development
www.arcadis.com https://arcadiso365.sharepoint.com/sites/Projects1/133341/Internal Documents/6.0_Technical/6.01_General/04_Design-Analysis/HNA/2024-11-28/CCS-133341-SUB HNA_Pinnacle-2024-11-25.docx
4/4
75
76
78
73
74
70
71
72
69
Stage 3 P-16 200 mm
J-12
67 41
91
92
62
61
89
64
63
0m
66
65
m
26
19
20
25
16
17
18
14
99
P-14 200 mm
93
94
Stage 1 60
119 Lots
45
22
21
12
24
22
21
11
J-16
59 95
J-4
*
57
J-11
P-13 200 m m
103
56 55
48 54
J-10
53 52
105
106
107
51
20
9
19
109 110
26
28
27 8
49
2
1
4
3
112
J-2
113
6
P-4 200 mm
114
117 118 119
J-8 15
14 3
4
5
6
7
P-2 200 m J-1
8
9
10
11
12
13
EMERGENCY ACCESS
mm
m
2
1 P-1
1
200
R-1
Road
16
P-10 200 mm
P-3 200 m
116
idge
J-3
m
115
17
5
50
111
tle R
18
7
P-12 200 mm
108
Tres
10 25 47
P-9(2)
58 96
200 mm
97
102
104
P-21 J-18 200 mm
46
P-5 200 mm
11 Lots
23
23
98 101
24
P-9(1)
200 mm
J-5
13
Stage 2
28
15
42
J-15 200 mmP-18
Legend
1 : 3000
17
20 90
100
29
J-7
P-8 200 mm
P-6 200 mm
Starkey Road
P88
30
27
J-6
J-14
86
87
31
32
33
40
200 mm P-15
J-13
34
35
68
14 Lots
85
36
37
38
39
NW 25-54-25-4
79
80
P-20 200 mm
81
82
P-7 200 mm
C:\Users\boniecd8486\ARCADIS\133341 Pinnacle Village - Internal Documents\6.0_Technical\6.01_General\04_Design-Analysis\HNA\2024-11-28\Analysis\ Pinnac
J-17 83 84
P-1(2) 200 mm
J-9
P-1(1)
200 mm
P
innaFigure 1.0 Stage Boundary cle P Consumption Boundary Water Demand Boundary oint R-1 Reservoir & Number & Water Network J-1 Junction Node & Number Preliminary HYD. Location Pinnacle Village P-1 Pipe Size & Number Date: November 2024 200 mm
ARCADIS PROFESSIONAL SERVICES (CANADA) INC #300, 10120 103 Avenue Edmonton AB T5J 3R6 Canada tel 780 428 4000 www.arcadis.com
R-2
Peak Hourly Demand
Active Scenario: PHD FlexTable: Reservoir Table Label R-1 R-2
Pinnacle HNA - 2024.wtg 2024-11-27
Elevation (m) 739.6 740.1
Flow (Out net) (L/s) -15.08 20.71
Hydraulic Grade (m) 739.6 740.1
Bentley Systems, Inc. Haestad Methods Solution Center 76 Watertown Road, Suite 2D Thomaston, CT 06787 USA +1-203-755-1666
WaterCAD [23.00.00.16] Page 1 of 1
Active Scenario: PHD FlexTable: Junction Table Label J-1 J-2 J-3 J-4 J-5 J-6 J-7 J-8 J-9 J-10 J-11 J-12 J-13 J-14 J-15 J-16 J-17 J-18
Pinnacle HNA - 2024.wtg 2024-11-27
Elevation (m)
Demand (L/s) 688.8 688.7 689.1 688.3 688.2 688.5 688.8 689.5 688.5 688.4 689.1 688.3 688.5 688.8 686.3 690.1 689.2 691.7
Hydraulic Grade (m) 0.00 0.51 0.51 0.47 0.00 0.51 0.74 0.74 0.00 0.51 0.43 0.39 0.39 0.43 0.00 0.00 0.00 0.00
Bentley Systems, Inc. Haestad Methods Solution Center 76 Watertown Road, Suite 2D Thomaston, CT 06787 USA +1-203-755-1666
739.7 739.7 739.7 739.7 739.7 739.7 739.7 739.7 739.8 739.7 739.7 739.7 739.7 739.7 739.7 739.7 739.7 739.7
Pressure (kPa) 498 499 495 503 503 501 498 492 502 502 495 503 501 498 522 486 494 470
WaterCAD [23.00.00.16] Page 1 of 1
Active Scenario: PHD FlexTable: Pipe Table Label
Start Node
Stop Node
P-2 P-3 P-4 P-5 P-6 P-7 P-8 P-10 P-1(1) P-1(2) P-11 P-12 P-13 P-14 P-15 P-16 P-17 P-18 P-9(1) P-9(2) P-20 P-21
J-1 R-1 J-2 J-3 J-4 J-5 J-6 J-8 R-2 J-9 J-9 J-2 J-10 J-10 J-12 J-12 J-14 J-15 J-7 J-16 J-7 J-16
R-1 J-2 J-3 J-4 J-5 J-6 J-7 J-3 J-9 J-1 J-8 J-10 J-11 J-12 J-13 J-14 J-15 J-5 J-16 J-8 J-17 J-18
Pinnacle HNA - 2024.wtg 2024-11-27
Length (m) 28 39 64 89 52 42 134 138 103 248 74 162 85 136 91 111 73 50 92 92 46 41
Diameter (mm) 200 200 200 200 200 200 200 200 200 200 200 200 200 200 200 200 200 200 200 200 200 200
Material
PVC PVC PVC PVC PVC PVC PVC PVC PVC PVC PVC PVC PVC PVC PVC PVC PVC PVC PVC PVC PVC PVC
HazenWilliams C 120.0 120.0 120.0 120.0 120.0 120.0 120.0 120.0 120.0 120.0 120.0 120.0 120.0 120.0 120.0 120.0 120.0 120.0 120.0 120.0 120.0 120.0
Bentley Systems, Inc. Haestad Methods Solution Center 76 Watertown Road, Suite 2D Thomaston, CT 06787 USA +1-203-755-1666
Flow (L/s) 8.72 -6.37 -6.16 0.14 -0.33 -3.19 -3.70 6.81 20.71 8.72 12.00 -0.71 0.43 -1.65 0.39 -2.43 -2.86 -2.86 -4.44 -4.44 0.00 0.00
Velocity (m/s) 0.277 0.203 0.196 0.004 0.011 0.102 0.118 0.217 0.659 0.277 0.382 0.023 0.014 0.053 0.012 0.077 0.091 0.091 0.141 0.141 0.000 0.000
Headloss Gradient (m/km) 0.586 0.328 0.308 0.000 0.001 0.091 0.120 0.371 2.909 0.585 1.058 0.006 0.002 0.027 0.002 0.056 0.074 0.075 0.168 0.168 0.000 0.000
WaterCAD [23.00.00.16] Page 1 of 1
Average Day Demand
Active Scenario: ADD FlexTable: Junction Table Label J-1 J-2 J-3 J-4 J-5 J-6 J-7 J-8 J-9 J-10 J-11 J-12 J-13 J-14 J-15 J-16 J-17 J-18
Pinnacle HNA - 2024.wtg 2024-11-27
Elevation (m)
Demand (L/s) 688.8 688.7 689.1 688.3 688.2 688.5 688.8 689.5 688.5 688.4 689.1 688.3 688.5 688.8 686.3 690.1 689.2 691.7
Hydraulic Grade (m) 0.00 0.17 0.17 0.16 0.00 0.17 0.25 0.25 0.00 0.17 0.14 0.13 0.13 0.14 0.00 0.00 0.00 0.00
Bentley Systems, Inc. Haestad Methods Solution Center 76 Watertown Road, Suite 2D Thomaston, CT 06787 USA +1-203-755-1666
742.4 742.4 742.4 742.4 742.4 742.4 742.4 742.4 742.4 742.4 742.4 742.4 742.4 742.4 742.4 742.4 742.4 742.4
Pressure (kPa) 524 526 522 529 530 528 525 518 528 529 522 530 528 525 549 512 521 496
WaterCAD [23.00.00.16] Page 1 of 1
Active Scenario: ADD FlexTable: Pipe Table Label
Start Node
Stop Node
P-2 P-3 P-4 P-5 P-6 P-7 P-8 P-10 P-1(1) P-1(2) P-11 P-12 P-13 P-14 P-15 P-16 P-17 P-18 P-9(1) P-9(2) P-20 P-21
J-1 R-1 J-2 J-3 J-4 J-5 J-6 J-8 R-2 J-9 J-9 J-2 J-10 J-10 J-12 J-12 J-14 J-15 J-7 J-16 J-7 J-16
R-1 J-2 J-3 J-4 J-5 J-6 J-7 J-3 J-9 J-1 J-8 J-10 J-11 J-12 J-13 J-14 J-15 J-5 J-16 J-8 J-17 J-18
Pinnacle HNA - 2024.wtg 2024-11-27
Length (m)
Diameter (mm)
28 39 64 89 52 42 134 138 103 248 74 162 85 136 91 111 73 50 92 92 46 41
200 200 200 200 200 200 200 200 200 200 200 200 200 200 200 200 200 200 200 200 200 200
Material
PVC PVC PVC PVC PVC PVC PVC PVC PVC PVC PVC PVC PVC PVC PVC PVC PVC PVC PVC PVC PVC PVC
HazenWilliams C 120.0 120.0 120.0 120.0 120.0 120.0 120.0 120.0 120.0 120.0 120.0 120.0 120.0 120.0 120.0 120.0 120.0 120.0 120.0 120.0 120.0 120.0
Bentley Systems, Inc. Haestad Methods Solution Center 76 Watertown Road, Suite 2D Thomaston, CT 06787 USA +1-203-755-1666
Flow (L/s) 2.90 -2.12 -2.05 0.05 -0.11 -1.06 -1.23 2.27 6.90 2.90 4.00 -0.24 0.14 -0.55 0.13 -0.81 -0.95 -0.95 -1.48 -1.48 0.00 0.00
Velocity (m/s) 0.092 0.067 0.065 0.002 0.004 0.034 0.039 0.072 0.219 0.092 0.127 0.008 0.004 0.017 0.004 0.026 0.030 0.030 0.047 0.047 0.000 0.000
Headloss Gradient (m/km) 0.076 0.042 0.041 0.000 0.000 0.012 0.015 0.048 0.379 0.076 0.139 0.001 0.000 0.003 0.000 0.007 0.009 0.010 0.022 0.022 0.000 0.000
WaterCAD [23.00.00.16] Page 1 of 1
Active Scenario: ADD FlexTable: Reservoir Table Label R-1 R-2
Pinnacle HNA - 2024.wtg 2024-11-27
Elevation (m) 742.4 742.5
Flow (Out net) (L/s) -5.02 6.90
Hydraulic Grade (m) 742.4 742.5
Bentley Systems, Inc. Haestad Methods Solution Center 76 Watertown Road, Suite 2D Thomaston, CT 06787 USA +1-203-755-1666
WaterCAD [23.00.00.16] Page 1 of 1
Max Daily Demand Current Scenario 100 l/s FF
Active Scenario: MDD+100L/S Fire Flow Node FlexTable: Fire Flow Report Label
J-1 J-2 J-3 J-4 J-5 J-6 J-7 J-8 J-9 J-10 J-11 J-12 J-13 J-14 J-15 J-16 J-17 J-18
Pinnacle HNA - 2024.wtg 2024-11-27
Satisfies Fire Flow Constraints?
False False False False False False False False False False False False False False False False False False
Flow (Total Needed) (L/s)
100.00 100.34 100.34 100.31 100.00 100.34 100.49 100.49 100.00 100.34 100.29 100.26 100.26 100.29 100.00 100.00 100.00 100.00
Flow (Total Available) (L/s)
Pressure (Calculated Residual) (kPa)
0.00 0.34 0.34 0.31 0.00 0.34 0.49 0.49 0.00 0.34 0.29 0.26 0.26 0.29 0.00 0.00 0.00 0.00
Bentley Systems, Inc. Haestad Methods Solution Center 27 Siemon Company Drive Suite 200 W Watertown, CT 06795 USA +1-203-755-1666
159 160 156 163 164 162 159 152 161 163 156 164 162 159 183 146 155 130
Pressure (Calculated Zone Lower Limit) (kPa) 130 130 130 130 130 130 130 130 130 130 130 130 130 130 130 130 130 146
WaterCAD [10.03.02.75] Page 1 of 1
Active Scenario: MDD+100L/S FlexTable: Reservoir Table Label
R-1 R-2
Pinnacle HNA - 2024.wtg 2024-11-27
Elevation (m) 705.0 705.0
Flow (Out net) (L/s) 2.84 0.91
Hydraulic Grade (m) 705.0 705.0
Bentley Systems, Inc. Haestad Methods Solution Center 27 Siemon Company Drive Suite 200 W Watertown, CT 06795 USA +1-203-755-1666
WaterCAD [10.03.02.75] Page 1 of 1
Max Daily Demand Idealized Scenario 100 l/s FF
Active Scenario: MDD+100L/S Fire Flow Node FlexTable: Fire Flow Report Label
J-1 J-2 J-3 J-4 J-5 J-6 J-7 J-8 J-9 J-10 J-11 J-12 J-13 J-14 J-15 J-16 J-17 J-18
Pinnacle HNA - 2024.wtg 2024-11-27
Satisfies Fire Flow Constraints?
True True True True True True True True True True True True True True True True True True
Flow (Total Needed) (L/s)
100.00 100.34 100.34 100.31 100.00 100.34 100.49 100.49 100.00 100.34 100.29 100.26 100.26 100.29 100.00 100.00 100.00 100.00
Flow (Total Available) (L/s)
Pressure (Calculated Residual) (kPa)
300.00 300.34 250.15 196.10 194.94 173.88 153.54 219.71 300.00 149.18 103.30 142.78 100.82 147.96 175.67 142.68 120.71 111.23
Bentley Systems, Inc. Haestad Methods Solution Center 27 Siemon Company Drive Suite 200 W Watertown, CT 06795 USA +1-203-755-1666
170 156 140 140 140 140 144 154 151 147 140 142 140 140 151 156 140 140
Pressure (Calculated Zone Lower Limit) (kPa) 205 156 148 160 145 157 140 140 158 140 195 140 191 165 140 140 171 182
WaterCAD [10.03.02.75] Page 1 of 1
Active Scenario: MDD+100L/S FlexTable: Reservoir Table Label
R-1 R-2
Pinnacle HNA - 2024.wtg 2024-11-27
Elevation (m) 713.5 713.0
Flow (Out net) (L/s) 24.06 -20.31
Hydraulic Grade (m) 713.5 713.0
Bentley Systems, Inc. Haestad Methods Solution Center 27 Siemon Company Drive Suite 200 W Watertown, CT 06795 USA +1-203-755-1666
WaterCAD [10.03.02.75] Page 1 of 1