2025 Naplan Results

Page 1

NAPLAN RESULTS

2025

700

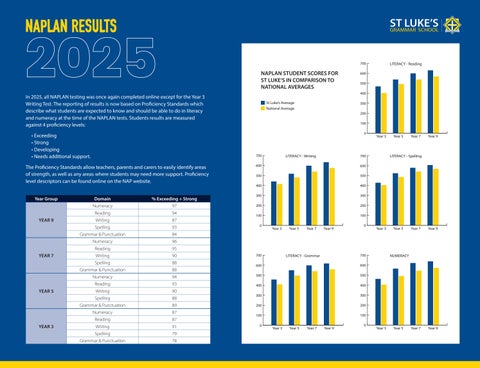
NAPLAN STUDENT SCORES FOR ST LUKE’S IN COMPARISON TO NATIONAL AVERAGES

YEAR 9

YEAR 7

YEAR 5

YEAR 3

Domain Numeracy Reading Writing Spelling Grammar & Punctuation Numeracy Reading Writing Spelling Grammar & Punctuation Numeracy Reading Writing Spelling Grammar & Punctuation Numeracy Reading Writing Spelling Grammar & Punctuation

500

St Luke’s Average National Average

300 200 100 0

700

The Proficiency Standards allow teachers, parents and carers to easily identify areas of strength, as well as any areas where students may need more support. Proficiency level descriptors can be found online on the NAP website. Year Group

600

400

In 2025, all NAPLAN testing was once again completed online except for the Year 3 Writing Test. The reporting of results is now based on Proficiency Standards which describe what students are expected to know and should be able to do in literacy and numeracy at the time of the NAPLAN tests. Students results are measured against 4 proficiency levels: • Exceeding • Strong • Developing • Needs additional support.

% Exceeding + Strong 97 94 87 93 84 96 95 90 88 88 94 93 90 88 89 87 87 91 79 78

LITERACY - Reading

700

LITERACY - Writing

600

600

500

500

400

400

300

300

200

200

100

100

0

Year 3

700

Year 5

Year 7

Year 9

0

600

500

500

400

400

300

300

200

200

100

100

Year 3

Year 5

Year 7

Year 9

0

Year 5

Year 7

Year 9

LITERACY - Spelling

Year 3

700

LITERACY - Grammar

600

0

Year 3

Year 5

Year 7

Year 9

Year 7

Year 9

NUMERACY

Year 3

Year 5


Turn static files into dynamic content formats.

Create a flipbook
2025 Naplan Results by St Luke's Grammar School - Issuu