Campus is home to 51,316 students, 5,696 faculty and academic staff, 565 buildings, 124 miles of sidewalk, 115 miles of storm sewers, nine bridges, 32,163 parking spaces, 21,710 trees, 1,477 streetlights … you get the idea. It can be hard to grasp the size of MSU, especially when the forces that make life on-campus possible often work behind the scenes.
In an attempt to better illustrate the magnitude of the university, The State News spent weeks collecting data from Michigan State University spokespeople and organizations, as well as from yearly reports, university webpages and previous reporting.
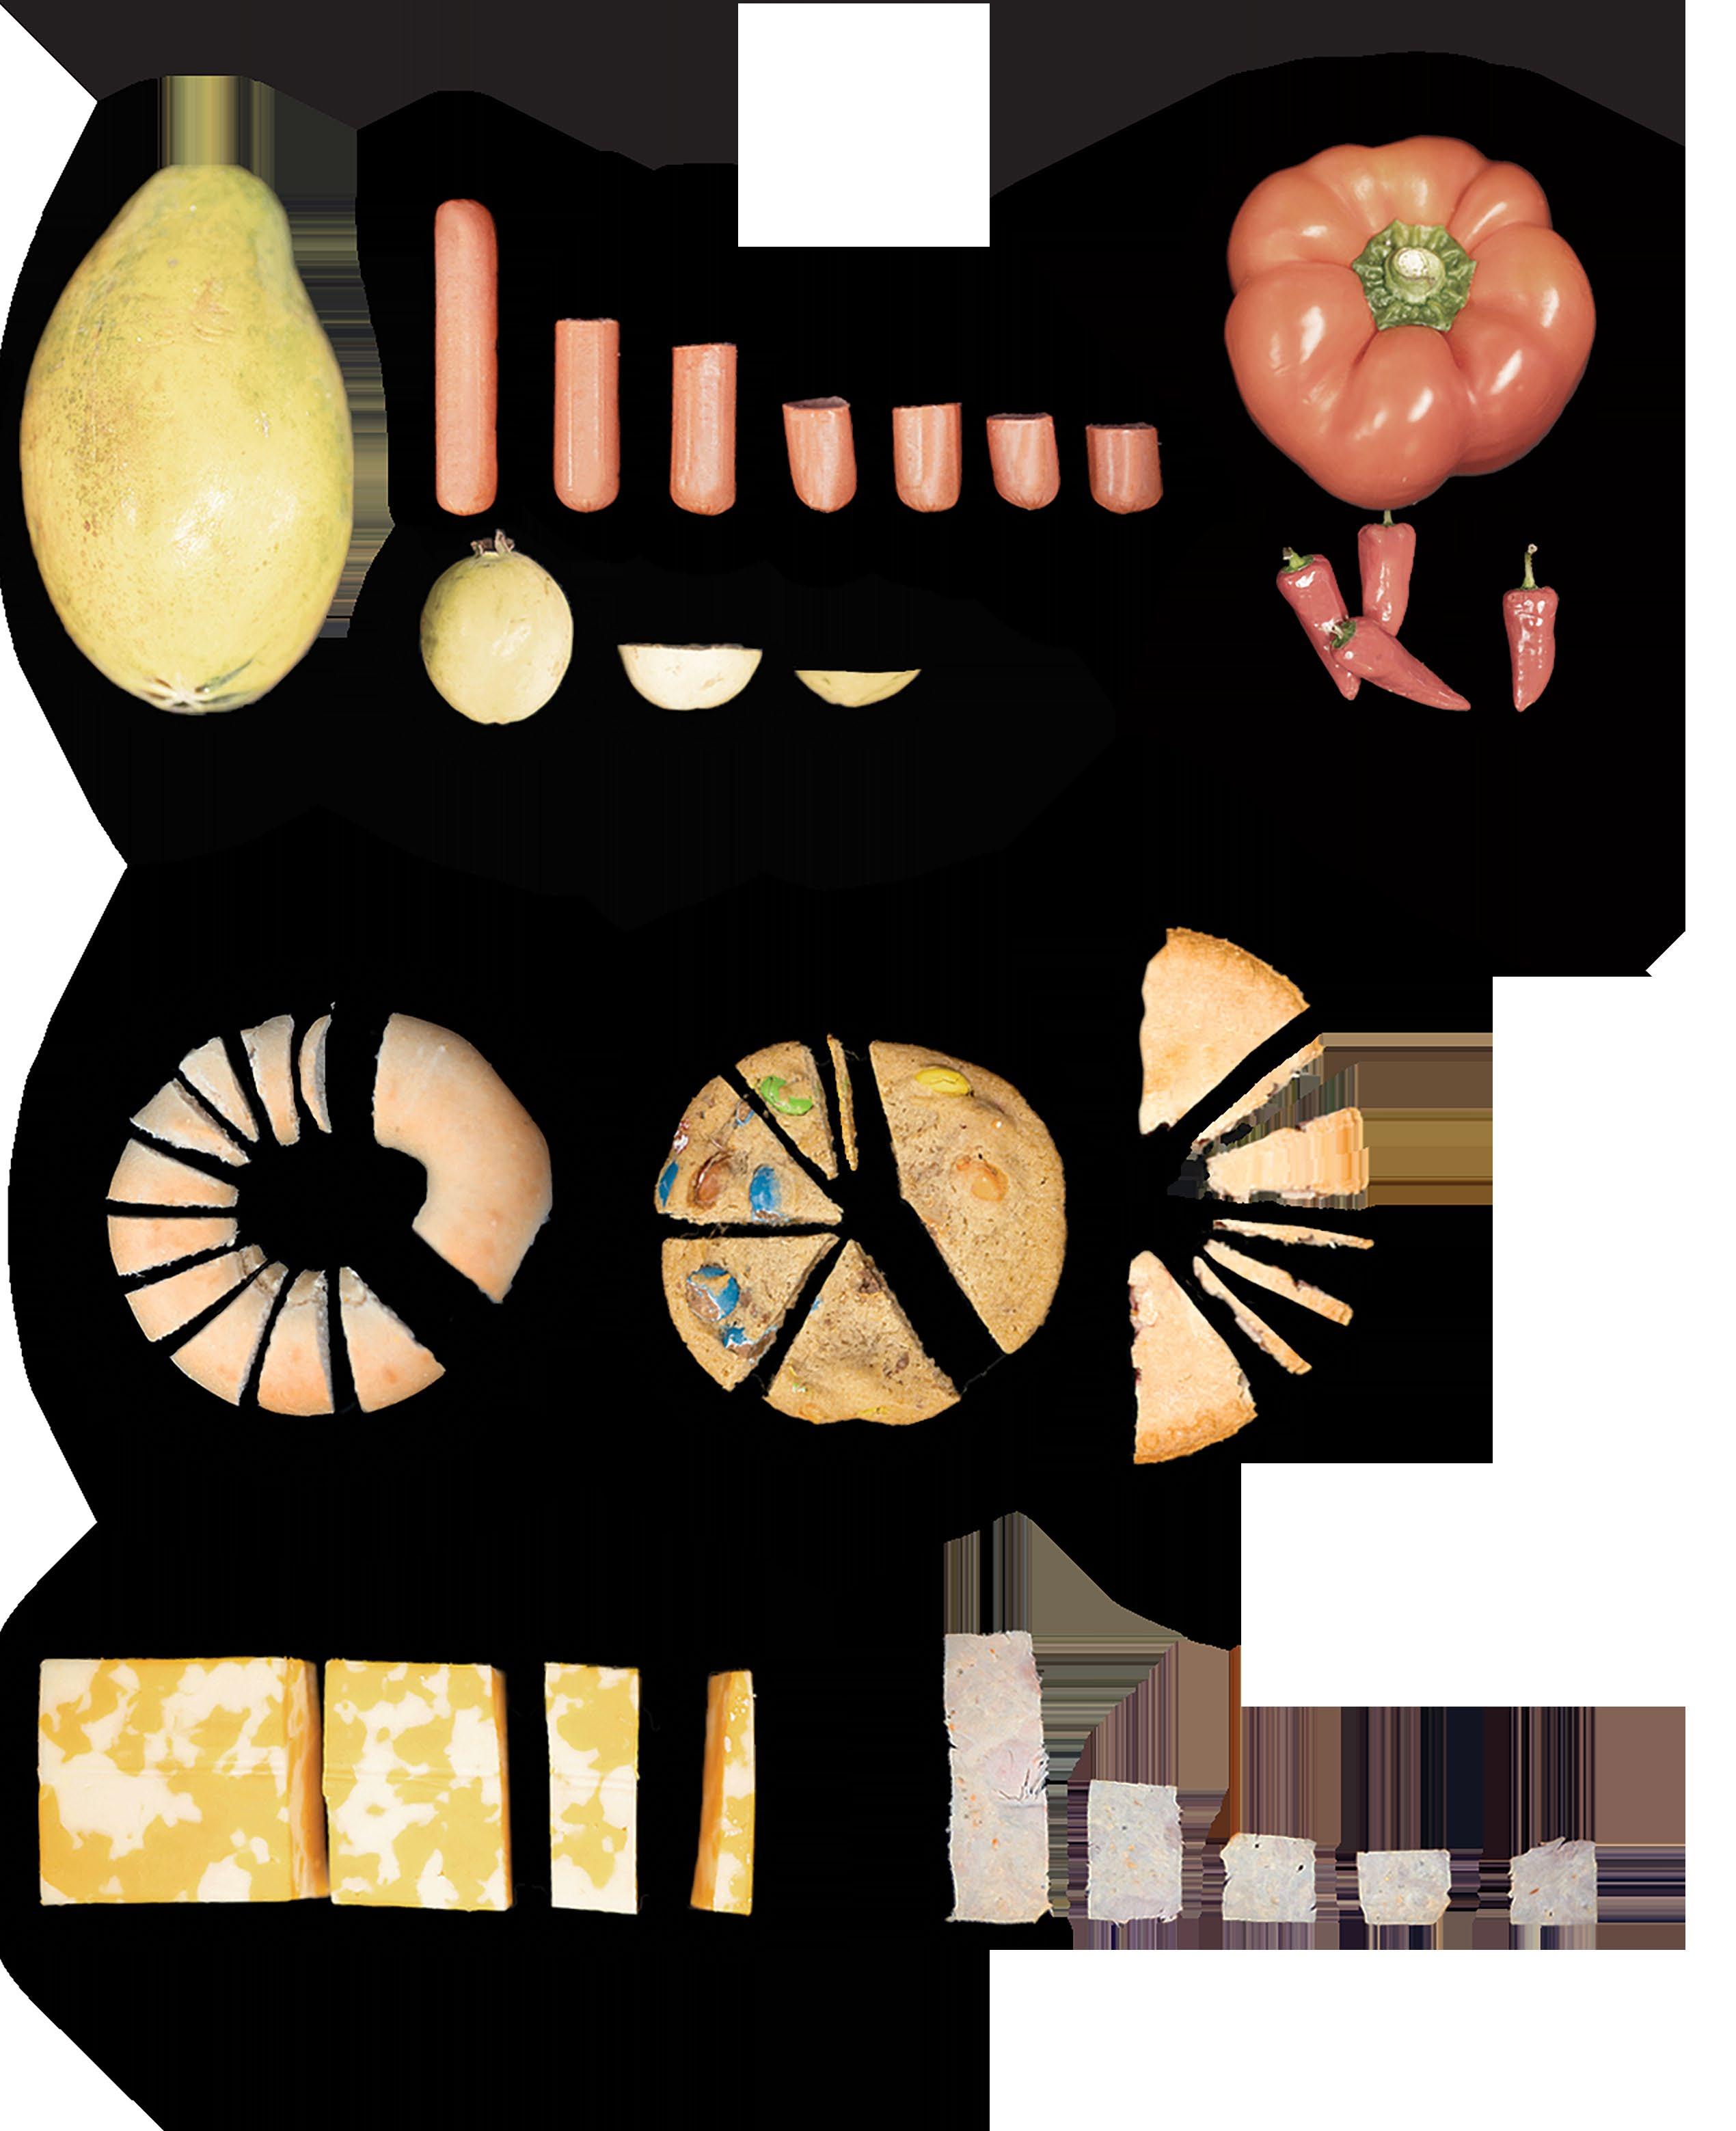
The result is a collection of over 100 statistics showing what happens during an average week on campus, from the number of blueberry bagels delivered to dining halls to the number of students reported for academic misconduct.
The State News calculated nearly every statistic from the most recent annual information, meaning the statistics listed don’t account for variations between fall, spring and summer semesters.
A WEEK IN DINING
Thousands of mouths are fed each week by the university’s nine dining halls, 14 Sparty’s and a handful of other culinary projects. MSU Culinary Services sources food from nearly 400 vendors from as far as 600 miles away, according to a 2021 food procurement guide.
Much of the food is sourced locally. The majority of the baked goods in dining halls and Sparty’s, for example, are made by MSU Bakers, a campus bakery.
Per the MSU Health and Wellbeing 2023 Annual Report, 154 people are served over 1,923 pounds of food by the MSU Food Bank.
Fruit (lbs)
(lbs)
beef and sausage (lbs)
Misc. baked goods
Thousands of protestors gather for the 50501 movement in protest of the Trump administration’s executive actions at the Michigan State Capitol in Lansing on April 5, 2025. Photo by Finn Gomez.
Just down the street from Michigan State University’s campus is a shop that is “strange and unusual.”
Jenn Carpenter brings spooky to the heart of downtown Lansing through her bookstore Deadtime Stories: True Crime and Other Books, located in REO Town.
Carpenter entered the world of horror as a “paranormal” tour guide with Demented Mitten Tours, a tour company based in midMichigan. However, due to COVID-19, their tours were indefnitely put on hold — which led Carpenter to decide she needed a different outlet to continue her work.
Carpenter has a love for both books and writing, and published “Haunted Lansing” in 2018. In her book, she combines chapters about the history of Lansing with thrilling ghost stories.
After publishing her book, she was persuaded to start a podcast with her
TRUE CRIME AND HORROR LURKS IN THE HEART OF DOWNTOWN LANSING
friend, which they titled, “Violent End.” It debuted in 2019 under the name “So Dead.”
In the podcast, she talks about true crime topics throughout the state of Michigan. With over 100 episodes released, she has covered topics ranging from murderers and ghosts to her personal favorite — the Courthouse Square Museum.
The Courthouse Square Museum, located in Charlotte, was an active courthouse for over 100 years, housing notable cases such as the frst woman tried for murder in Michigan and the original trial for the East Lansing Murderer, Don Miller. It is now open to the public as a museum.
“We started with the plan to start with the Michigan stuff and local stuff and then expand when we ran out. But that is not a thing — there is just so much,” Carpenter said.
Through all these different chapters in her life, Carpenter has been able to closely connect the things she loves through her bookshop.
After operating in the basement of Thrift Witch thrift shop for six months, “It became
pretty clear that we were going to need a space of our own,” Carpenter said.
From true crime books by popular authors like Stephen King, to a whole section dedicated to the haunts of Michigan, the store offers a wide selection of choices. Because of the tours and writing her book “Haunted Lansing,” Carpenter knew about Michigan based true crime authors that she could showcase throughout the store.
The bookstore has done more than connect Lansing residents to the true crime and horror scene. It has brought them closer to Carpenter.
“They all have become friends,” Carpenter said. “I’ve got customers who have taken their engagement photos here, and senior pictures here.”
Some customers don’t just come for the books or trinkets, they come to see some unusual creatures in the Screamatorium.
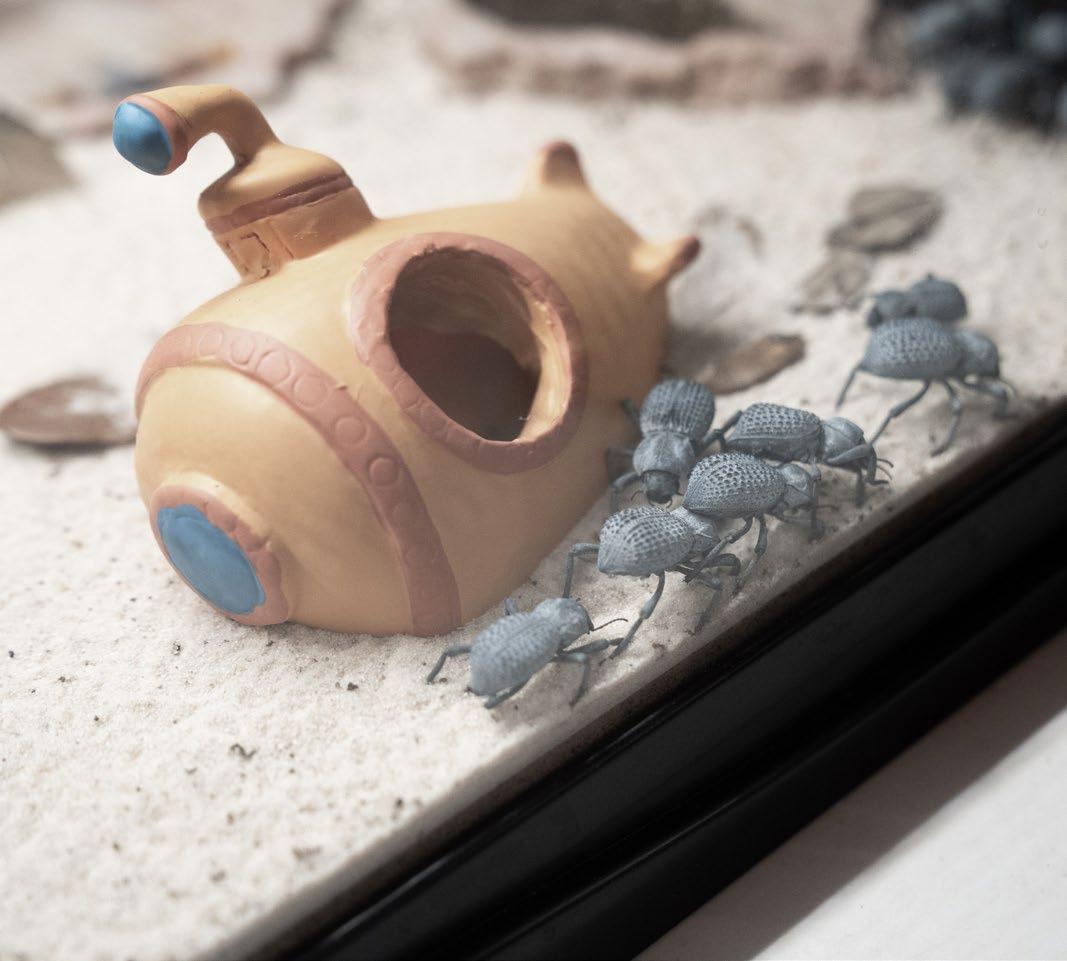
There are two cats, Morrison and Hendrix, as well as spiders and other insects in the store, some of which are available for purchase.
Deadtime Stories has more oddities than
your average bookstore, like “Psycho Killer Candles” and “Witches Brew Bath Ritual Kits.”
Even with the frightening decor and themes, Carpenter believes she has made the space fun and open for everyone.
As they recently celebrated their fourth anniversary, a second location named Deadtime Stories: The Sequel will be opening in the Courthouse Square Museum this June. Carpenter posted on Facebook saying that younger her loved books, bugs and museum gift shops.
“The fact that I am opening a book, bug and gift shop inside a museum, a haunted museum no less, would make little Jenn’s head explode,” Carpenter wrote on the store’s social media pages.
Carpenter said that the second store is slated to open this June and that over 200 people have shown interest on social media.
“It’s really wonderful to form those kinds of connections with people through common interests,” Carpenter said.
Bugs and crawling creatures at Deadtime Stories: True Crime and Other Books bookstore on April 3, 2025. Photo by Campbell Berg.
The Tub of Terror, full of books like “The Michigan Murders” and “Blind Faith” on April 3, 2025, located by the front of Deadtime Stories: True Crime and Other Books. Photo by Campbell Berg.
Hendrix, one of the two bookstore cats, lives inside Deadtime Stories: True Crime and Other Books bookstore. Photo by Campbell Berg.
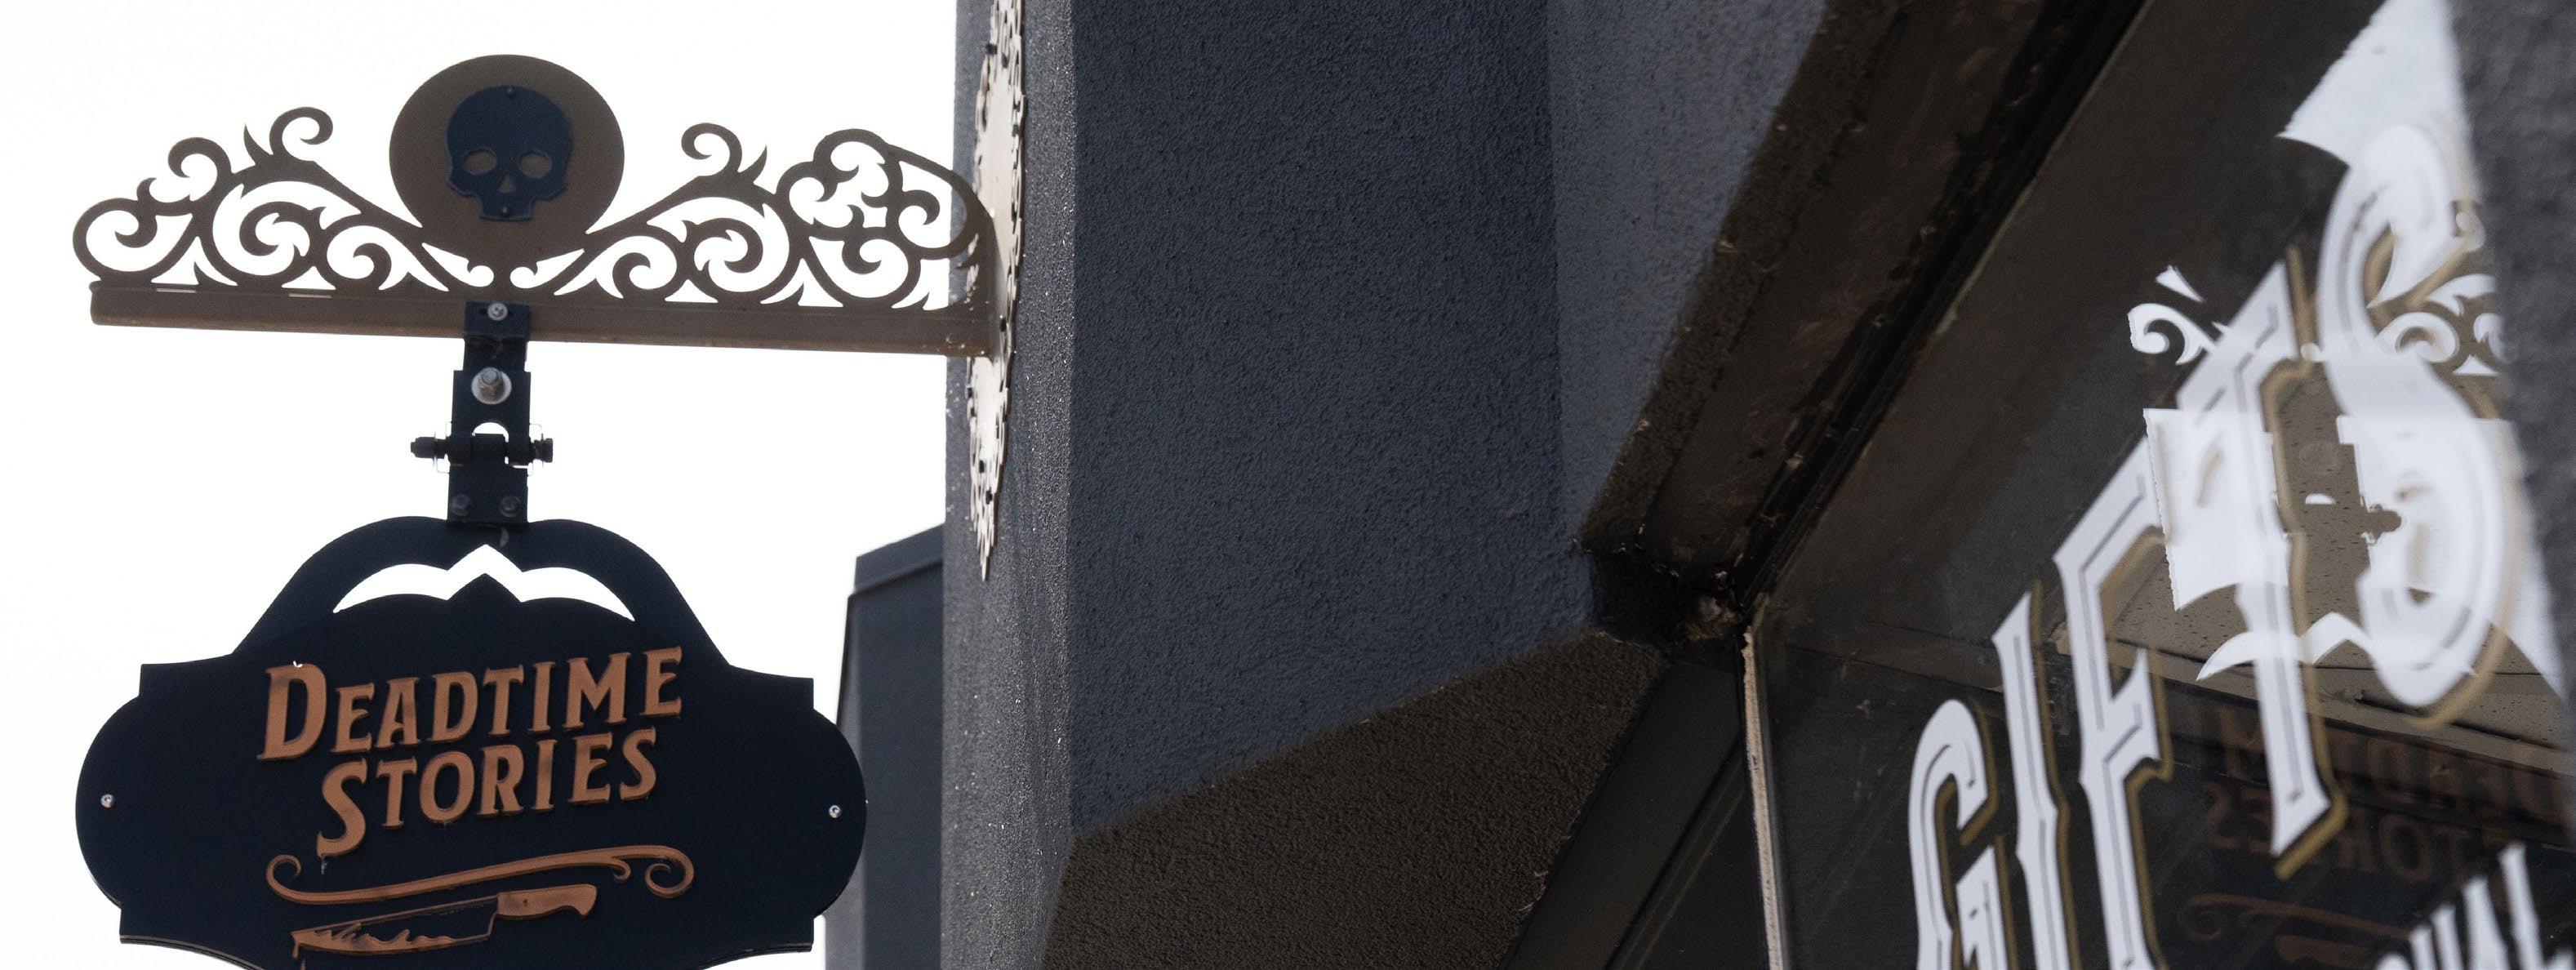
Deadtime Stories: True Crime and Other Books is described as a “strange and unusual” bookstore through the signs outside its doors on April 3, 2025. The Lansing bookstore is dedicated to true crime and horror books. Photo by Campbell Berg.
A WEEK AT MSU, BY THE NUMBERS
A WEEK IN SUSTAINABILITY
It’s unclear exactly how much of that food is eaten. A now-inactive initiative found in 2019 that dining-hall-goers produced an average of 2.96 ounces of food waste per person per meal. What’s more easily understood is how much waste is produced by campus overall and where it goes.
e university has its own recycling center, whose roughly 90 employees process and ship out about two semi truck loads of recycled material a week. Over a million worms transform dining hall waste into premium compost in MSU’s vermicomposting facility. And its two anaerobic digesters use bacteria to turn food and farm waste into methane.
In the average week:
19,230, 769 est. gallons of wastewater are produced.
248,257 pounds of campus waste are disposed at a landfill.
5 gigawatt hours of electricity are generated by the campus power plant, equivalent to the annual energy consumption of 463 average U.S. households.
17,500,000-28,000,000 gallons of water are used overall.
36,461,538 pounds of steam are produced for campus use (including heating, hot water and absorption cooling).
109,159 pounds of material (paper, cardboard, plastic bottles/tubs/jugs, metal and glass bottles/jars) are recycled.
pounds of organic material are processed for composting.
pounds of organic material are processed through vermicomposting.
of waste are added to the anaerobic digester.
Sources: Infrastructure Planning and Facilities Spokesperson Erica Venton, Michigan State University Surplus Store and Recycling Center service manager Dave Smith, Anaerobic Digestion Research and Education Center (ADREC).
A WEEK IN HEALTH
Flushing out the massive amounts of waste MSU produces keeps campus healthy and running. So does MSU’s health clinic and gyms, whose services are used by thousands each week to maintain their physical and mental wellness.
In the average week:
35,000 students work out at IM West, IM East, and IM Circle. 85 group exercise classes are held throughout campus.
Sexual wellness
673 condoms are distributed through MSU’s Condom Connection program.
Primary care
Psychiatric care
A WEEK IN SAFETY
ere are several safety apparatuses on campus.
MSU’s O ce of Civil Rights (OCR) handles reports of sexual misconduct and bias, though these cases are usually dropped before they end in a formal decision by the department. MSU’s campus police department, which employs over 60 o cers, responds to 911 calls referred to it by Ingham County 911 Dispatch and makes rounds across campus.
In the average week:
ASMSU Safe Ride
Safety report calls
4 anonymous calls are made to the Center for Survivors’ 24hour sexual assault hotline.
198 service calls are responded to by campus police officers, including both calls that come in from 911 dispatch and ones that were self-initiated. Of these calls:
Office of Civil Rights
8 reports are sent to OCR that describe potential violations of the university’s Anti-Discrimination
15 reports are sent to OCR that describe potential violations of the Relationship Violence and Sexual Misconduct (RVSM) and Title IX policies.
4 reports are sent to OCR that are a blend of both the Anti-DIscrimination Policy and the RVSM and Title IX Policy.
11 supportive measures are provided by OCR in connection to such reported misconduct, such as no-contact directives and changes to class schedules.
1 OCR case is resolved through formal investigation. This case:
• Took an average of
• Has a 37% student, a chance they’re neither
• Has a 25% that the appeal will overturn the decision
Source: 2024 OCR data provided by Title IX Communications Manager Chris Chapman.
Illustrations by Addison Ogburn.
Source: ASMSU Vice President for Finance and Operations Delaney Jones.
Sources: MSU Health and Wellbeing 2023 Annual Report, MSU DPPS spokesperson Nadia Vizueta.
Source: MSU DPPS spokesperson Nadia Vizueta.
A WEEK AT MSU, BY THE NUMBERS
A WEEK IN EDUCATION
Between the meals, workouts and police calls, it’s easy to lose sight of why students enroll in a university in the rst place. In terms of education, MSU o ers over 400 areas of study across its 17 colleges, according to a university webpage.
In the average week:
Classes
8,600 classes are held on all campuses, of which:
7,179
Sources: ASMSU Vice President for Finance and Operations Delaney Jones, Chief Communications Officer for Student Life and Engagement Kat Cooper, MSU Library Head of Access Services Erin Weller.
Source: Data from the Registrar’s Office from 3/16-3/22, provided by MSU spokesperson Mark Bullion.
Source: Data from 2023 and 2024, provided by MSU Spokesperson Mark Bullion.
Illustrations by Addison Ogburn.
By Jania Clowers jclowers@statenews.com
No. 8 Michigan State University gymnastics has ualifed for the C Championships semifinals in ort orth, e as, for the second time in program history and the frst since 1988.
he Spartans were the second highest scoring team at the C egional inals with a score of . , just ehind S ’s . . oth teams outscored entuc y . and r ansas . .
ver the last four seasons, MS has reached the regional fnal consistently, fnishing third three times and last season the Spartans placed fourth.
e wor ed a lot on from the shoulders up, ecause we had the talent, we had the consistency, and we got to the regional fnal last year and something just went wrong and we couldn’t put our fnger on it,” MS gymnastics head coach Mi e owe said. nd we just thought if we wor more on us and what’s going on and positive thoughts. thin that helped a lot. oday we came in just really rela ed and confdent, and we had a season high score the other day, which was nice, so it just really set us up.”
he Spartans opened the meet on floor e ercise. ifth year elanie ar ness led off
with a smooth routine that scored a . . unior lle eaufait uncharacteristically posted a . , a rare dip in an otherwise consistent lineup. Senior S yla Schulte anchored the rotation with an energetic and clean routine that earned a . , helping MS fnish strong. fter the frst rotation, the Spartans trailed S y just . , . to . . MS ’s second rotation was on vault. Sophomore Ma ayla uc er opened with a career high tying . . uniors i i Smith and Sage ellerman each posted a . , tying for frst place in the event. s a team, the Spartans ro e their vault record again this season with a rotation score of . . fter two rotations the Spartans remained in second with a running score of . . S on top with . , entuc y in third with a running score of . , and r ansas in fourth with . .
MS ’s third rotation was on the uneven ars. unior livia sarmani delivered a career high tying . , followed y junior i i Smith, who matched her own career high with a . . Smith’s standout routine generated u throughout the arena and earned her frst place in the event. he Spartans closed the rotation with a running score of . . eading into the fnal rotation, S held a narrow . lead over MS , . to . . entuc y followed with . ,
MSU gymnastics makes program history, clinches spot in NCAA Championships
and r ansas trailed at . . n alance eam, three Spartans led the way with scores of . freshman Cady uplissis, senior S yla Schulte and ffth year elanie ar ness. MS wrapped up the rotation with a . . MS couldn’t uite overta e S throughout the meet and fnished as the second highest scoring team. S placed frst with a . , followed closely y MS with a . . entuc y too third with a . , and r ansas rounded out the meet at . . Smith capped off her stellar day as the ll
round Champion with a total score of . . oing into nationals, owe said ta ing the entire team is what he is most e cited a out. o ta e the team,” he said. ust ta ing individuals for the last couple of years they have een great and done great things ut their always li e wish my team was here. hey have no idea. hey now they have more fuel in the tan , they are going to surprise some people at nationals. hey are not done.”
MS gymnastics will compete in the C ymnastics Championships semifnals in ort orth, e as, from pril .
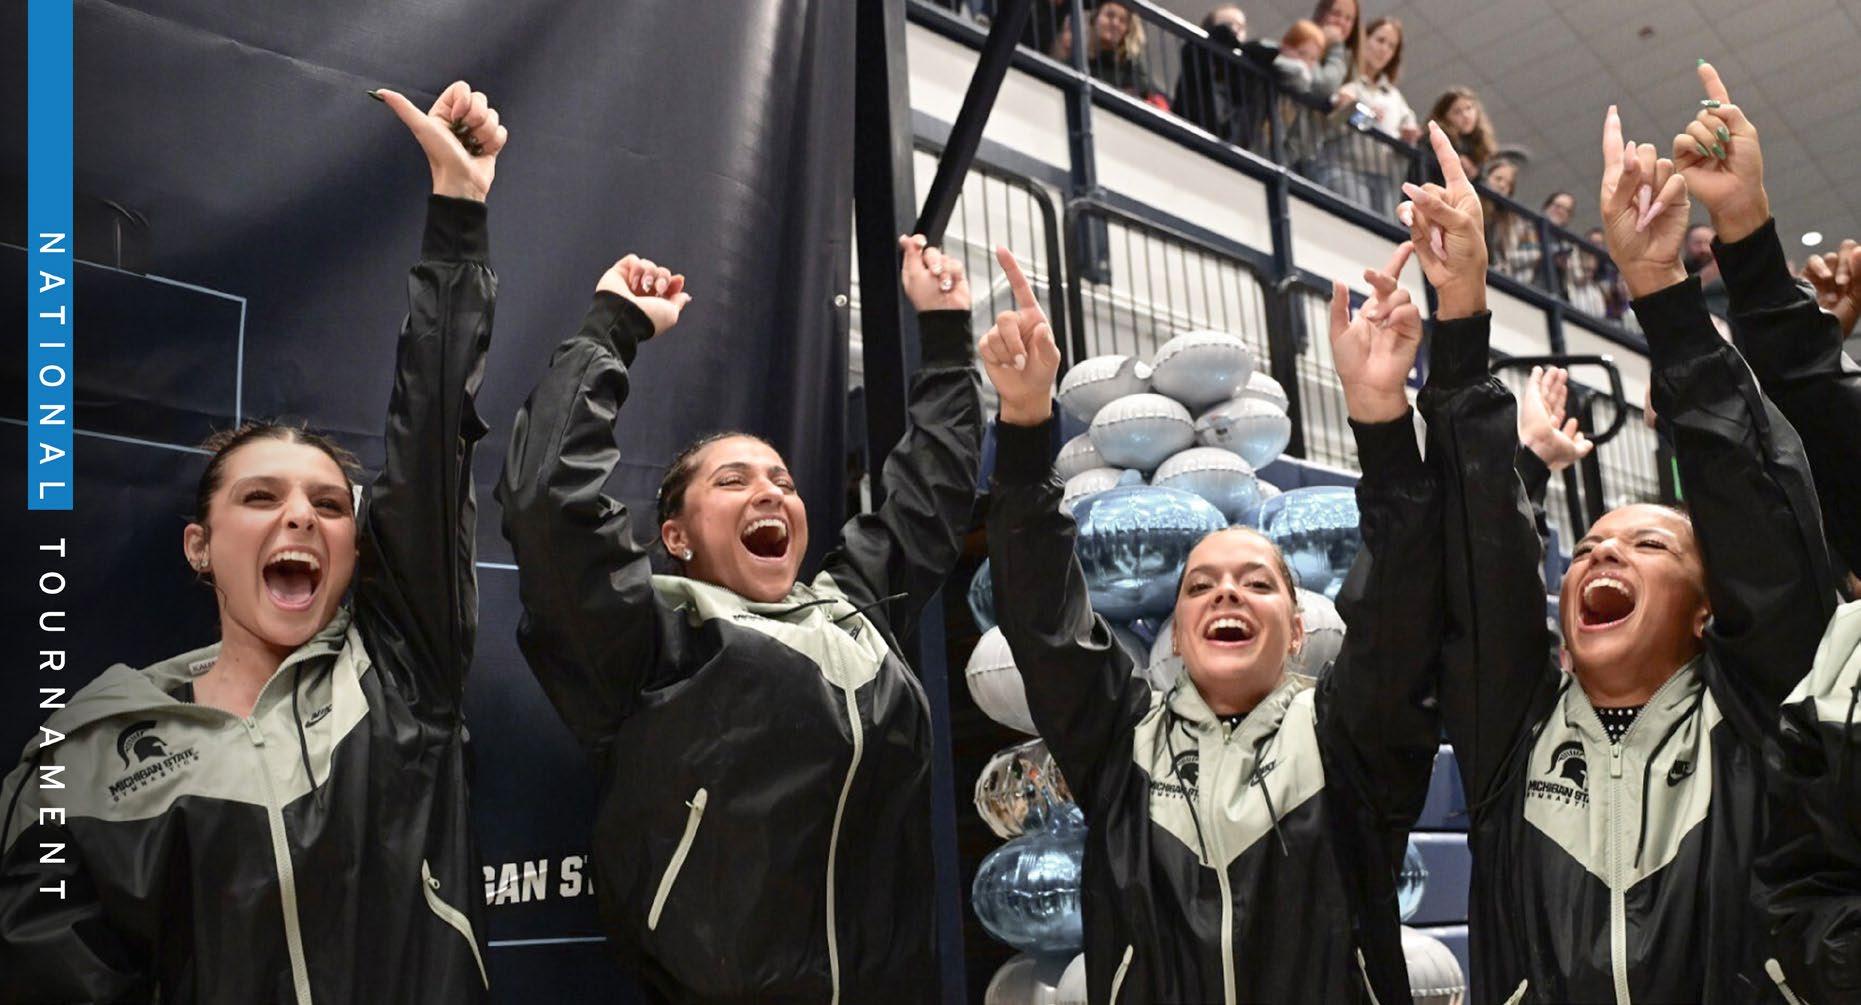
MSU gymnasts celebrating after the NCAA Regional Finals in Penn State’s Rec Hall in University Park, PA. MSU will compete in the NCAA Championships in Fort Worth, Texas, from April 17–19. Photo courtesy of Caleb Craig/MSU Athletic Communications.
FROM NFL SIDELINES TO MSU PRESIDENCY: KEVIN GUSKIEWICZ’S UNLIKELY PATH
“I’m data-driven. When I convinced the NFL to change the rule, I took data with me,”
Kevin Guskiewicz Michigan State president
By Alana Lundgaard alundgaard@statenews.com
Before arriving at Michigan State University, President Kevin Guskiewicz had already built a reputation that extended beyond academia — shaped by groundbreaking concussion research that in uenced oth the NFL and NCAA.
However, that same body of work would later draw scrutiny from critics as he rose through leadership roles at the University of North Carolina at Chapel Hill.
A Pittsburgh native, Guskiewicz once dreamed of working for the Steelers — an opportunity he realized during his master’s program at the University of Pittsburgh.
“It was during that time, working the sidelines of a professional football game back in the late ‘80s, early ‘90s, I said, ‘Why are we sending players back into the game with a suspected concussion, but holding someone out for two weeks with a knee injury?’ “ Guskiewicz said. “It didn’t make any sense. But we didn’t have enough information — we didn’t have very good tools in the toolbox for evaluating a concussion.”
That experience propelled him to pursue a doctorate in sports medicine at the University of Virginia, one of the few institutions offering such a program at the time. There, he studied under Dr. Jeffrey Barth — a trailblazer in mild traumatic brain injury research who passed away in March 2024 — and collaborated with David Perrin, a leading athletic training researcher.
While at Virginia, Guskiewicz developed the Balance Error Scoring System (BESS), a test now used by the NFL and NCAA to evaluate balance following head injuries.
In 1995, he joined UNC-Chapel Hill as an assistant professor and continued his research into football-related brain injuries. In 2010, he founded the Matthew Gfeller Sport-Related Traumatic Brain Injury Research Center, further expanding his impact.
A year later, Guskiewicz brought concussion data to the NFL Com ine, urging league offcials to change the kickoff rule based on research showing the play led to a disproportionate number of head injuries.
He said he presented nearly 400,000 data points to support the change. Within three years of the rule revision, concussions on kickoffs dropped by 50%.
“I’m data-driven,” he said. “When I convinced the NFL to change the rule, I took data with me.”
Guskiewicz carried that same data-first mindset into UNCChapel Hill through various leadership roles, including as dean of the College of Arts and Sciences and, later, as chancellor from December 2019 to January 2024.
But just before his deanship, Guskiewicz’s research legacy came under scrutiny.
A paper published in the Journal of Scientifc Practice and Integrity questioned a series of UNC studies — 10 of which list Guskiewicz as a co-author — for not disclosing high rates of ADHD and learning disabilities among football players. Critics argued those factors may have in uenced cognitive data used in research cited by the NFL, NCAA and Department of Defense.
The article’s authors — University of Utah adjunct professor Ted Tatos and NeuroLabs CEO Donald Comrie — called for greater scrutiny of the fndings.
Guskiewicz has publicly addressed the criticism, describing the claims as baseless.
“We knew from the minute that ridiculous claim came out, that it was a false claim,” he said.
The neuroscience community rallied behind him, issuing a letter signed by 125 researchers in support of his work. Guskiewicz also requested both internal and independent investigations into the studies to verify their integrity.
He said the controversy was diffcult not only for him, ut also for the 12 to 15 researchers on his team at the time.
“As a leader, you’re tested at times,” he said. “How you respond to a situation like that — I learned a lot through it, and I’m really proud of the way we defended that important work.”
Despite the pressure, he said the team remained focused and committed. He now shares that experience with mentees, reminding them that not every critic comes in good faith.
The publication behind the original article folded after just four months. Guskiewicz also pointed to journalist Armen Keteyian’s brief tenure at The Athletic, suggesting the claims lacked credibility.
“I was really proud of the way we defended that important work,” he repeated.
Now at MSU, Guskiewicz brings those lessons into his presidency — data-driven, battle-tested and student-focused.
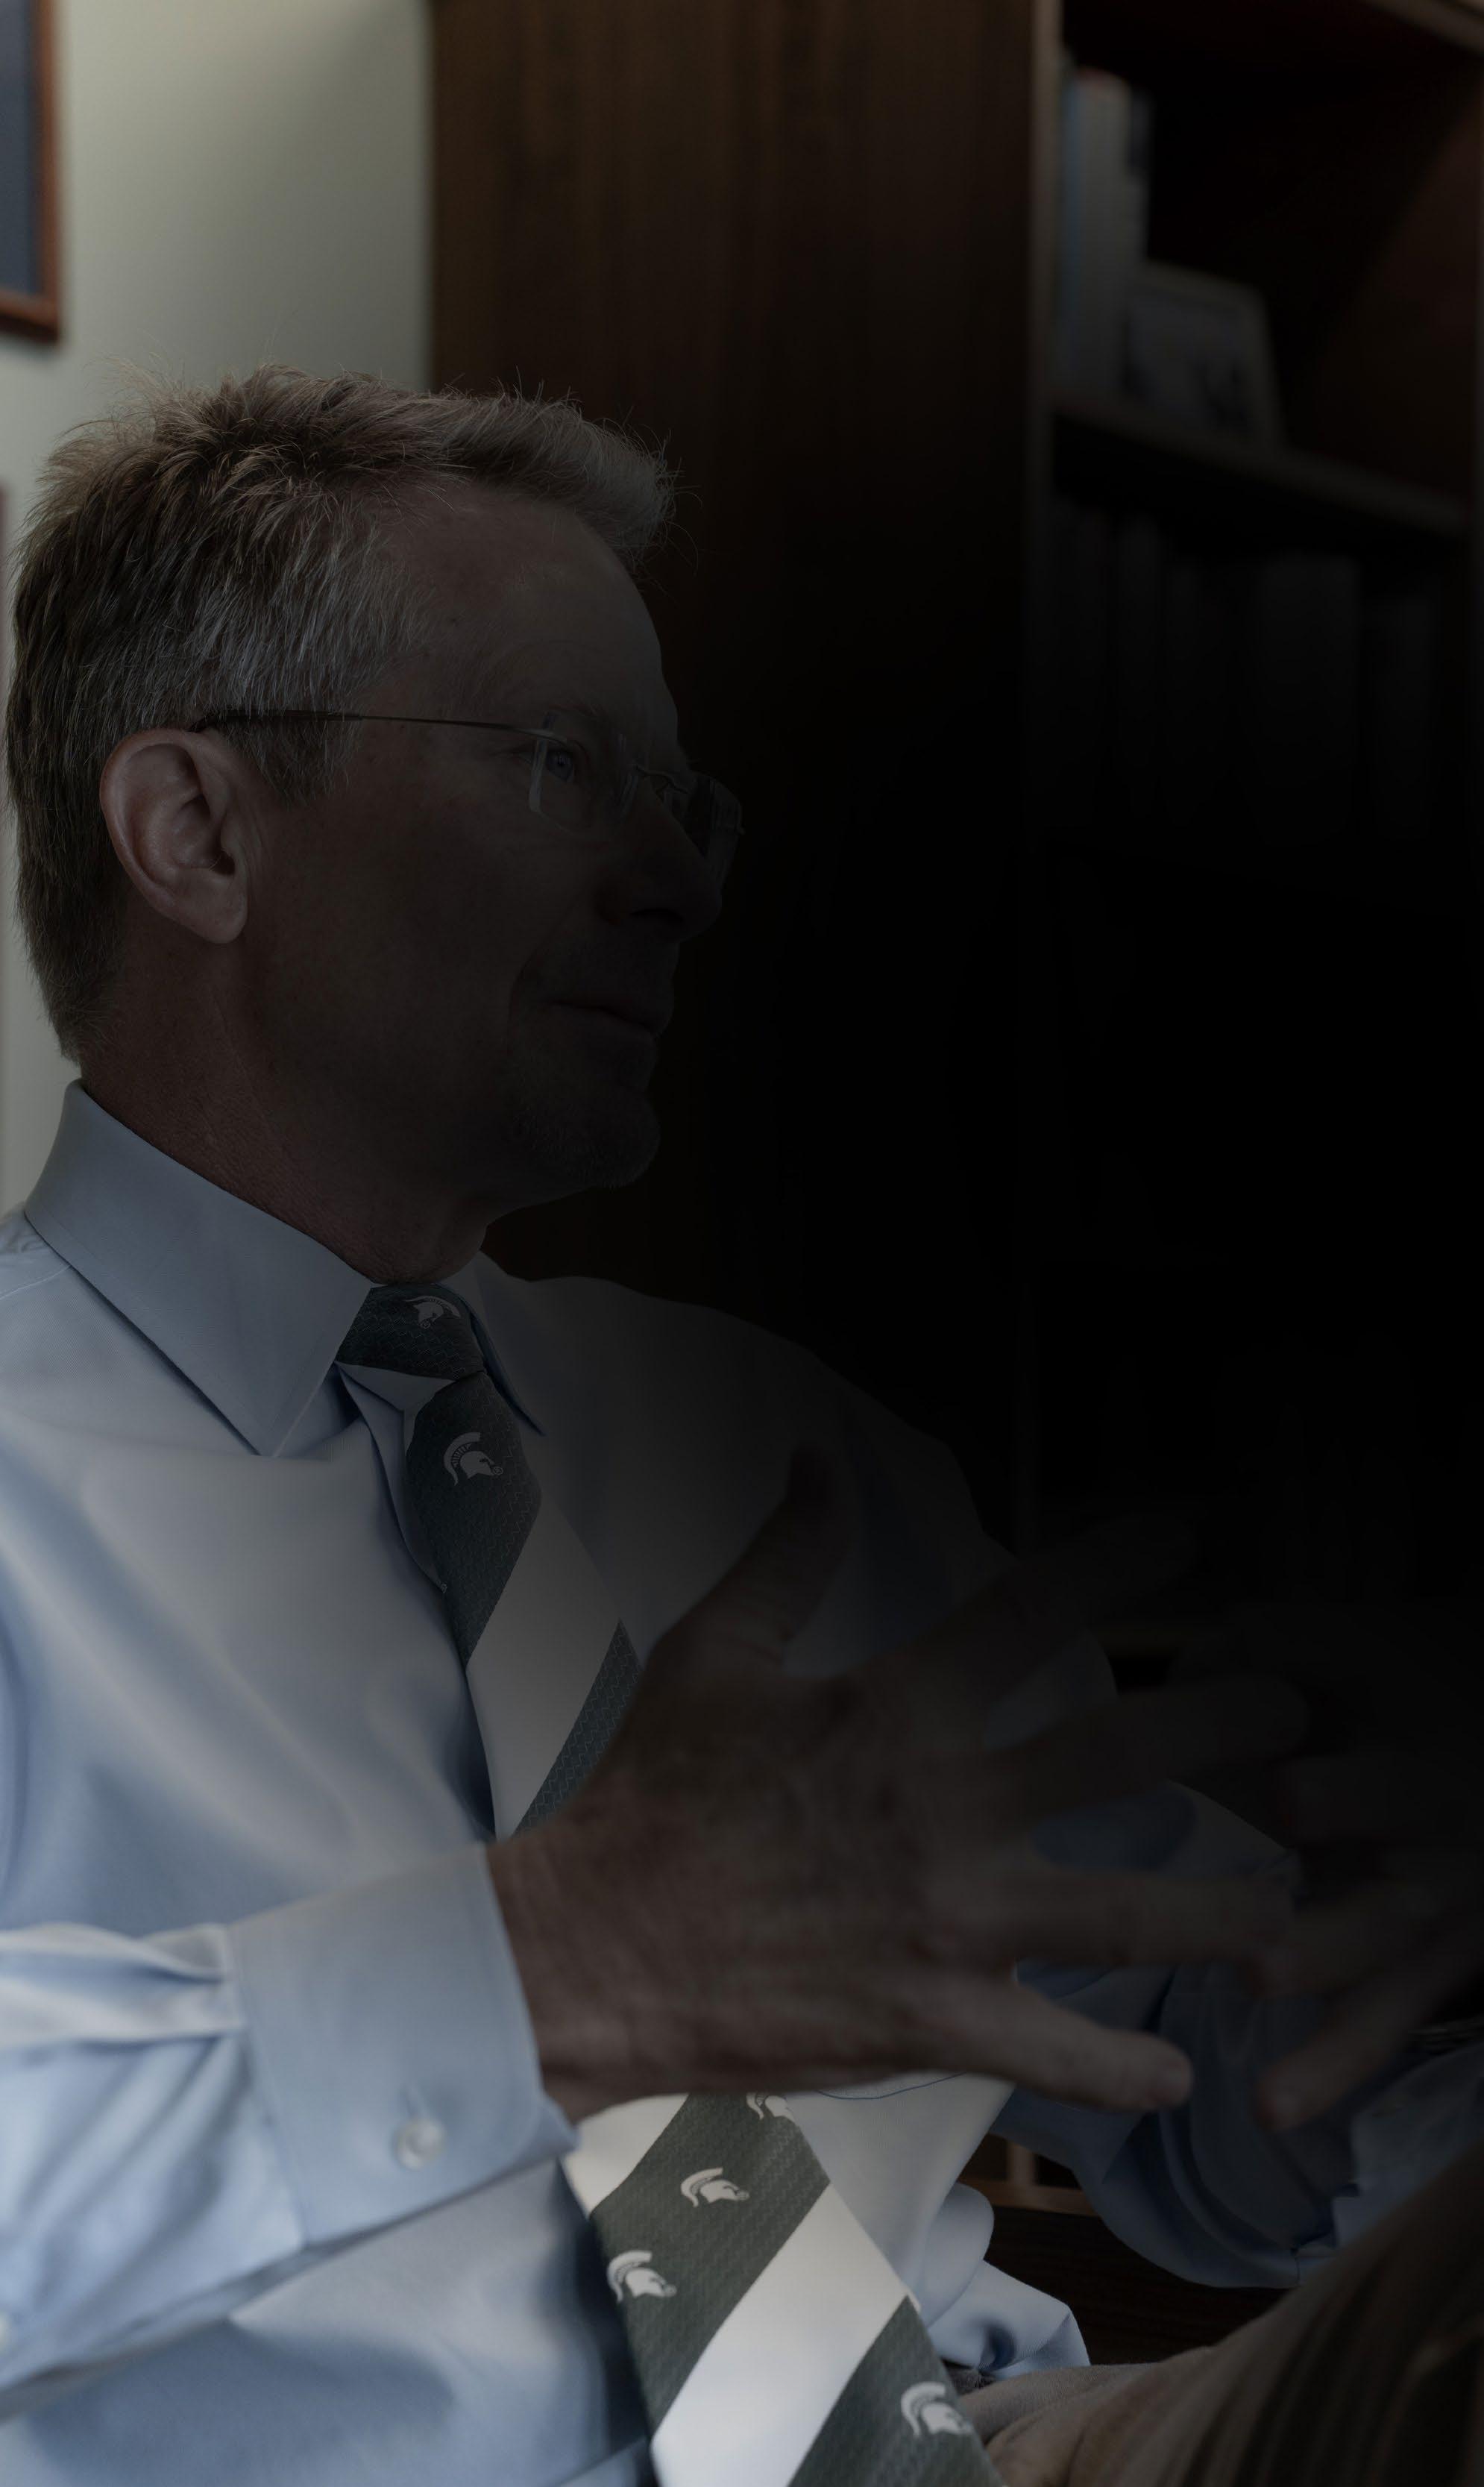
Michigan State University president Kevin Guskiewicz speaks during an interview in the President’s office at the Hannah Administration Building, Sept. 25, 2024. Photo by Brendan Mullin.