SOPHIE BALLIET
UNDERGRADUATE

SOPHIE BALLIET
UNDERGRADUATE
ARCH 487
Rhino 8, Photoshop
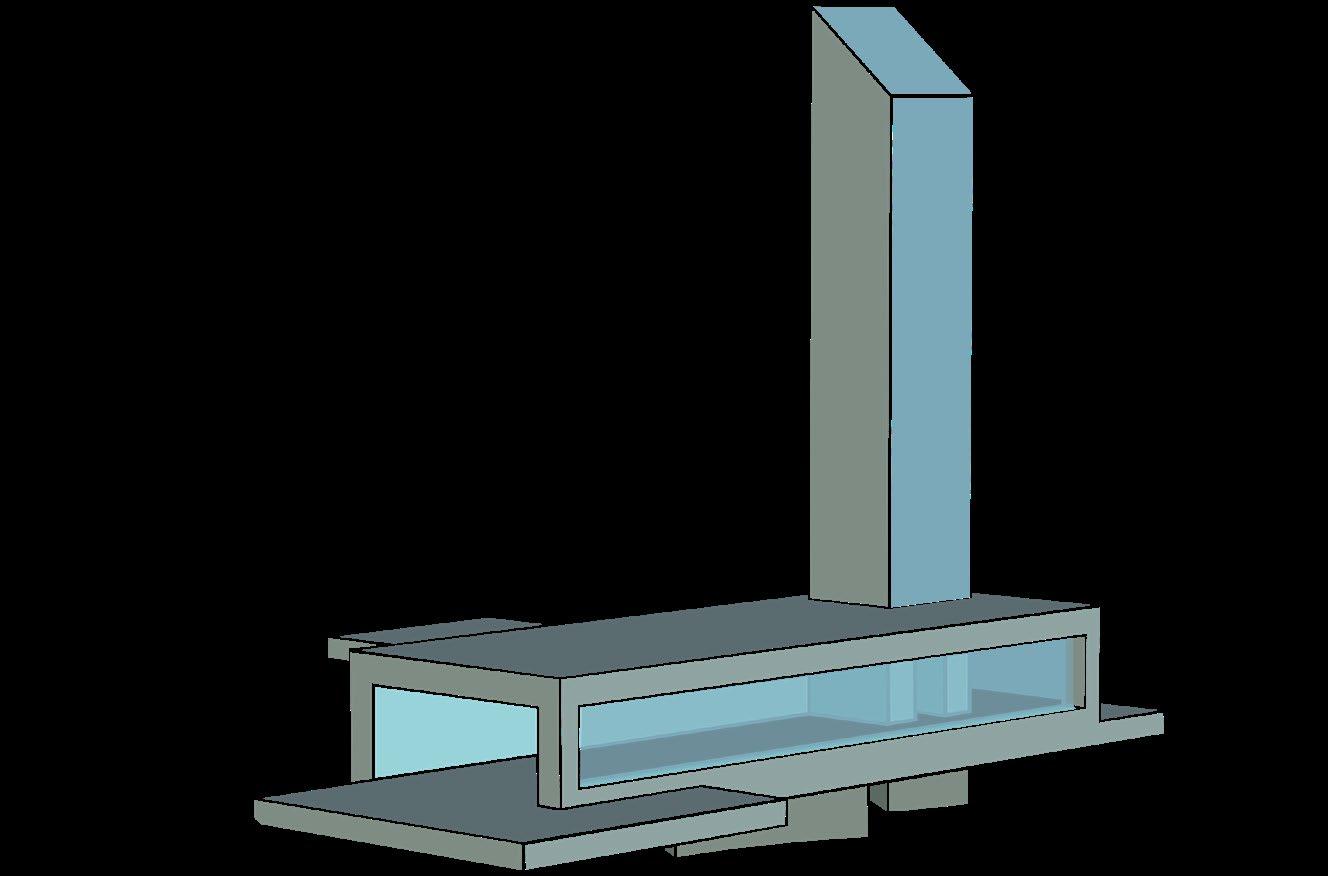
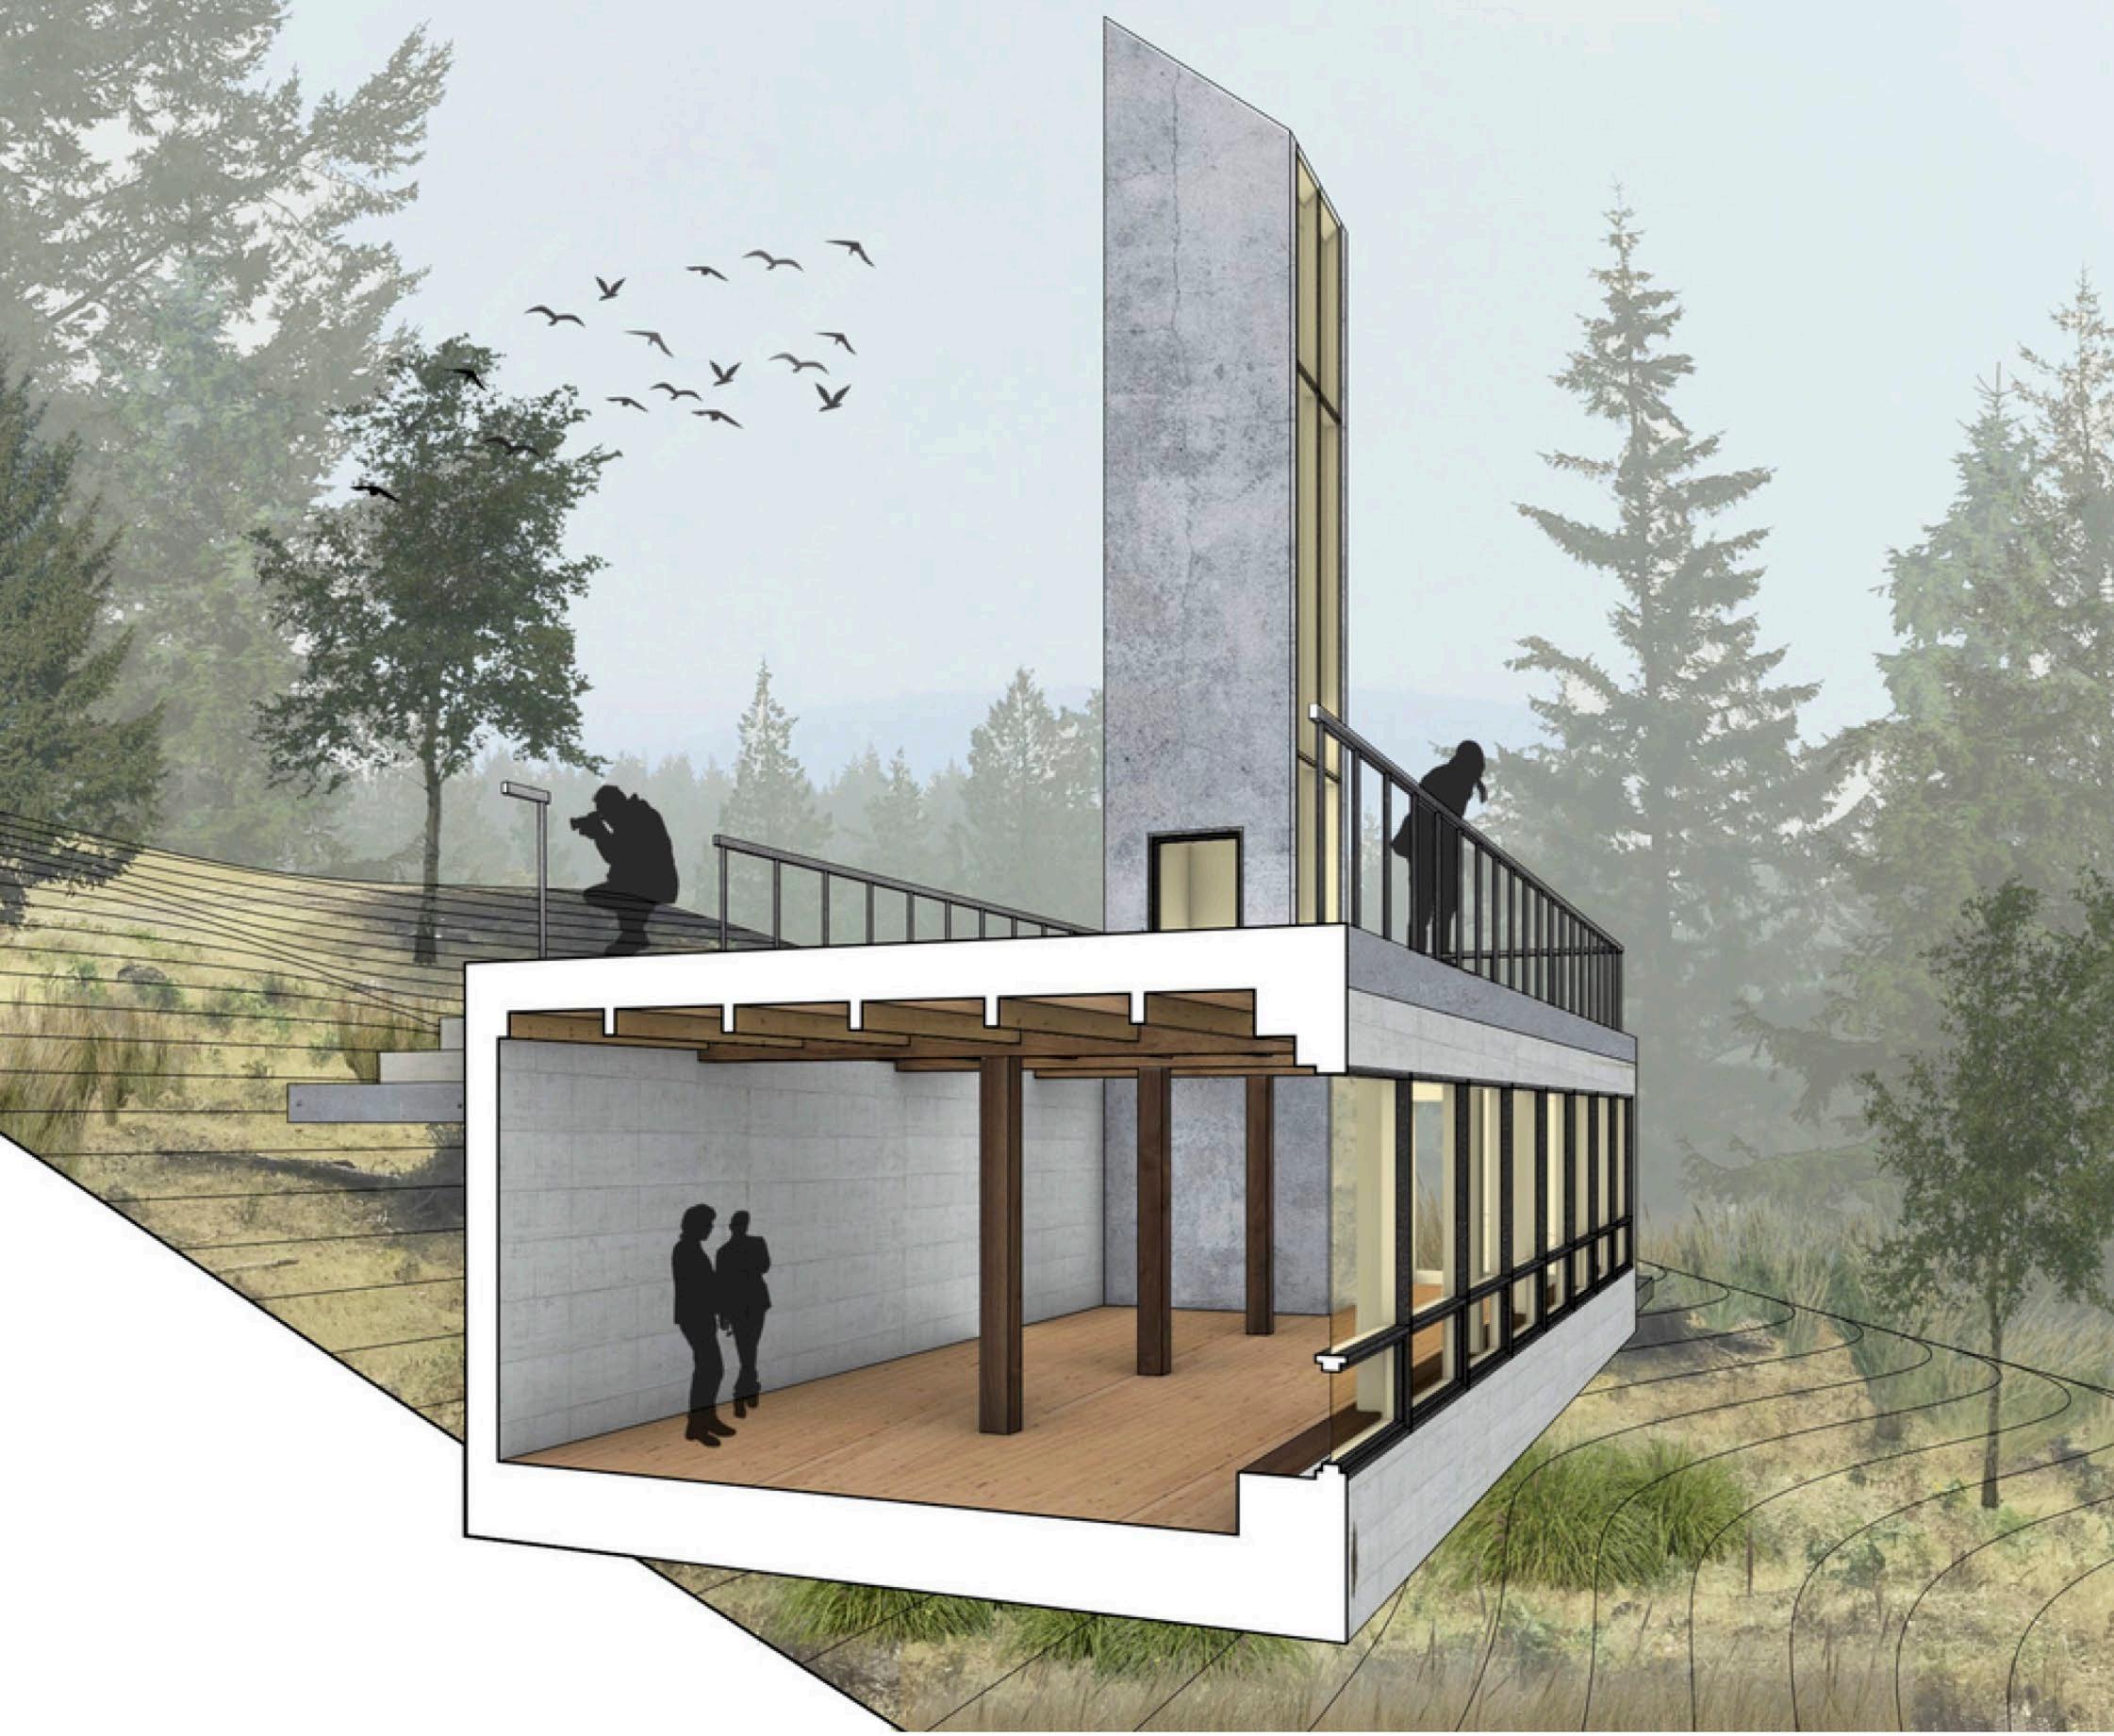
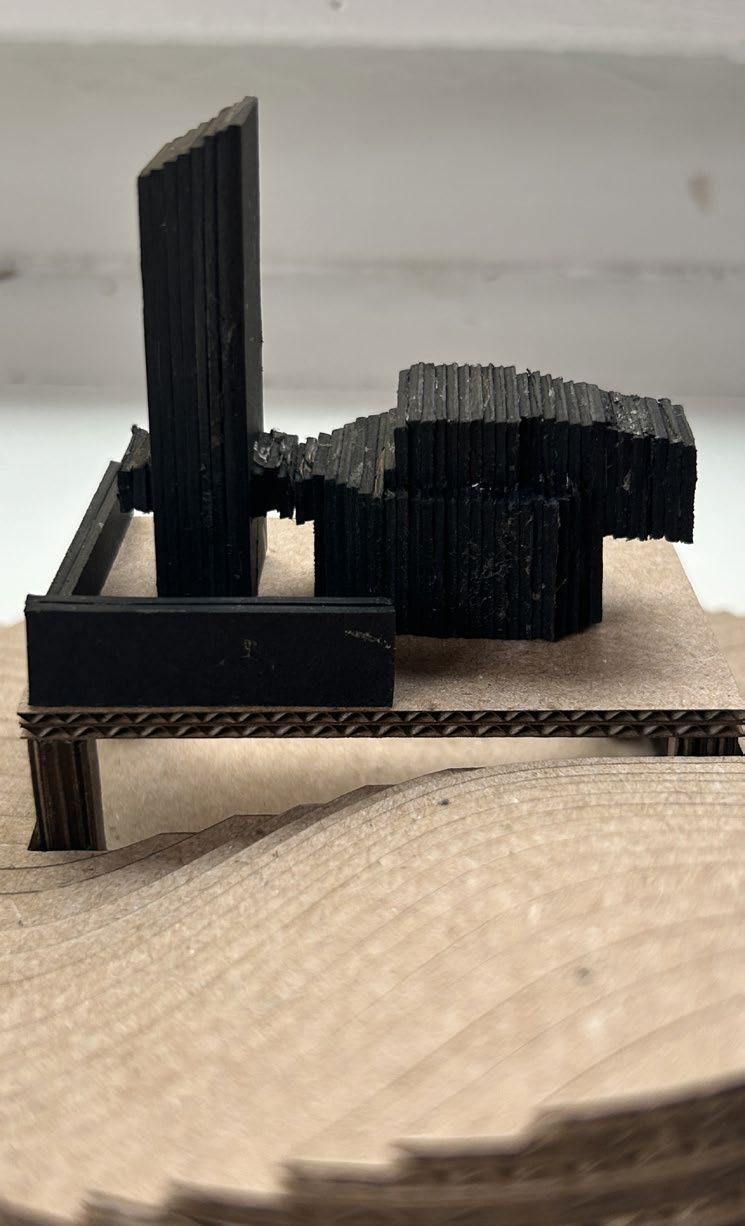
Situated in the coniferous forest of the Pacific Northwest, the Evergreen Observation Tower watches over the wildlife. Nestled high on the side of a hill, the building enjoys a sweeping view of the surrounding vista. The southeast-facing windows on the main building allow researchers inside to observe their subject - the forest ecosystems - at close-range. Documenting the forest through a camera lens requires unobstructed views in all directions, which the obsrevation deck happily provides, as well as quick access and immersion in to the terrain via the back walkway platform. In addition to the main building glazing, and outdoor viewing, the tower provides a vantage point from as high as the tops of the pines.
Tasked with creating an observation tower, this course showcased the life cycle of an architectural project and it’s key processes. First, creating conceptual massing models, carving out basic forms, and giving context to the structure. After adding in structure and material layers, details are placed and the design process is then documented and a final section-perspective rendered.
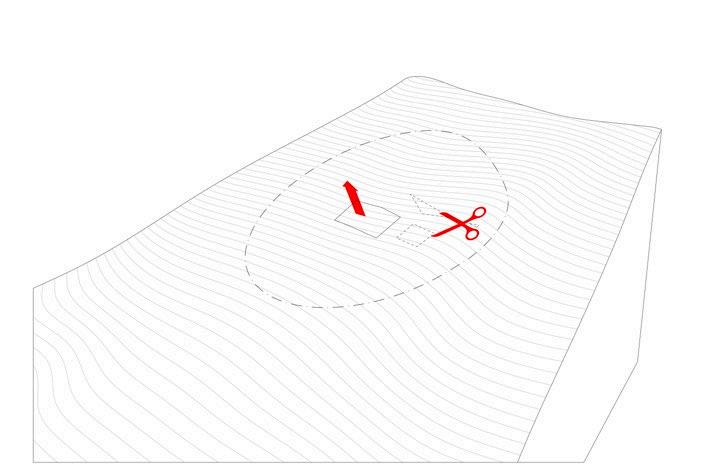
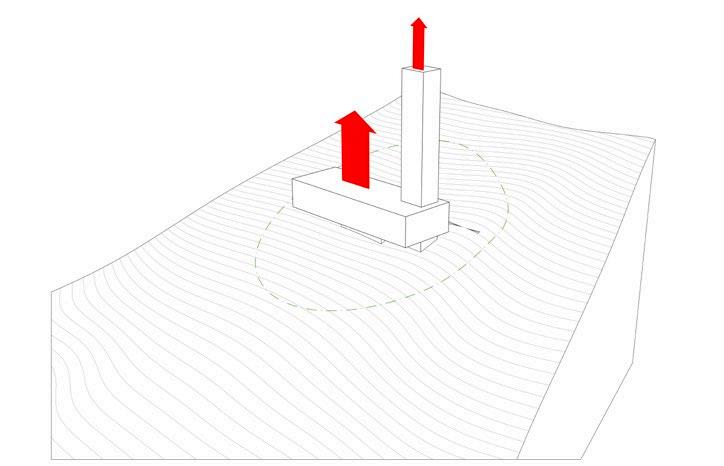
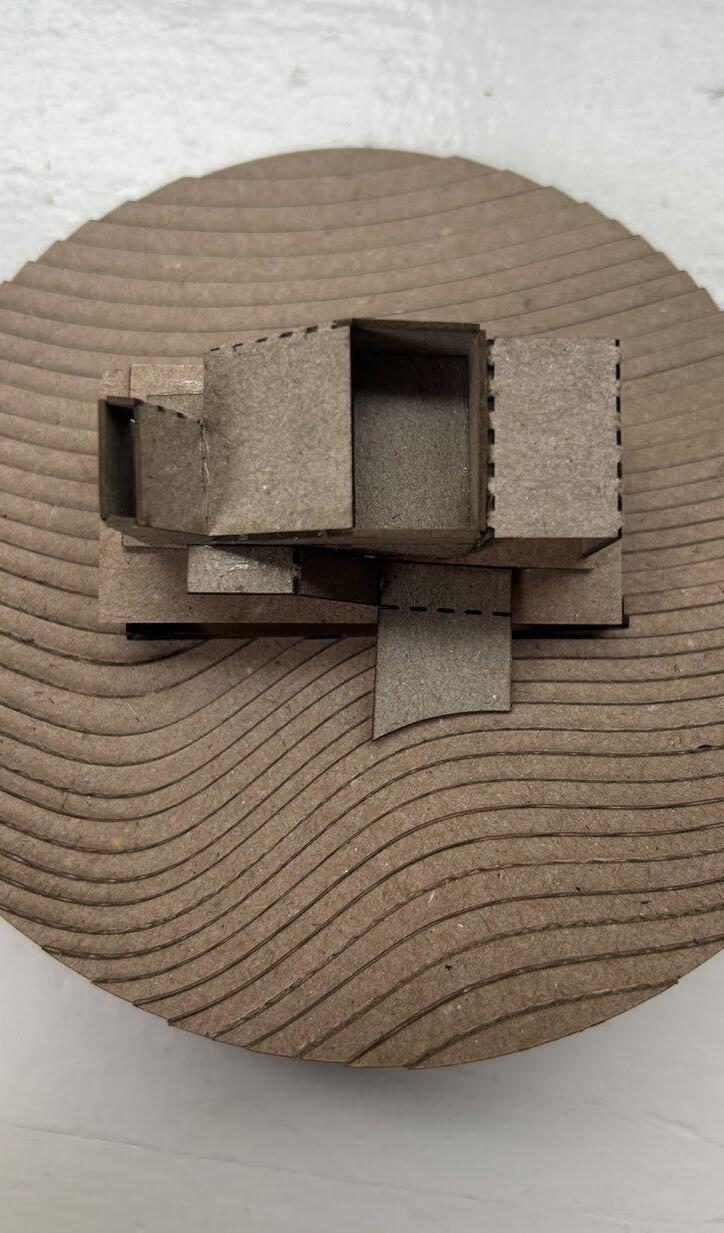
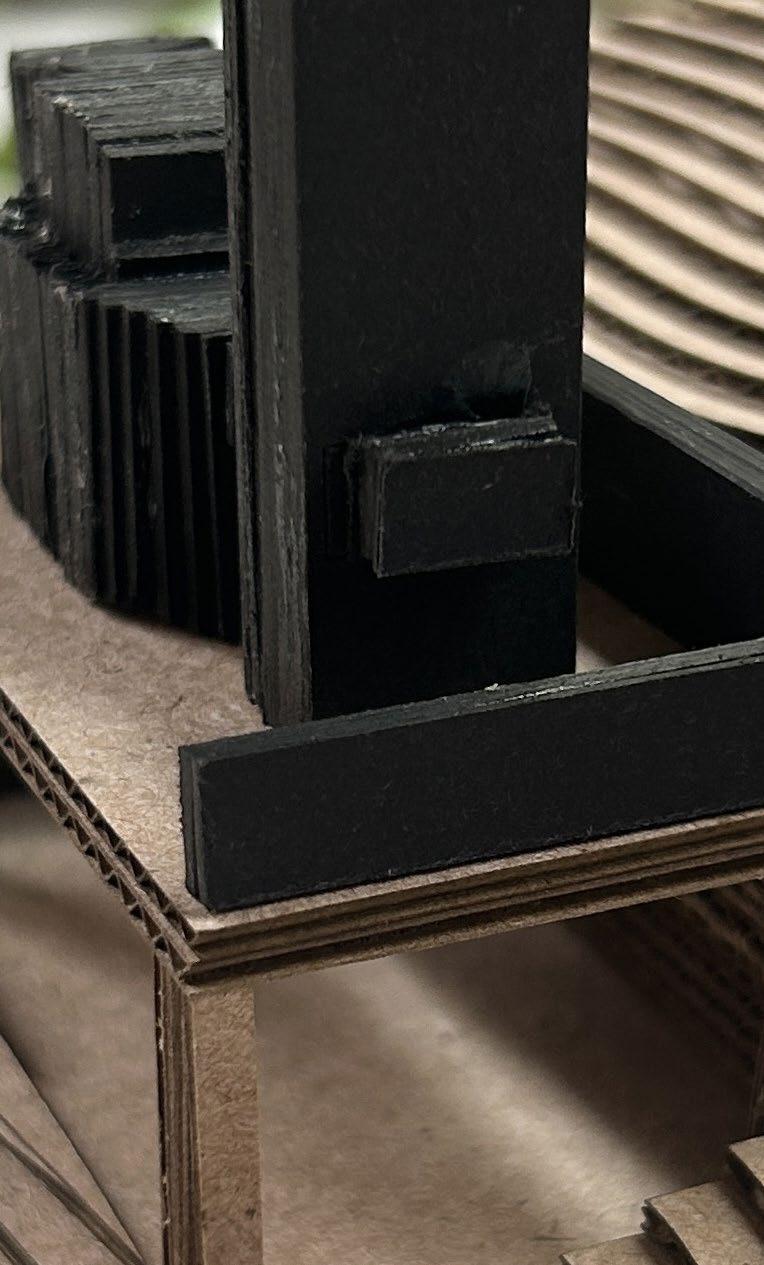
Massing models were created in Rhino. Then, using two methods of assembly - folding, and stacking contours - the material was cut via laser cutter and crafted together. I chose to embellish model B.
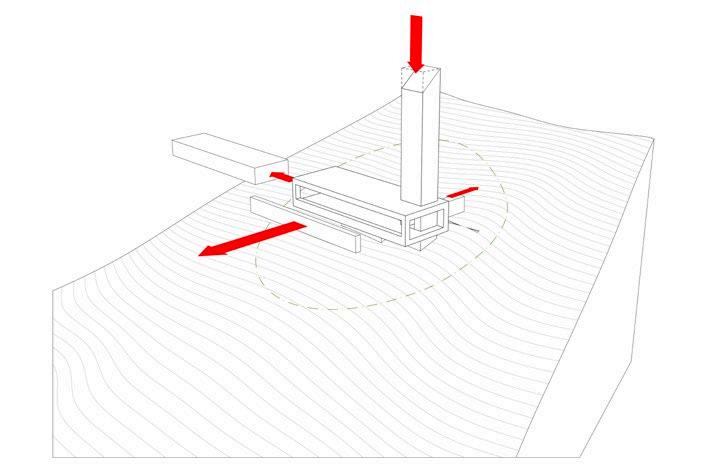
Beginning with simple forms, the model is easy to subtract and add from, creating an efficient workflow. A ramp and walkways
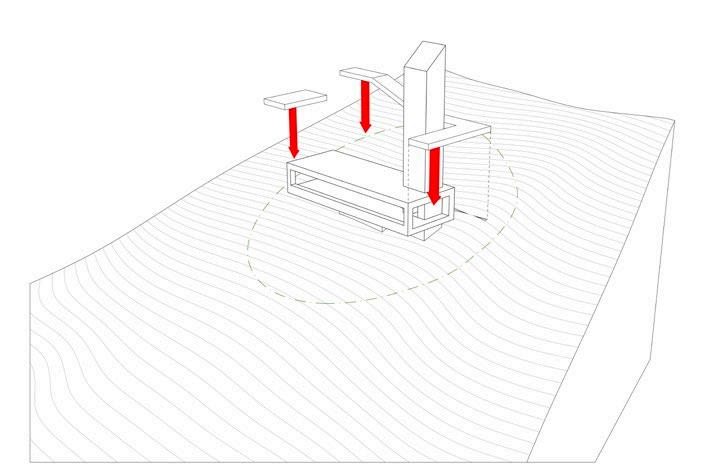
Add in Walkways
are added, providing circulation around the building, and embedding it into the site. Ample
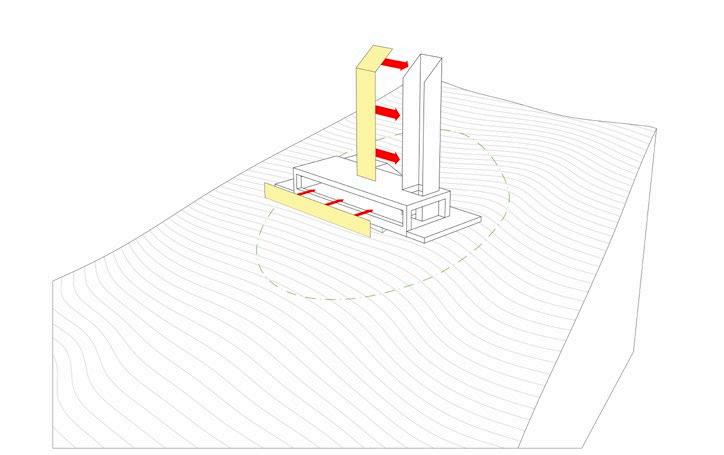
Glazing and Skylight Additions
glazing allows daylight to stream into the building, and offers views out onto the forest vista.
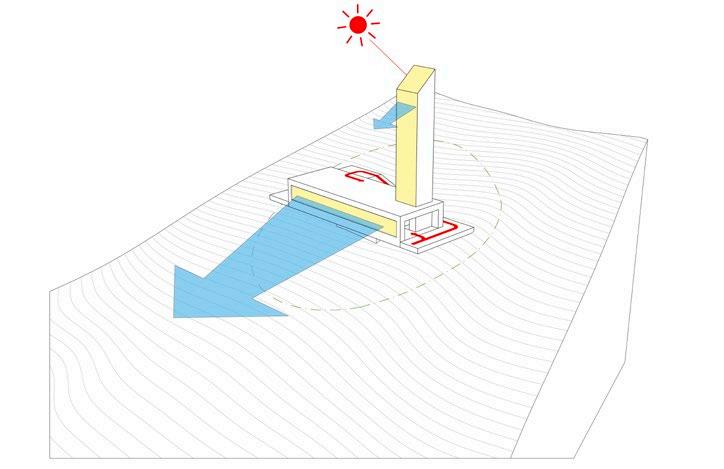
Circulation, Daylight, Views
ARCH 431, 435
Rhino 8, Photoshop, Procreate
ARCH 431 CLIMATE AWARE
This group project examined the Passive House design method applied to a Detached Accessory Dwelling Unit (DADU).
ARCH 435 DAYLIGHTING
Tasked with designing the lighting for an already existing project, this project asked me to identify the desired actions and feelings taking place within a space, and bring those desires to life with carefully considered lighting techniques and fixtures.
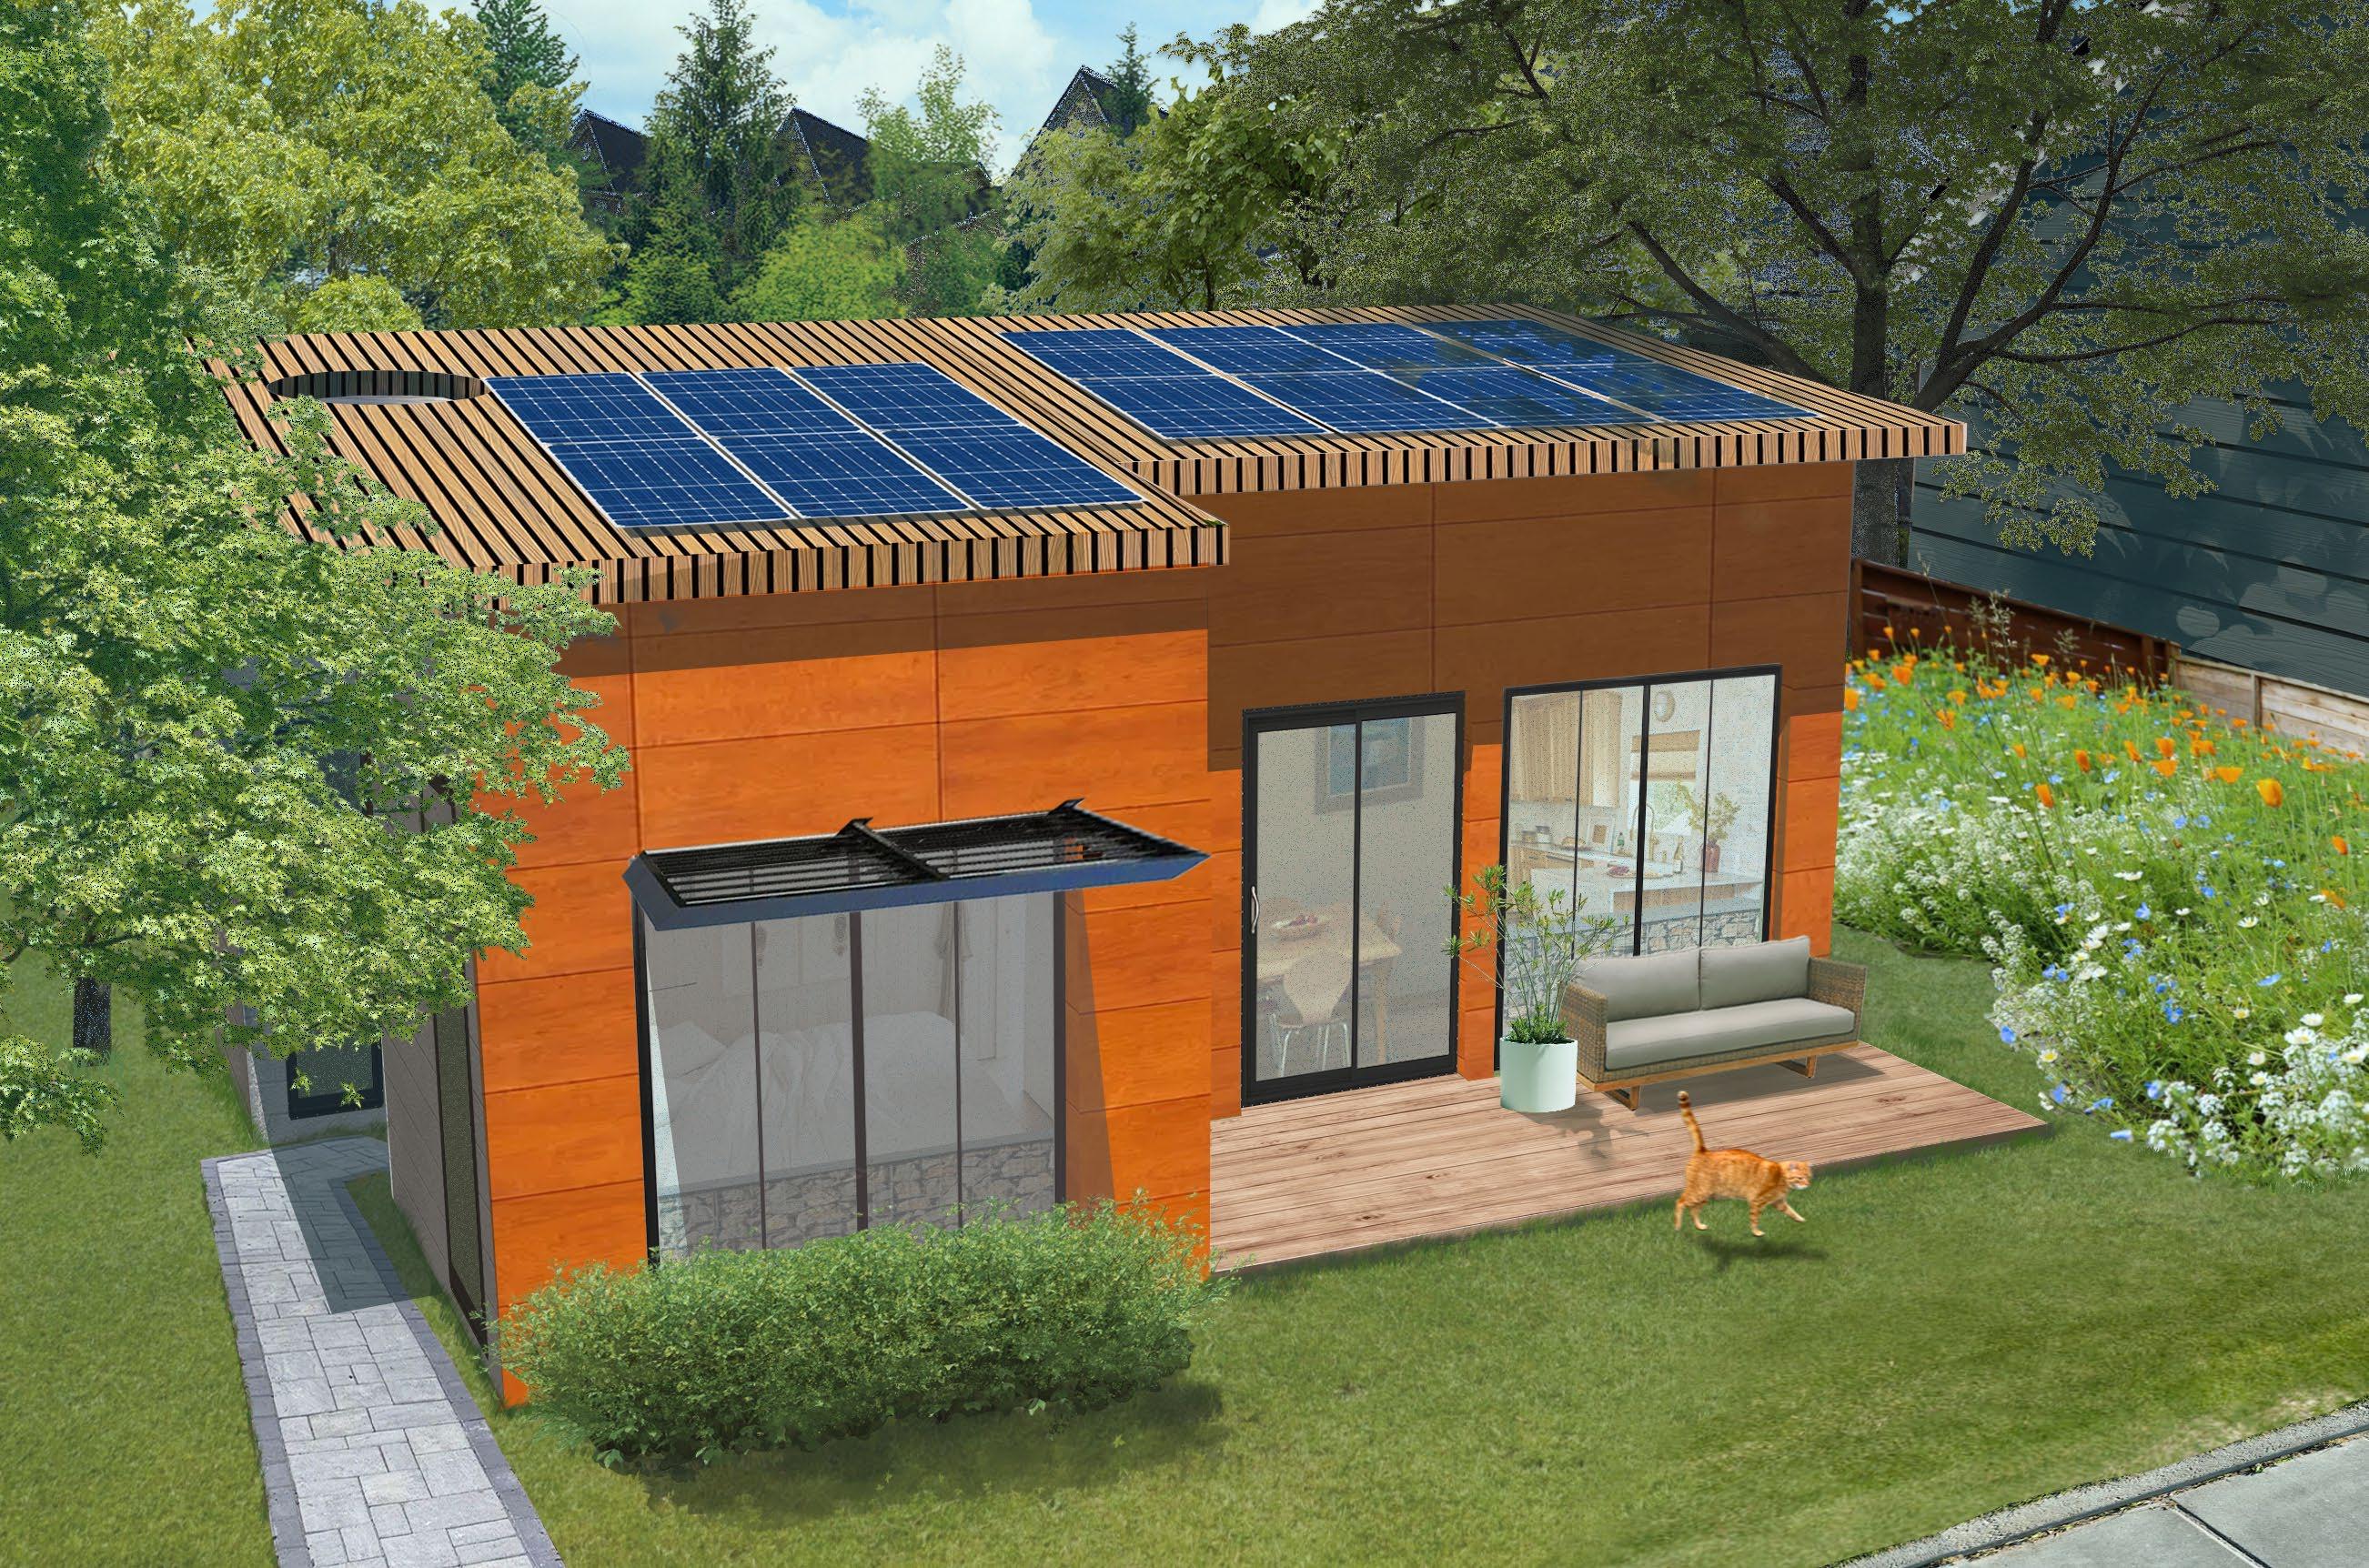
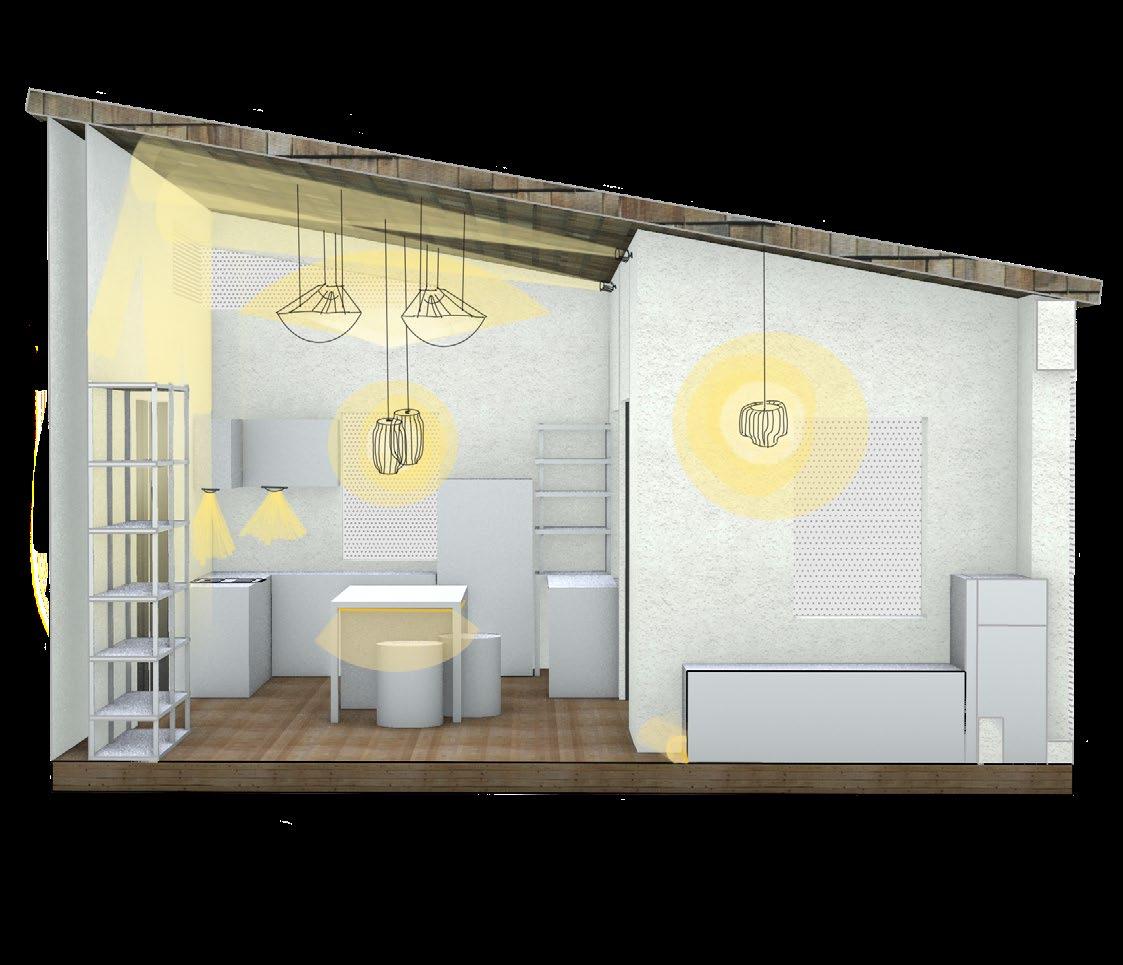
The Passive Dwelling is a cozy DADU capable of regulating its own temperature and energy usage levels. Situated west of the main property, we designed this unit to have both house, and road/sidewalk accessibility; granting independence from or connection to the other home as desired. The space was designed to maximize gathering and social areas; with the kitchen and eating taking up majority of the interior square footage, and opening up directly to the outdoor deck and more seating. Initial designs included a viranda over the deck to weave vines onto, and string lights up across, to add extra privacy and life to the unit. The layout design and most of the daylighting were done in collaboration for course 431. The lighting design, images, plans, and final renders were made entirely by me, for course 435.
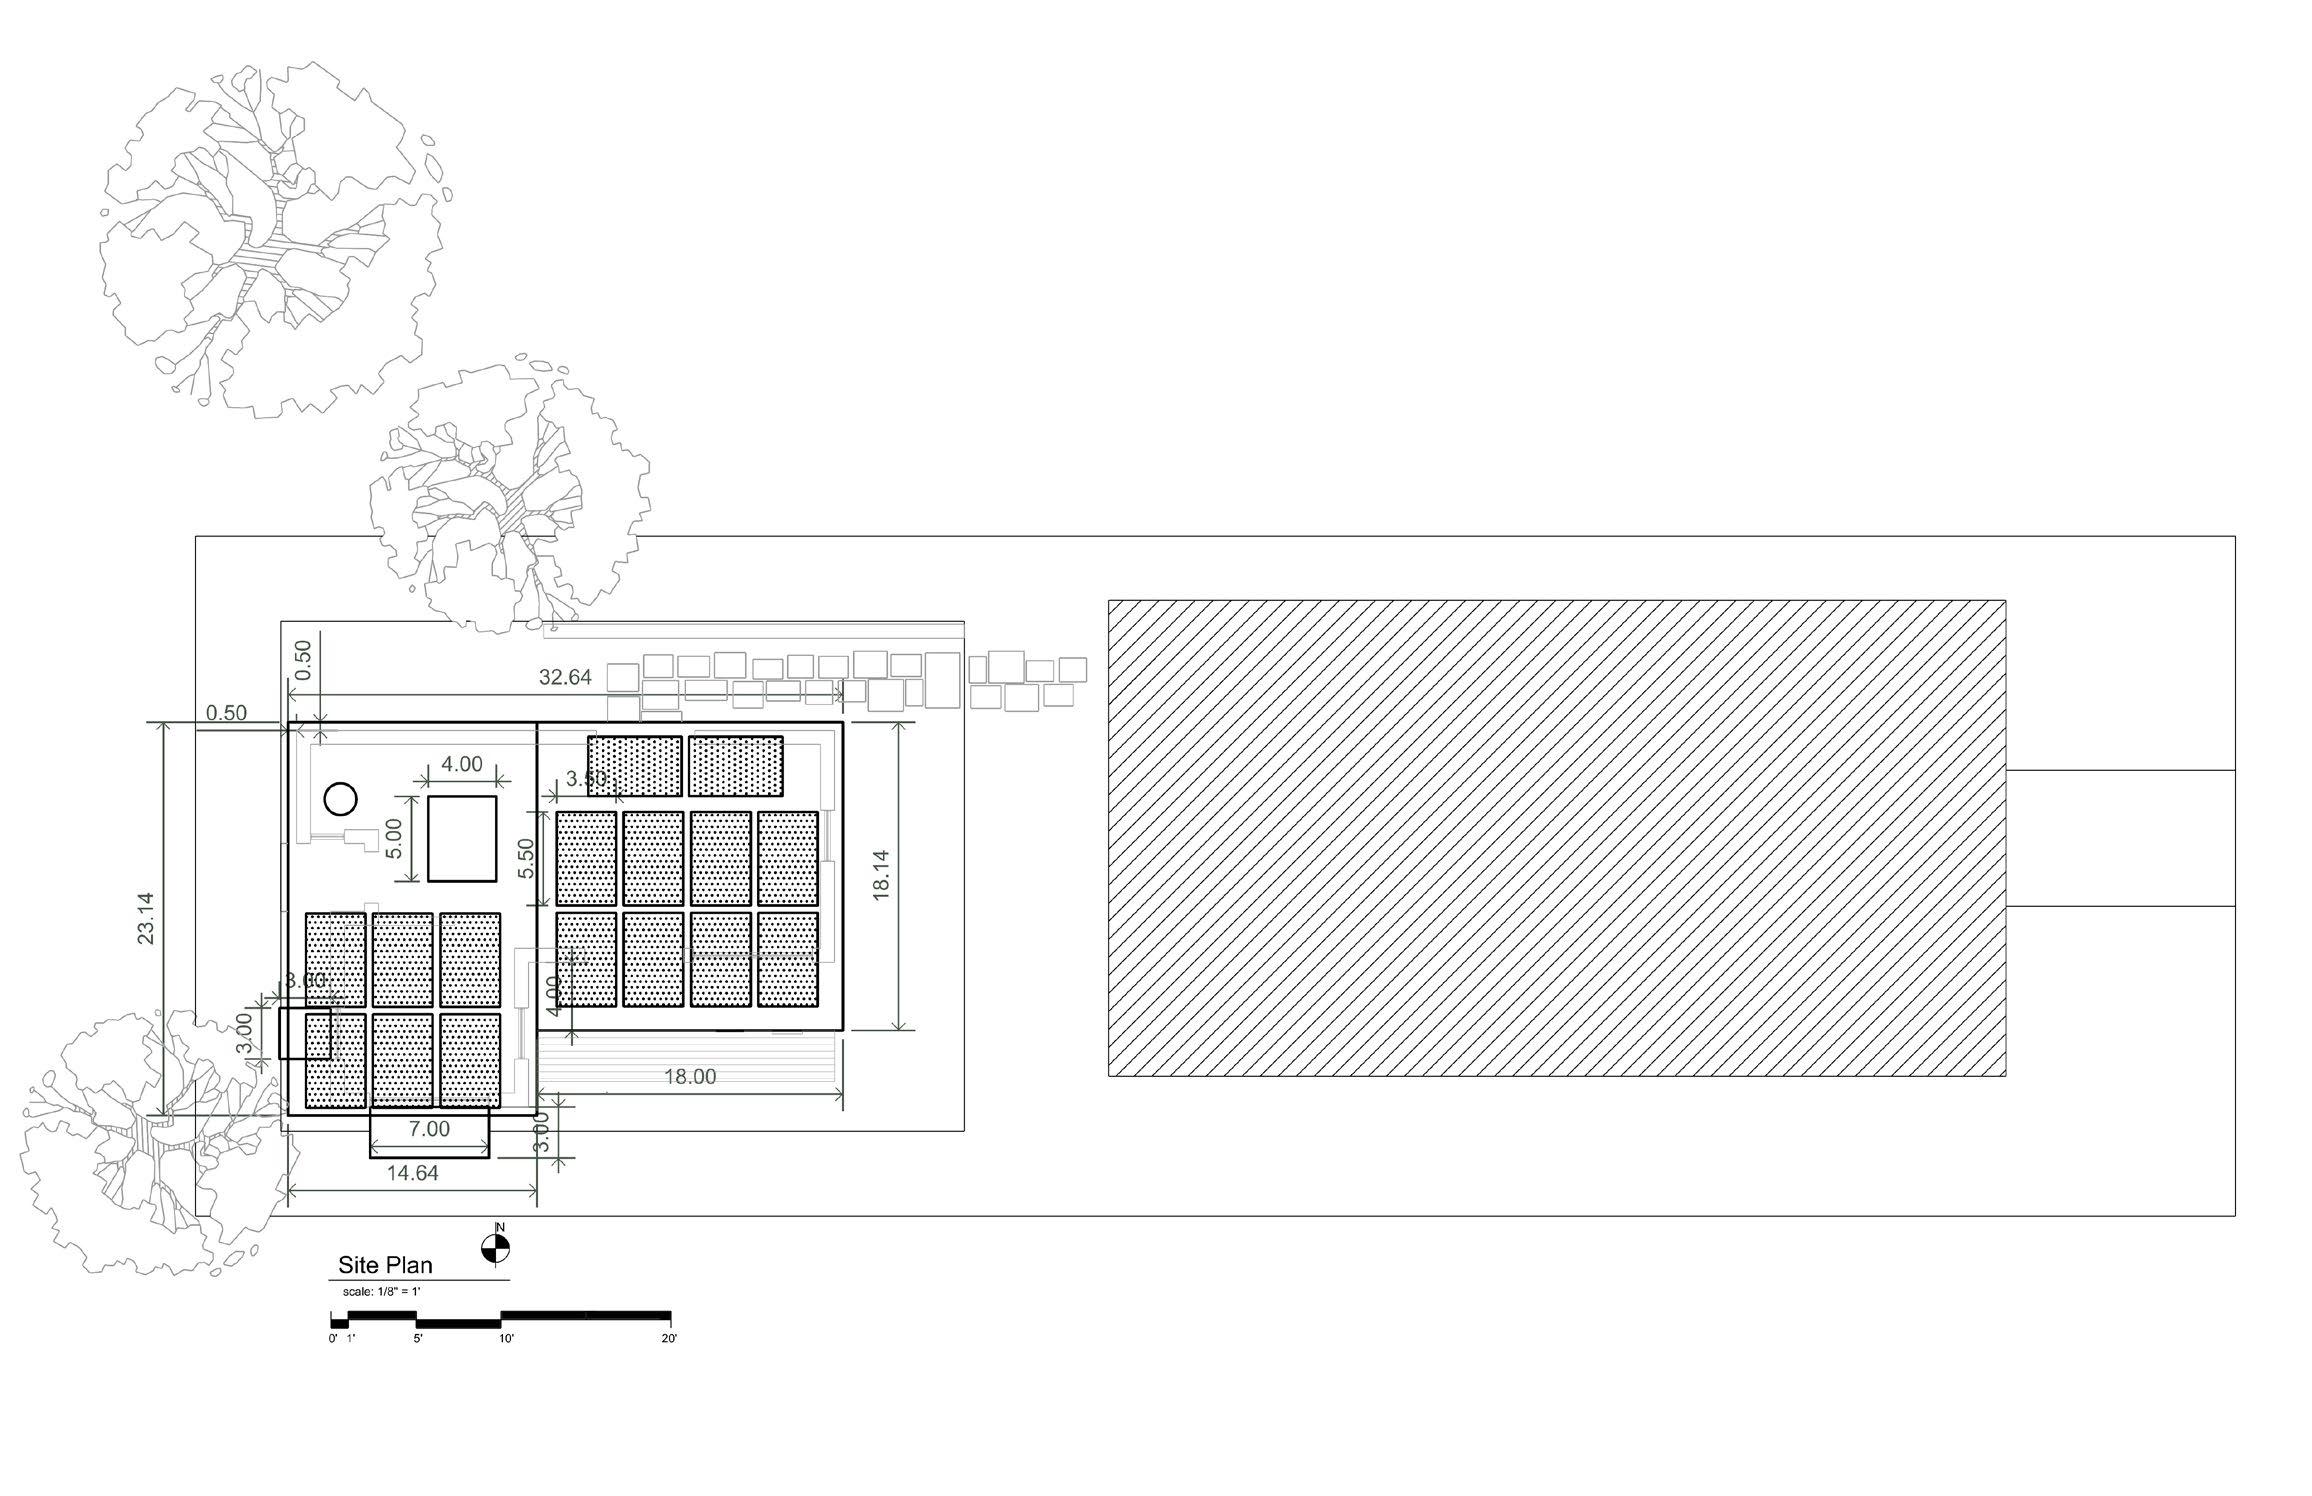
The key to effective Passive House heating and cooling is the context of the site; ours is Seattle, WA. With Seattle’s climate in mind, our goal was; to keep heat in and the cold out in the winter, block out the sun in summer, a breathable envelope for moderate summer temperatures, and to protect from and utilize the S/ SW winds the area experiences for passive ventilation. To supplement energy used by the DADU’s inhabitants, 16 solar panels con-
figured on the roof will produce 20.3 kBTU/sf/yr, which should be a comfortable amount of energy for the Unit. With room still left on the roof, a solar hot water heating device can be installed, leaving the other pvs to focus on supplementing appliance and other energy usage. The design of the home produces a balance point temperature of 50°F, and a predicted EUI of 17.65 kBTU/sf per year
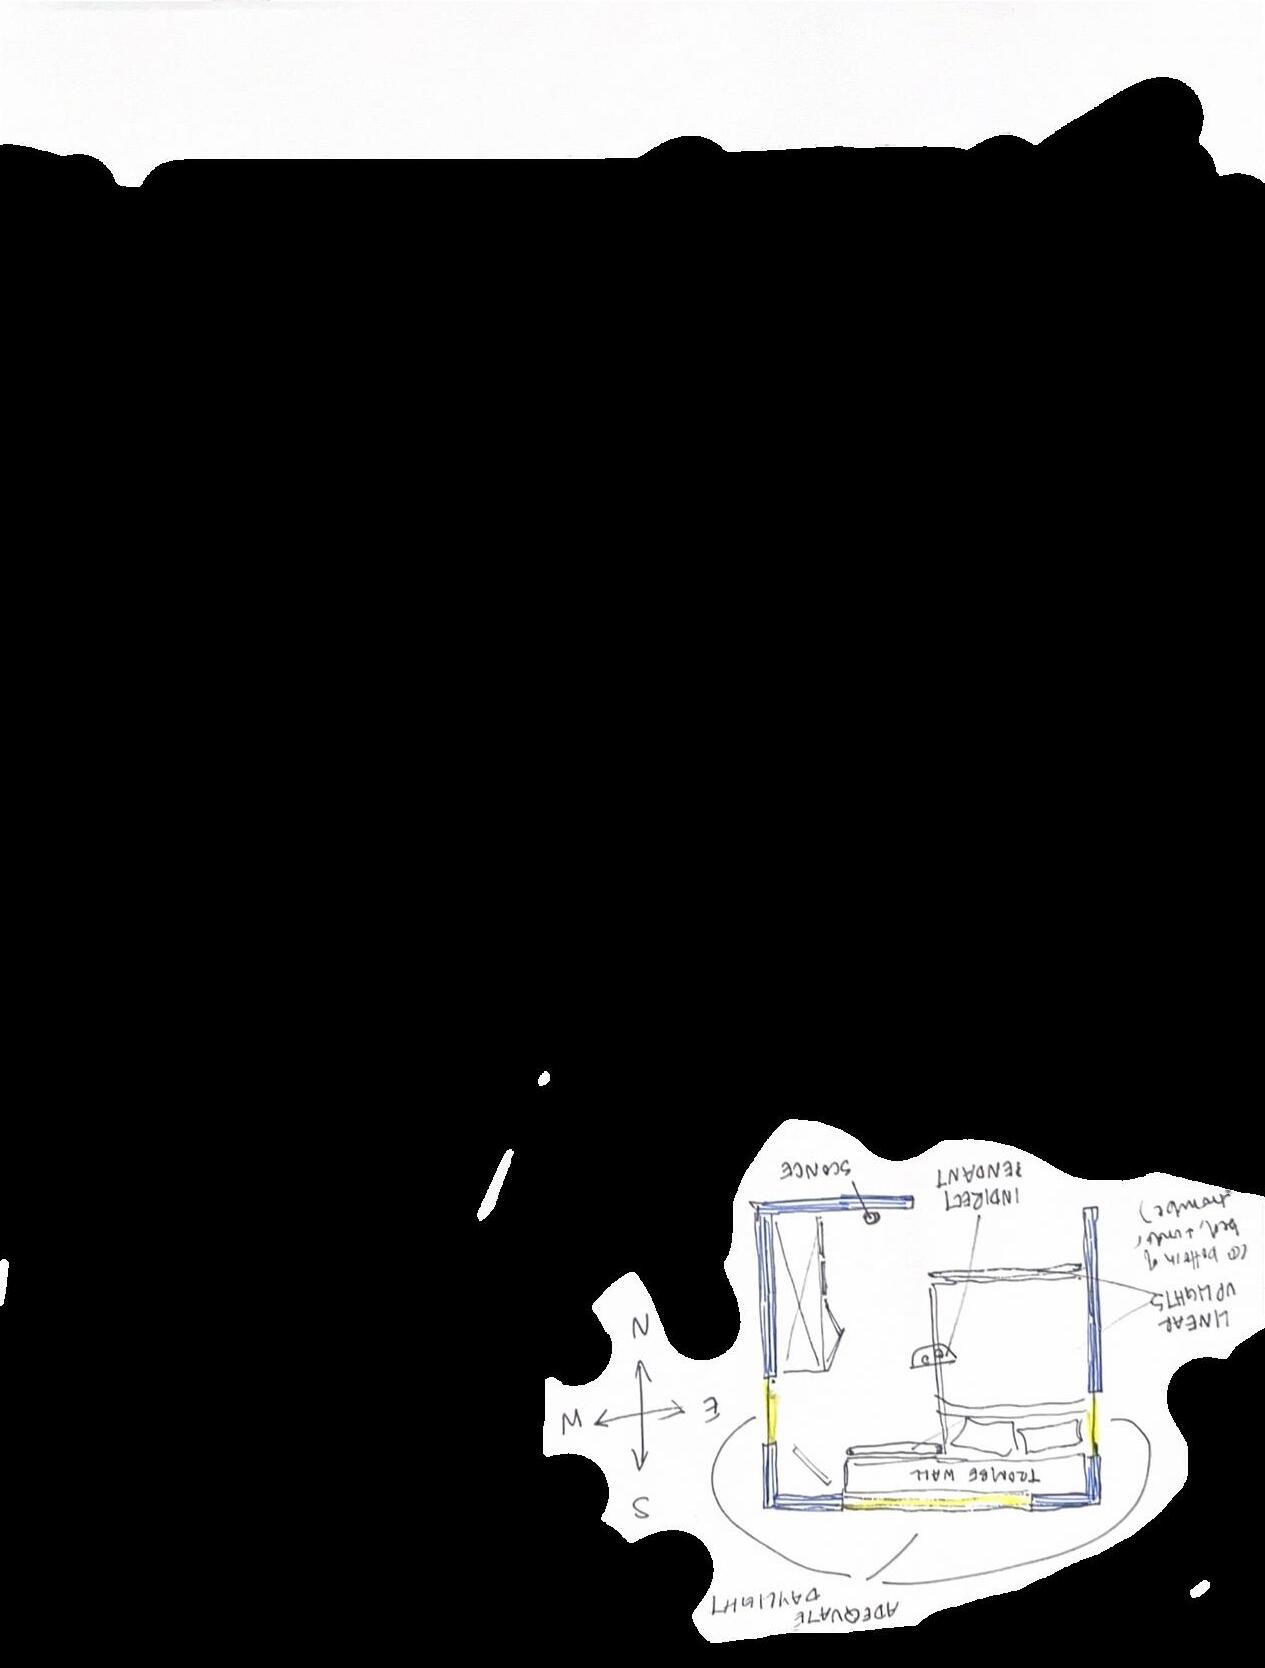
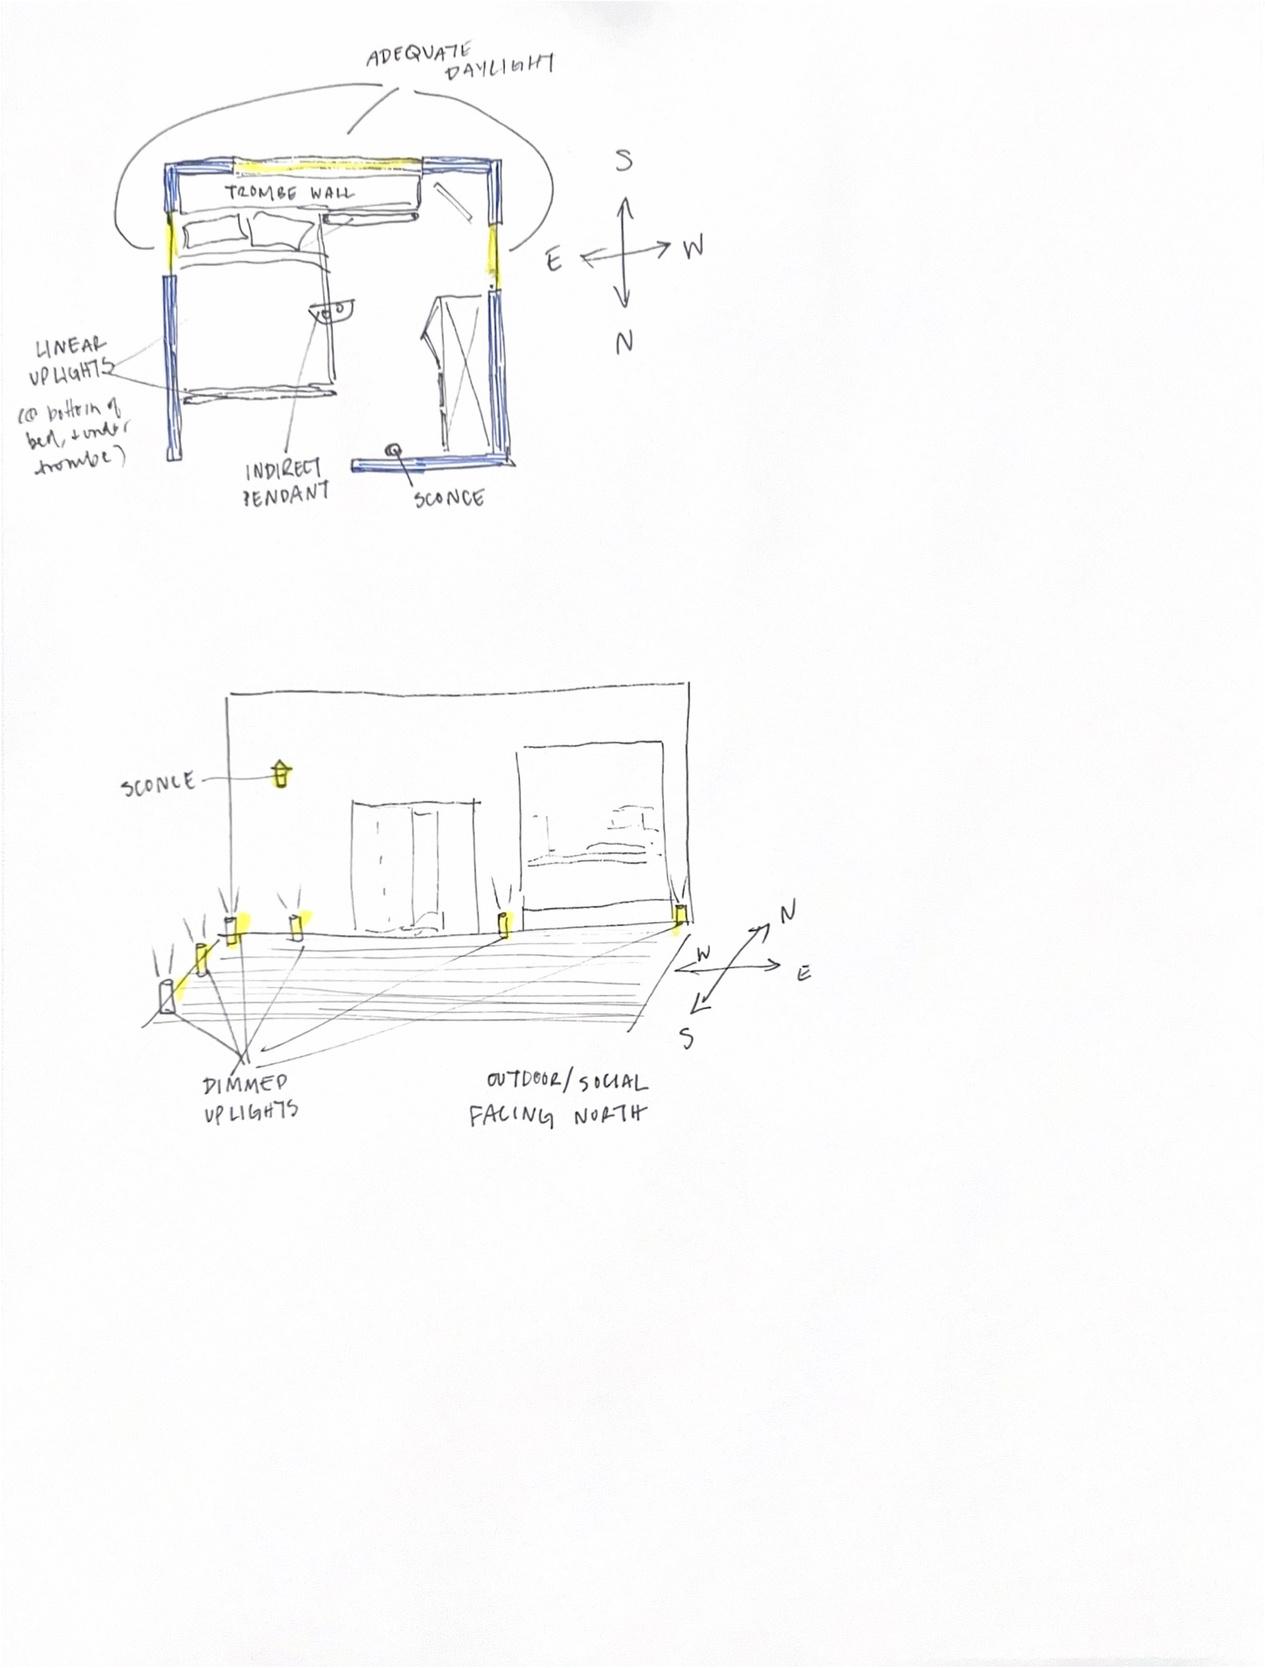
Employing thermal massing elements, like two trombe walls, and ample southern glazing, heat is captured and stored in the kitchen and bedroom. Strategic shades and louvers allow the windows to capture sun in the
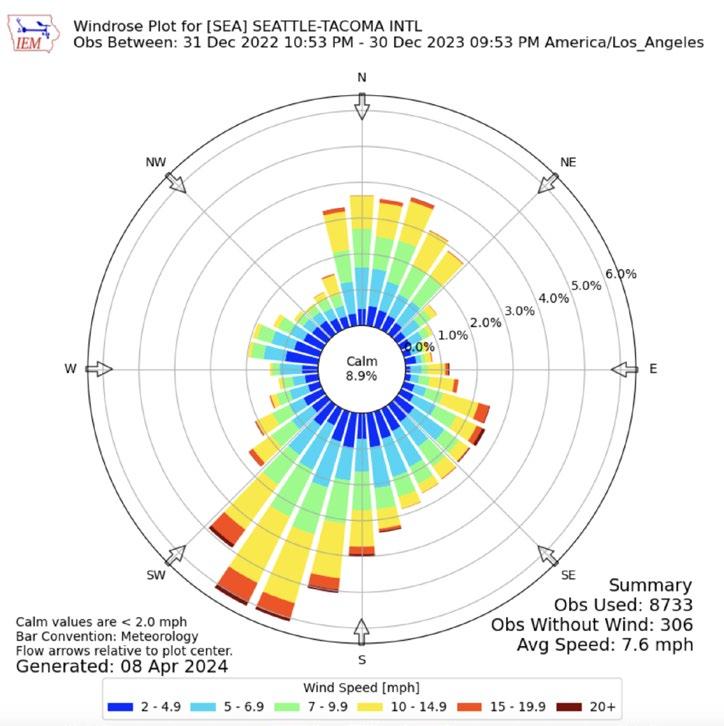
Seattle Windrose plot for 2023; shows that wind is coming primariliy from the South/Southwest
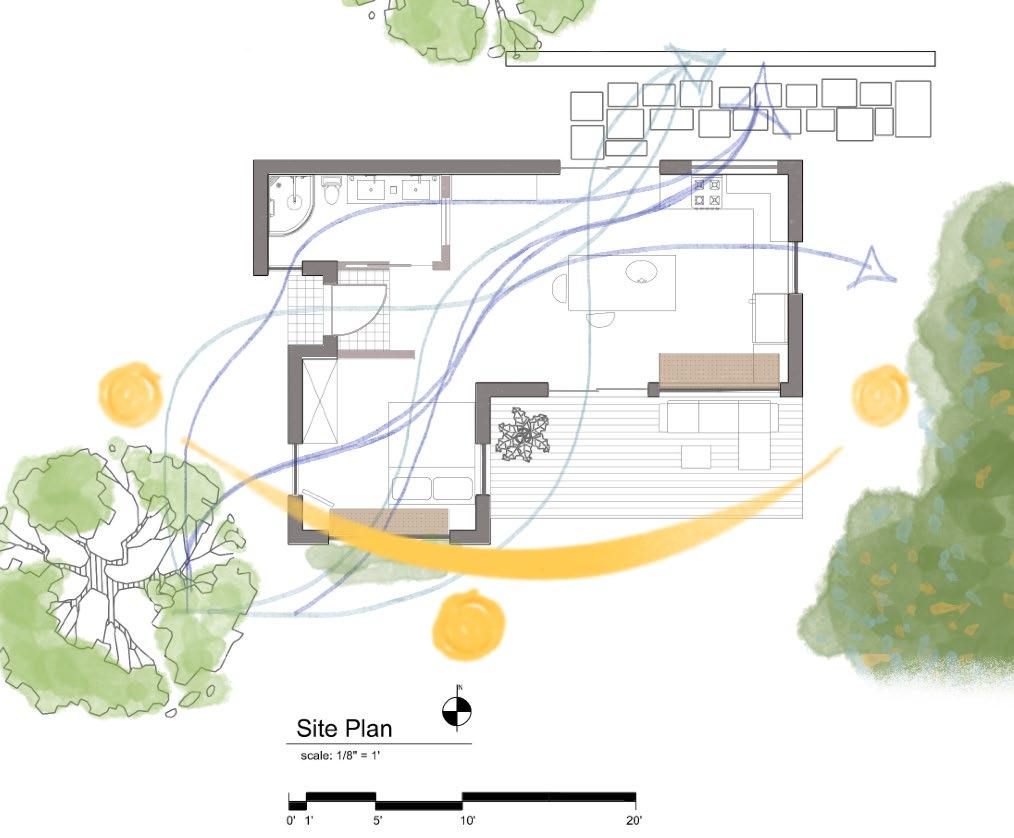
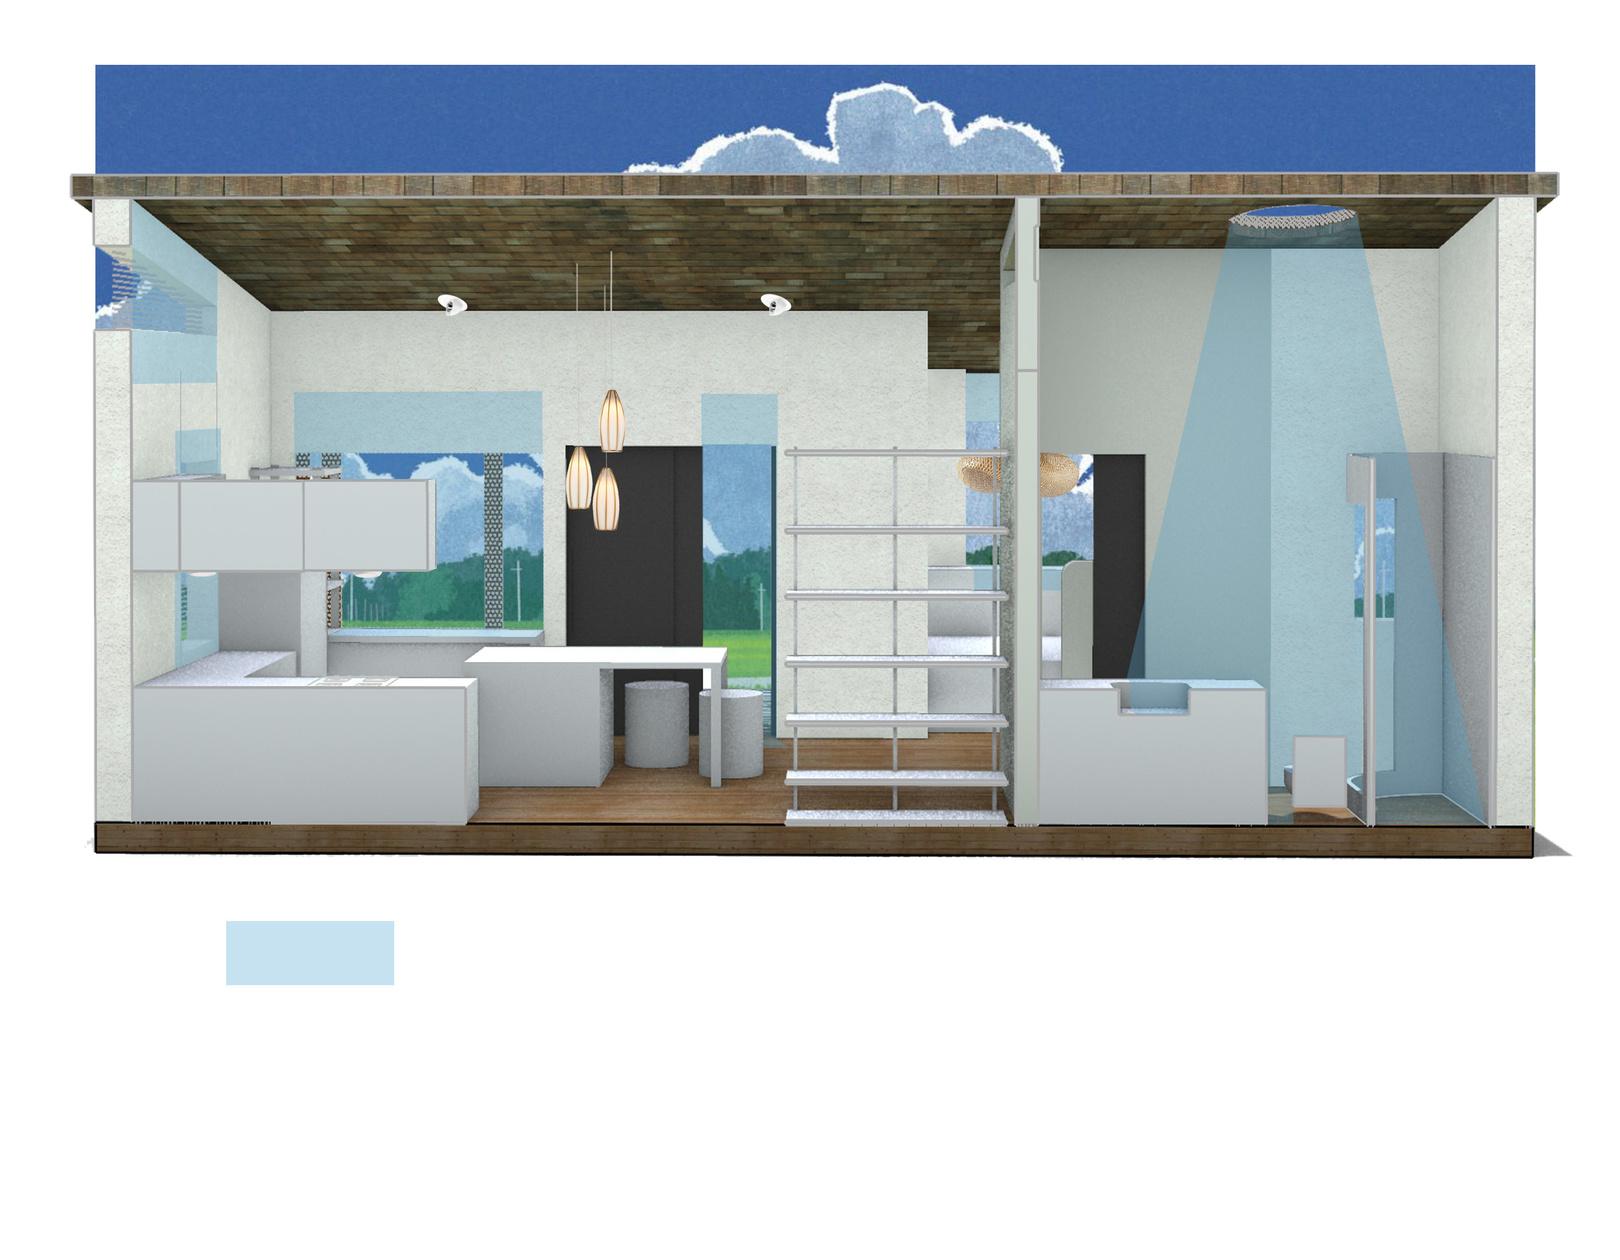
Interior and site plan, made using Rhino and Procreate
winter months, when the sun’s zenith is much lower. During the summer, between many windows and two sets of sliding glass doors, the DADU can take on an open ventilation configuration (should Seattle weather allow).
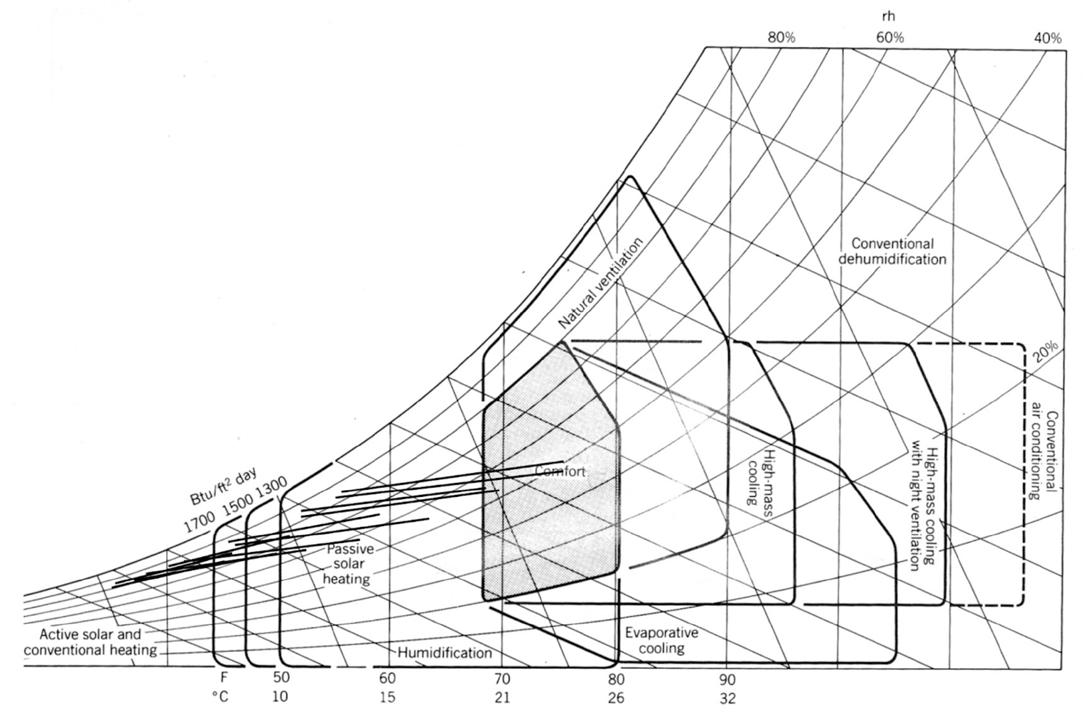
The monthly psychrometric chart of Seattle indicates that for most of the year, heating is necessary
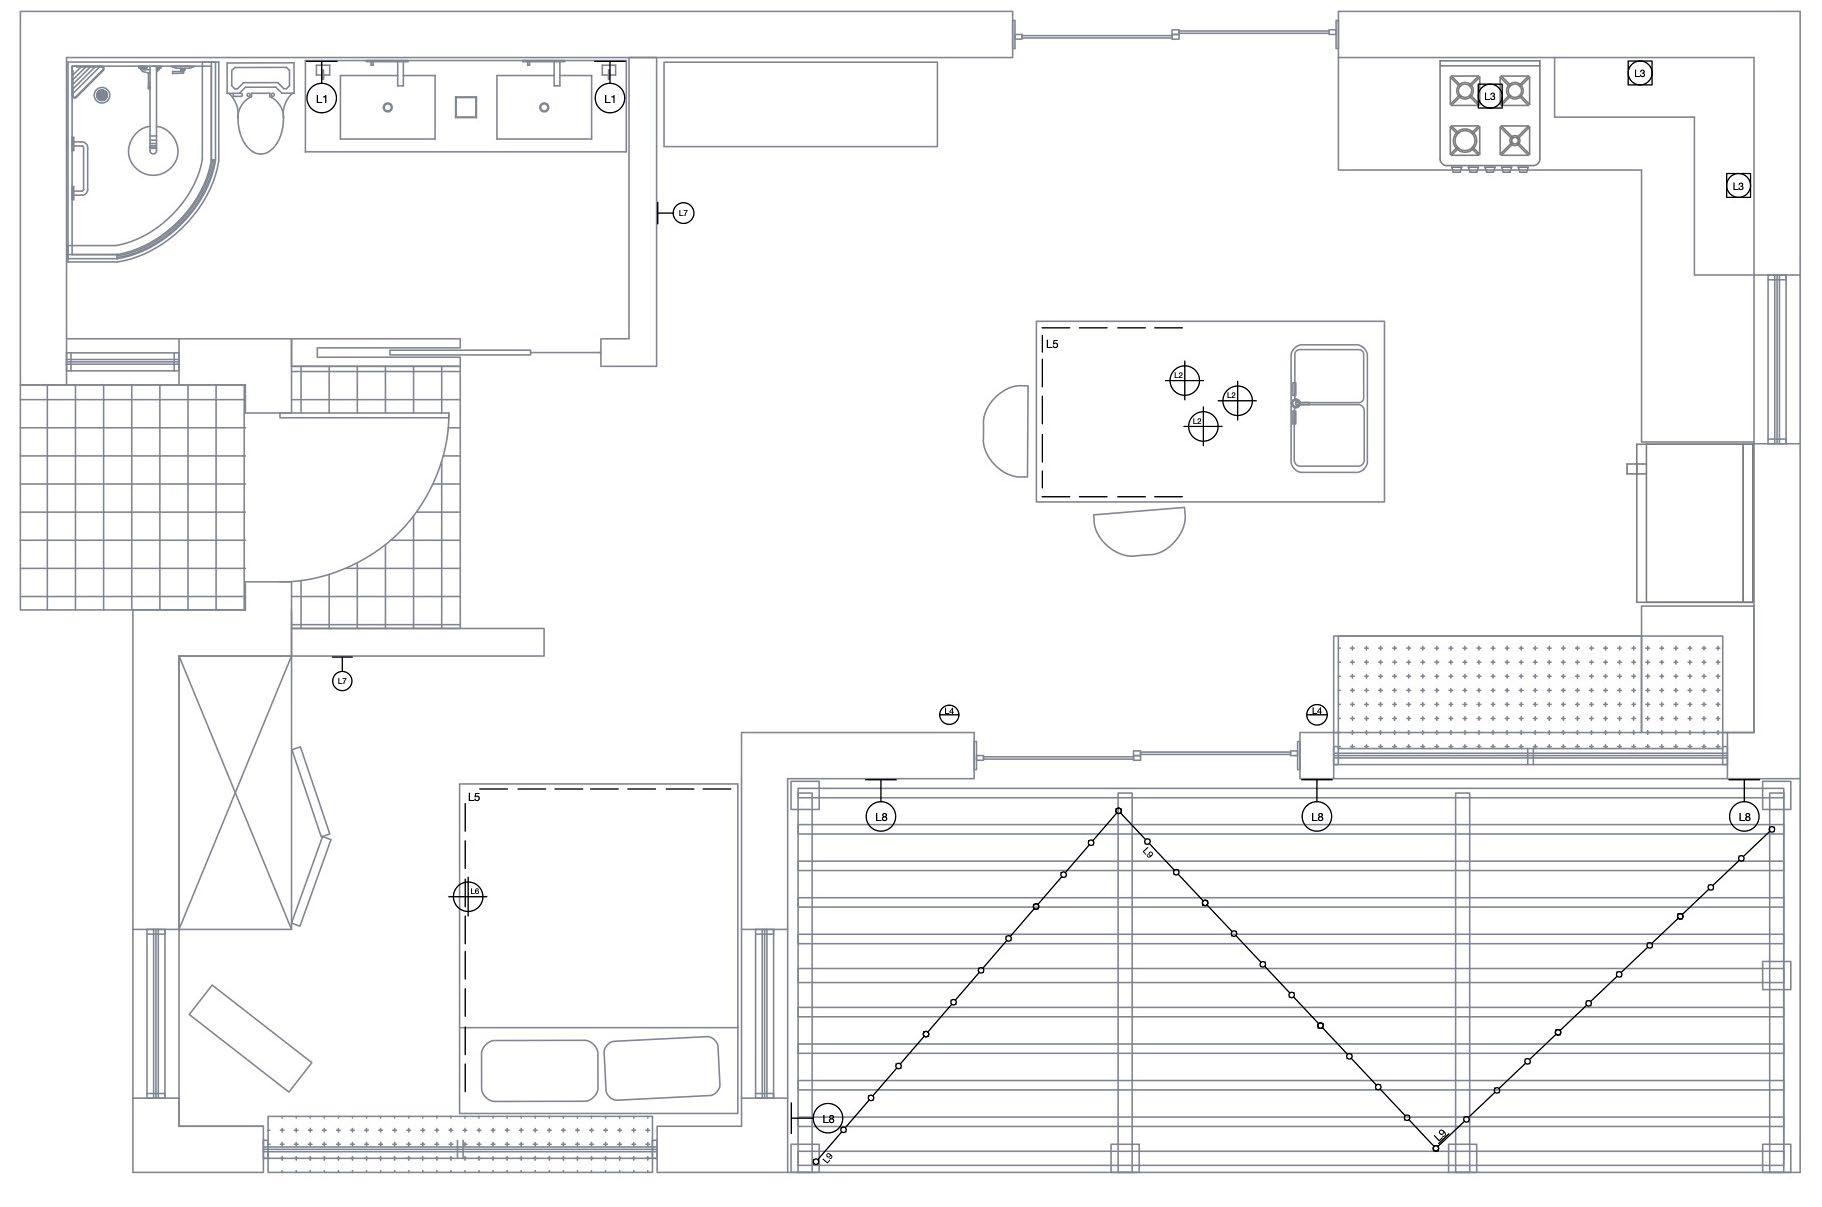
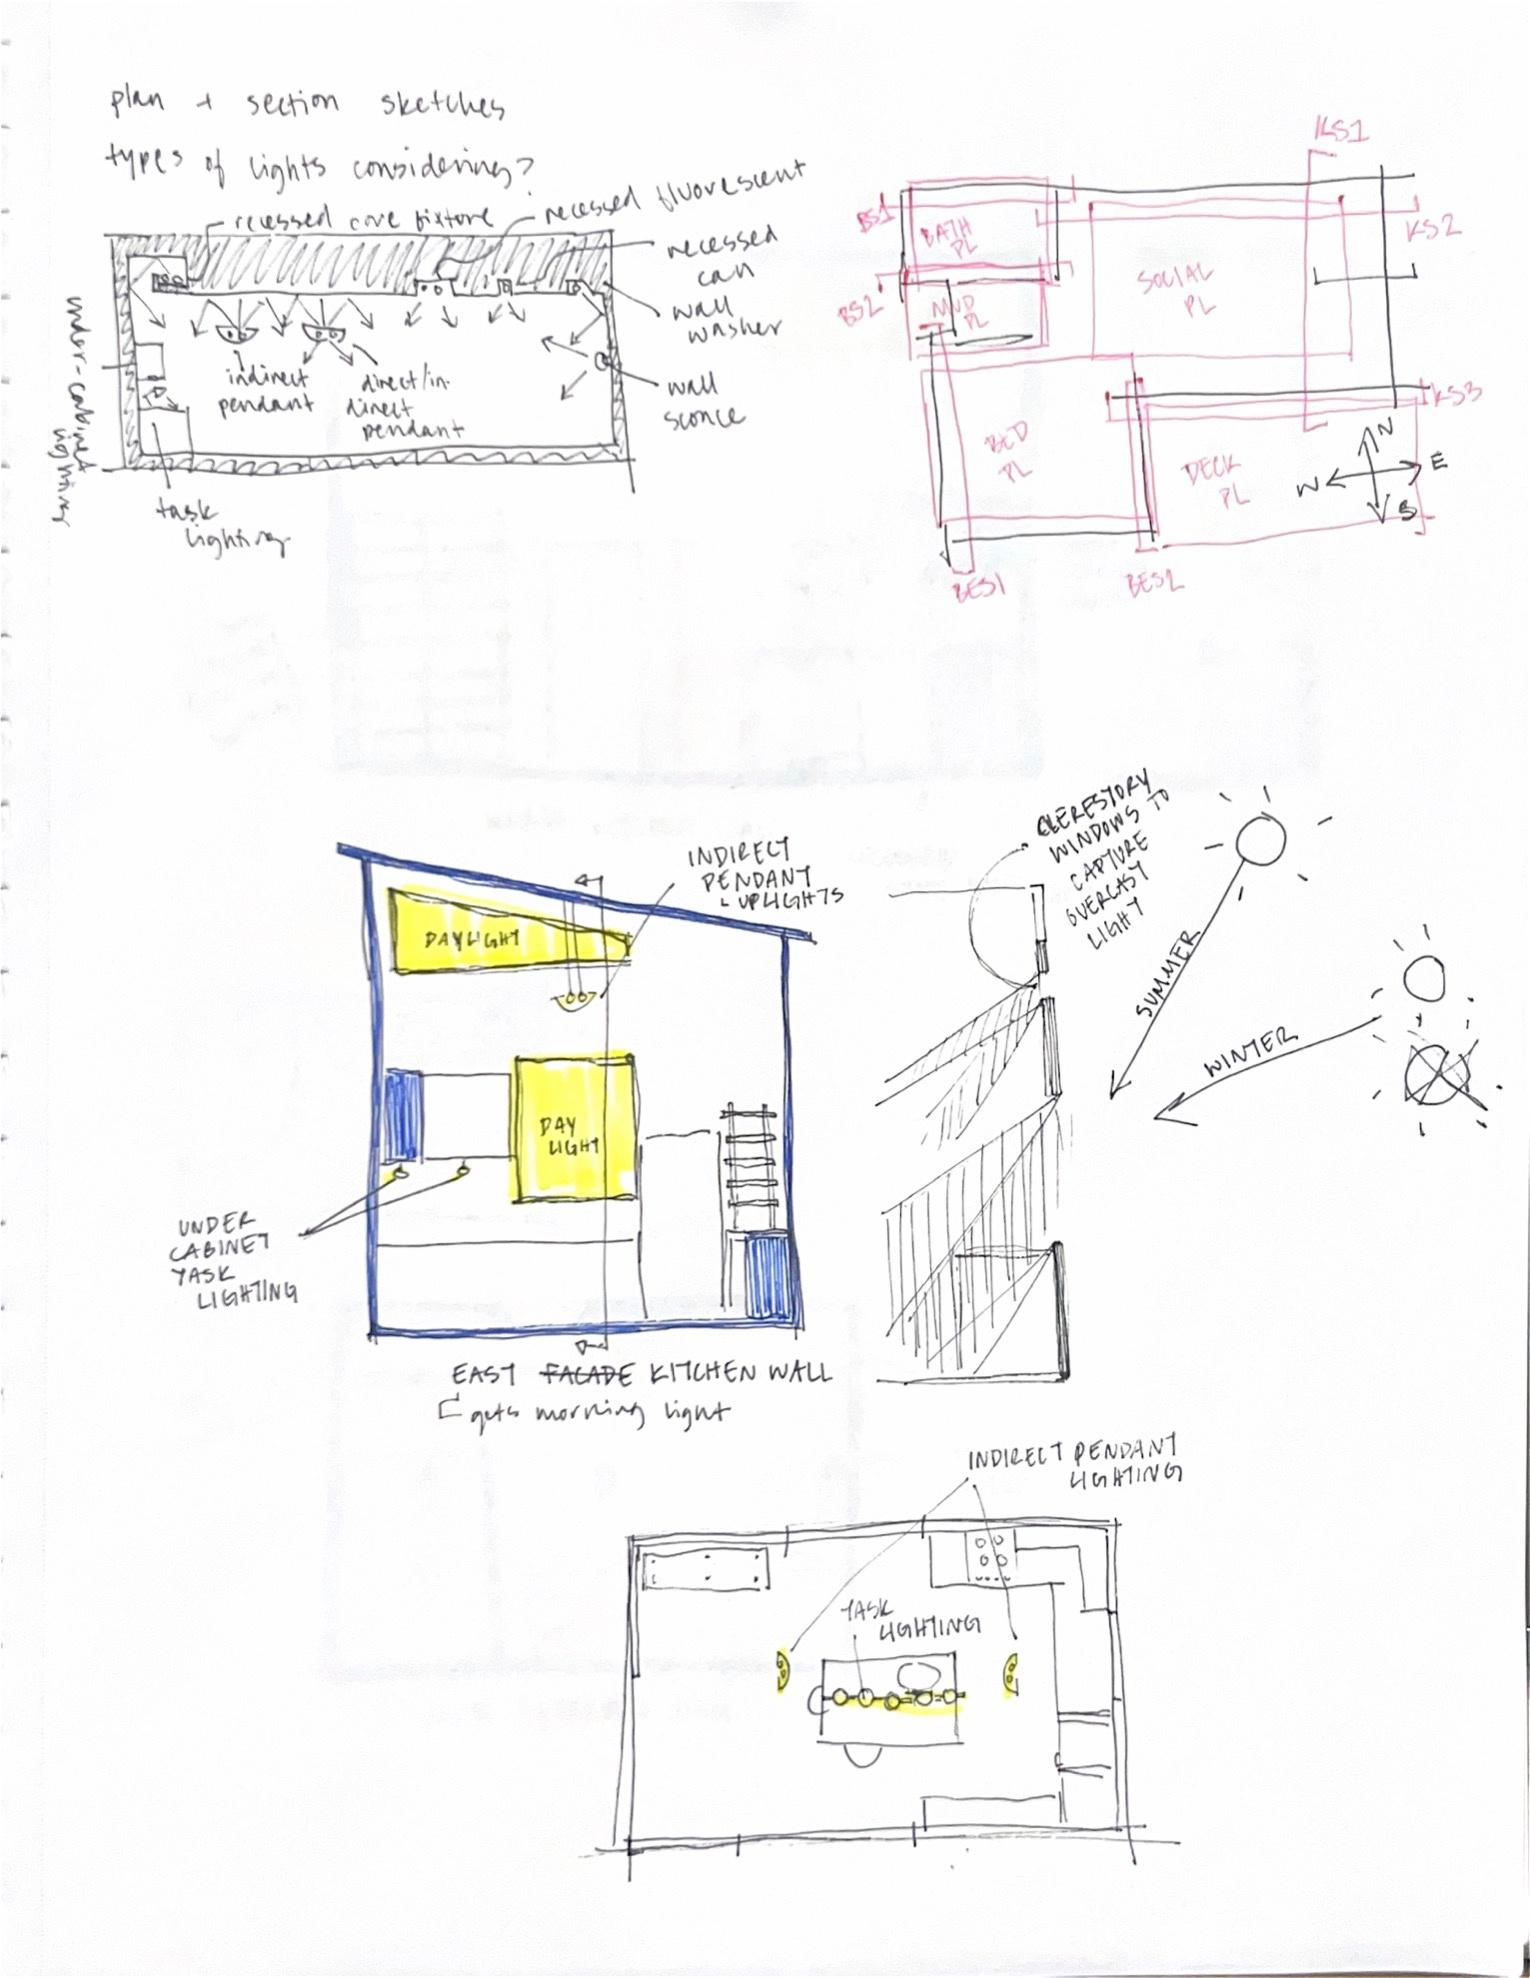
SYMBOL KEY:

wall washer, surface recessed downlight
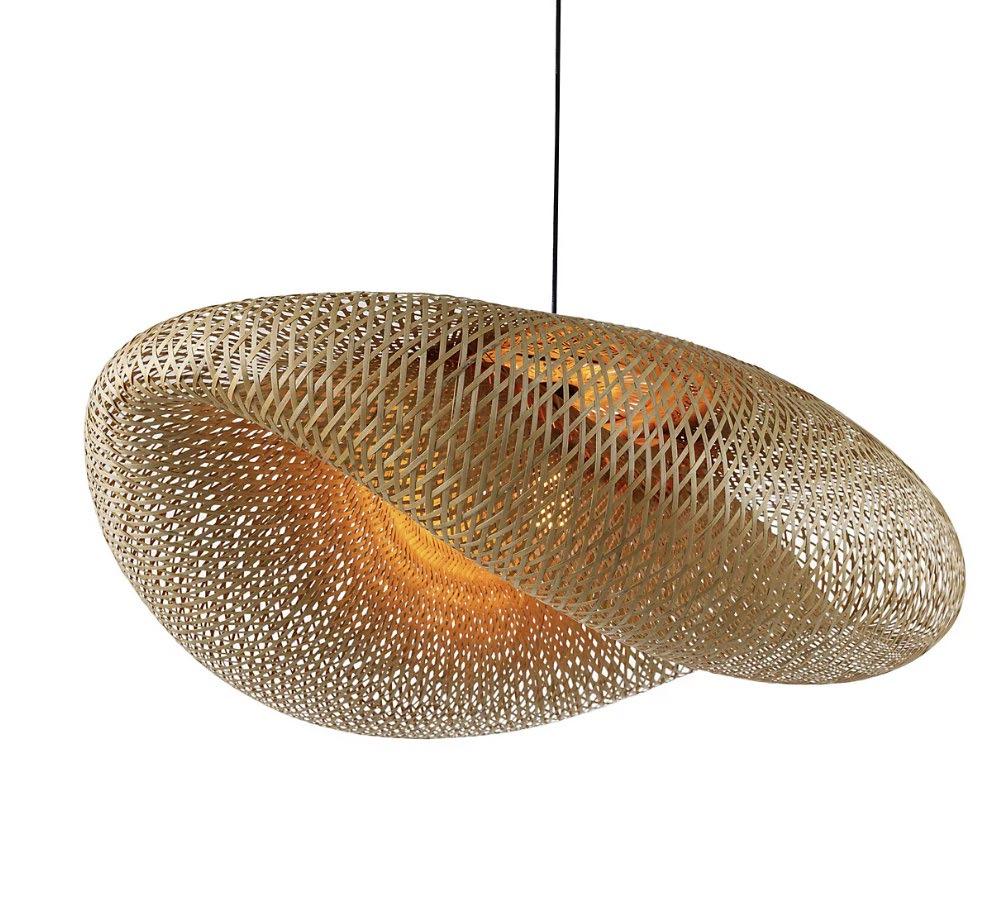
wall luminaire, surface pendant luminaire
concealed LED strip
exterior string lights
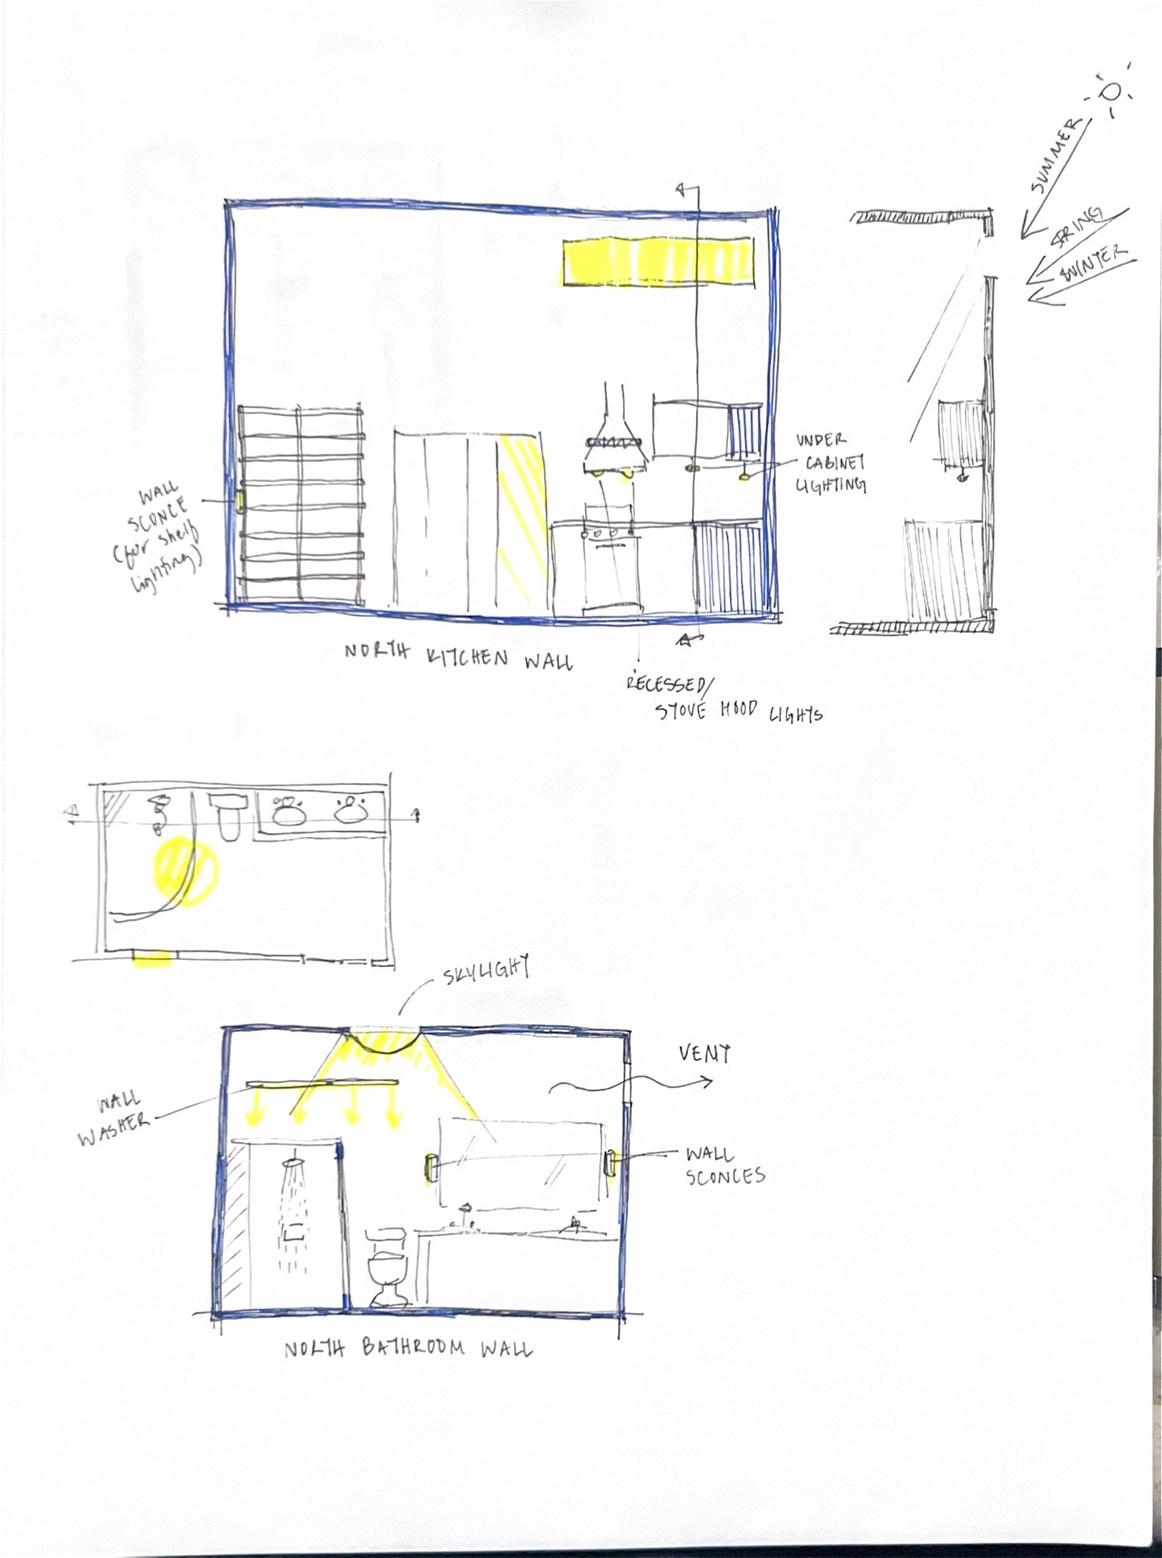
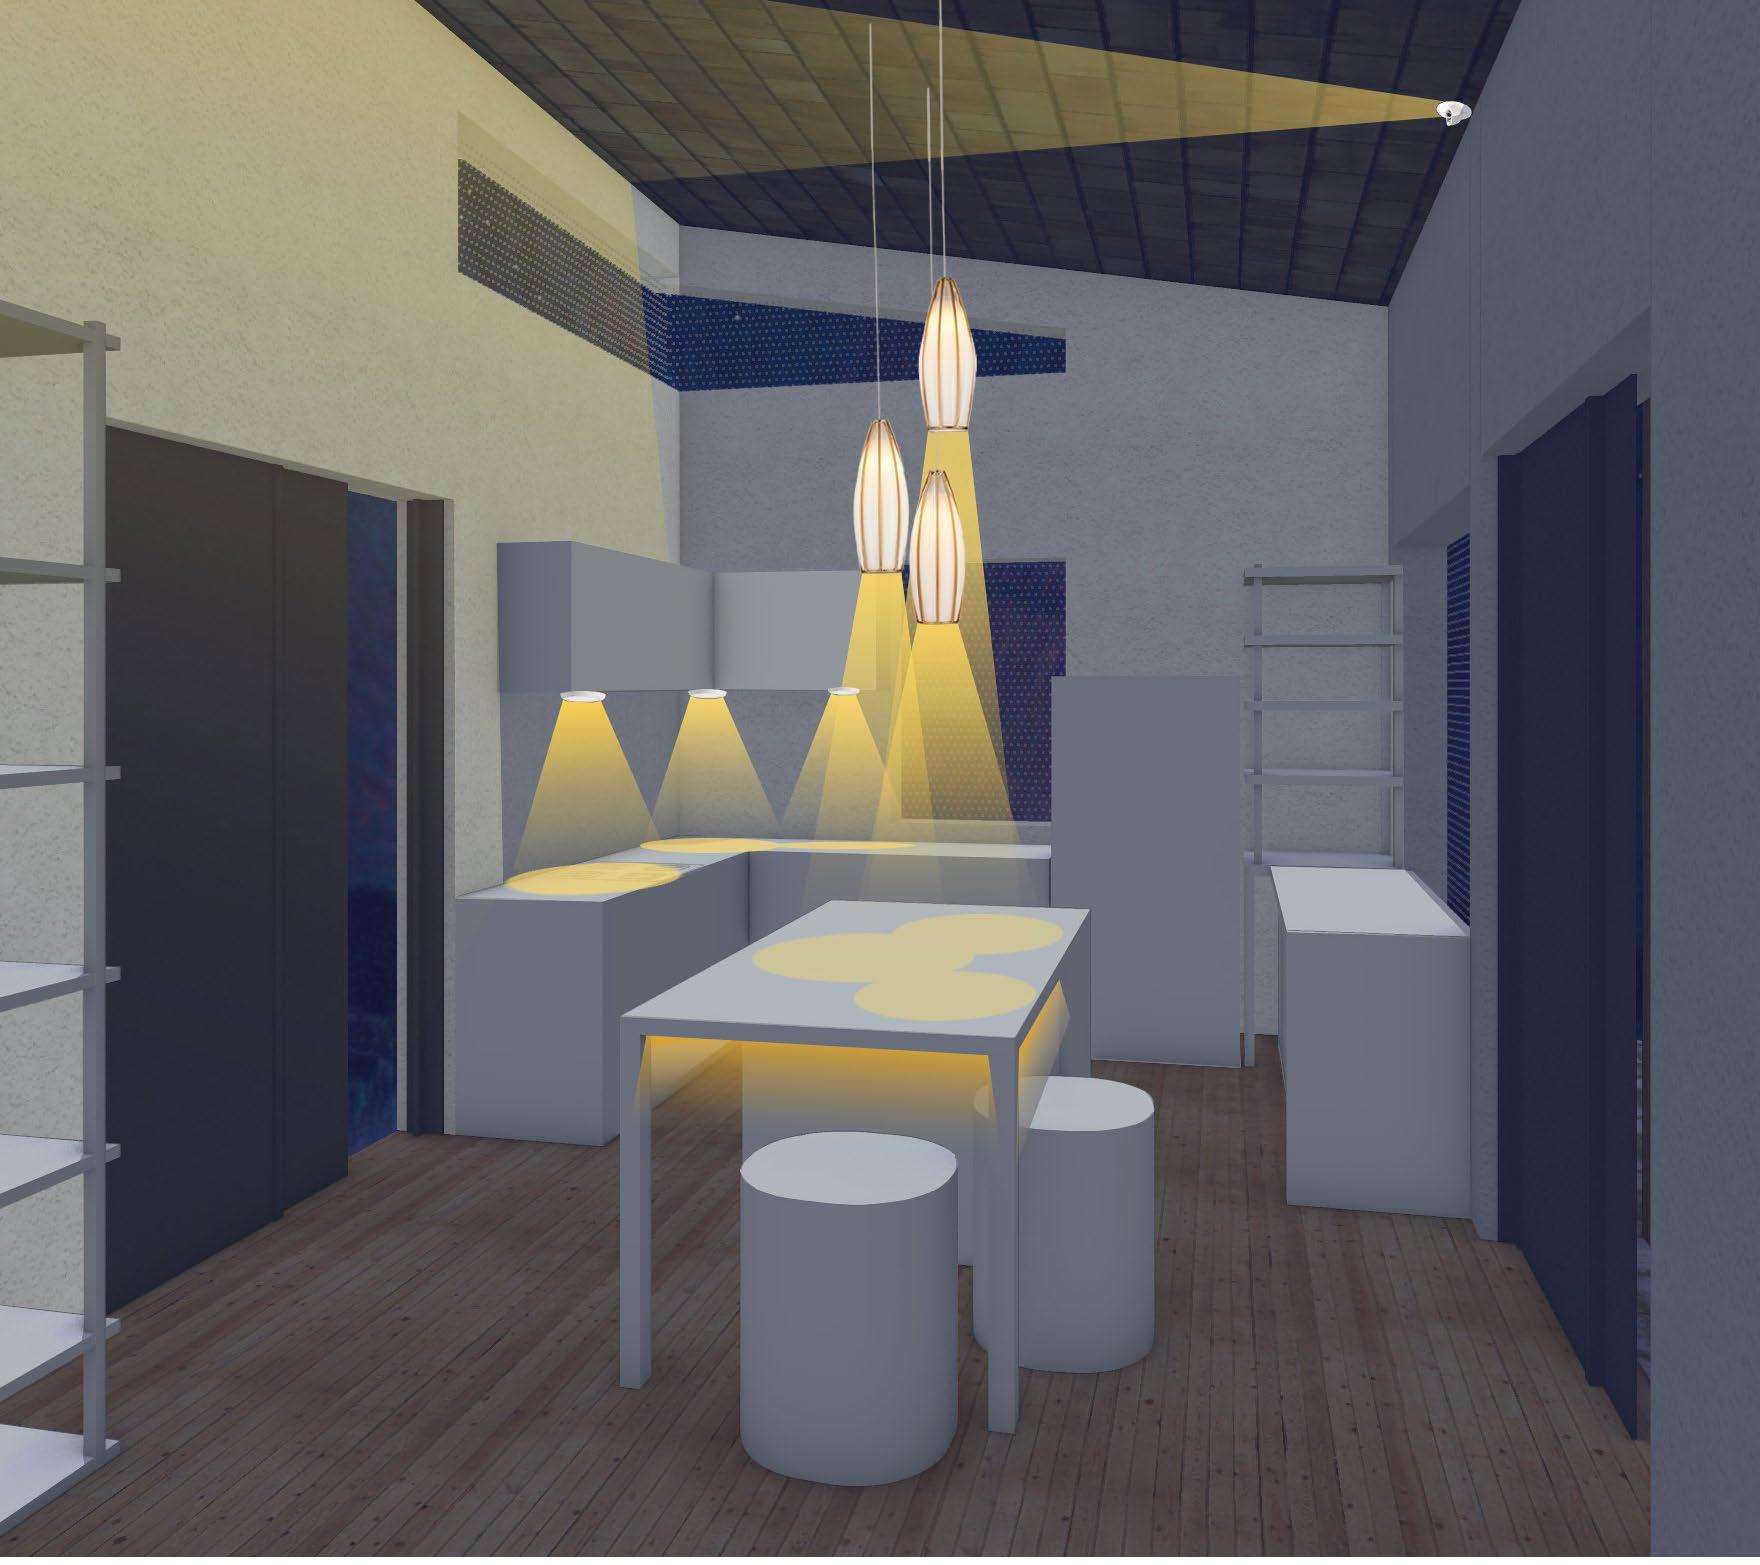
The lighting design for this DADU utilizes daylight for most of the day time lighting. Taking into account that it is such a small space, it was important to design


the lighting in a way that opens it up. The clerestory windows and ceiling washes will lift the kitchen space and brighten it up.


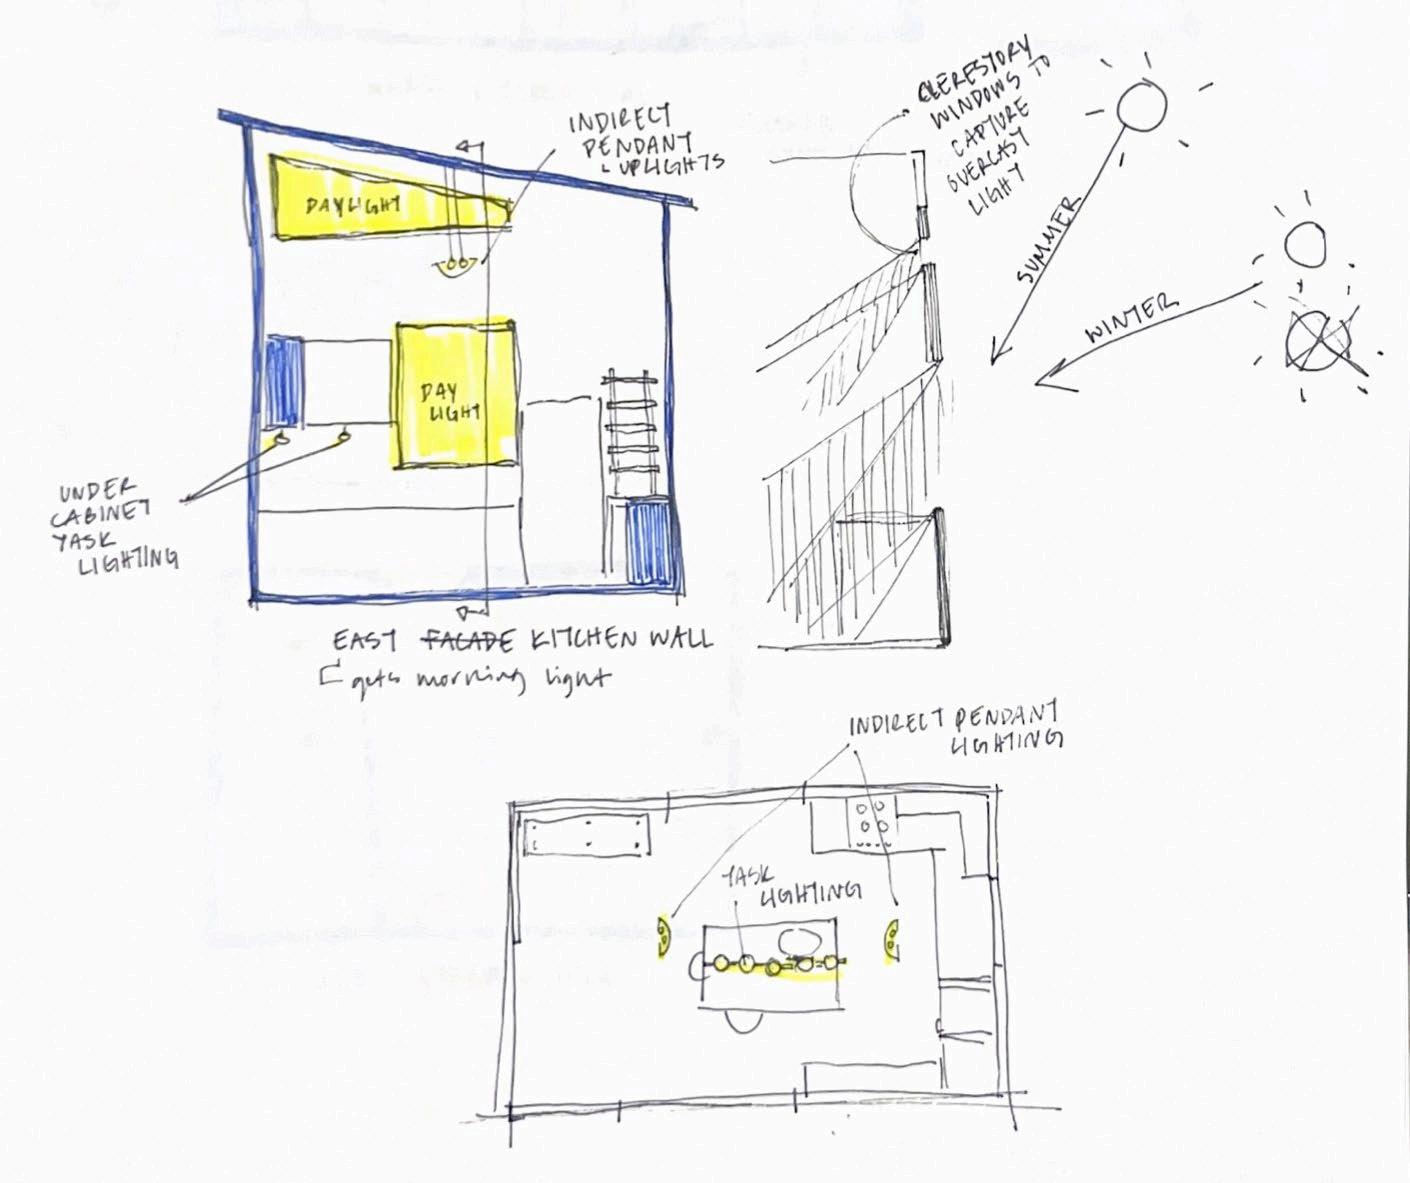
of kitchen lighting, summer and winter sun
BRIGHTEST
BRIGHT
LEAST BRIGHT LIGHTING DEVICES
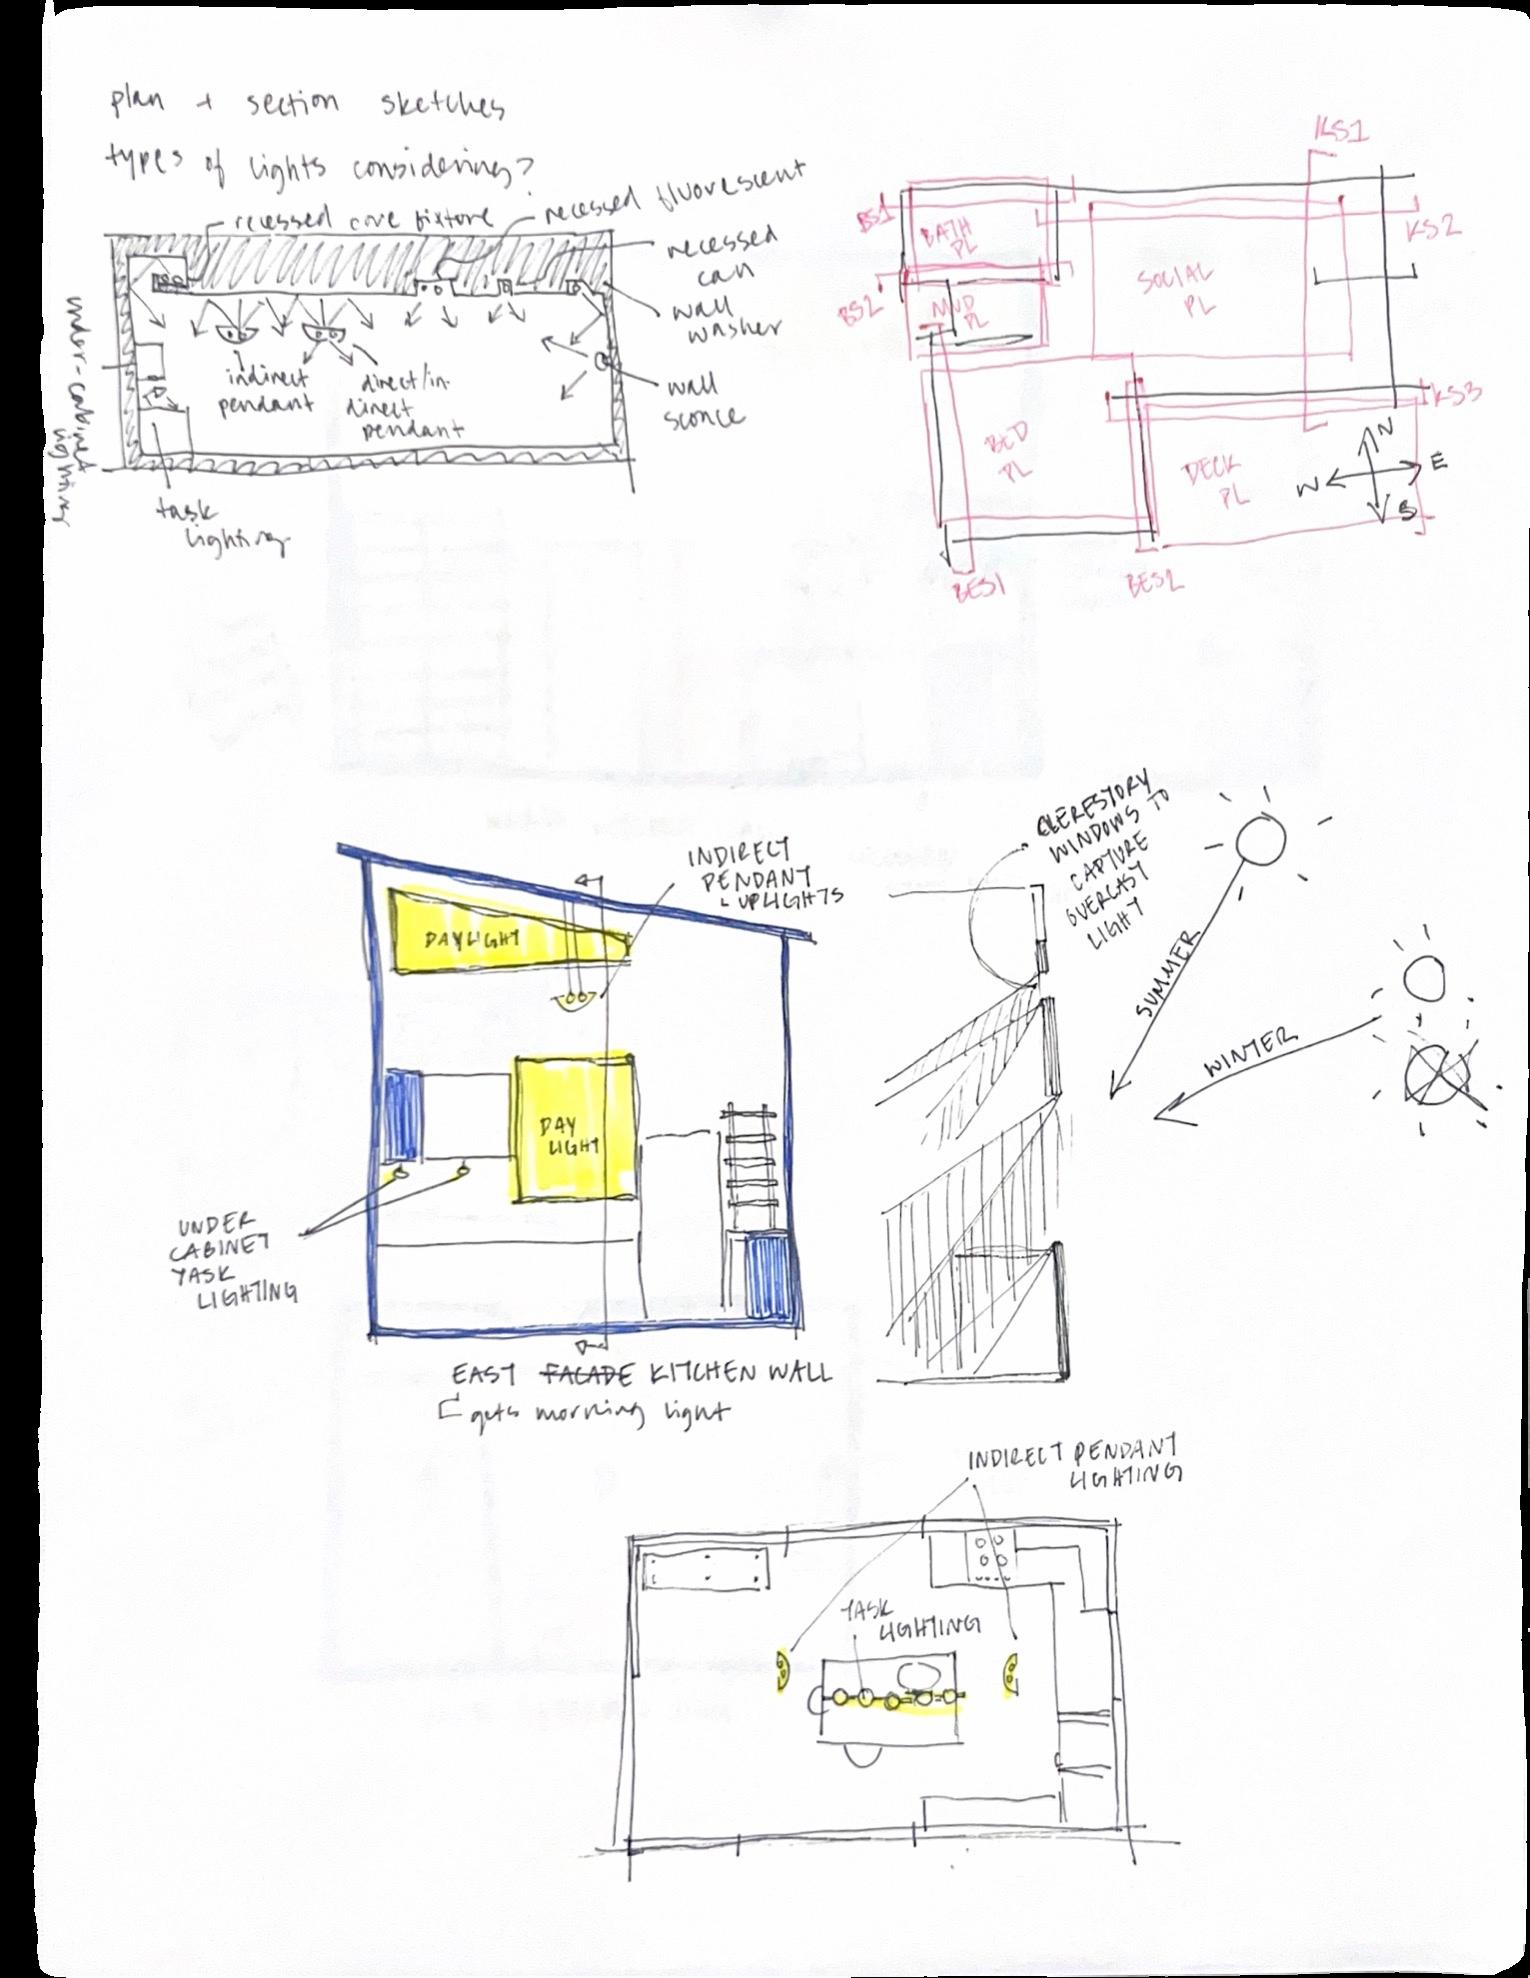
Process sketch of brightness and luminaire options
The rest of the DADU has a cozier atmosphere; decorative wall sconces provide ambient light in the bedroom and bathroom, and outdoor sconces, as well as downlights about 1.5 feet off the ground, light the outdoor living area.
ARCH 431, 435
Rhino 8, Photoshop, Procreate
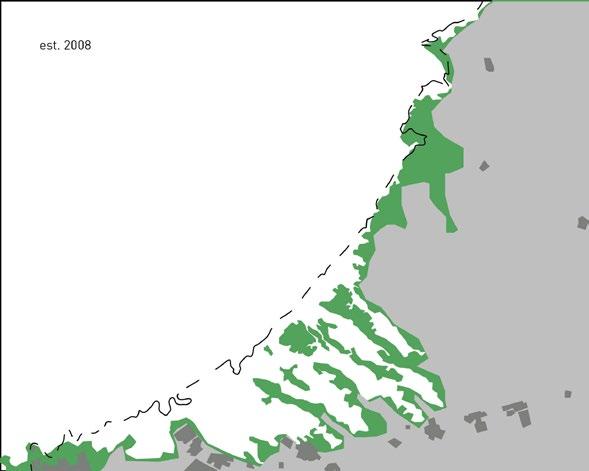
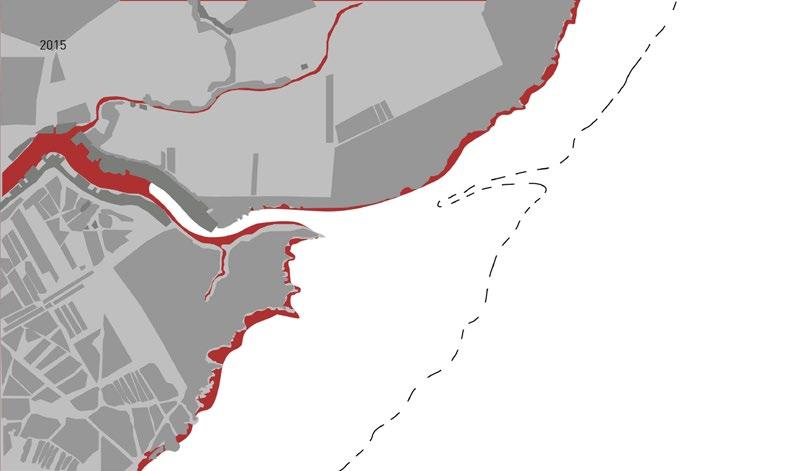
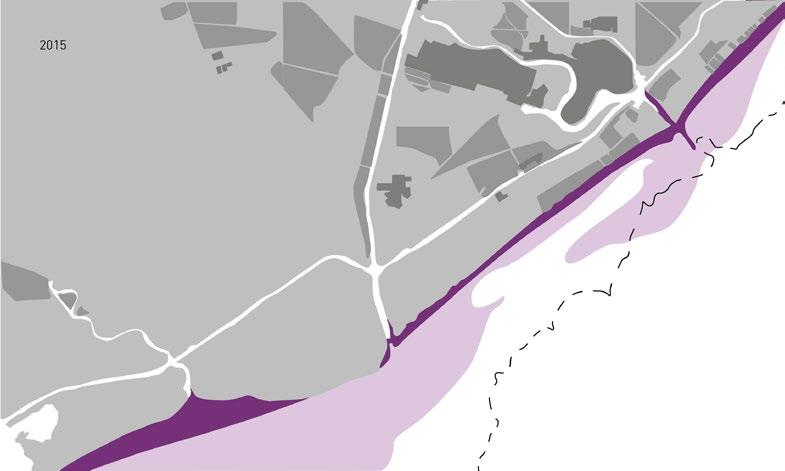
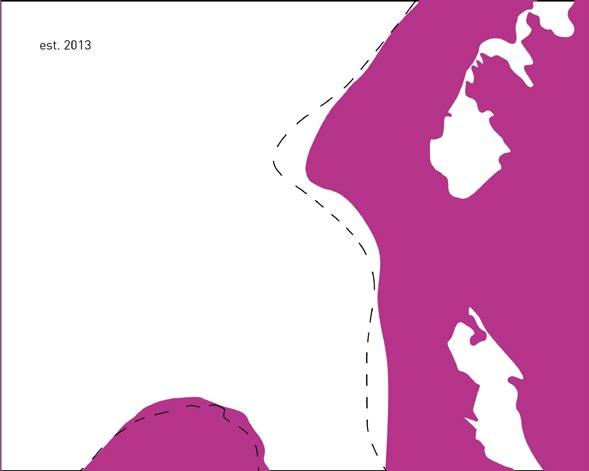
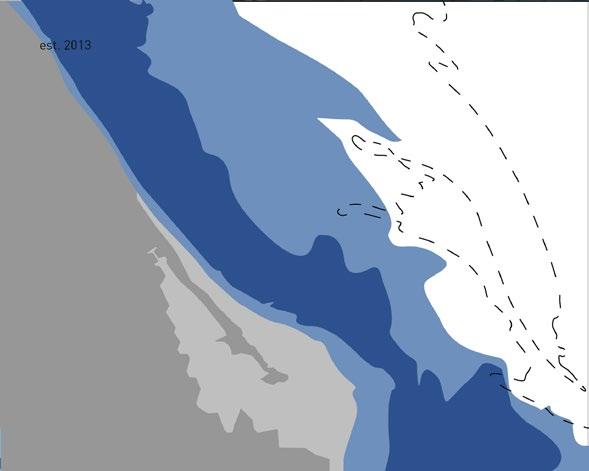
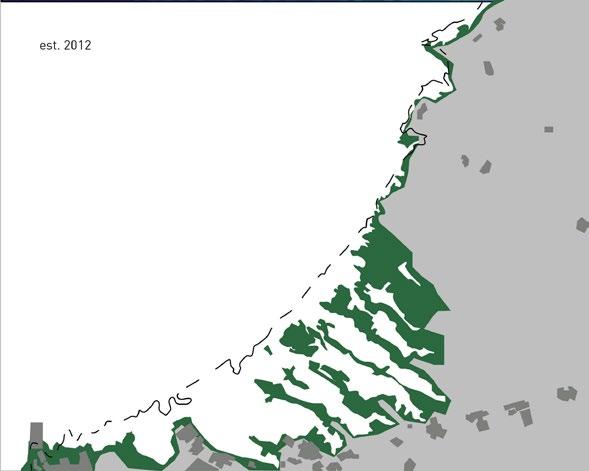
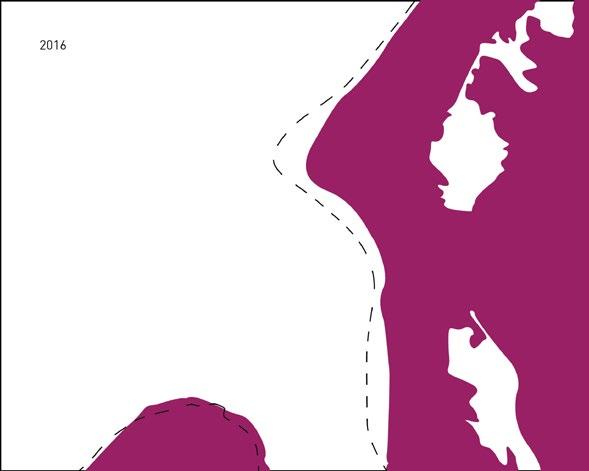
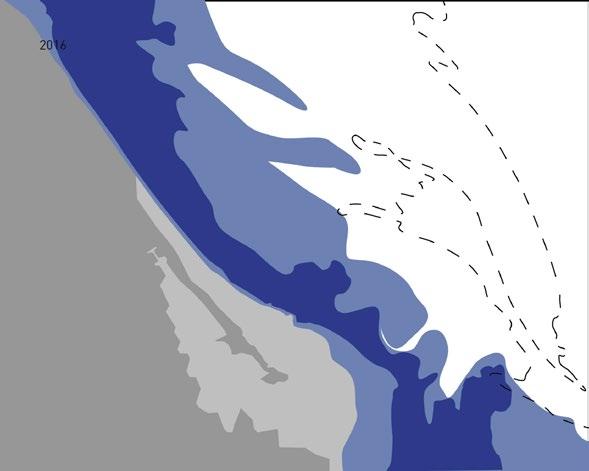
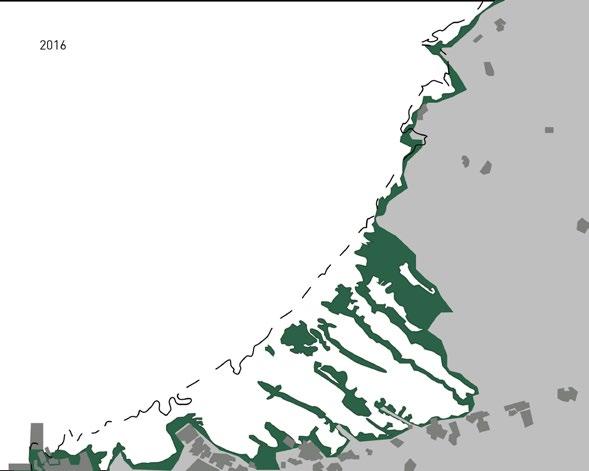
This class asked us to look at the intersection of architecture, global justice, and data mapping. Architects have unique skills in presenting data and information; and visualizing what is happening in our world around us is how we get people to pay attention. My course-long research project looked at the unsustainability of sand mining, and the dire effects the industry is inflicting on coastal habitats. The brief tasked us with writing a research paper and creating three visualizations which display the scope and details of our chosen issue. I’ve included an abridged version of my writing, and the main visualization I created.
section
Sand is one of the most used natural resources on earth, second only to water; it is recognized as the physical foundation of our modern world (Watari et al. 2025). Yet we’re facing a critically unsustainable level of over-mining.
Although sand is seemingly in all corners of the world, usable sand reserves are being depleted by humans faster than nature can replenish them, leaving behind ecosystems on the brink of collapse. This is largely due to the amount that is undocumented and unknown when it comes to sand mining; the allowable extraction rate - what it is and how to enforce it, and the actual amount of sand extracted. Quantifying these variables, and tracking coastal fluctuations with imagery mapping, is the essential first step in tackling the sand crisis.
A particularly important contributor in construction and the built environment, sand is a vital ingredient in materials like concrete, asphalt, glass, and mortar. And with an increase in demand for housing and infrastructure, there has been an increase in demand for concrete (Bide and Mitchell 2023). Sand is also essential for the making of almost all modern-day electronics and microchips. Sand appears to be readily available, playing a major role in many biomes, however, most of this sand is not viable for commercial or construction use. “Desert sand, whipped by years of wind, has smooth grains that prevent it from binding with most materials used in industrial applications. By contrast,sand extracted from rivers, lakes, or quarries is highly desirable for its irregular, angular grains” (Jewett 2025).
Sandy shorelines make up about a third of the world’s (ice-free) shores, and are subject to the accretion and erosion cycles of the ocean. Coastal ecosystems should follow a naturally occurring pattern of accretion (accumulation) and erosion (depletion), depending on the surrounding wind and current patterns, among other things, mainctaining a healthy shoreline. Coastal beaches and dunes act like shock absorbers against extreme weather, and provide a protected habitat for coastal species, as well as local communities (Jewett 2025). Coastal zones have long been hubs of human occupation; flocked to because of their aesthetic value, unique ecosystems, and ocean access, coasts worldwide have become heavily populated and developed. As a result of this intense human activity and development, erosion has started to occur at increasing rates over the last few decades, resulting in coastal squeeze.
Coastal squeeze is the process by which coastal habitats are lost or degraded due to human actions or structures. Usually this means illegal and un-governed human activity.
Whether that is to do with infrastructure being built on top of unstable
shores, or mining shorelines past their tipping point. “In parts of the world, this demand has led to extensive, unregulated and illegal sand mining in delicate and environmentally sensitive environments” (Bide and Mitchell 2023).
The extent of sand mining, illegal or otherwise, is huge and somewhat unknown.
Illegal mining is a broad term, it includes mining outside the approved areas, mining without a valid license, the use of unregistered sand mining boats, and mining at night (Wan Yuen et al. 2024). And, as sand mining is often small-scale, informal and localised, there is little information on where sand is mined, how much is produced or where it is consumed. This lack of understanding and data is a significant global problem highlighted by the United Nations Environment Program (United Nations Environment Program 2023). Coastal squeeze is becoming a worldwide, dire issue. And the problem will only keep compounding on itself as miners are having to dig deeper and deeper, doing more and more damage in the process, to get at the shrinking deposits of sand.
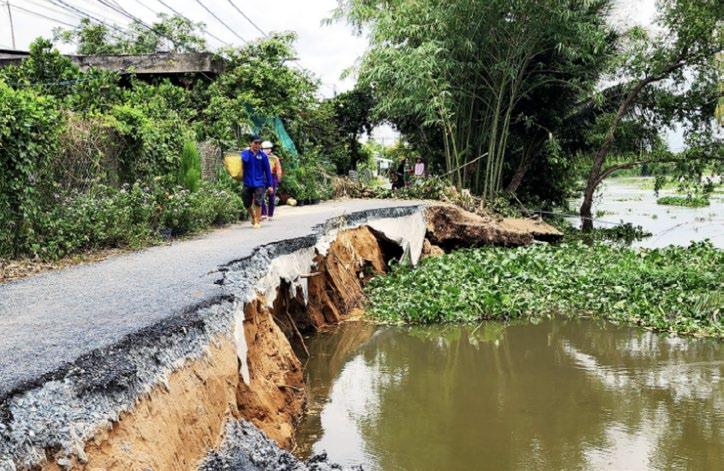
The process of digging up ocean and river sand is called dredging; it can disrupt ocean and river ecosystems, and at such constant and intensive rates, is causing lasting damage to those ecosystems. The consequences of such damage are; erosion, infrastructure damage due to ground soil collapse, increase of flood risk, habitat loss, and river and ocean pollution (Bide and Mitchell 2023). Erosive hot spots have popped up all around the world, some of the biggest being the Mekong Delta in Vietnam, and the coast of Texas off of the Gulf of Mexico. Riverbeds and marshlands are also facing detrimental erosion damage, the most extreme in the US being Louisiana’s coastal marshes, the Mississippi Delta and its riverbanks. Researchers Luijendijk et. al. for the State of Our World Beaches project have identified some of the largest hot spots. Four of the seven largest erosive hot spots are located in the USA. The largest accretive hot spot is in Namibia, at a location where a mining company has built unprotected sandy bunds (a wall of earth built to deter flooding) in the sea to help facilitate the diamond prospecting there. More and more erosive and accretive hot spots have begun popping up around the world, and they are directly linked to unregulated human activity taking advantage of the raw materials.
The Vietnamese Mekong Delta, or VMD, is a case study that has been monitored for years and serves as a prime example of the consequences of long term, unsustainable sand mining. Researchers selected the VMD, the largest delta in Asia, for its long history of intensive and illegal riverbed mining. Their goal with this research was to quantify the rate of illegal mining. With this, researchers were able to quantify the amount of sand that was illegally mined and potentially unaccounted for - something lacking in most mining operations. Although more research
needs to be done on allowable extraction rates, the insight gained from this research will provide baseline information on the scale of illegal mining in the VMD, which will then “be useful for informing regulatory frameworks for sustainable sand mining” (Wan Yuen et al. 2024). This research paper highlighted illegal mining locations using public data made available by the provincial governments, looking at the allowable rate set by the government and the actual rate of sand extraction as documented by a systematically measured and mining budget. This over-mining is destroying the VMD’s infrastructure, and river and ocean ecosystems. Even more complicated is the fact that many locals rely on mining for their livelihoods, and enforcing heavy regulations might hurt those depending on this. However, this cannot keep up for much longer, a, “systematic and unified approach to manage sand mining in the VMD is needed” (Wan Yuen et al. 2024). Quantifying and mapping erosion can help policymakers minimize environmental degradation without jeopardizing the livelihoods of sand miners. Mapping coastlines and coastal erosion has largely relied on in situ and qualitative measuring. However, researchers Lujendijk et. al., developed a new method of identifying and mapping coasts through the use of satellite imagery (as opposed to on site land surveys, or sparse data from aerial platforms, photographs, or lidar scanning).
“The launching of the Google Earth Engine (GEE) platform, containing a continuously updated global satellite image archive, now enables efficient global scale shoreline detection” (Gorelick et al. 2017). This analysis has gathered 33 years (1984-2016), and on-going, worth of imagery data, and is the first fully quantitative study done of its kind (Luijendijk et al. 2018). The images go through an automated image analysis, advanced image processing techniques, and machine learning to detect shores as they are and as they change over the years. With this, researchers found that,
sand is being mined at an overall rate that is much faster than the Earth can naturally replenish; sea sand is running out.
Data and visual mapping indicates that human activity and exploitation is the cause of most of these hot spots. The methods devised by these researchers have laid way for a more quantitative, and accurate, measurement of sand extraction. Having this baseline is step one to finding a system of solutions.
Not only is overmining of sand causing irreparable damage and depletion of the material, but coastal and river management efforts have also been given minimal to no support, resulting in damaging flooding, and river bed erosion. An example of successfully using thorough mapping and data visualizing to effect change is the mapping of the Mississippi by Martha / Da Cunha, and the
restoration efforts by Glass Half Full of Louisiana’s Mississippi Delta and coastal marshes.
The state of Louisiana has lost a quarter of its wetlands since the 1930s. Flood control structures were built to protect the river communities from the river’s flood cycles. While good-intentioned, the structures also prevent sediment from going into barrier islands and wetland areas by the Mississippi River’s spring floods (Martha / Da Cunha, n.d.). This natural cycle is critical to preserving coastal areas, and without it, the land is disappearing much faster than it can regenerate. Martha Dacuna has been mapping the Mississippi - its exploitation, fluctuations, and flooding. Their work serves as an excellent example of how mapping waterways, and analyzing that data, can help facilitate social movements working toward revitalizing the river and understanding its impacts.
The unsustainability of sand mining, poor to no management of sand collection, shoreline habitat destruction, and coastline shrinkage are only a few facets of a global, complex sand crisis. Although humanity is at the mercy of river and ocean bed sand, sand mining has shown no signs of slowing down. Researchers have been documenting and gathering data on coastlines, using ever-updating technology to highlight and quantify coastal depletion and accretion. Although right now there are no solutions, there are goals that researchers are working towards. Such as, “finding resources on a local level that can be extracted sustainability, with the minimum environmental impact, whilst still meeting local economic needs. This way we can continue to build with sand and protect the environment for future generations” (Bide and Mitchell 2023). Reducing the consumption of new sand and using sand alternatives when possible is incredibly important - such as using mass timber - one of most promising concrete alternatives in circulation right now. While every little restoration and conservation effort helps, slower and sustainable policies need to be put into place to make a global difference.
“ungoverend sand markets exacerbate illegal mining, smuggling, corruption, and scoio-economic conflict, putting both communities and the environment at risk. To mitigate these risks, we need a robust system to systematically monitor the flow and stock of sand through the economy and identify areas where action is most needed” (Watari et al. 2025).
While more research and data gathering needs to be done, by continuing to map and quantify the ocean’s encroachment on our coastlines, and calling to attention the over-mining of this critical material, hopefully large enough change can happen to prevent this global crisis.
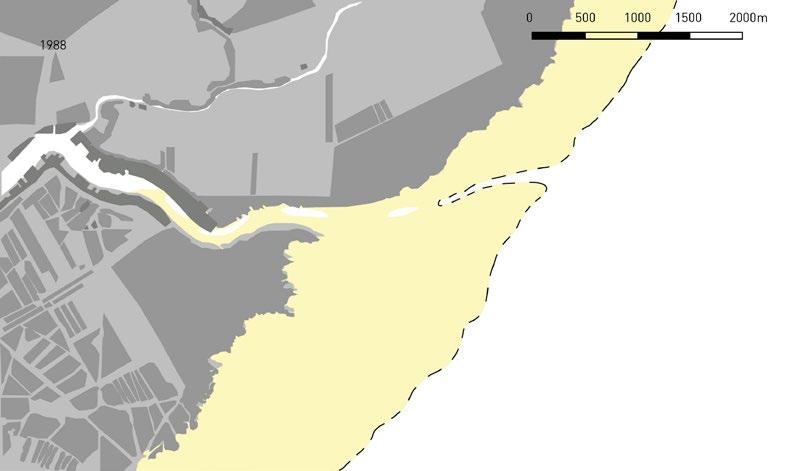
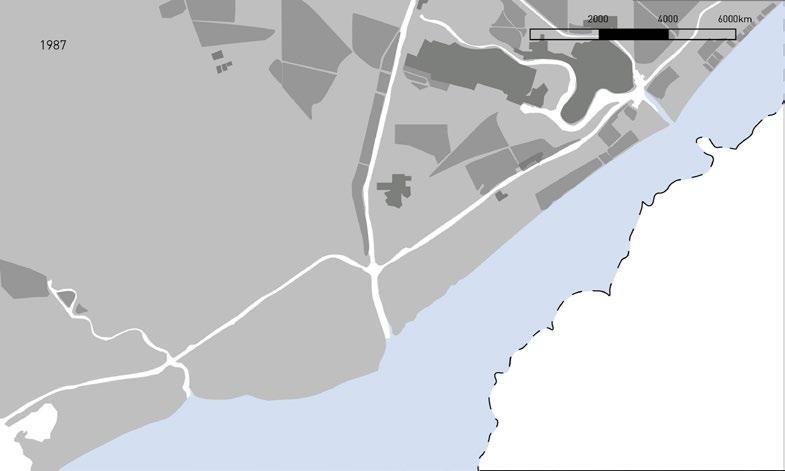
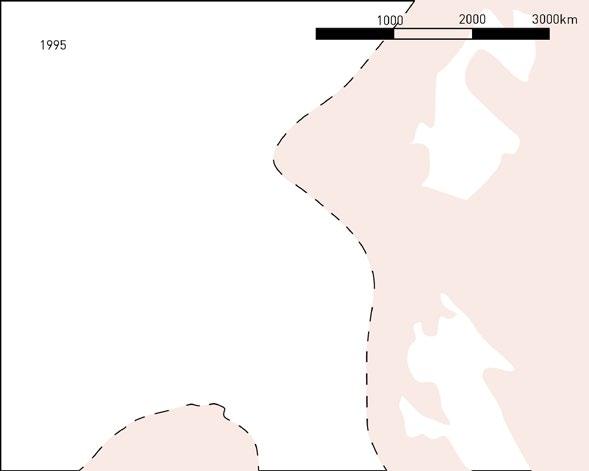
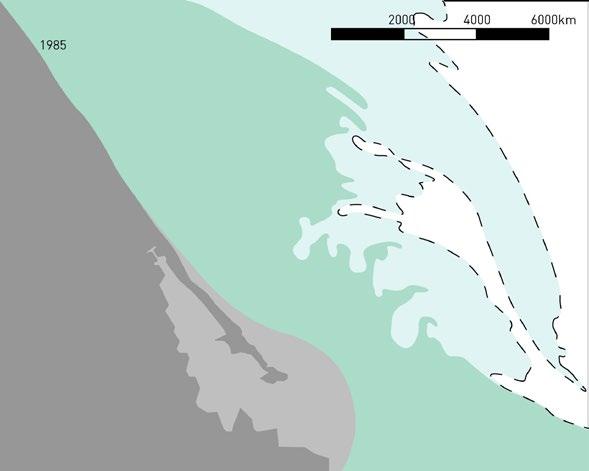
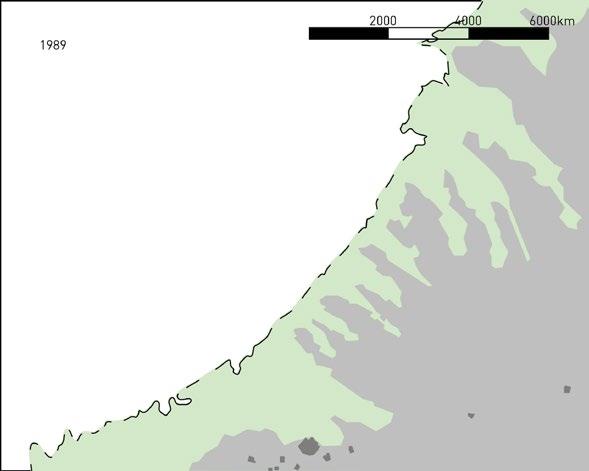
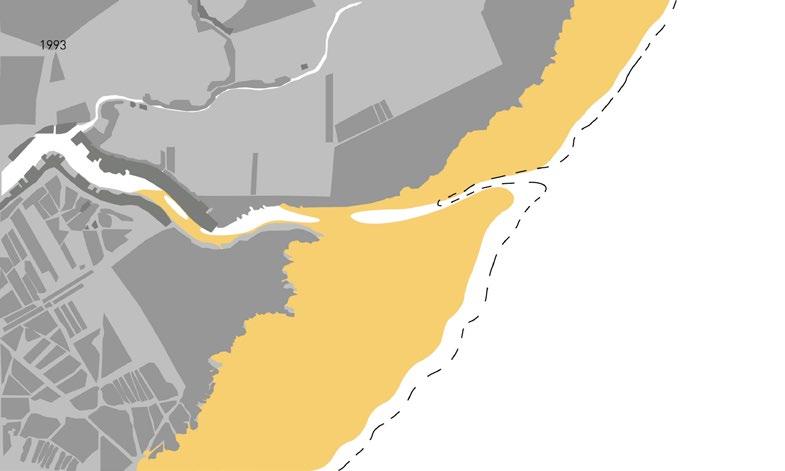
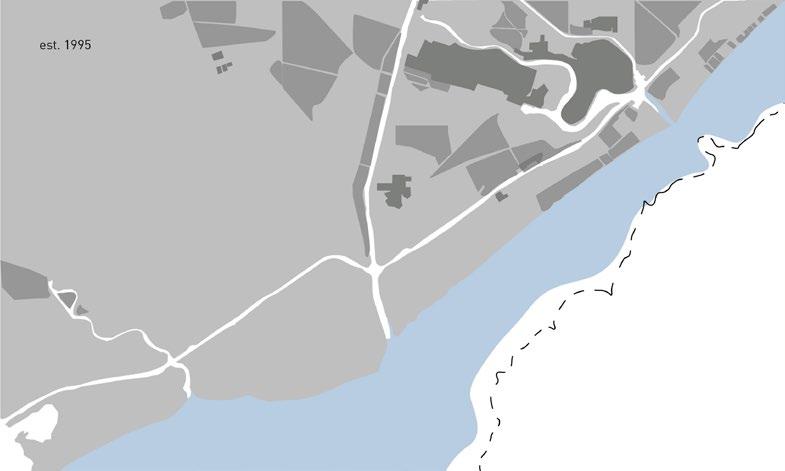
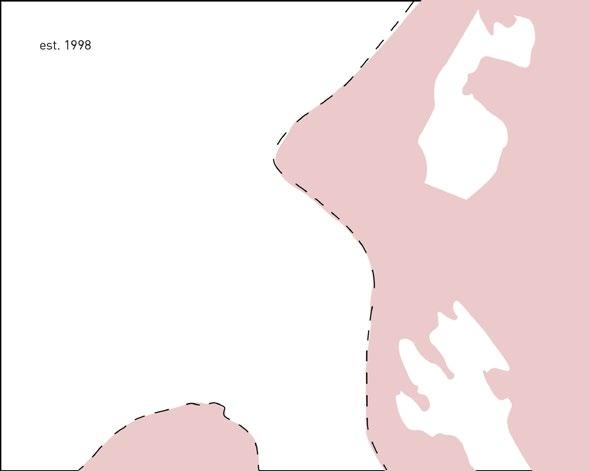
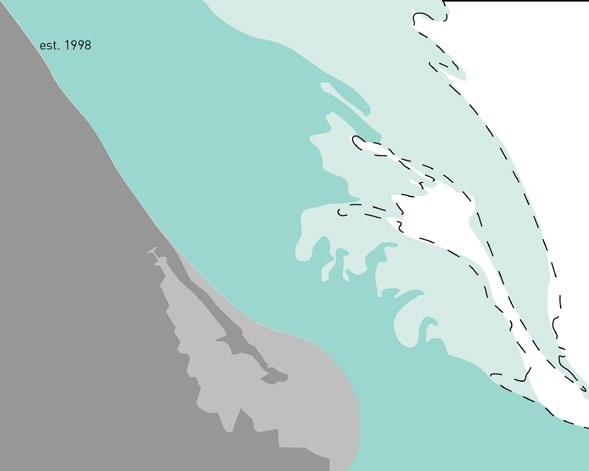

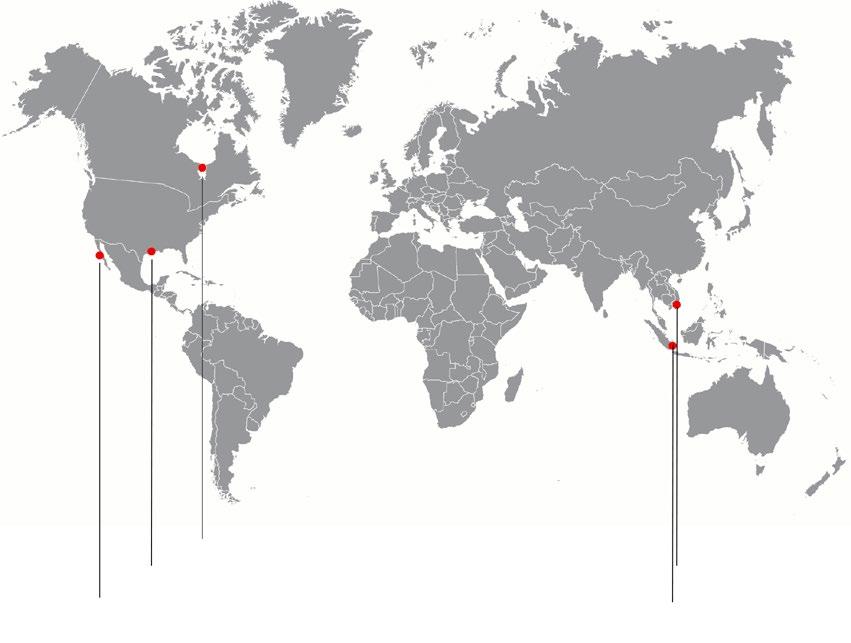
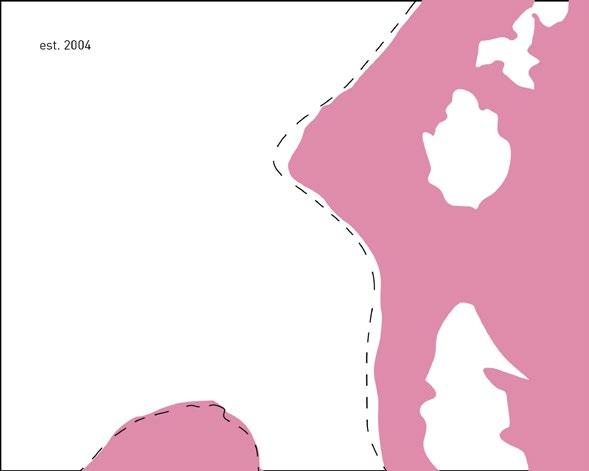
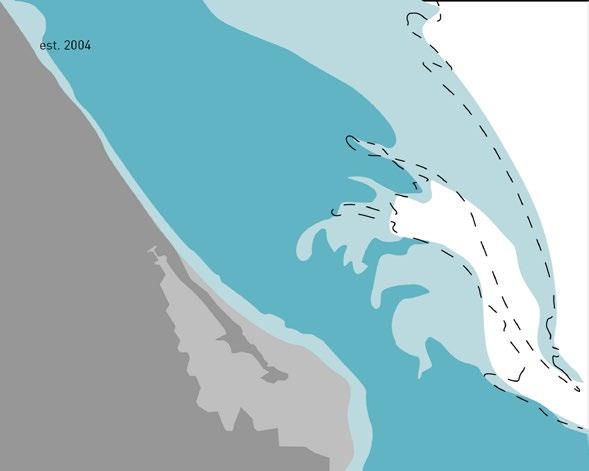
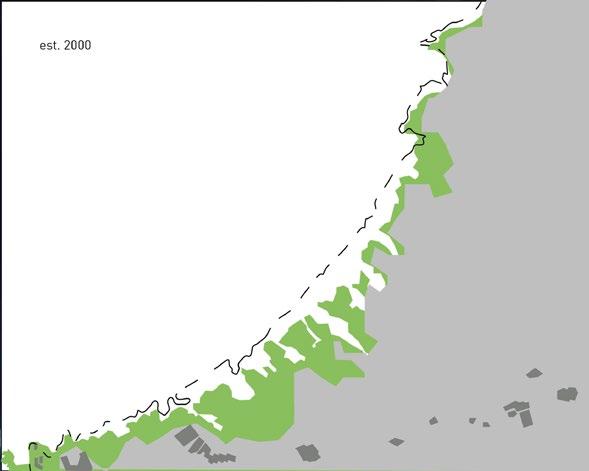
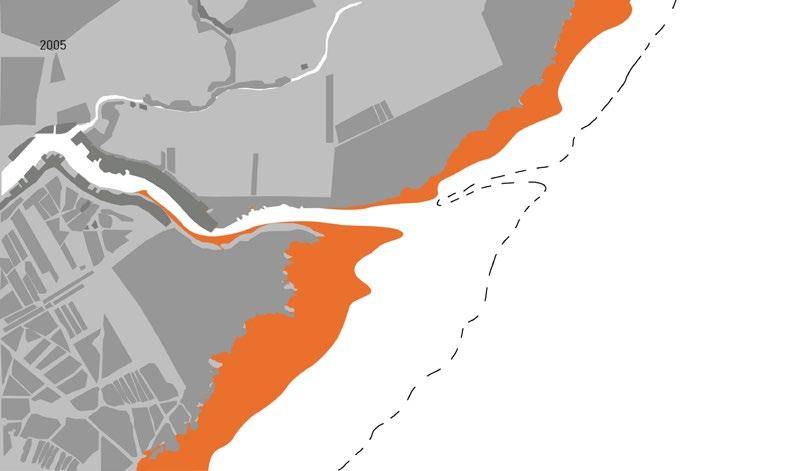
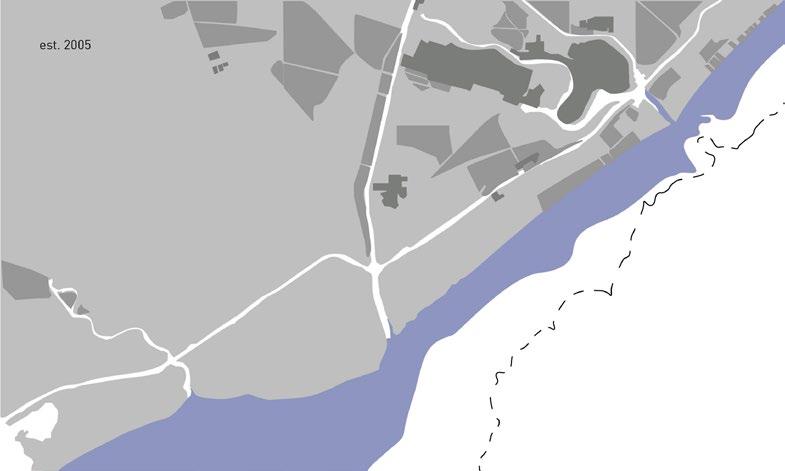
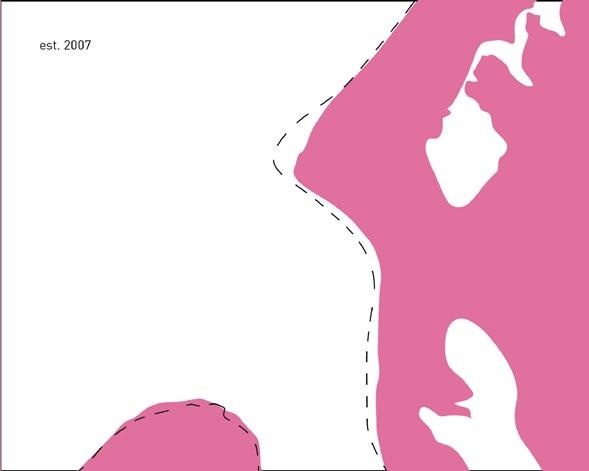
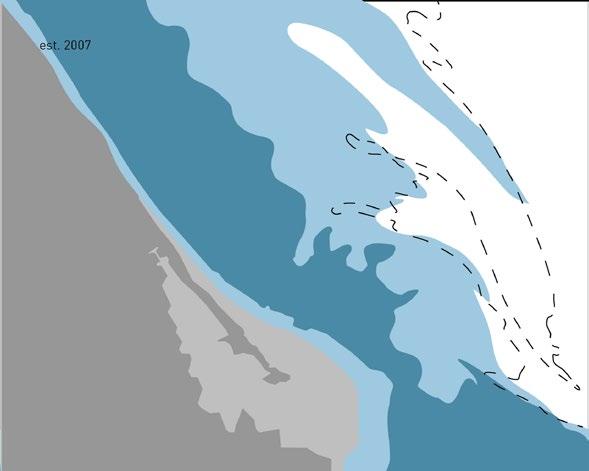
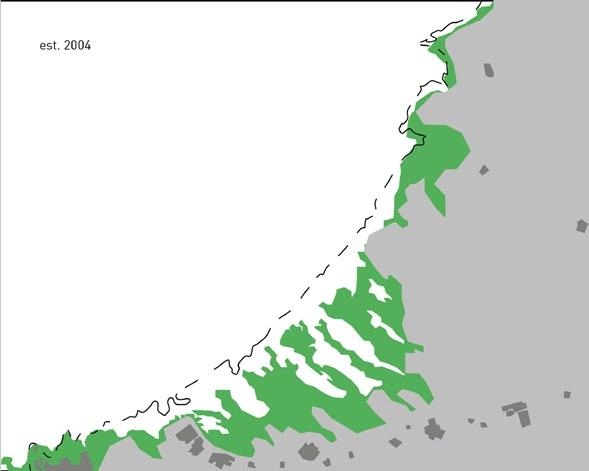
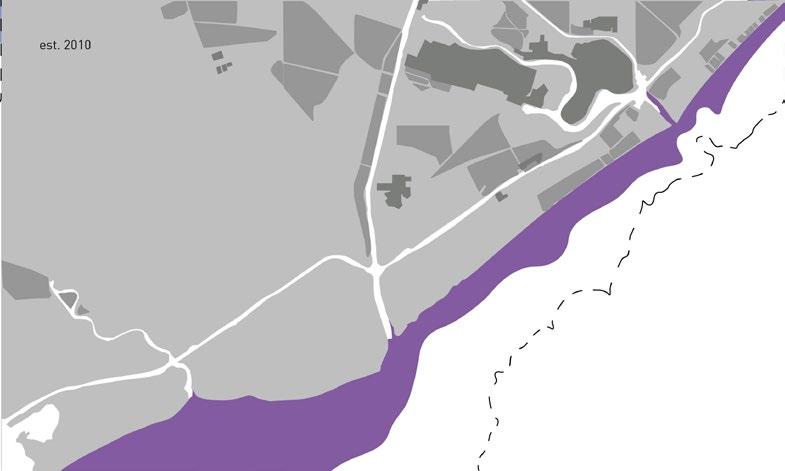
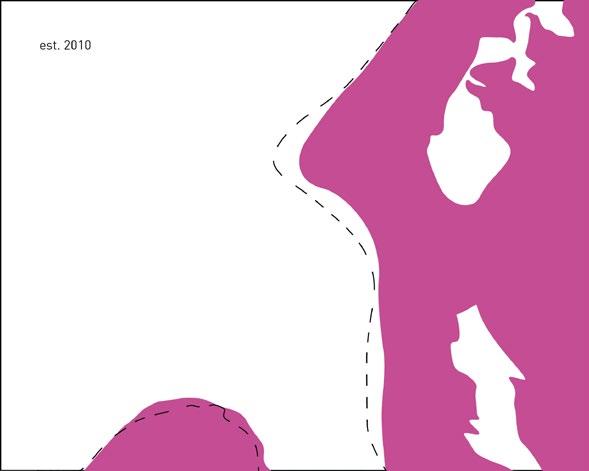
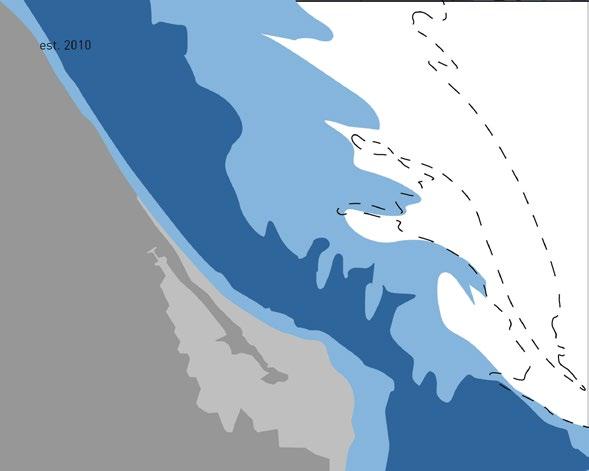
Timeline of coastline erosion at 5 global hotspots, made in InDesign
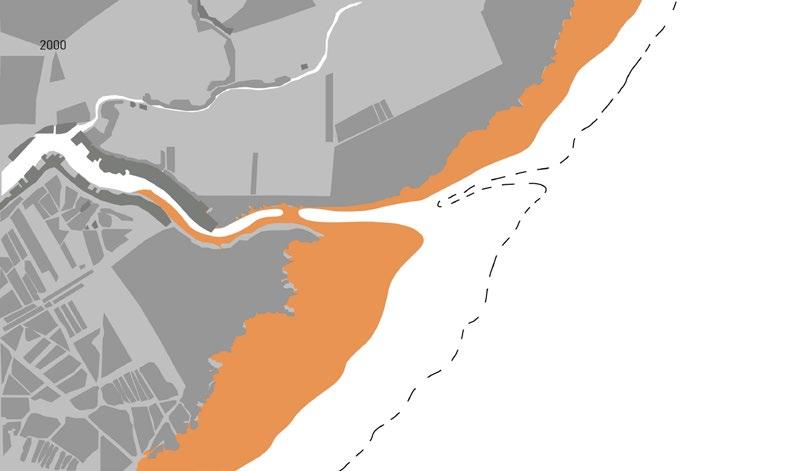
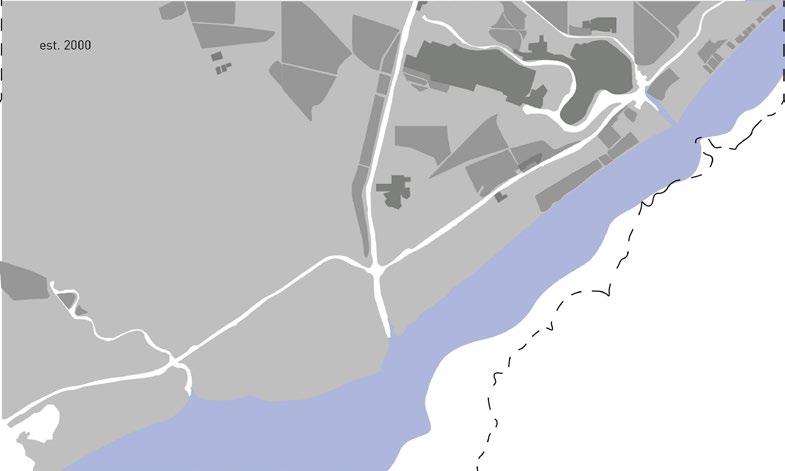
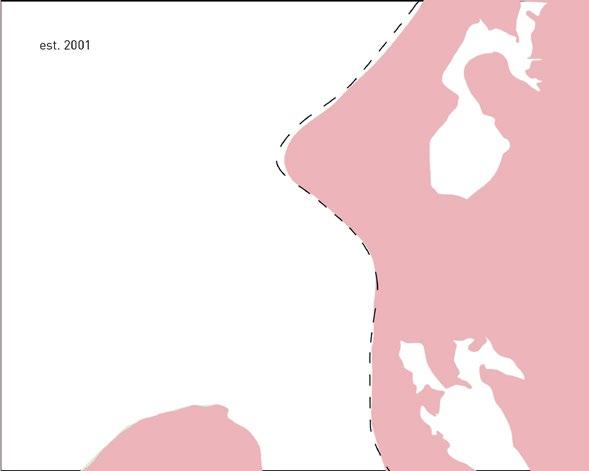
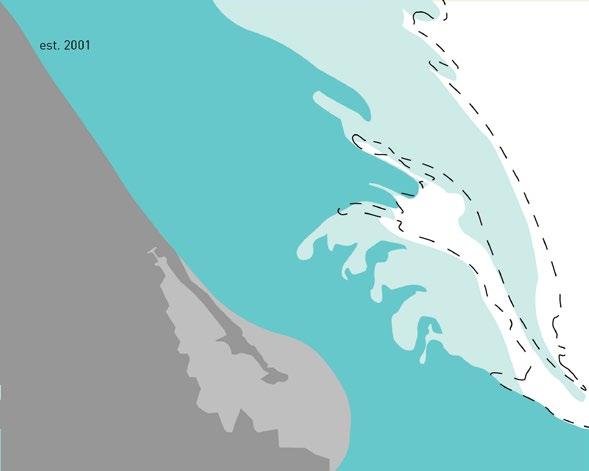
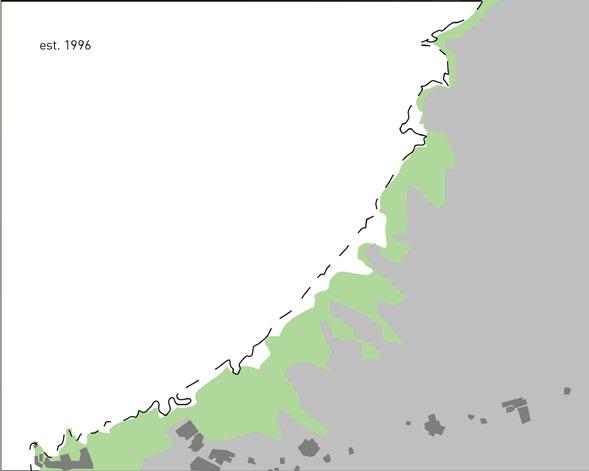
This visualization was made by collecting Google Earth Engine images, provided by researchers Luijendijk et. al.* for the Scientific Report journal, and documenting each coastline over the documented years
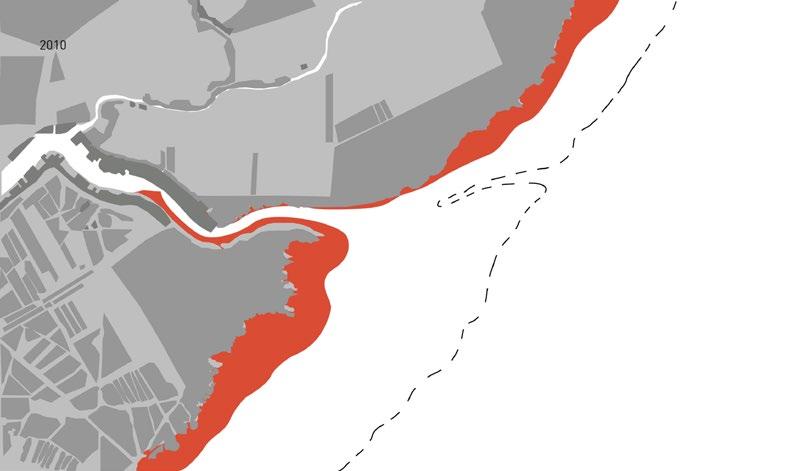
Sand is the second-most used natural resource in the world after water; it is vital to the production of concrete, glass, silicon chips, and more essential products of the modern world. Desert sand doesn’t work, the grains are too smooth, it’s the ocean and river sands that are
scarce and valuable; and humans are mining it at a rate far faster than the earth can replenish. The exploitation of sandbeds is reaching a critical state, eroding away at coastlines and riverbeds, destroying ecosystems, urban infrastructure, and ocean resilience.
*
Sci Rep 8, 6641 (2018). https://doi.org/10.1038/s41598-018-24630-6
ARCH 487
Revit
This group project tasked us with designing a fire station, with given parameters, entirely in Revit; familiarizing us with BIM processes. We collaborated on the initial design of the station, and then individually created pages and drawings. Including these drawings, I contributed the second-floor plan, North elevation, two furniture families, and one profile family.
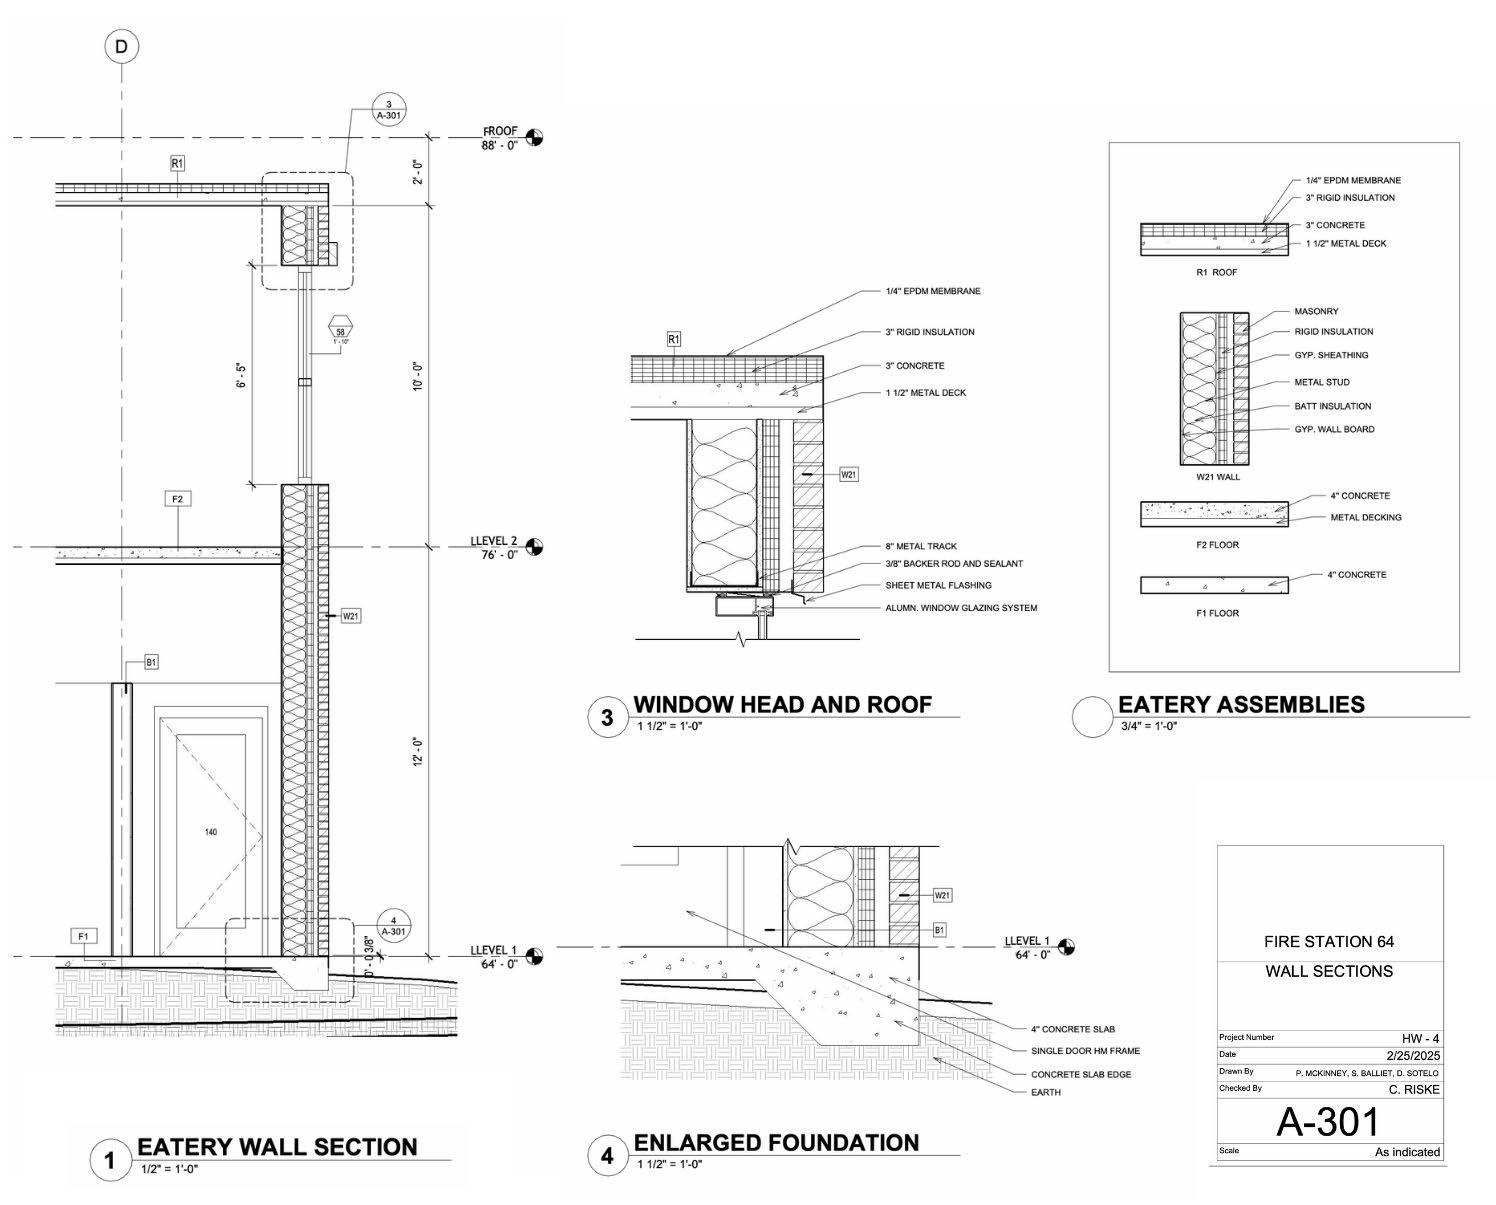
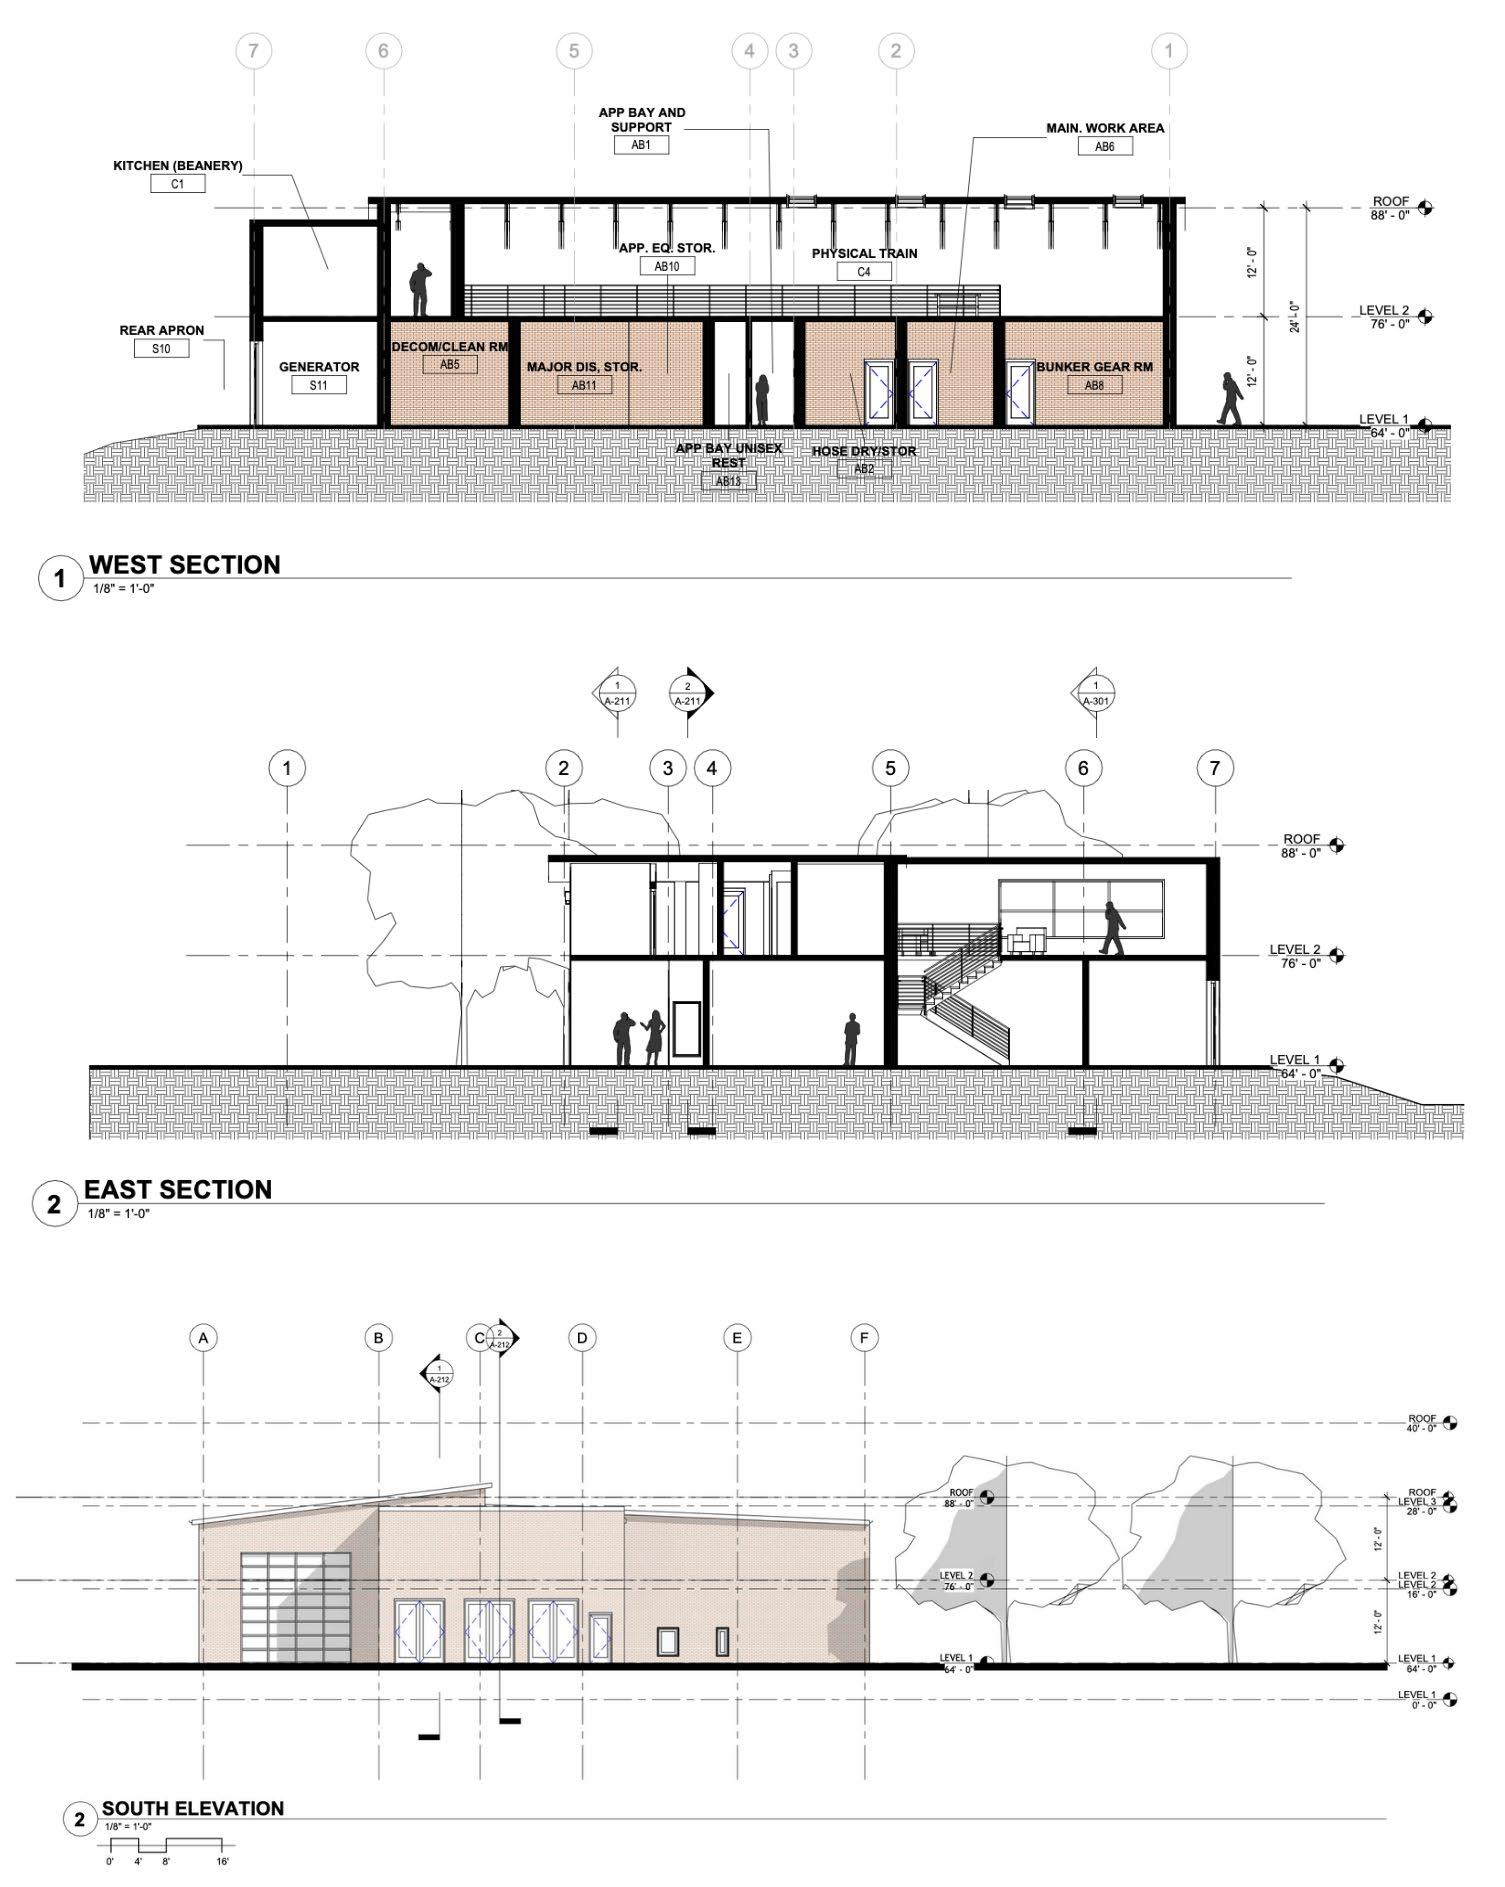
Sections and elevation, made by myself
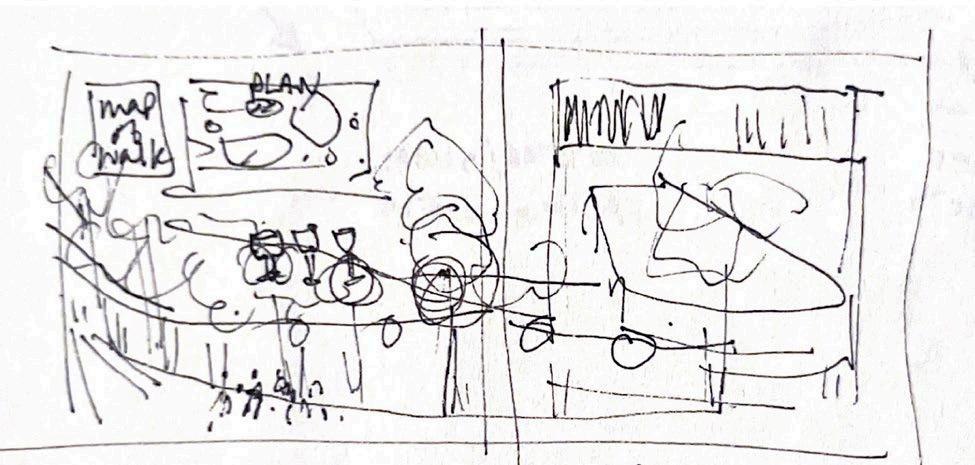
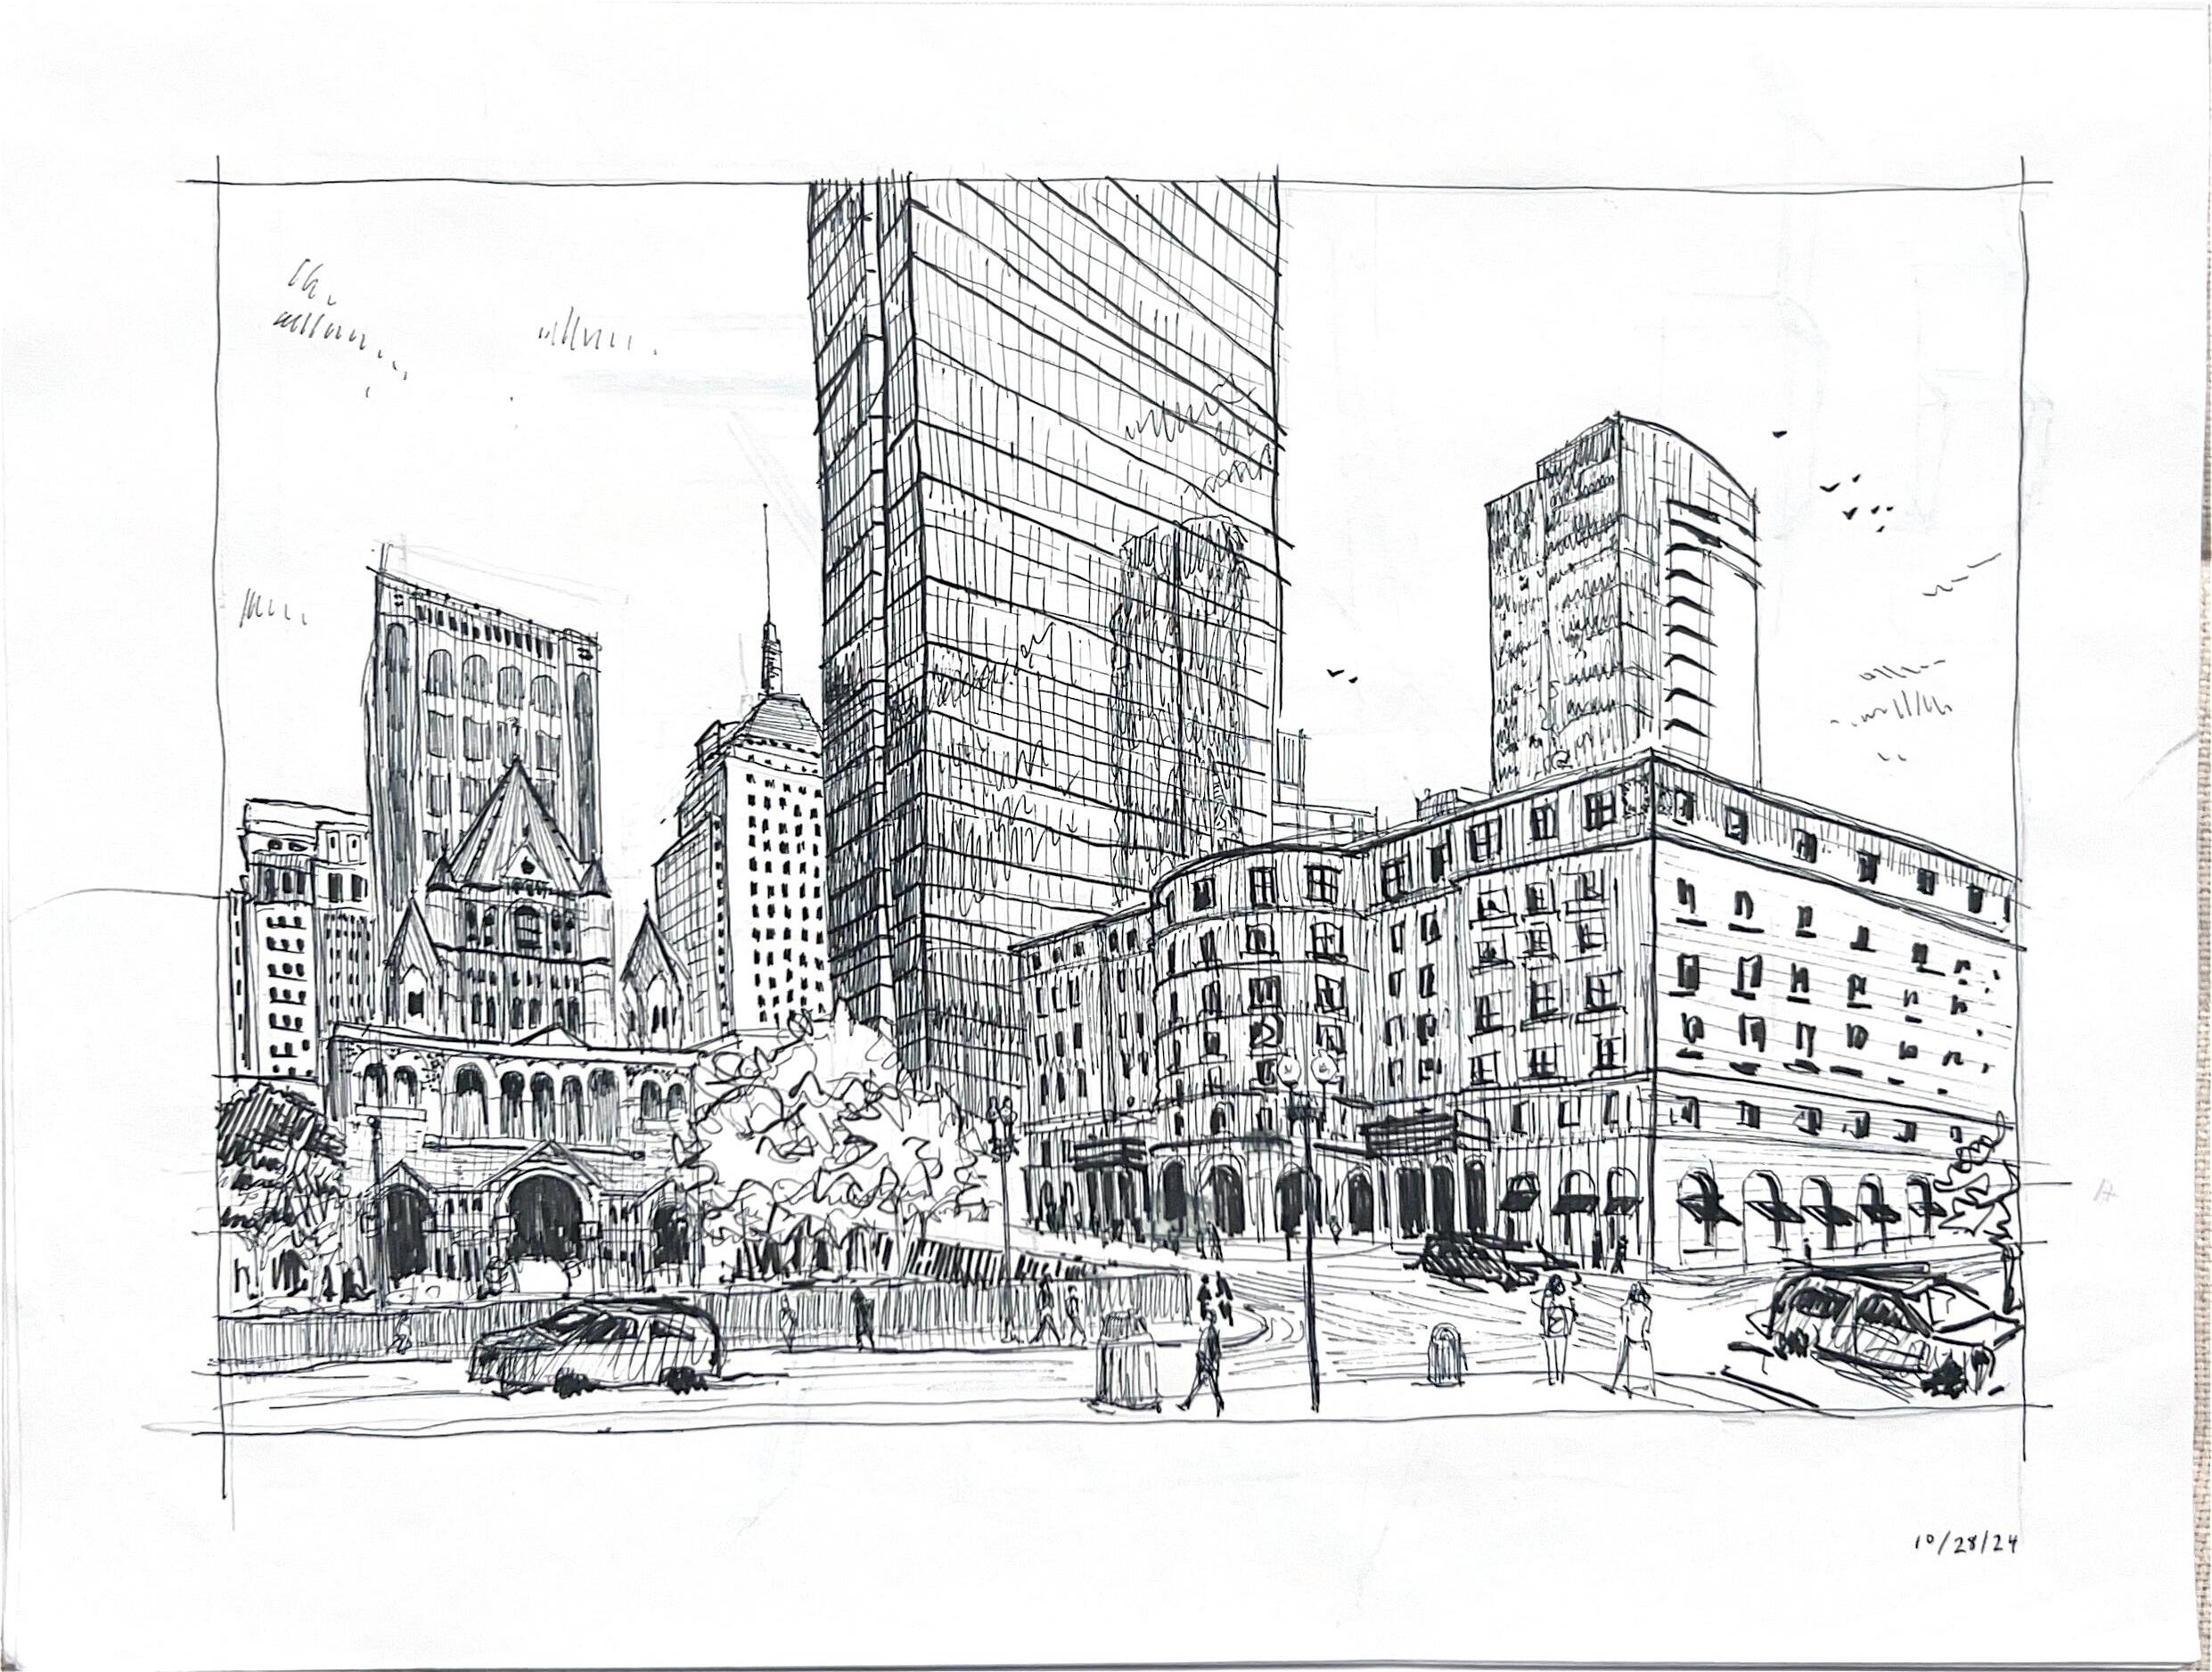
ARCH 415 Pen on paper
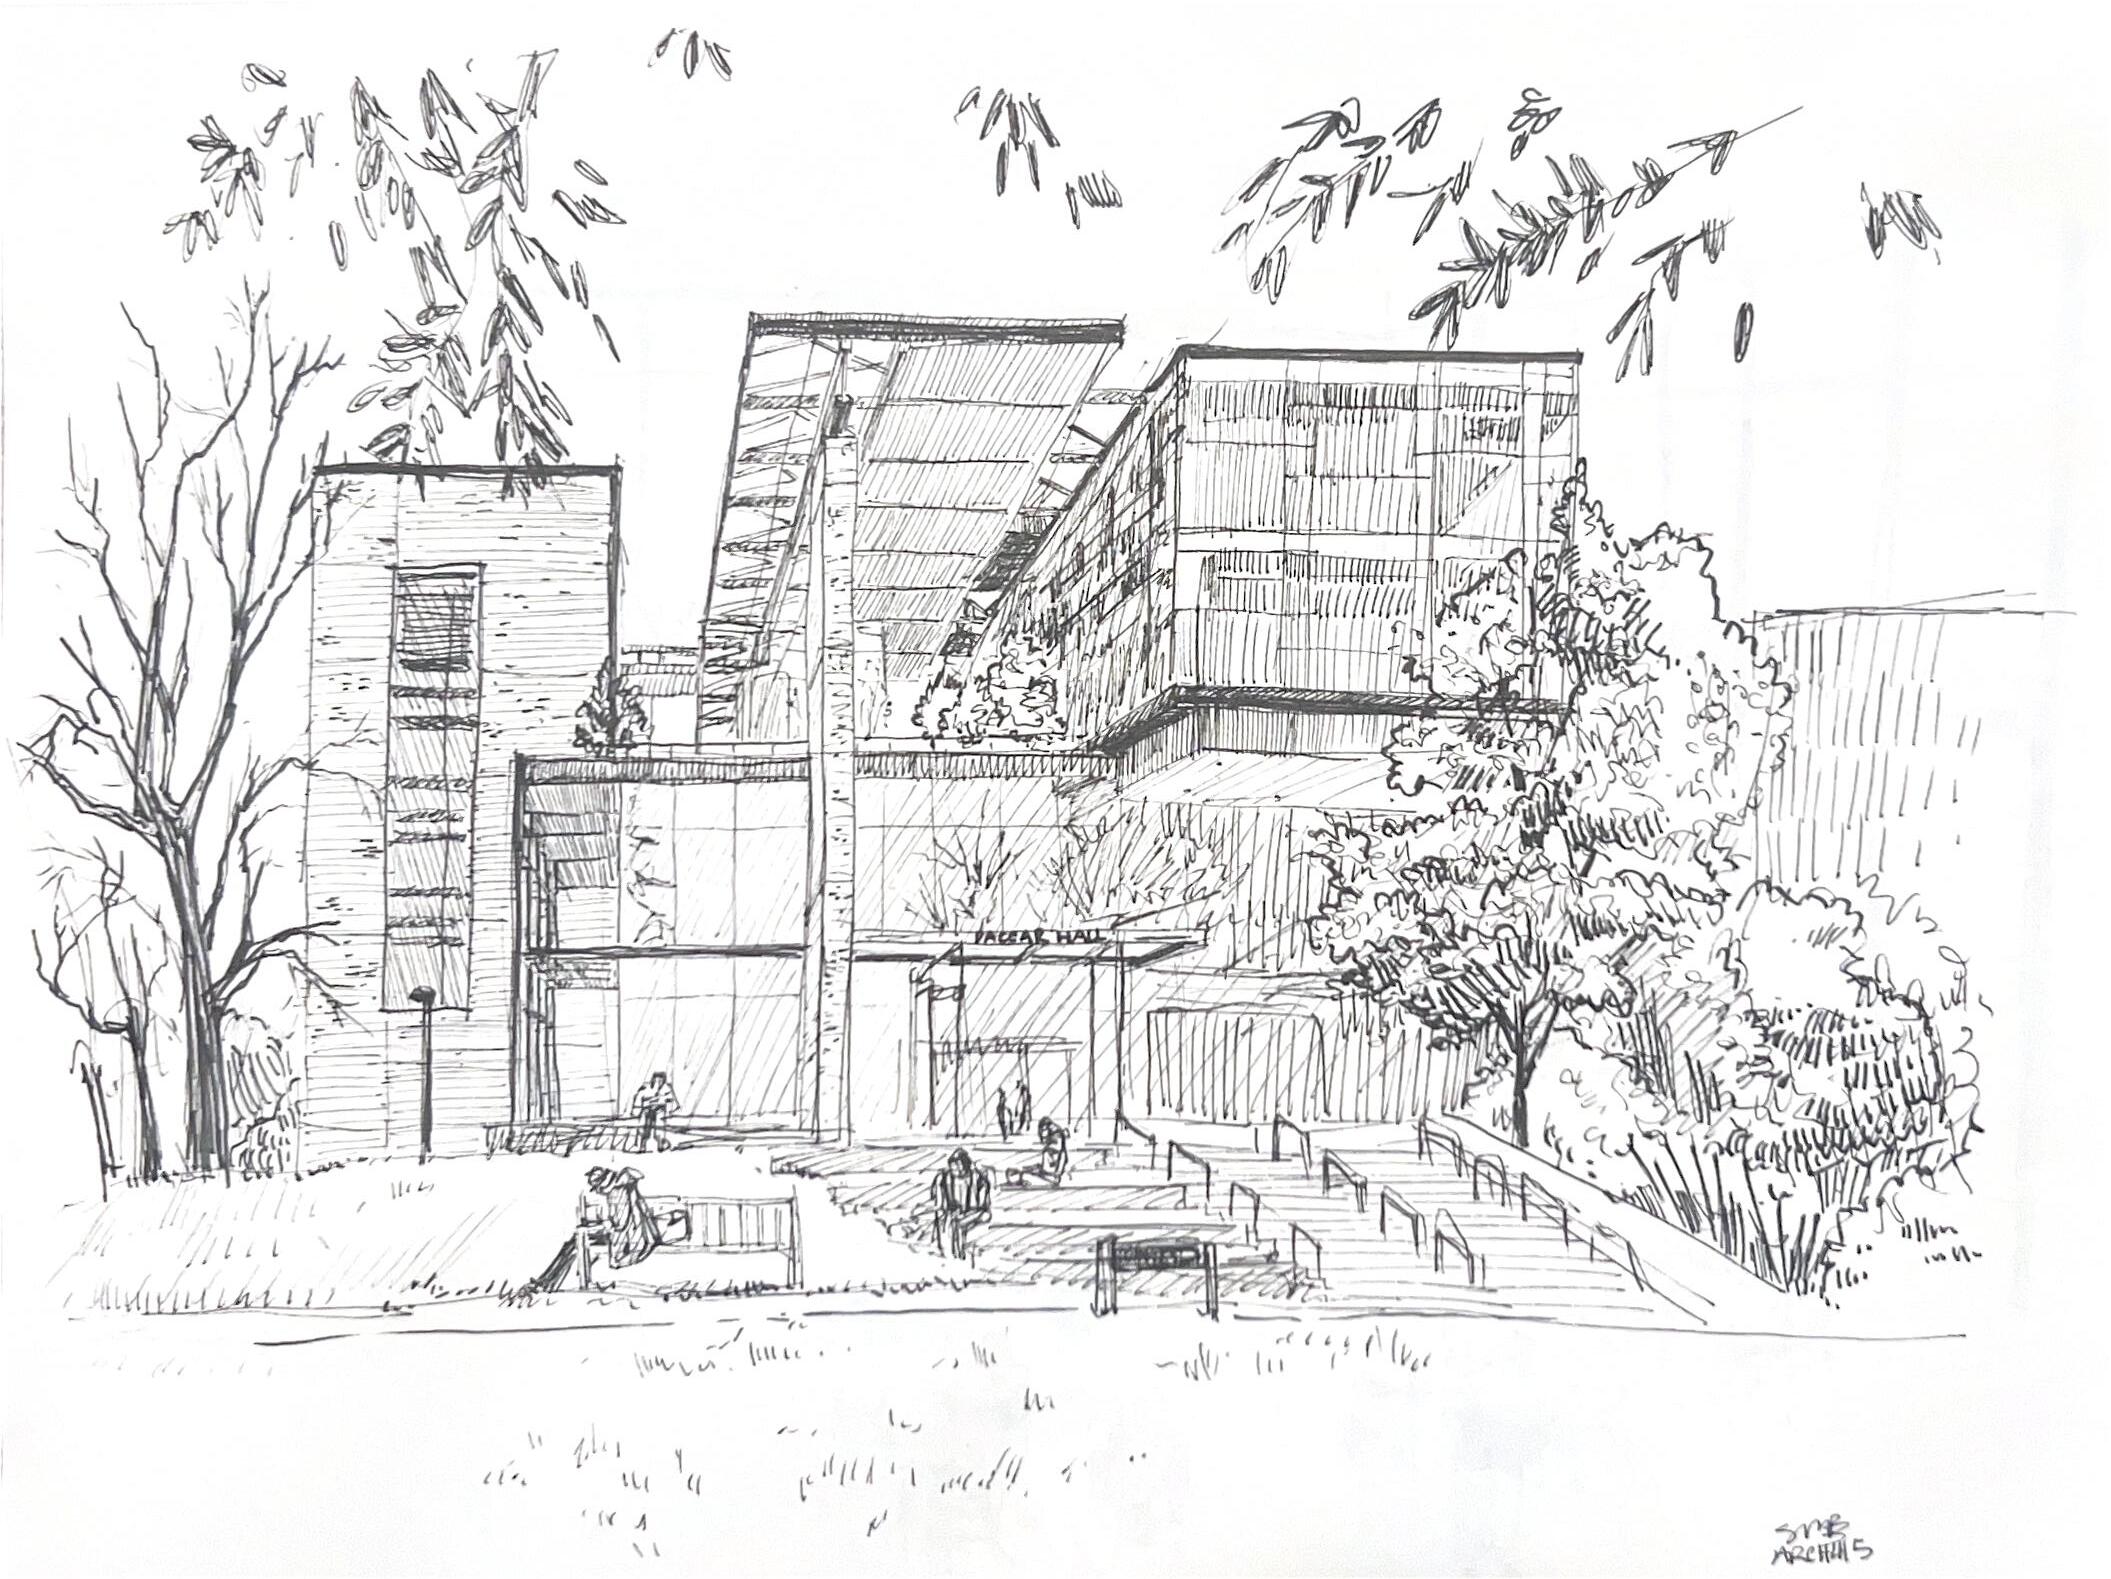
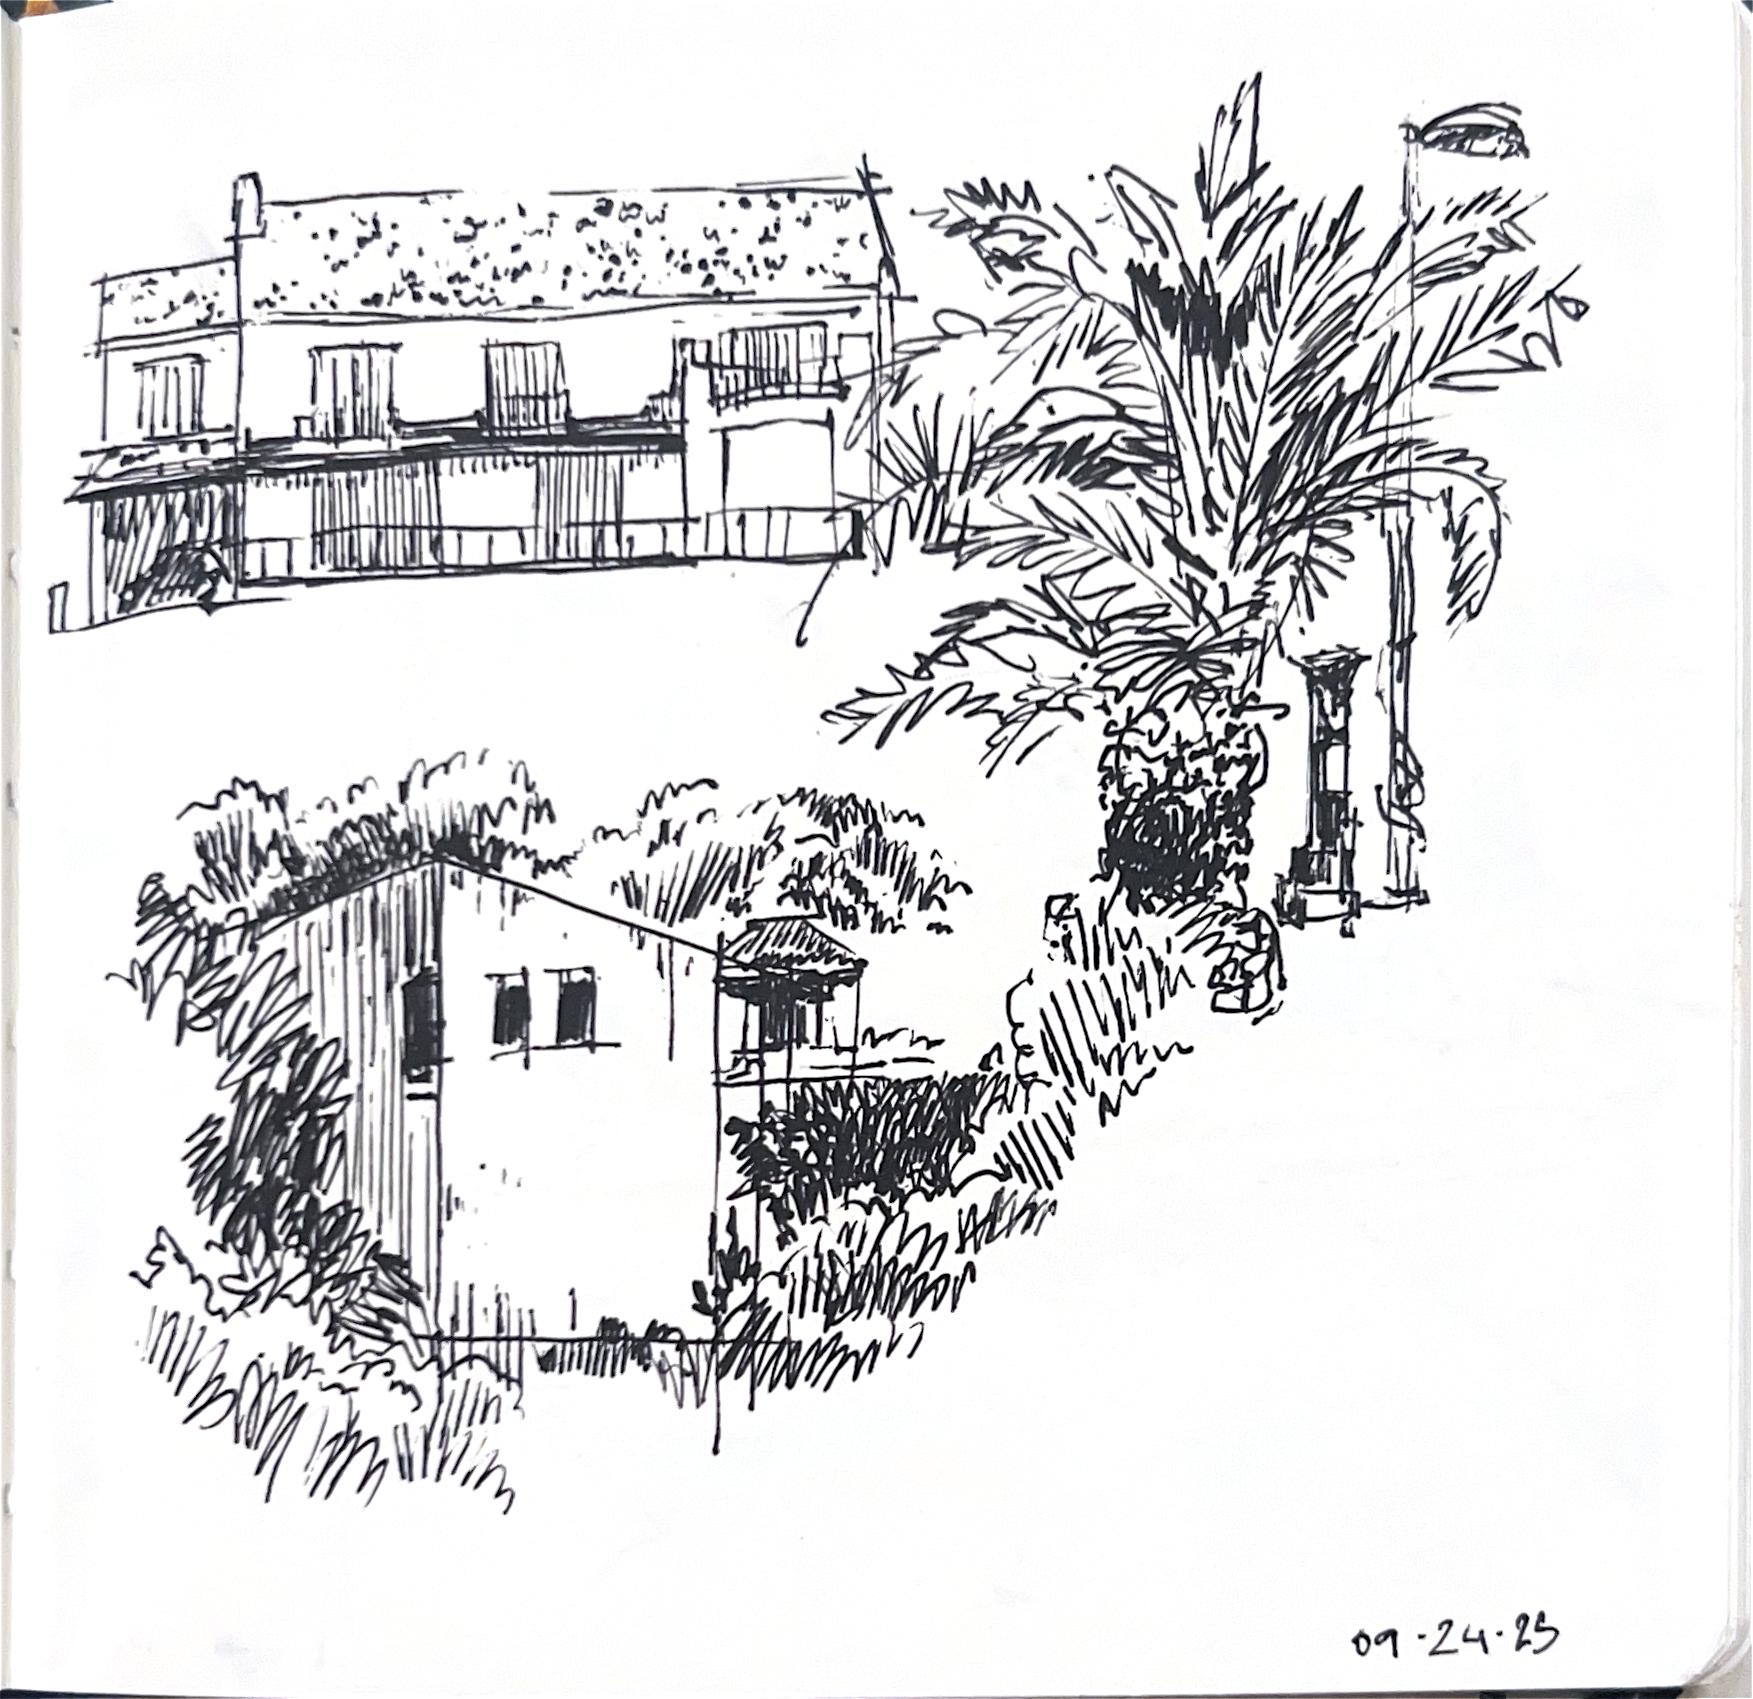
This course strengthened my technical drawing skills. Measuring my subject with my pen, marking down proper persepctive and proportions, 2-point nd using thumbnail sketches to create a compelling composition. Then going in and adding scale figures, vegetation, and details to complete the scene.
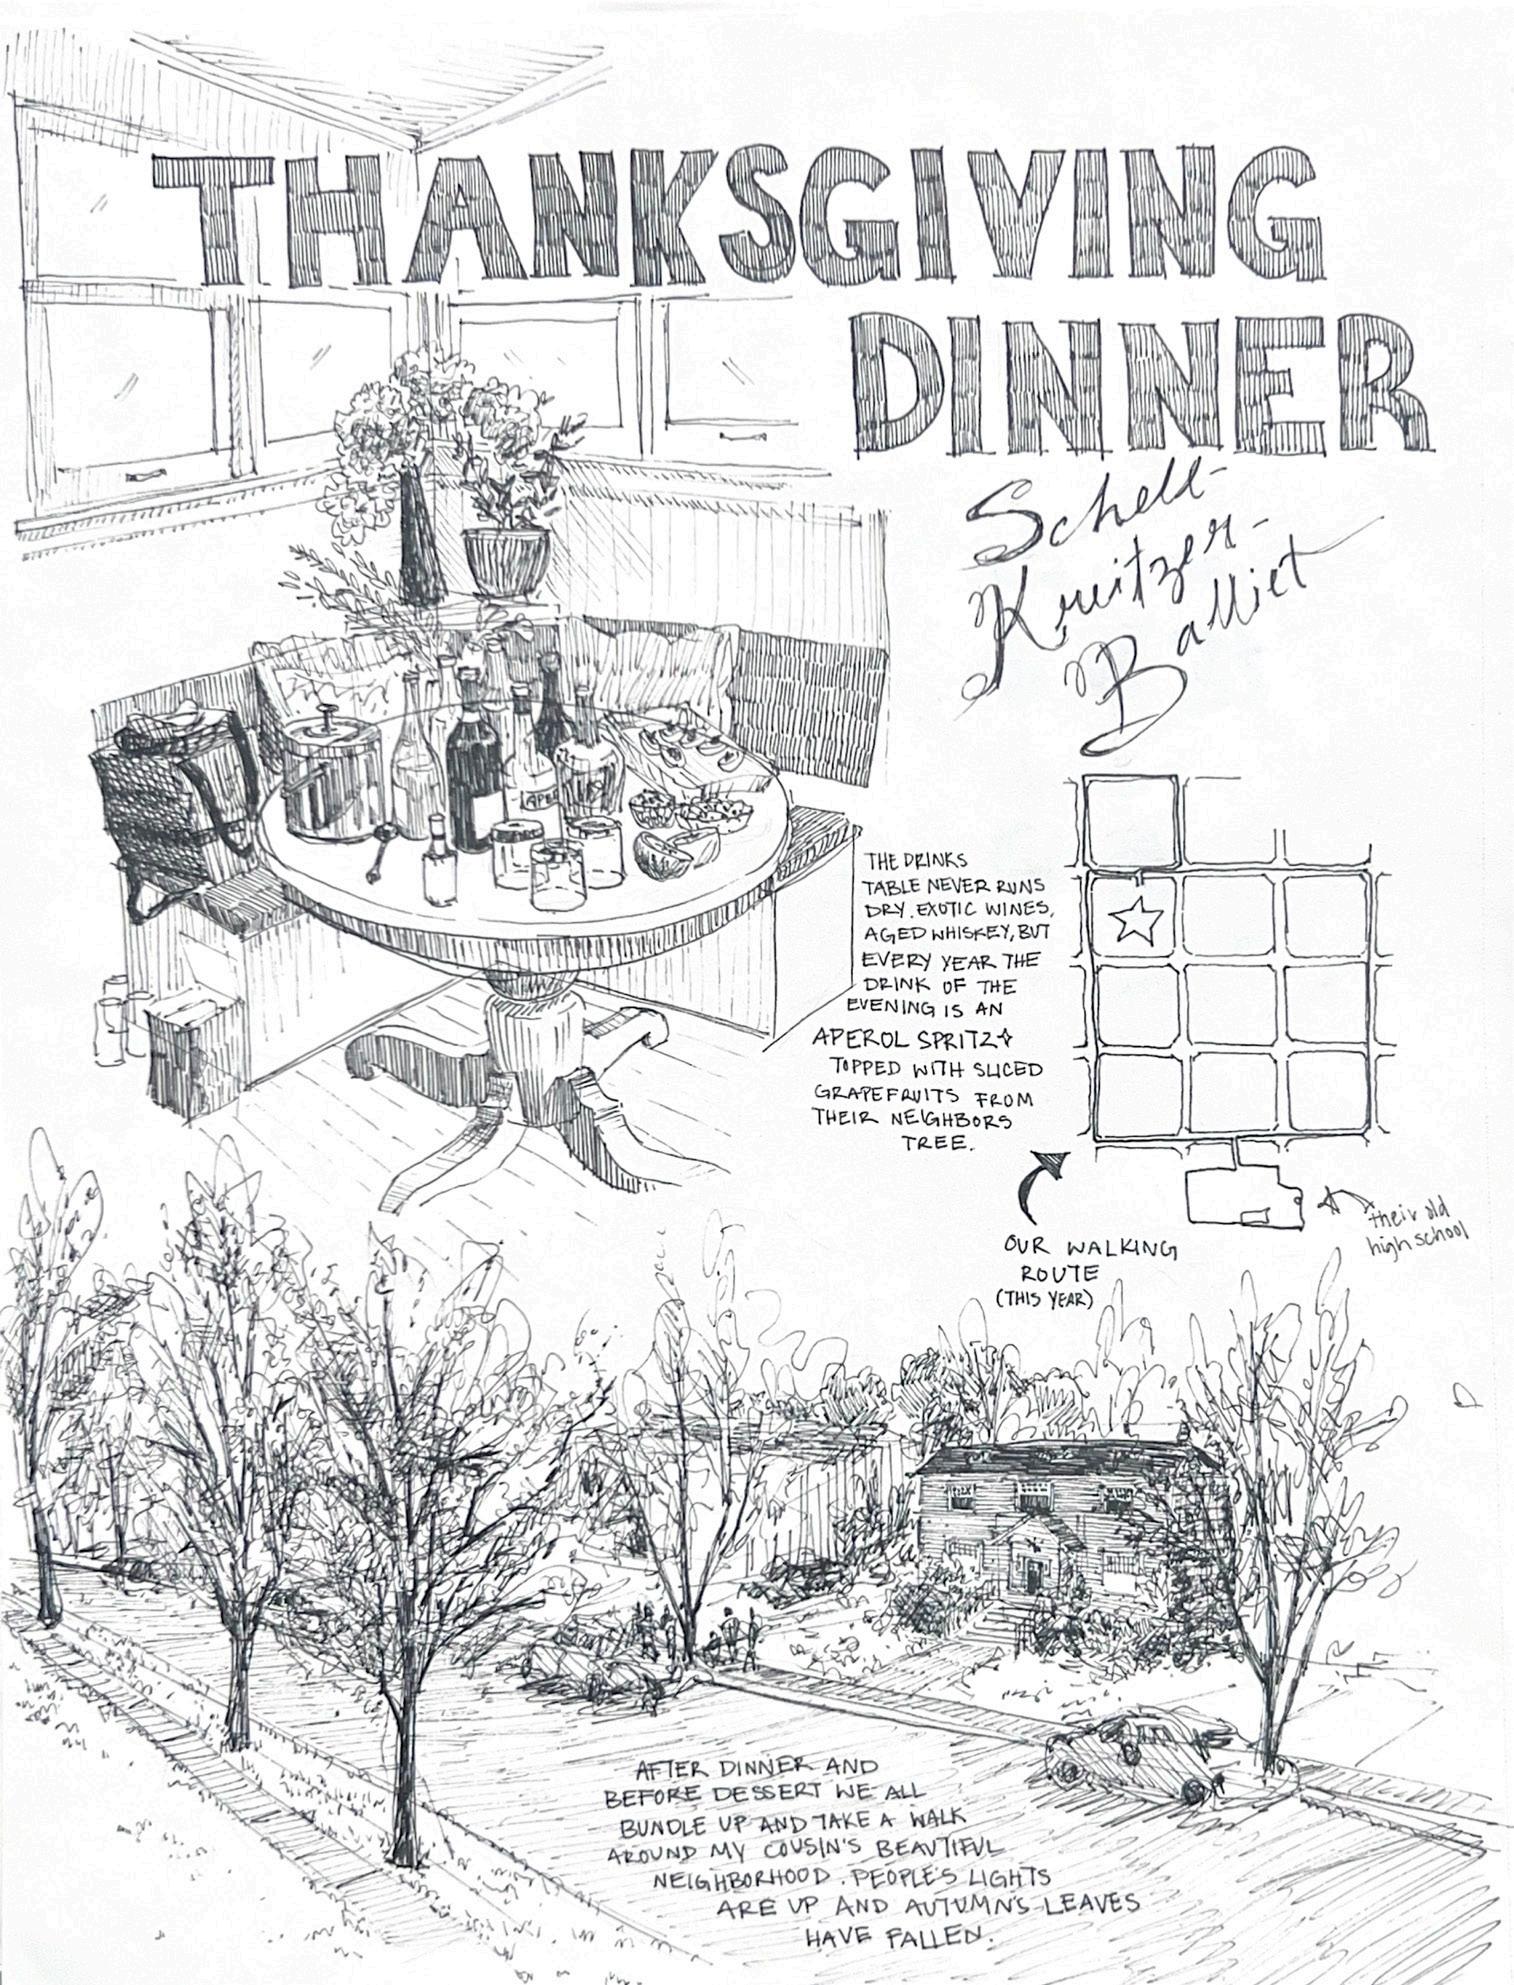
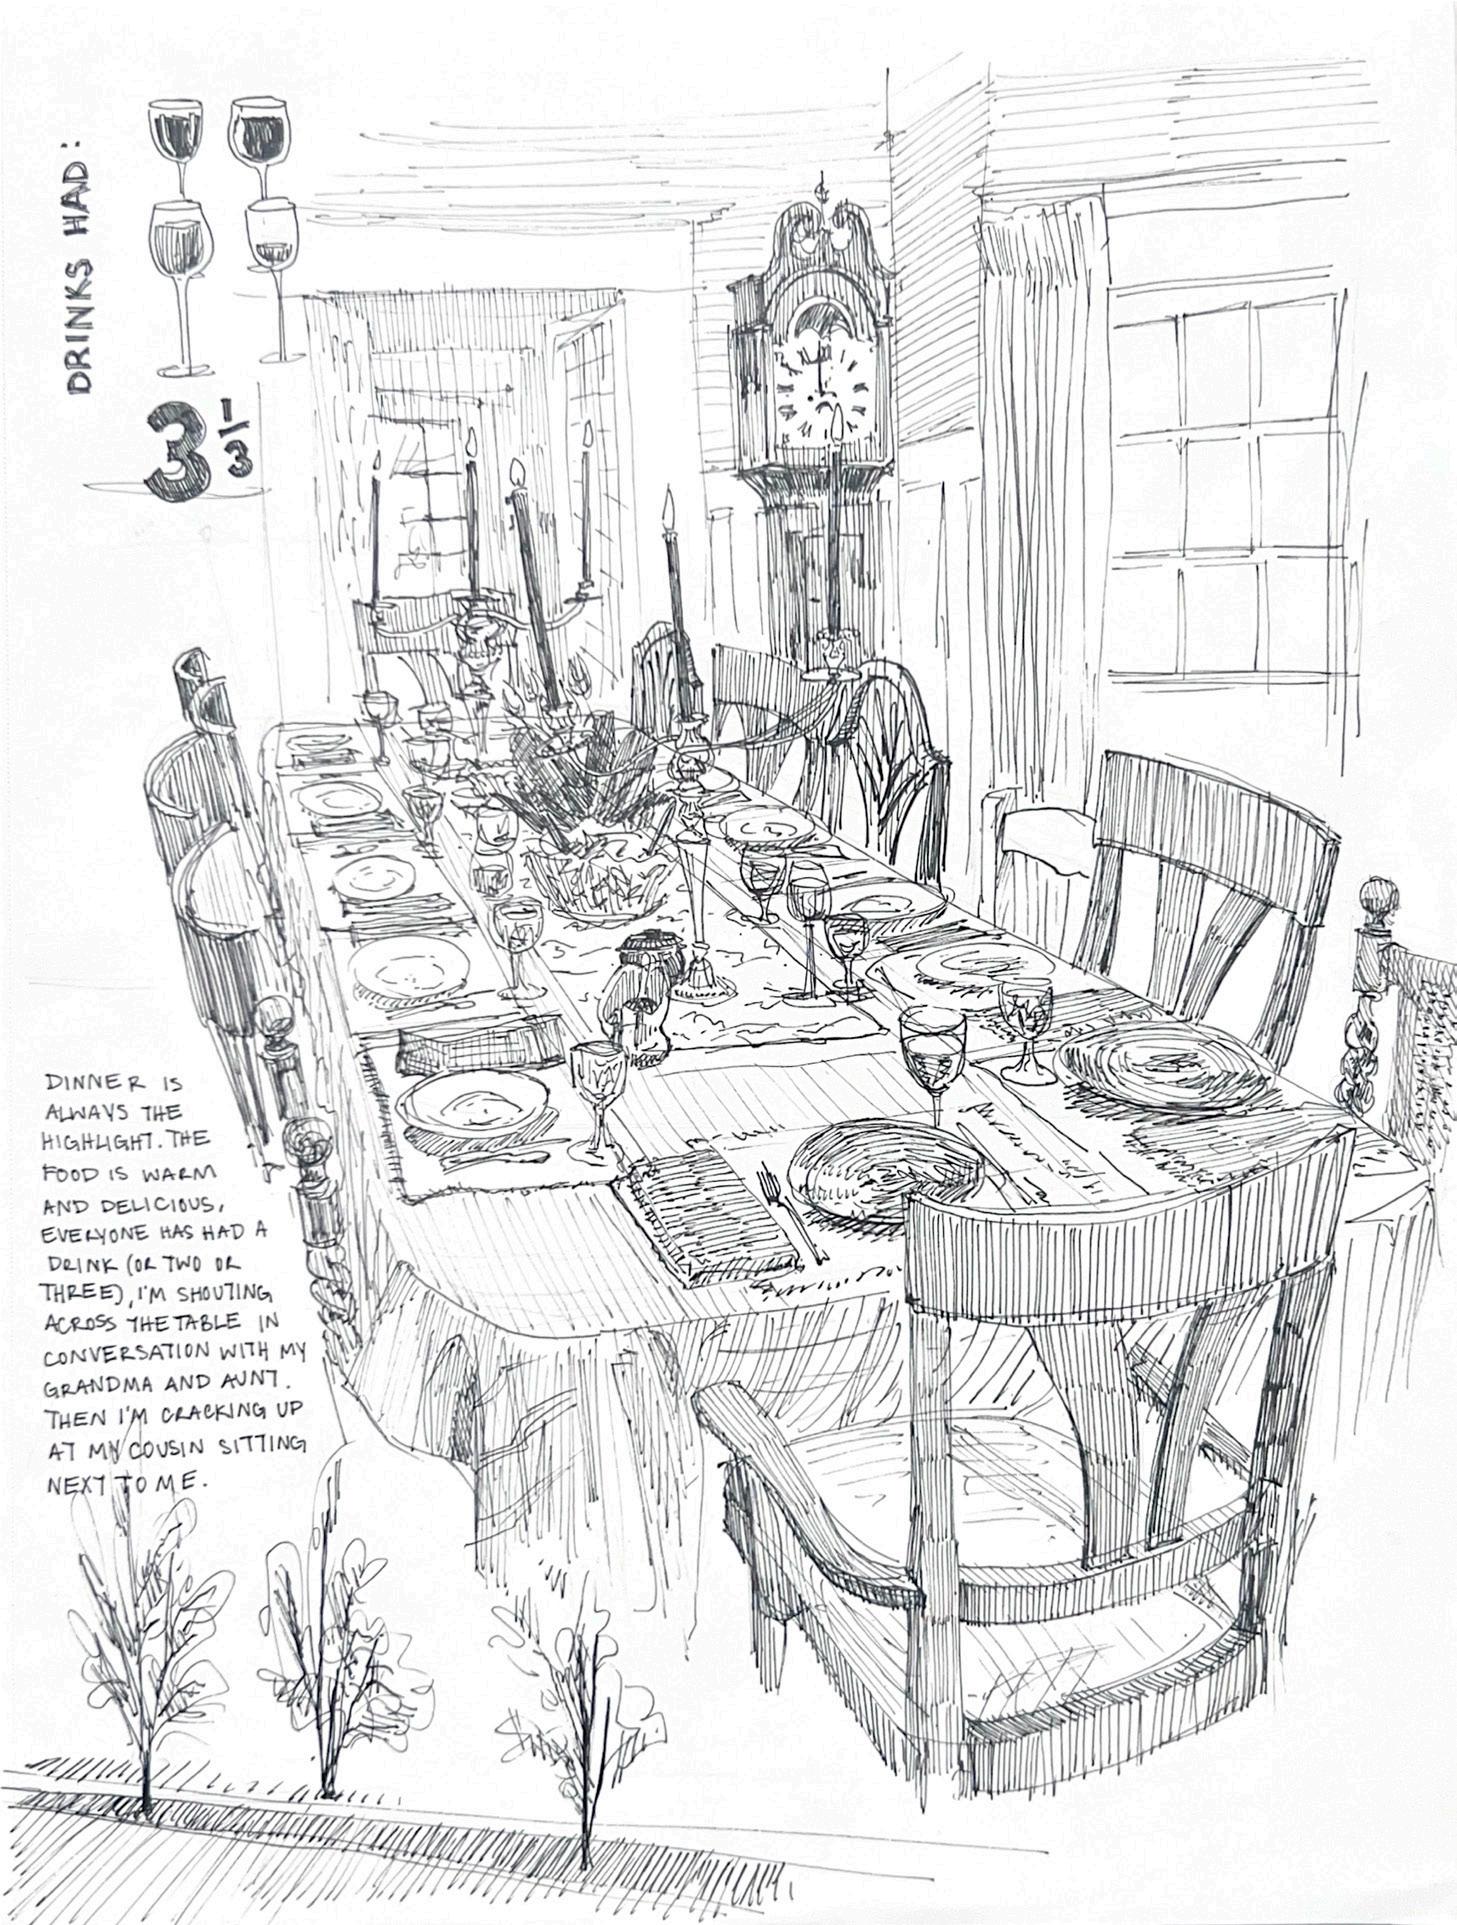
The culminating project of this course was to document an event. I chose my family’s annual Thanksgiving dinner. I blocked out my layout, basic shapes and shading while dinner was getting finished up, and added extra details the following day. I chose to draw my favorite elements of dinner; the ones I’d want to remember.
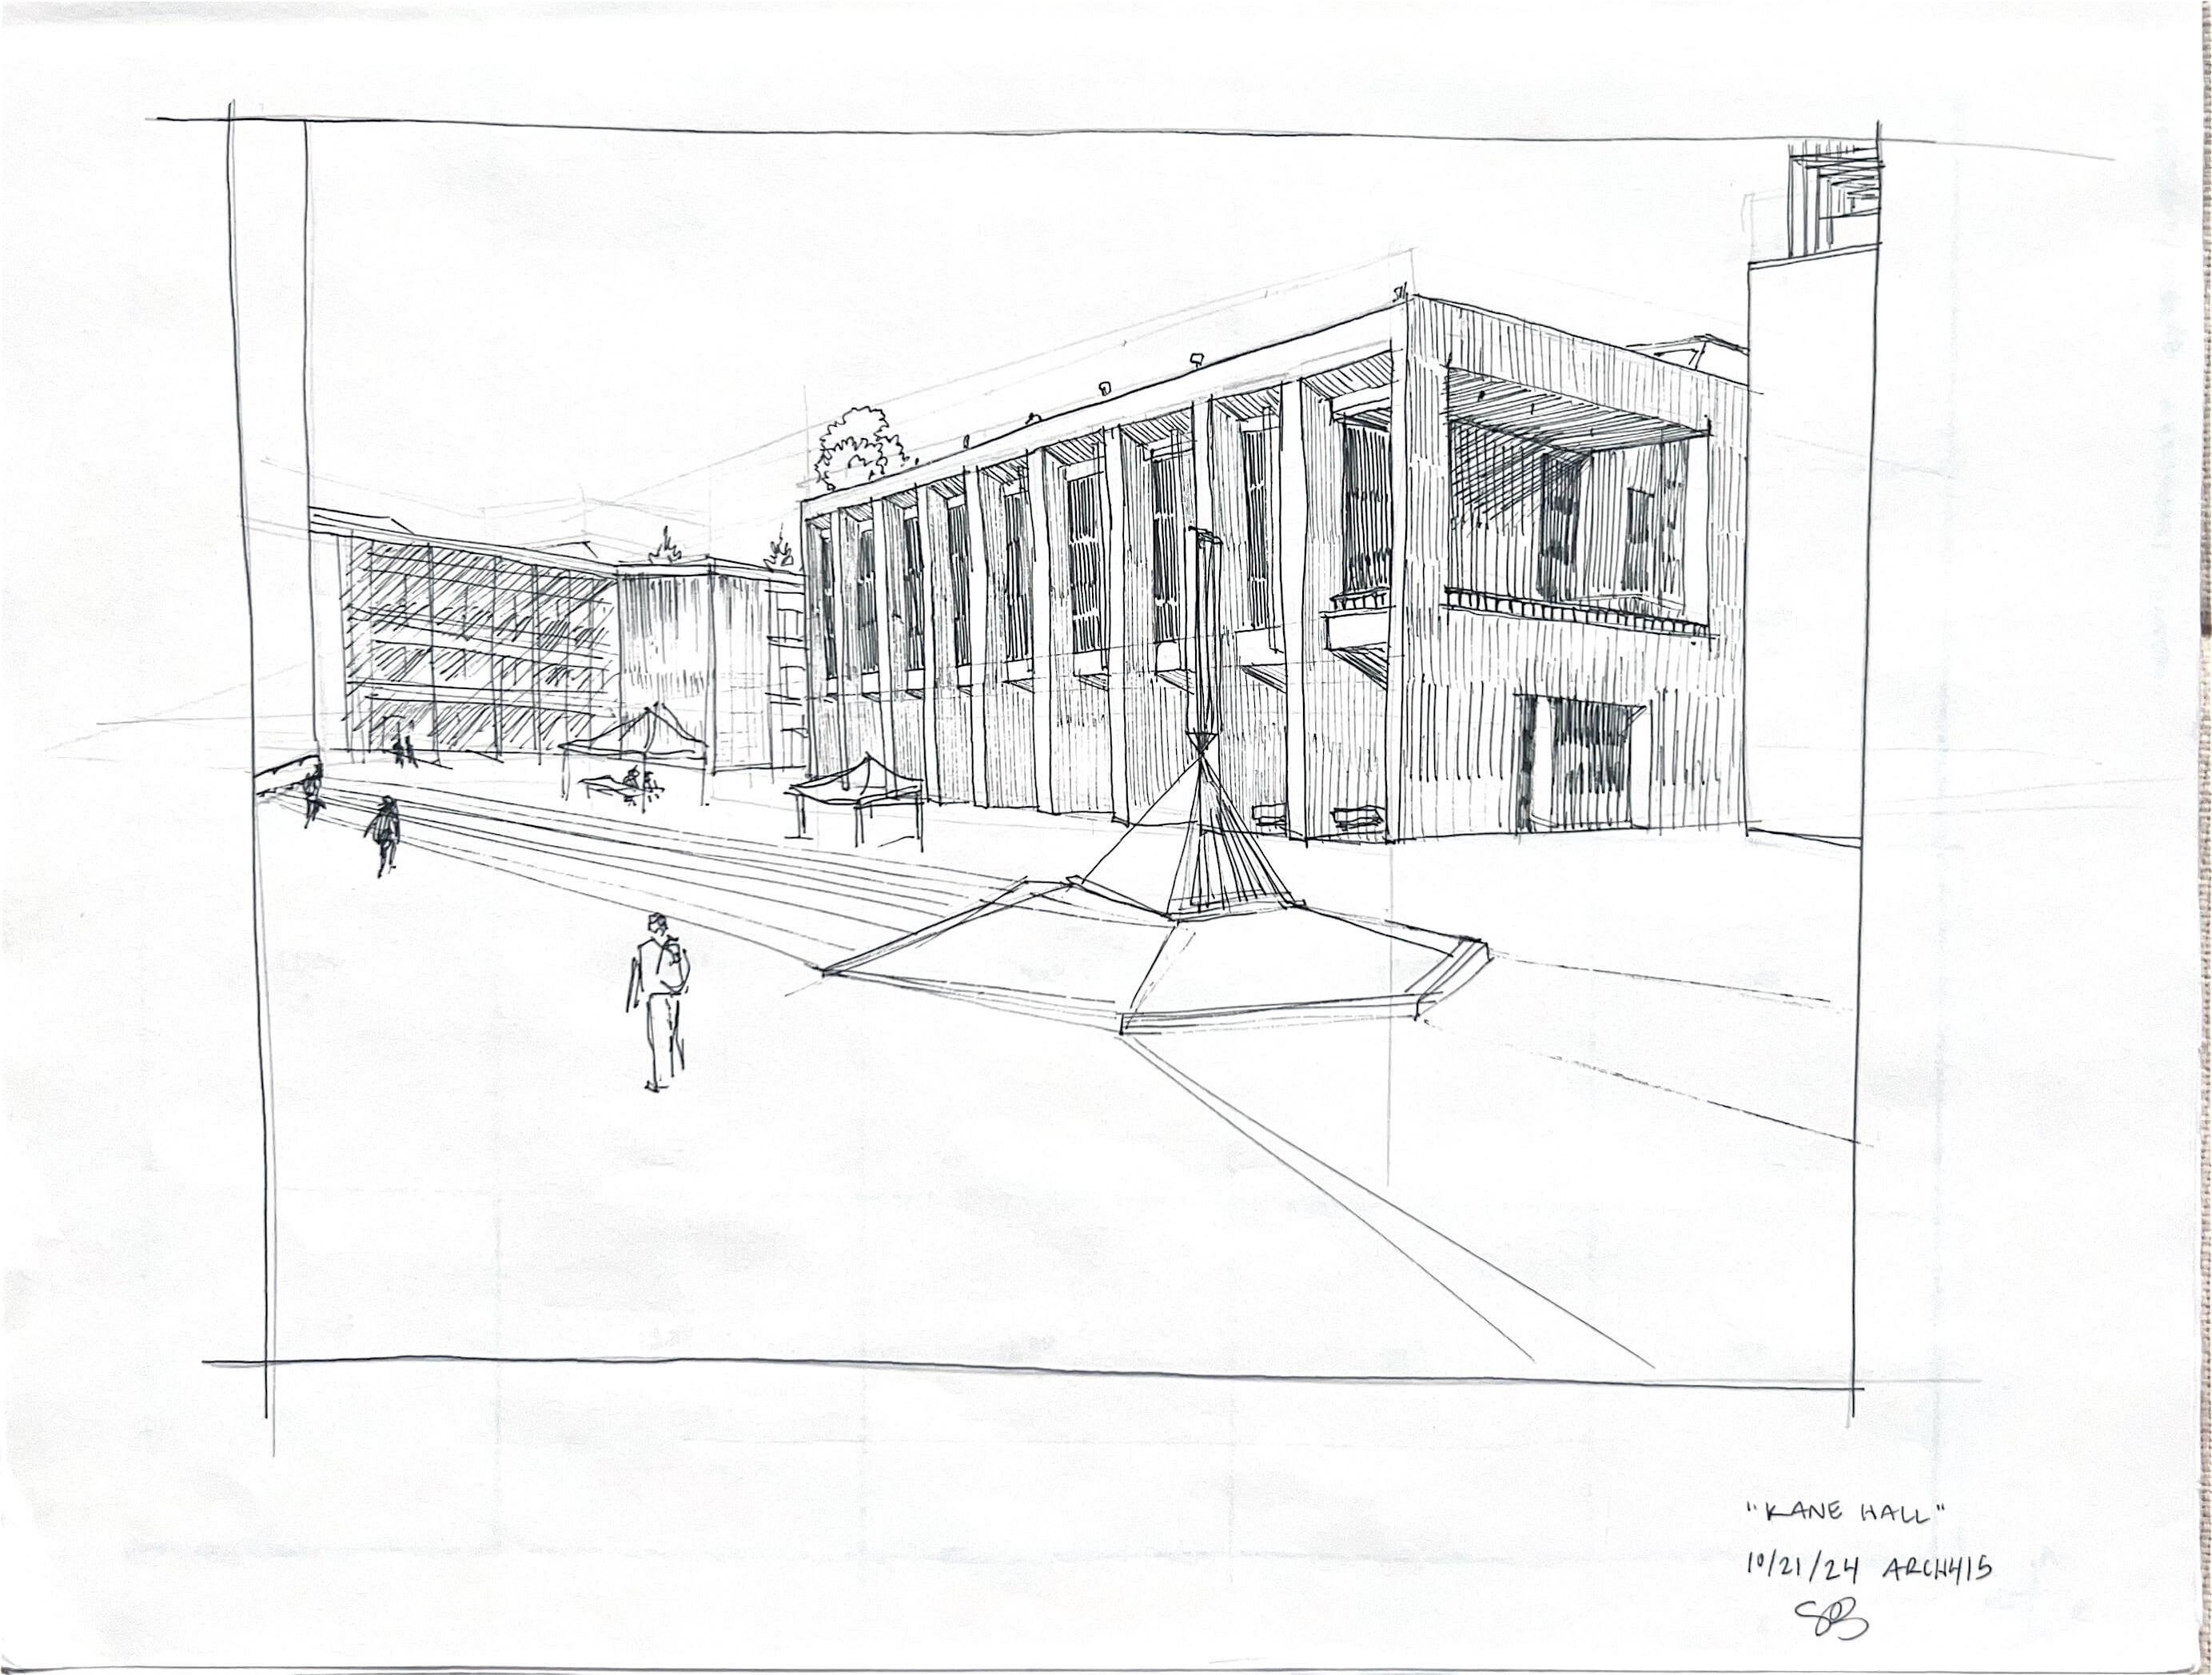
Kane Hall, UW Campus, Seattle, WA