

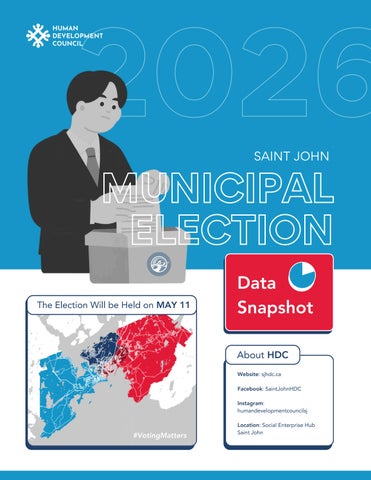

The Election Will be Held on MAY 11
For information on voting in the upcoming municipal election visit electionsnb.ca How Do I VOTE?
From the Elections NB home page:
To determine what ward you are voting in click on: Where do I Vote
To determine who your candidates are click: List of Candidates
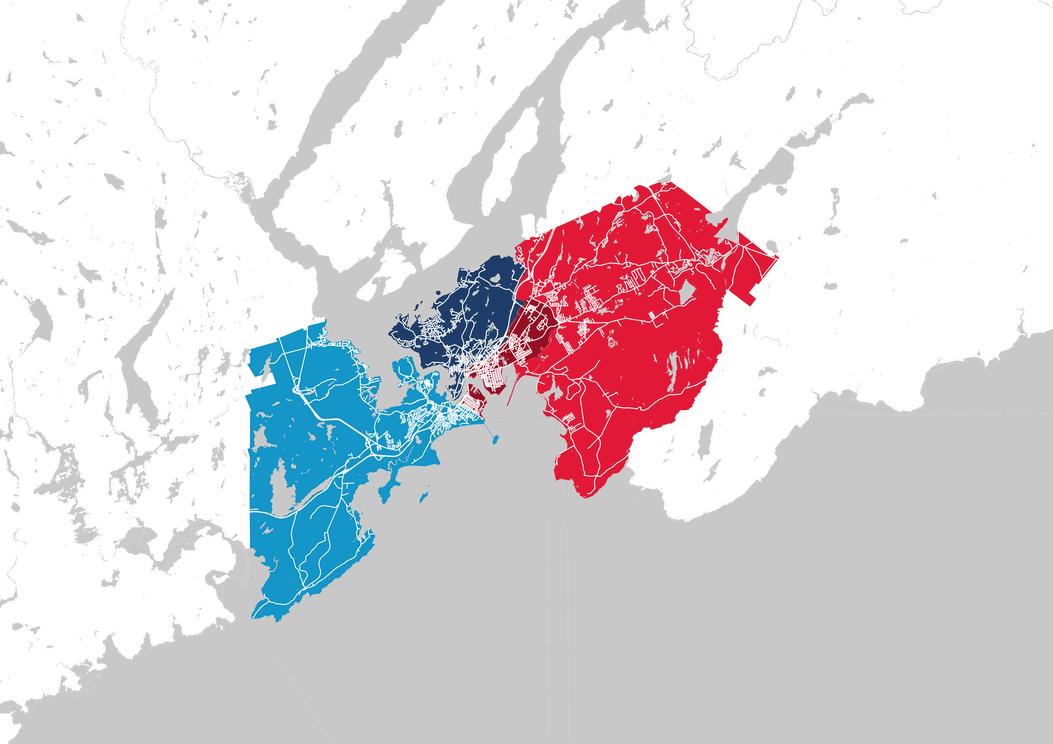
Ward 3
If you are a first time voter you will need ID containing your name, current address, and signature. Options include: drivers license, lease agreements, utility bills, etc. Or a friend already on the voters list who will take an oath to vouch for you
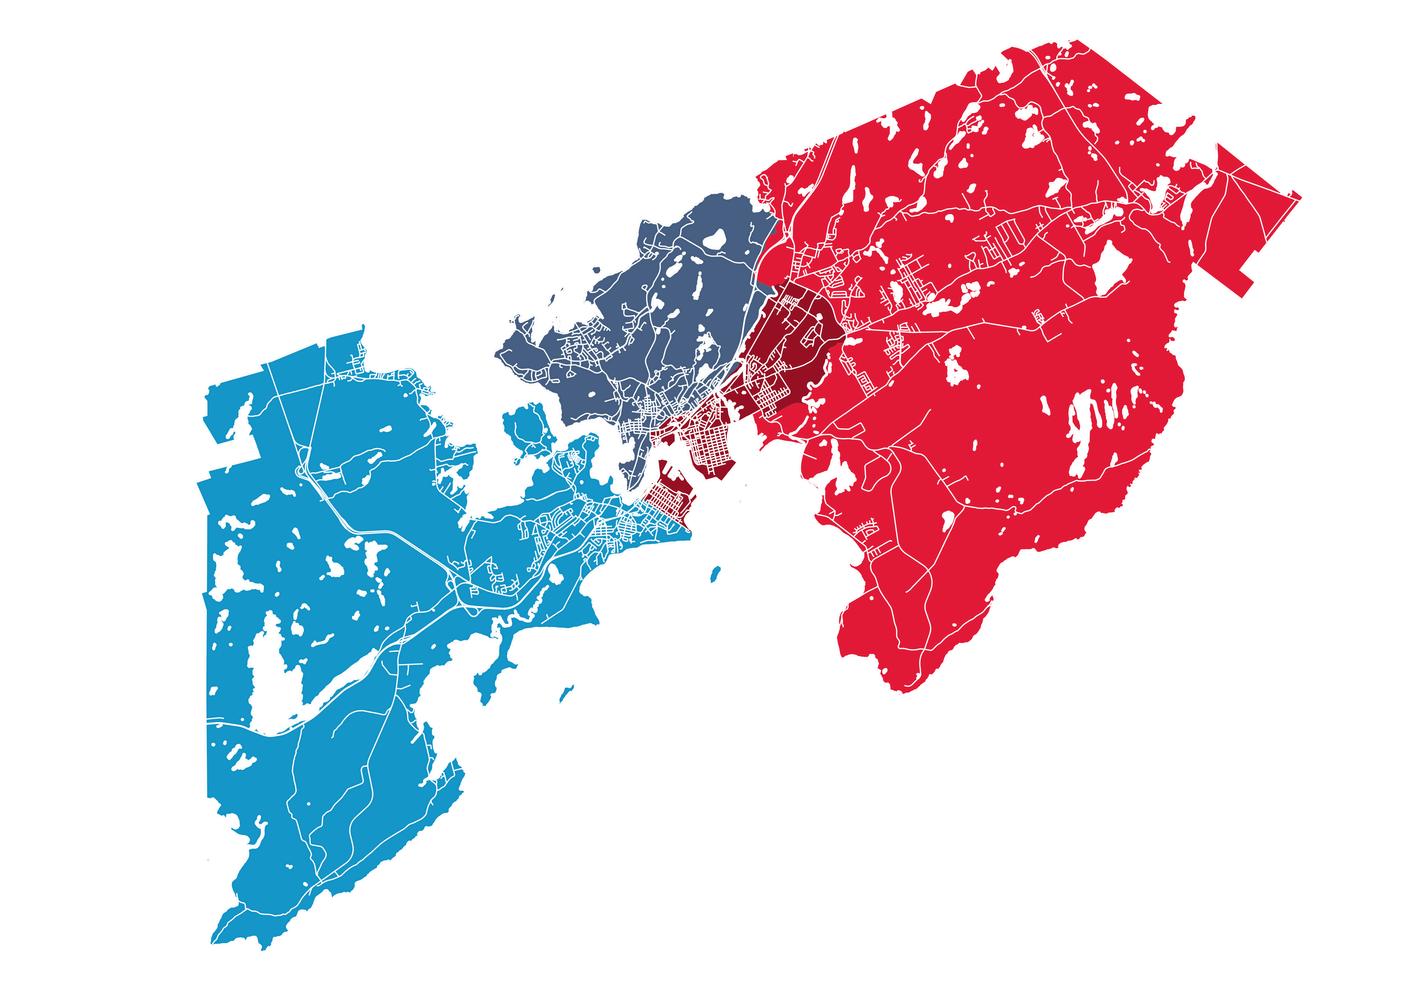
Ward 1
Ward 2
Saint John
23.4% 0-17: 30.7% 18-64: 23.3%
16.8%
Ward 4
437 people experienced homelessness for at least one day in Feb, 2026.
Jan-22Mar-22May22Jul-22Sep22 Nov-22Jan-23Mar-23May23Jul-23Sep23
“A living wage is the hourly rate a worker needs to earn to meet basic needs, live with dignity, and maintain a decent quality of life.”
CHRONIC HOMELESSNESS
246 people experienced chronic homelessness in Feb, 2026.
$24.49 p/hr
Is the living wage in Saint John.
Shelter: $1,892.69/Month - Rent: $1,511.02/Month
- Insurance: $102.10/Month - Utilities: $180.06/Month - Internet: $99.50/Month
Food: $1,400.79/Month
Data: 2024 MBM Food
Cost for Saint John, Indexed to Inflation.
Needs were identified from calls to 211 in Saint John from 202003-11 to 2025-11-29.
3,836
individuals were served food from a SJ food bank in Jan, 2026. Did you know that roughly 3.1% of NB’s population is served by a food bank? That is 1 in 32 people.
by 15% from 2008 to 2021 in