2025 Child & Family Poverty
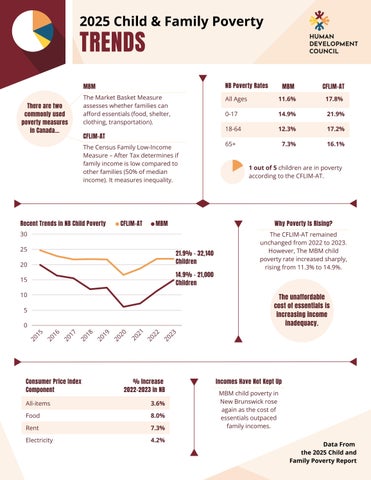
TRENDS There are two commonly used poverty measures in Canada...
MBM
NB Poverty Rates
MBM
CFLIM-AT
The Market Basket Measure assesses whether families can afford essentials (food, shelter, clothing, transportation).
All Ages
11.6%
17.8%
0-17
14.9%
21.9%
18-64
12.3%
17.2%
65+
7.3%
16.1%
CFLIM-AT The Census Family Low-Income Measure – After Tax determines if family income is low compared to other families (50% of median income). It measures inequality.
Recent Trends in NB Child Poverty
CFLIM-AT
MBM
Why Poverty Is Rising?
30 25
21.9% - 32,140 Children
20
14.9% - 21,000 Children
15 10
The CFLIM-AT remained unchanged from 2022 to 2023. However, The MBM child poverty rate increased sharply, rising from 11.3% to 14.9%.
The unaffordable cost of essentials is increasing income inadequacy.
5
Consumer Price Index Component
20 23
20 21 20 22
20 20
20 19
20 18
20 17
20 16
0
20 15
1 out of 5 children are in poverty according to the CFLIM-AT.
% Increase 2022-2023 in NB
All-items
3.6%
Food
8.0%
Rent
7.3%
Electricity
4.2%
Incomes Have Not Kept Up MBM child poverty in New Brunswick rose again as the cost of essentials outpaced family incomes. Data From the 2025 Child and Family Poverty Report