This portfolio brings together several of my project experiences in travel demand forecasting, route generation, and geospatial analysis, demonstrating the integrated use of tools such as TransCAD, GIS platforms, and genetic algorithm models. With a background in urban planning, I have always been deeply interested in the role of data in revealing the mechanisms of urban systems and supporting spatial decision-making. Across these projects, I have combined technical methods with planning insights to explore the interactions between travel behavior, land use, and mobility patterns from a systems perspective.
Transportation data science is not only about data processing and model construction—it also requires a multidisciplinary logic to translate complex datasets into clear, actionable policies and design strategies. These projects reflect my technical proficiency in modeling, spatial analysis, and visualization, while also showcasing how I express data-driven approaches through spatial thinking.
01 ANTICIPATING MOTION
TRAFFIC IMPACT ASSESSMENT FOR A NEW TOWN AREA
Date: 04/2023-06/2023
Area: 213ha
Nanjing, China
02 NO-RISK ROUTES
CRIME-REDUCTION-ORIENTED BICYCLE ROUTE GENERATION
Date: 06/2024-12/2024 Area: 5016ha
Los Angeles, USA
03 WEIGHING THE LAND
GIS-BASED EVALUATION OF ENVIRONMENTAL CARRYING CAPACITY AND DEVELOPMENT SUITABILITY
Date: 02/2022-06/2022 Area: 153390ha
Lancang, China
04 FORMED BY NATURE
URBAN DESIGN BASED ON GIS ECOLOGICAL SENSITIVITY ANALYSIS
Date: 09/2021-01/2022
Area: 160ha
Nanjing, China
01 ANTICIPATING MOTION
Study Area: 213ha
Type: Individual Academic Work
Date: 04/2023-06/2023
Instructor: Xiaosu Ma maxs@seu.edu.cn
Keywords: Traffic Forecasting, Model Simulation
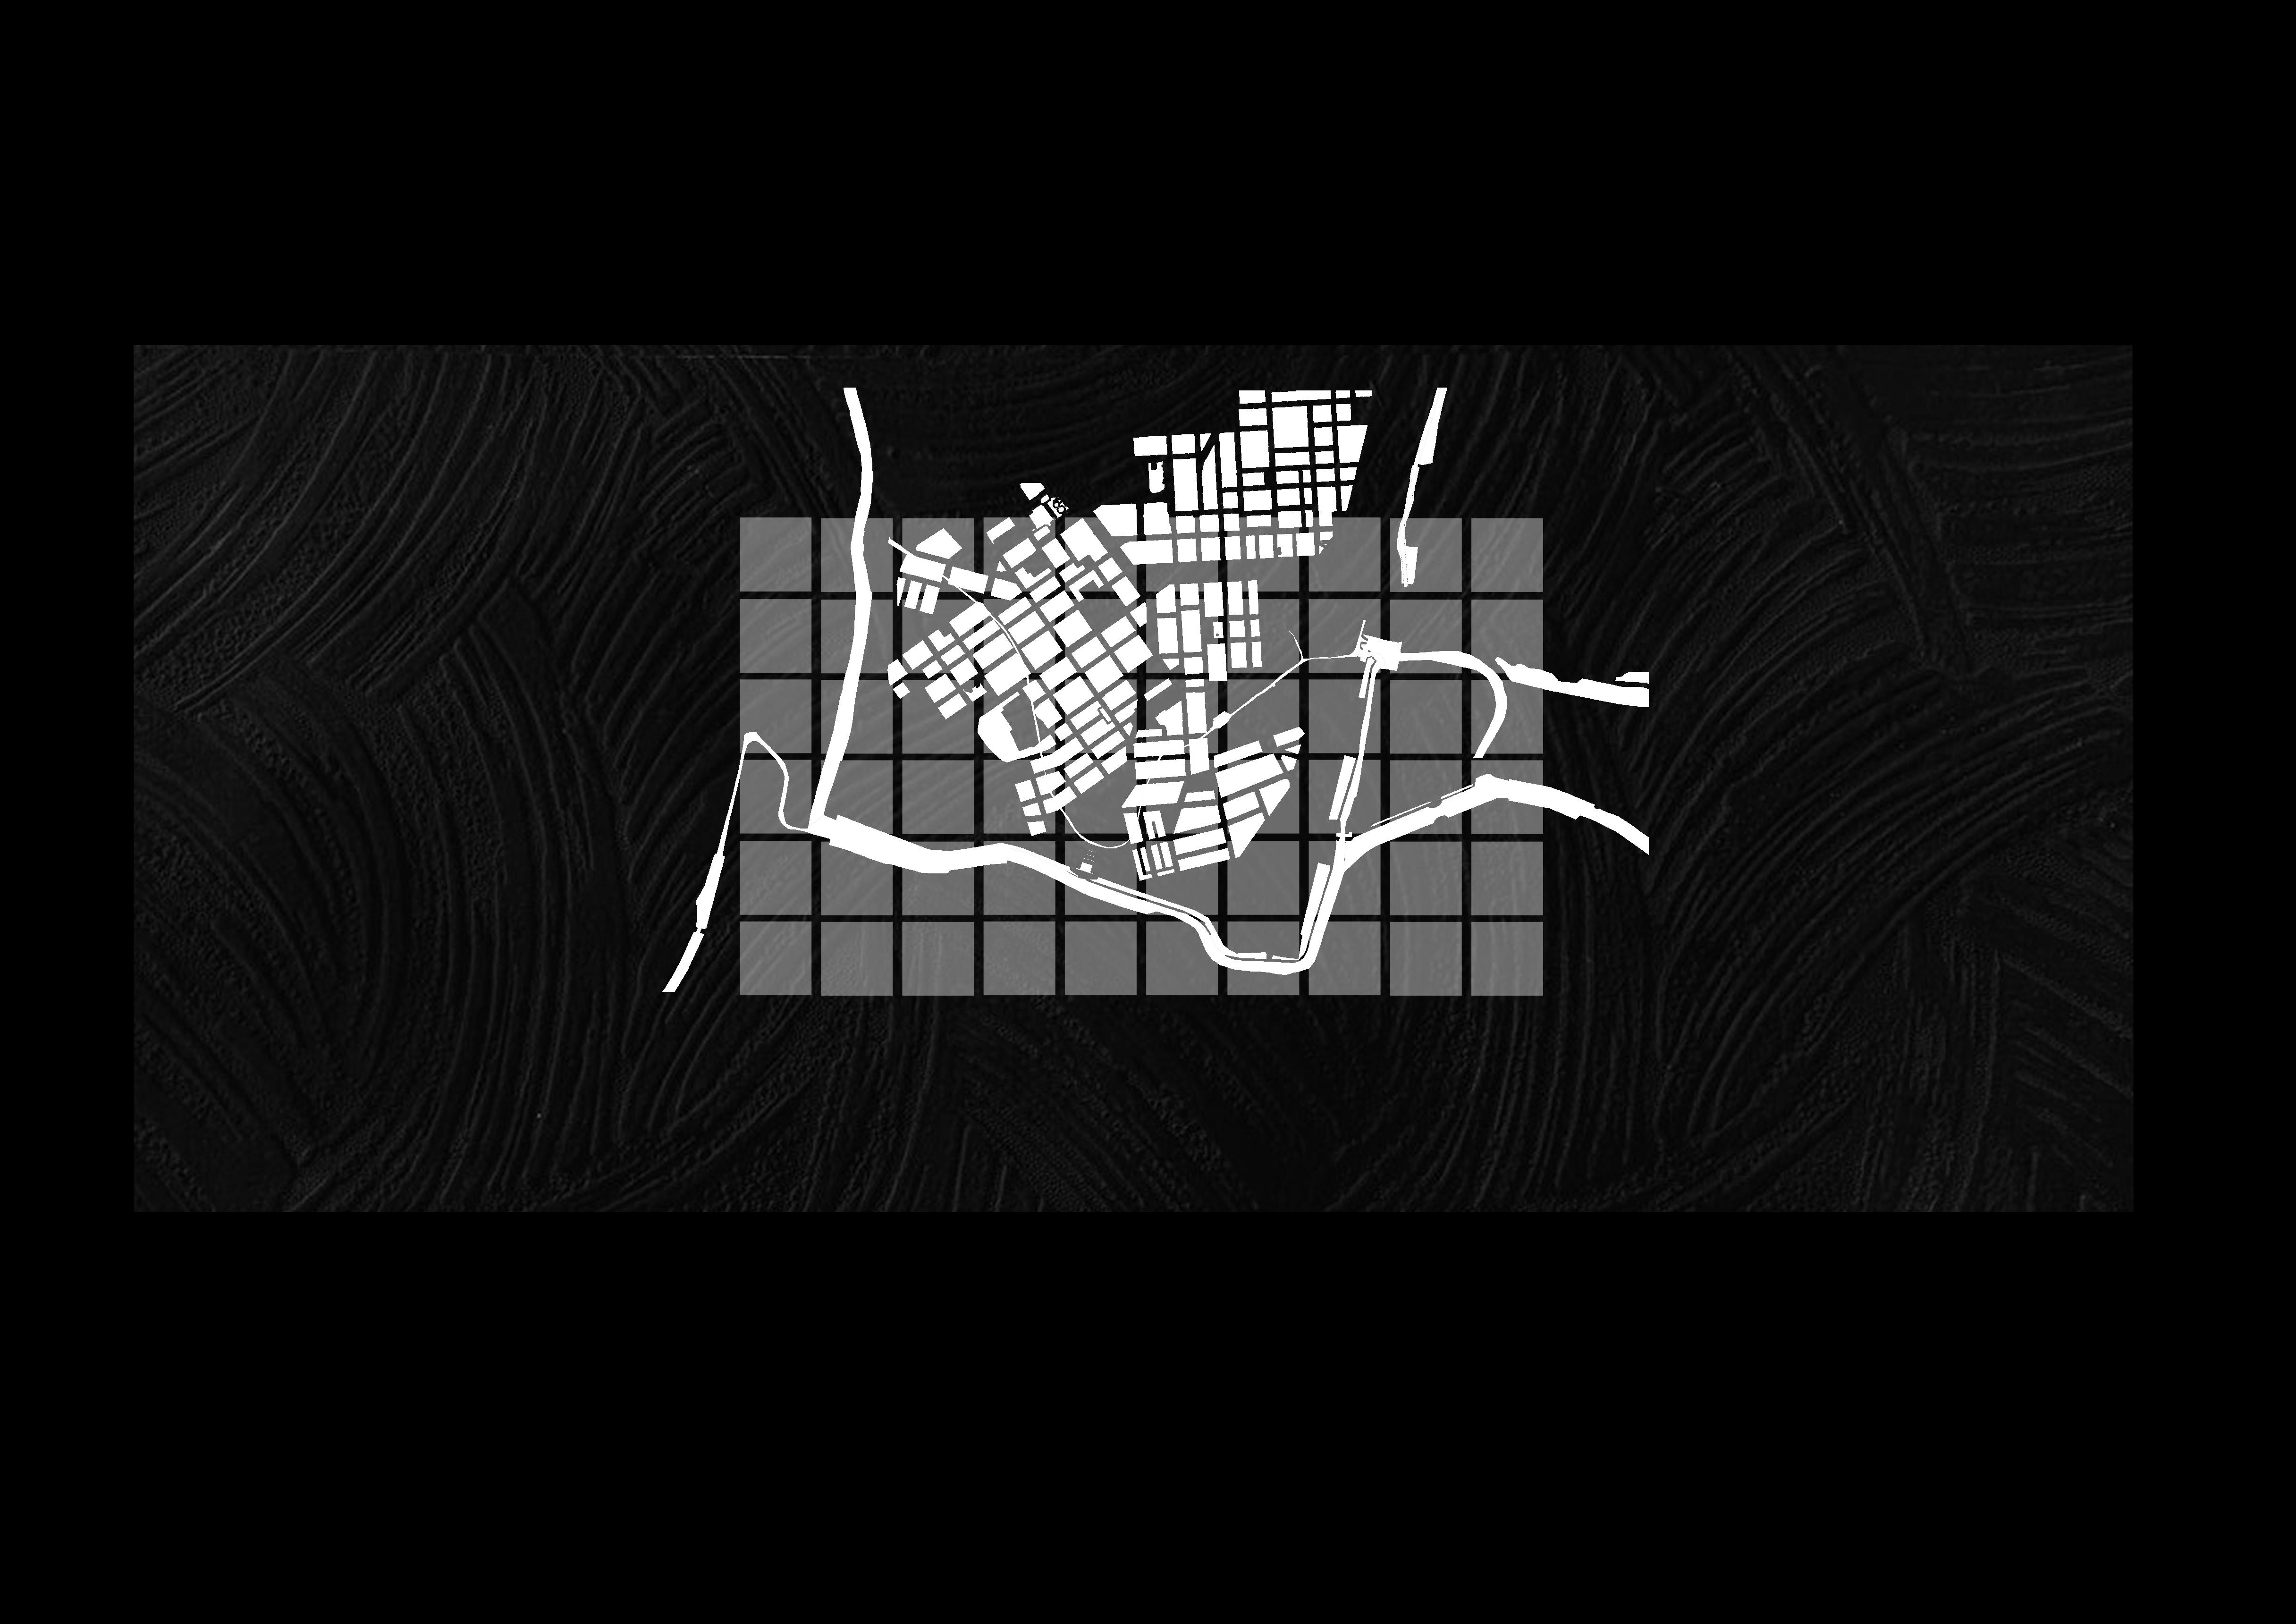
This project focuses on conducting a transportation impact assessment for the urban design plan of Tiebei Hongshan New City in Nanjing. Covering an area of 213 hectares, the site features a complex mix of land uses, including residential, commercial, office, and research functions, and is expected to have a significant impact on the regional transportation system.
The analysis includes transportation demand forecasting and circulation planning. Key tasks involve dividing traffic analysis zones, calculating peak-hour trip generation and attraction, developing mode choice models, and using TransCAD to generate OD matrices and simulate traffic assignment. Based on these analyses, the project formulates circulation strategies for motor vehicles, non-motorized traffic, and pedestrians.
Traffic Impact Assessment for a New Town Area
Nanjing, Jiangsu, China
Research Background and Site Context
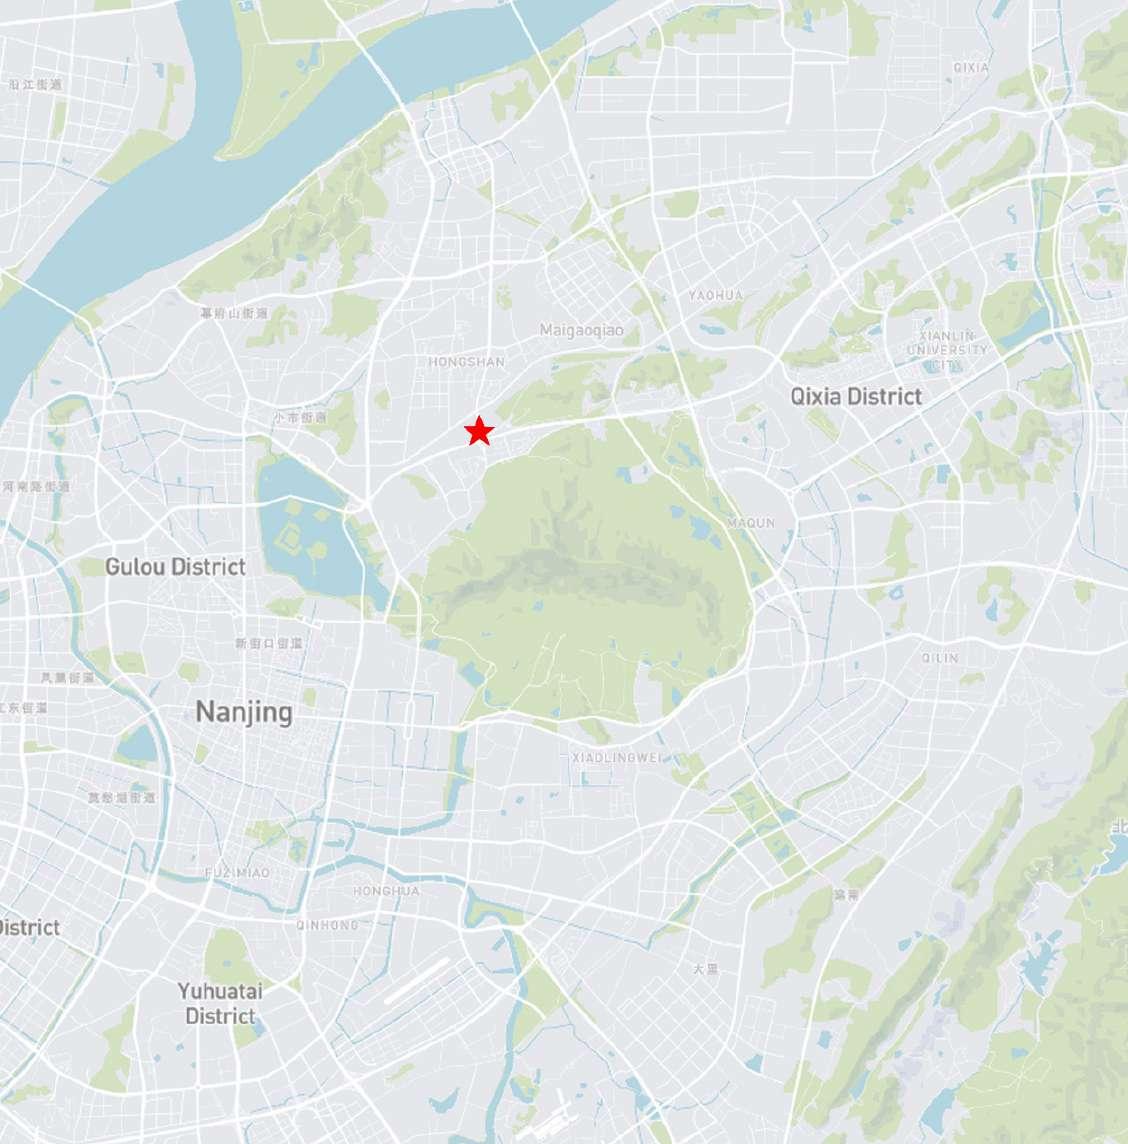
Tiebei Hongshan New City (hereinafter referred to as “the site”) is located in the northern part of Xuanwu District, Nanjing. The total planned area of the site is 213 ha, with a total floor area of 326.12 ha. The construction land covers 121 ha, accounting for 57% of the total area, while roads occupy 10.5%.
The site is well-connected: it is 5 km from the Ningluo Expressway entrance to the east, only 2.4 km from Nanjing Railway Station, and 7 km south to the Xinjiekou commercial center. A major urban arterial road runs along its southern edge, with a city expressway just 500 meters further south, providing excellent transportation accessibility. However, the internal road network lacks secondary roads, resulting in an imbalanced road structure and many large, unbroken parcels in need of subdivision. Given these conditions, in order to enhance the area's role as a regional center in northern Xuanwu, strengthen the connection between the industrial and commercial hubs in the east and west, and meet daily travel demands, it is necessary to analyze and evaluate the traffic volume the site will generate and its impact on the surrounding road network.
Regulatory Planning Indicators
The southern part of the site, adjacent to the north side of Hongshan South Road, is designated as an industrial development corridor. The western and central areas serve as the commercial core and axis, while the northern section is primarily planned for residential and mixed-use development. As the site and surrounding areas continue to be developed, travel patterns are expected to become increasingly complex, and traffic volumes will rise significantly.
Site Location Analysis
Xinjiekou
Site Transportation Conditions
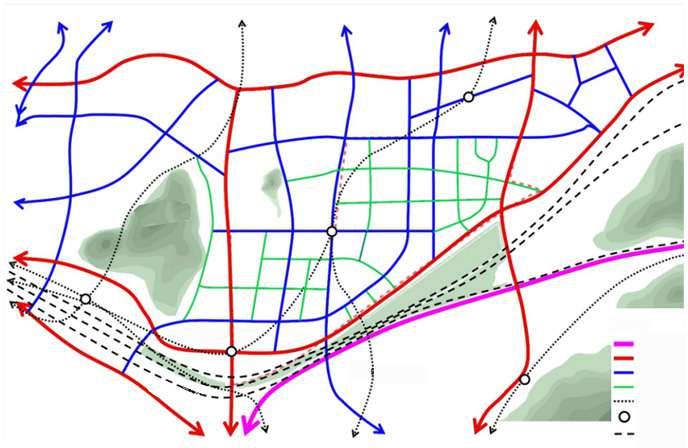
The planned road network surrounding and within the site is shown in the figure below. According to information from relevant upper-level planning documents, new planned right-of-way widths have been designated for several major and secondary roads around the site. However, some of the roads have not yet been constructed in accordance with the planned ROW. In this study, all subsequent data is based on the ROW widths provided in the upper-level planning. The planned ROW width for major urban roads around the site ranges from 131 to 157 feet, while that for secondary roads ranges from 79 to 131 feet.
Road Network Map
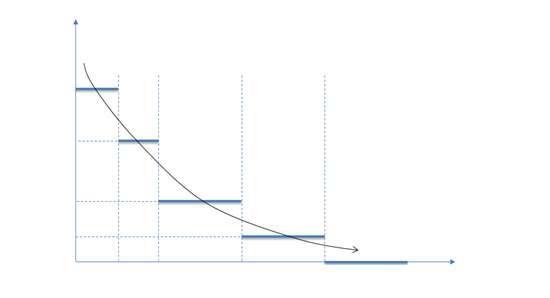
Based on the following data, it can be generally concluded that the morning peak period is the primary travel peak for the site.
Travel Demand Forecasting
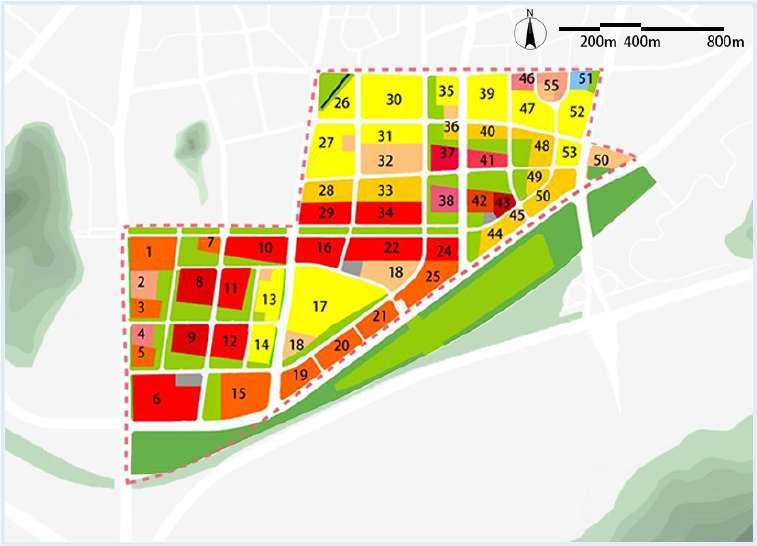
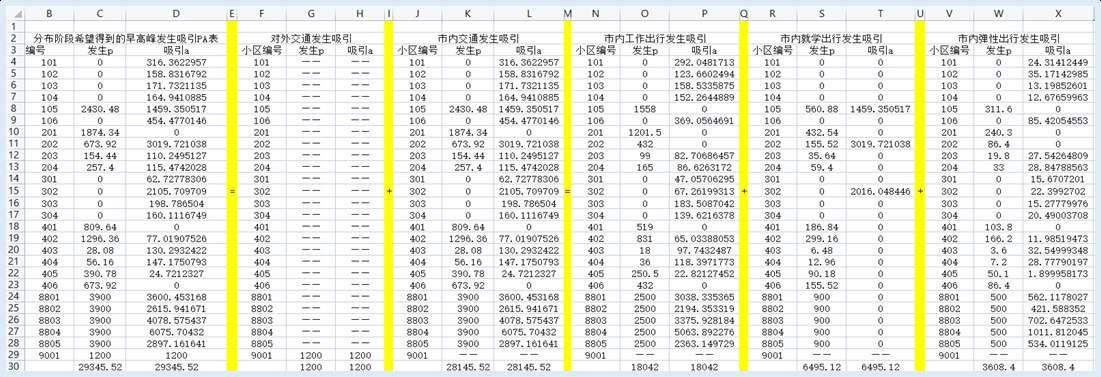
Traffic Analysis Zone Division
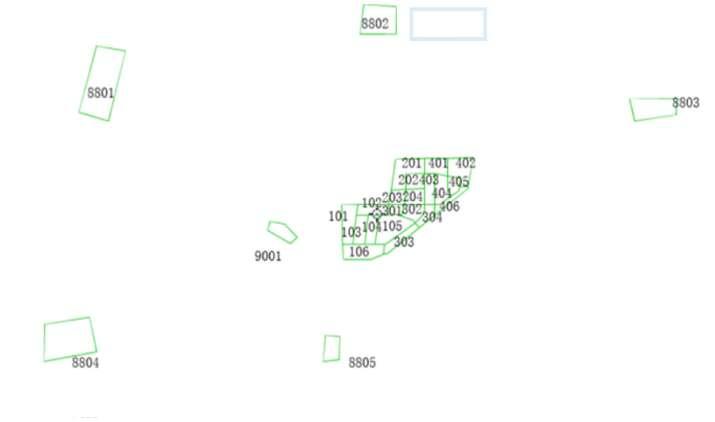
The figure shows the traffic analysis zones in the study area. Zones "101–406" cover the new urban area, while "8801–8805" represent peripheral zones like Jiangbei and Hexi, supporting analysis of core–periphery connections. Zone "9001" marks the train station, a key transport hub. The zoning provides a spatial basis for travel demand forecasting and trip analysis.
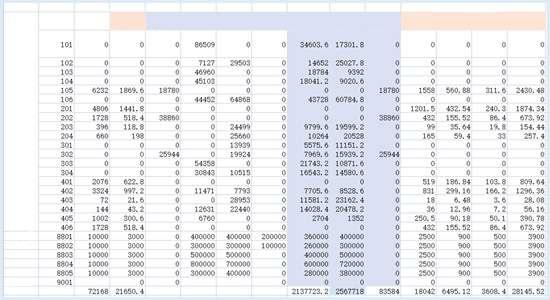
Prediction of Trip Generation and Attraction for the Site
After dividing the study area into traffic analysis zones and classifying land use types, the morning peak hour trip generation is estimated based on population and land use data. It is assumed that 50% of the total population is employed, and 50% of them commute during the peak hour, resulting in a work trip coefficient of 0.25. It is also assumed that students account for 10% of the total population, with 30% commuting during the peak hour, yielding a school trip coefficient of 0.3. Flexible trips are assumed to follow a similar pattern to work trips, with 5% occurring during the peak hour, resulting in a coefficient of 0.05. Based on the number of employed persons, educational facilities, and commercial land in each zone, peak hour trip generation for the three categories is calculated respectively and then aggregated to support subsequent trip distribution and demand forecasting.
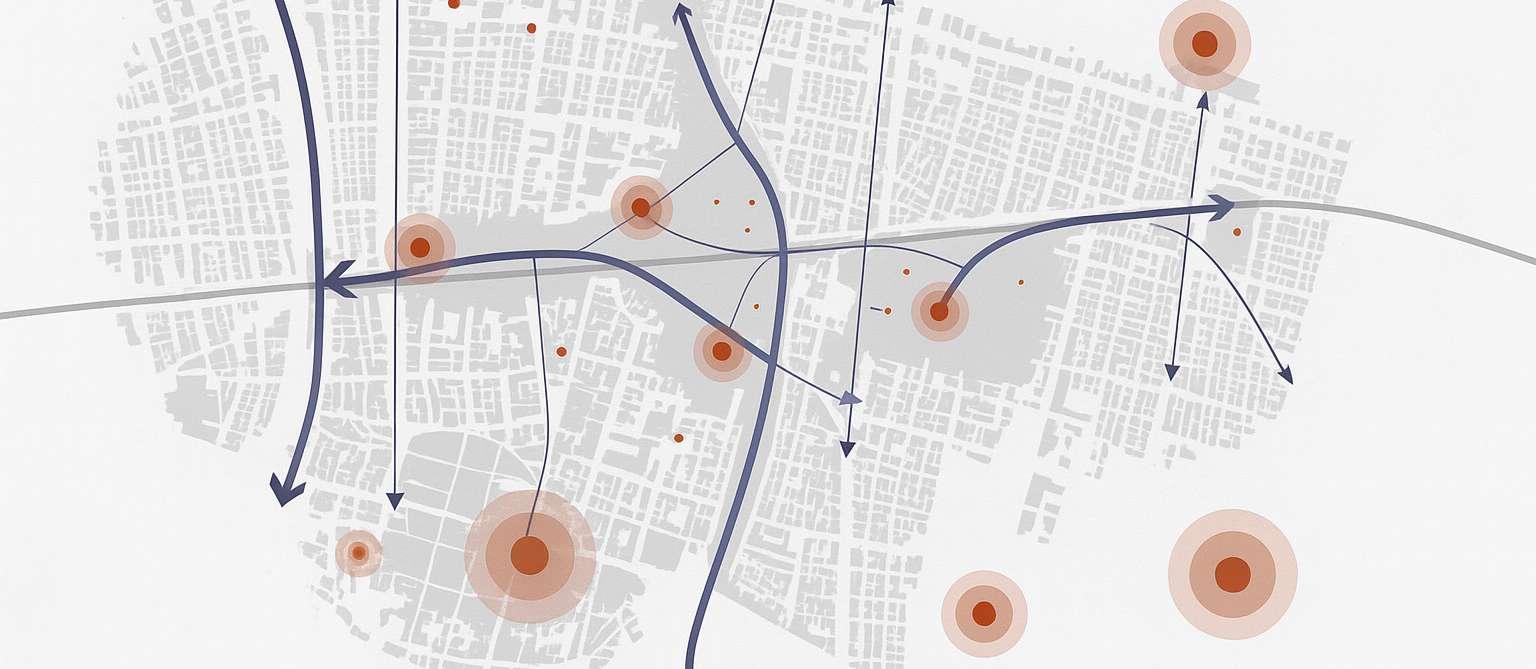
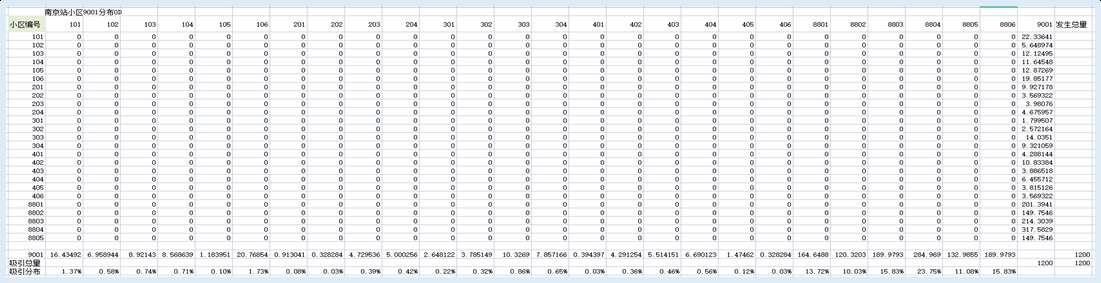
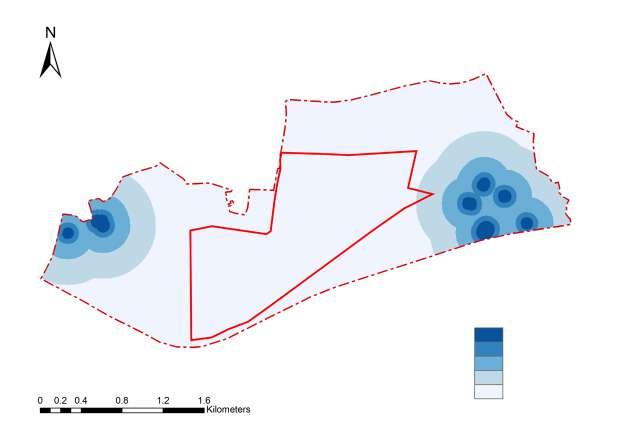
Distribution of Trip Origins During Morning Peak Hour
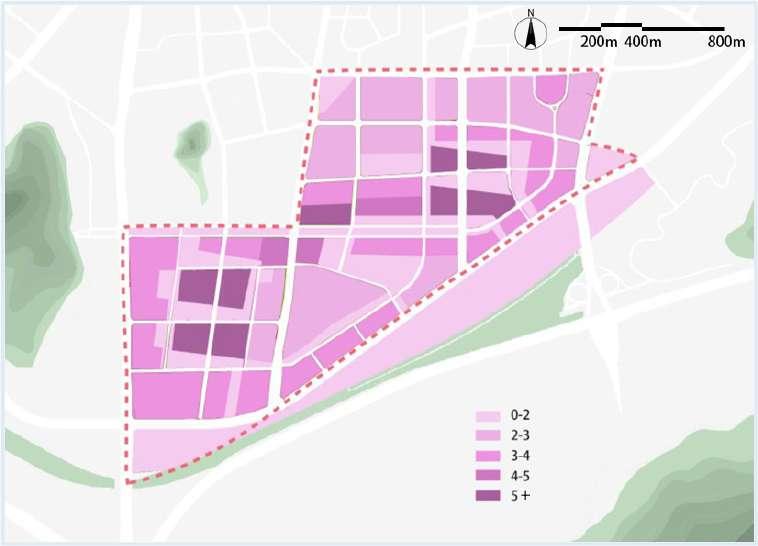
Based on the travel characteristics during the morning peak period, the demand population can be primarily estimated from residential land. By analyzing the distribution of residential population within each traffic analysis zone and applying the morning peak trip generation rates, the total number of departures and their proportions from each zone can be calculated. As shown in the figure, the departure demand is mainly concentrated in zone "9001," which functions as a key transportation node.
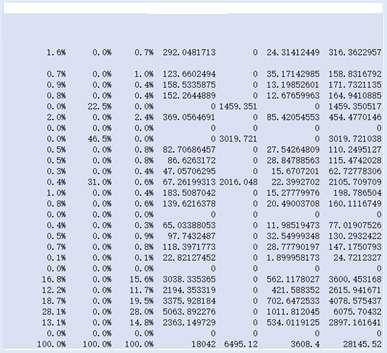
Trip Production and Attraction Table by Purpose
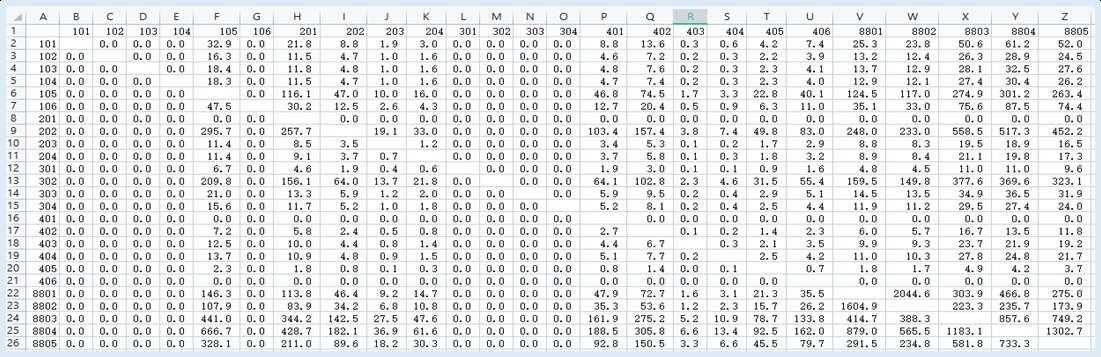
After dividing the traffic analysis zones based on land use and functional areas, the Production-Attraction table is developed using the trip generation and attraction data for each zone across different travel purposes. This table systematically records the origin-destination relationships of each zone for specific types of trips.
Distribution of Trip Origins During Morning Peak Hour
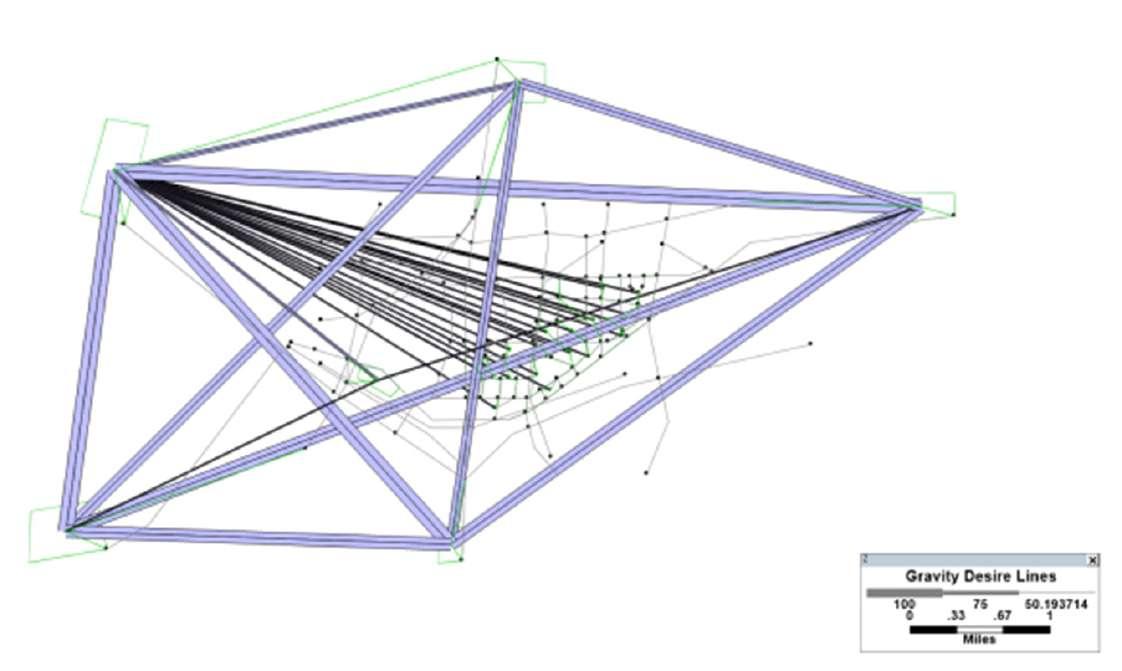
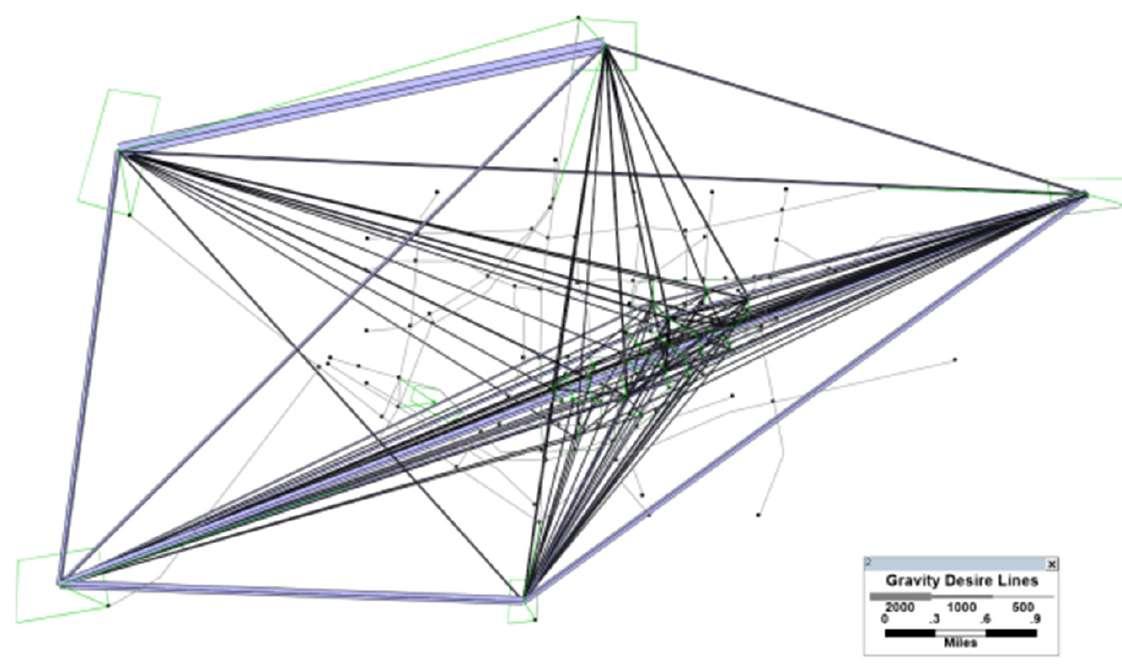
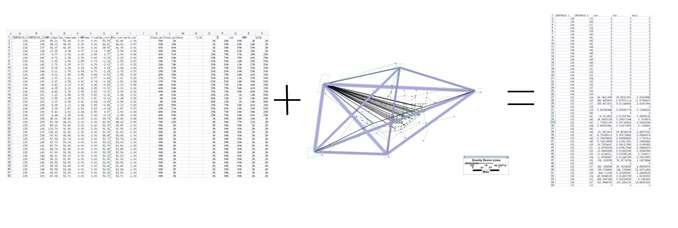
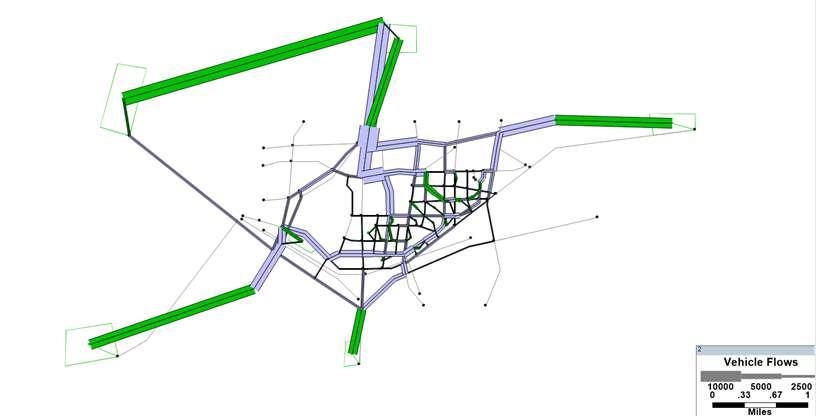
The PA table is imported into TransCAD to conduct traffic distribution using the gravity model. During the simulation, the model allocates traffic flows based on the trip productions and attractions between zones, as well as the impedance function between locations, thereby determining the travel intensity among traffic analysis zones.
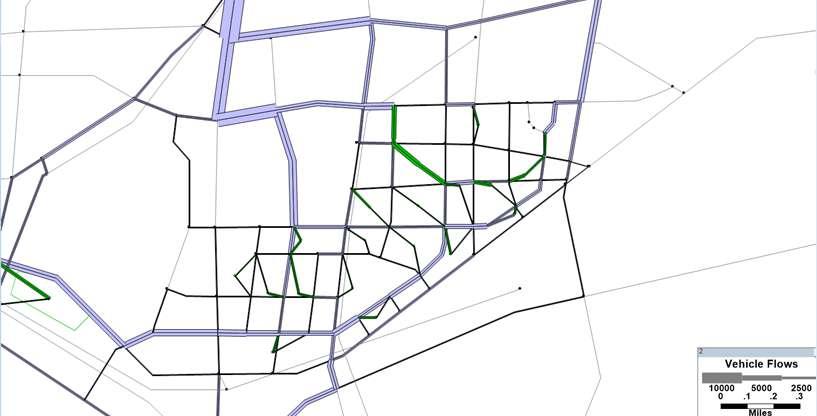
The "Gravity Desire Lines" shown in the images represent the output of the gravity model. The thickness of the lines reflects the intensity of travel demand between different origin-destination pairs. The first image illustrates the spatial distribution of major commuting flows during the peak hour, while the second image, at a broader spatial scale, reveals strong commuting connections between the urban periphery and the city center.
Trip Mode Choice Method and Results Traffic Assignment Results
Daily travel modes are categorized into motor vehicles, non-motorized vehicles, and pedestrian traffic. The mode choice is modeled using a logit model and a walking selection function, as shown below.
Motor Vehicle Traffic
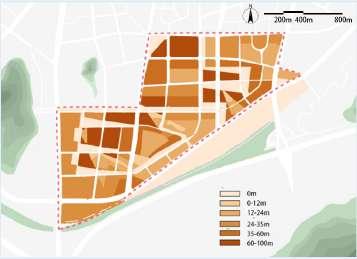
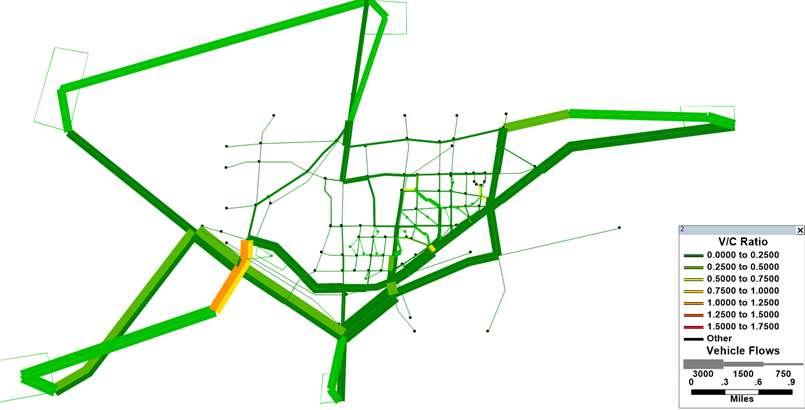
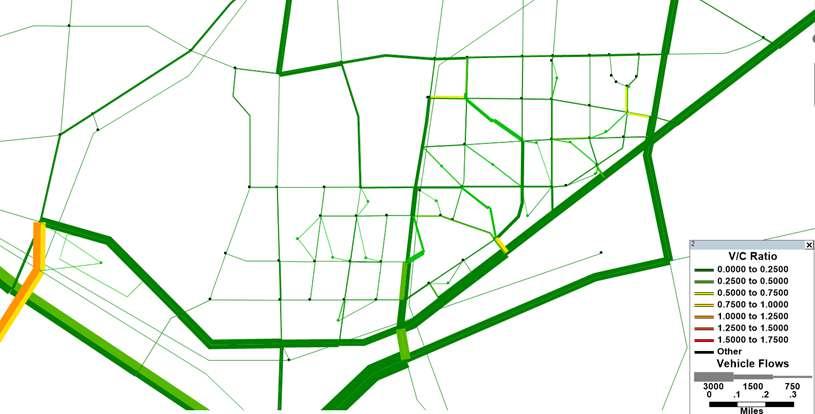
By introducing the User Equilibrium model and the BPR impedance function, and incorporating the vehicle travel OD matrix derived from the earlier gravity model, traffic assignment was conducted to generate the V/C ratio distribution across the road network. As shown in the figure, several arterial roads in the southwestern area are approaching or exceeding saturation levels (V/C ≥ 0.75), while many main roads in the central and eastern urban areas have V/C values significantly below 0.5, indicating underutilized capacity. Some road segments at key nodes exhibit signs of congestion due to the convergence of substantial OD demand.
To address the above issues, priority should be given to optimizing the main traffic corridors in the southwestern area by widening roads, improving signal control, or adding parallel routes to increase capacity and improve traffic flow. Meanwhile, the central and eastern road networks can be used to redirect part of the traffic demand to underutilized segments, helping to ease localized congestion.
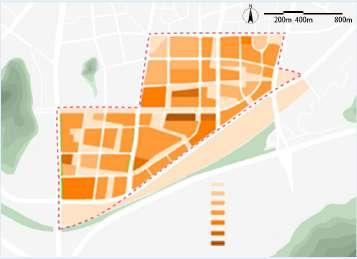
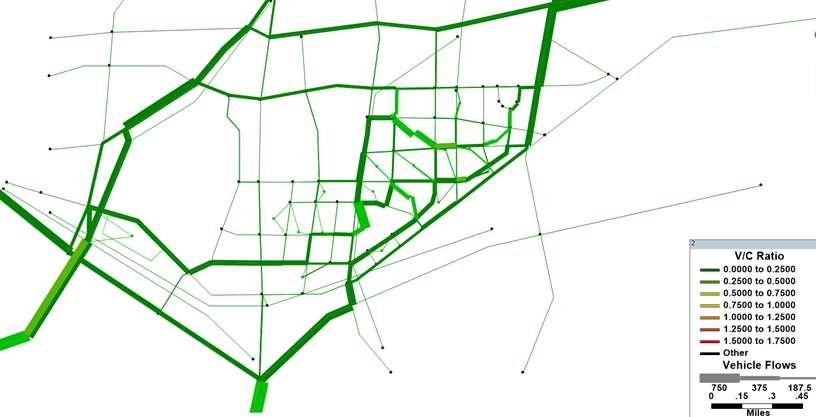
Non-motorized Vehicle Traffic
As shown in the figure, the eastern part of the urban area experiences low pressure on non-motorized traffic, with most segments having a V/C ratio below 0.5, indicating low current loads. However, the network structure is fragmented, and the primary nonmotorized lane system is underdeveloped, resulting in discontinuous paths. In particular, within the north-south commuting corridors, some areas rely excessively on a few segments, creating potential bottlenecks and safety risks.
The overall connectivity of the non-motorized traffic network should be optimized, with a focus on enhancing the continuity and capacity of the north-south backbone cycling corridors to ensure smooth flow. At the same time, micro-connections between east-west secondary roads should be reinforced to expand the coverage of the slow-traffic system, guiding non-motorized trips to be more evenly distributed and orderly, thereby improving the safety and accessibility of the entire network.
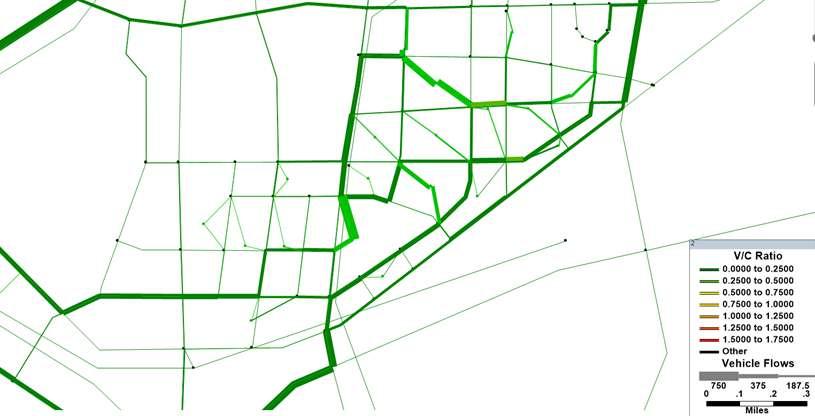
The diagrams show that pedestrian traffic is mainly concentrated on a few secondary roads, especially around Changfa North Road, which handles heavy foot traffic and is dominated by outbound trips. These routes lack proper dispersion, posing safety and environmental concerns. Meanwhile, other areas have fragmented pedestrian paths with weak connectivity, limiting the system’s overall continuity and comfort.
Pedestrian systems should be better integrated with metro and bus transfer nodes to enhance outbound walking connections, improve transfer efficiency, and elevate the walking experience. Along high-footfall routes such as Changfa North Road, the pedestrian environment can be optimized by adding greenery, seating, and shading facilities to improve comfort. For internal areas, micro-circulation paths should be strengthened to improve network continuity and encourage more dispersed and convenient walking trips.
Pedestrian Traffic
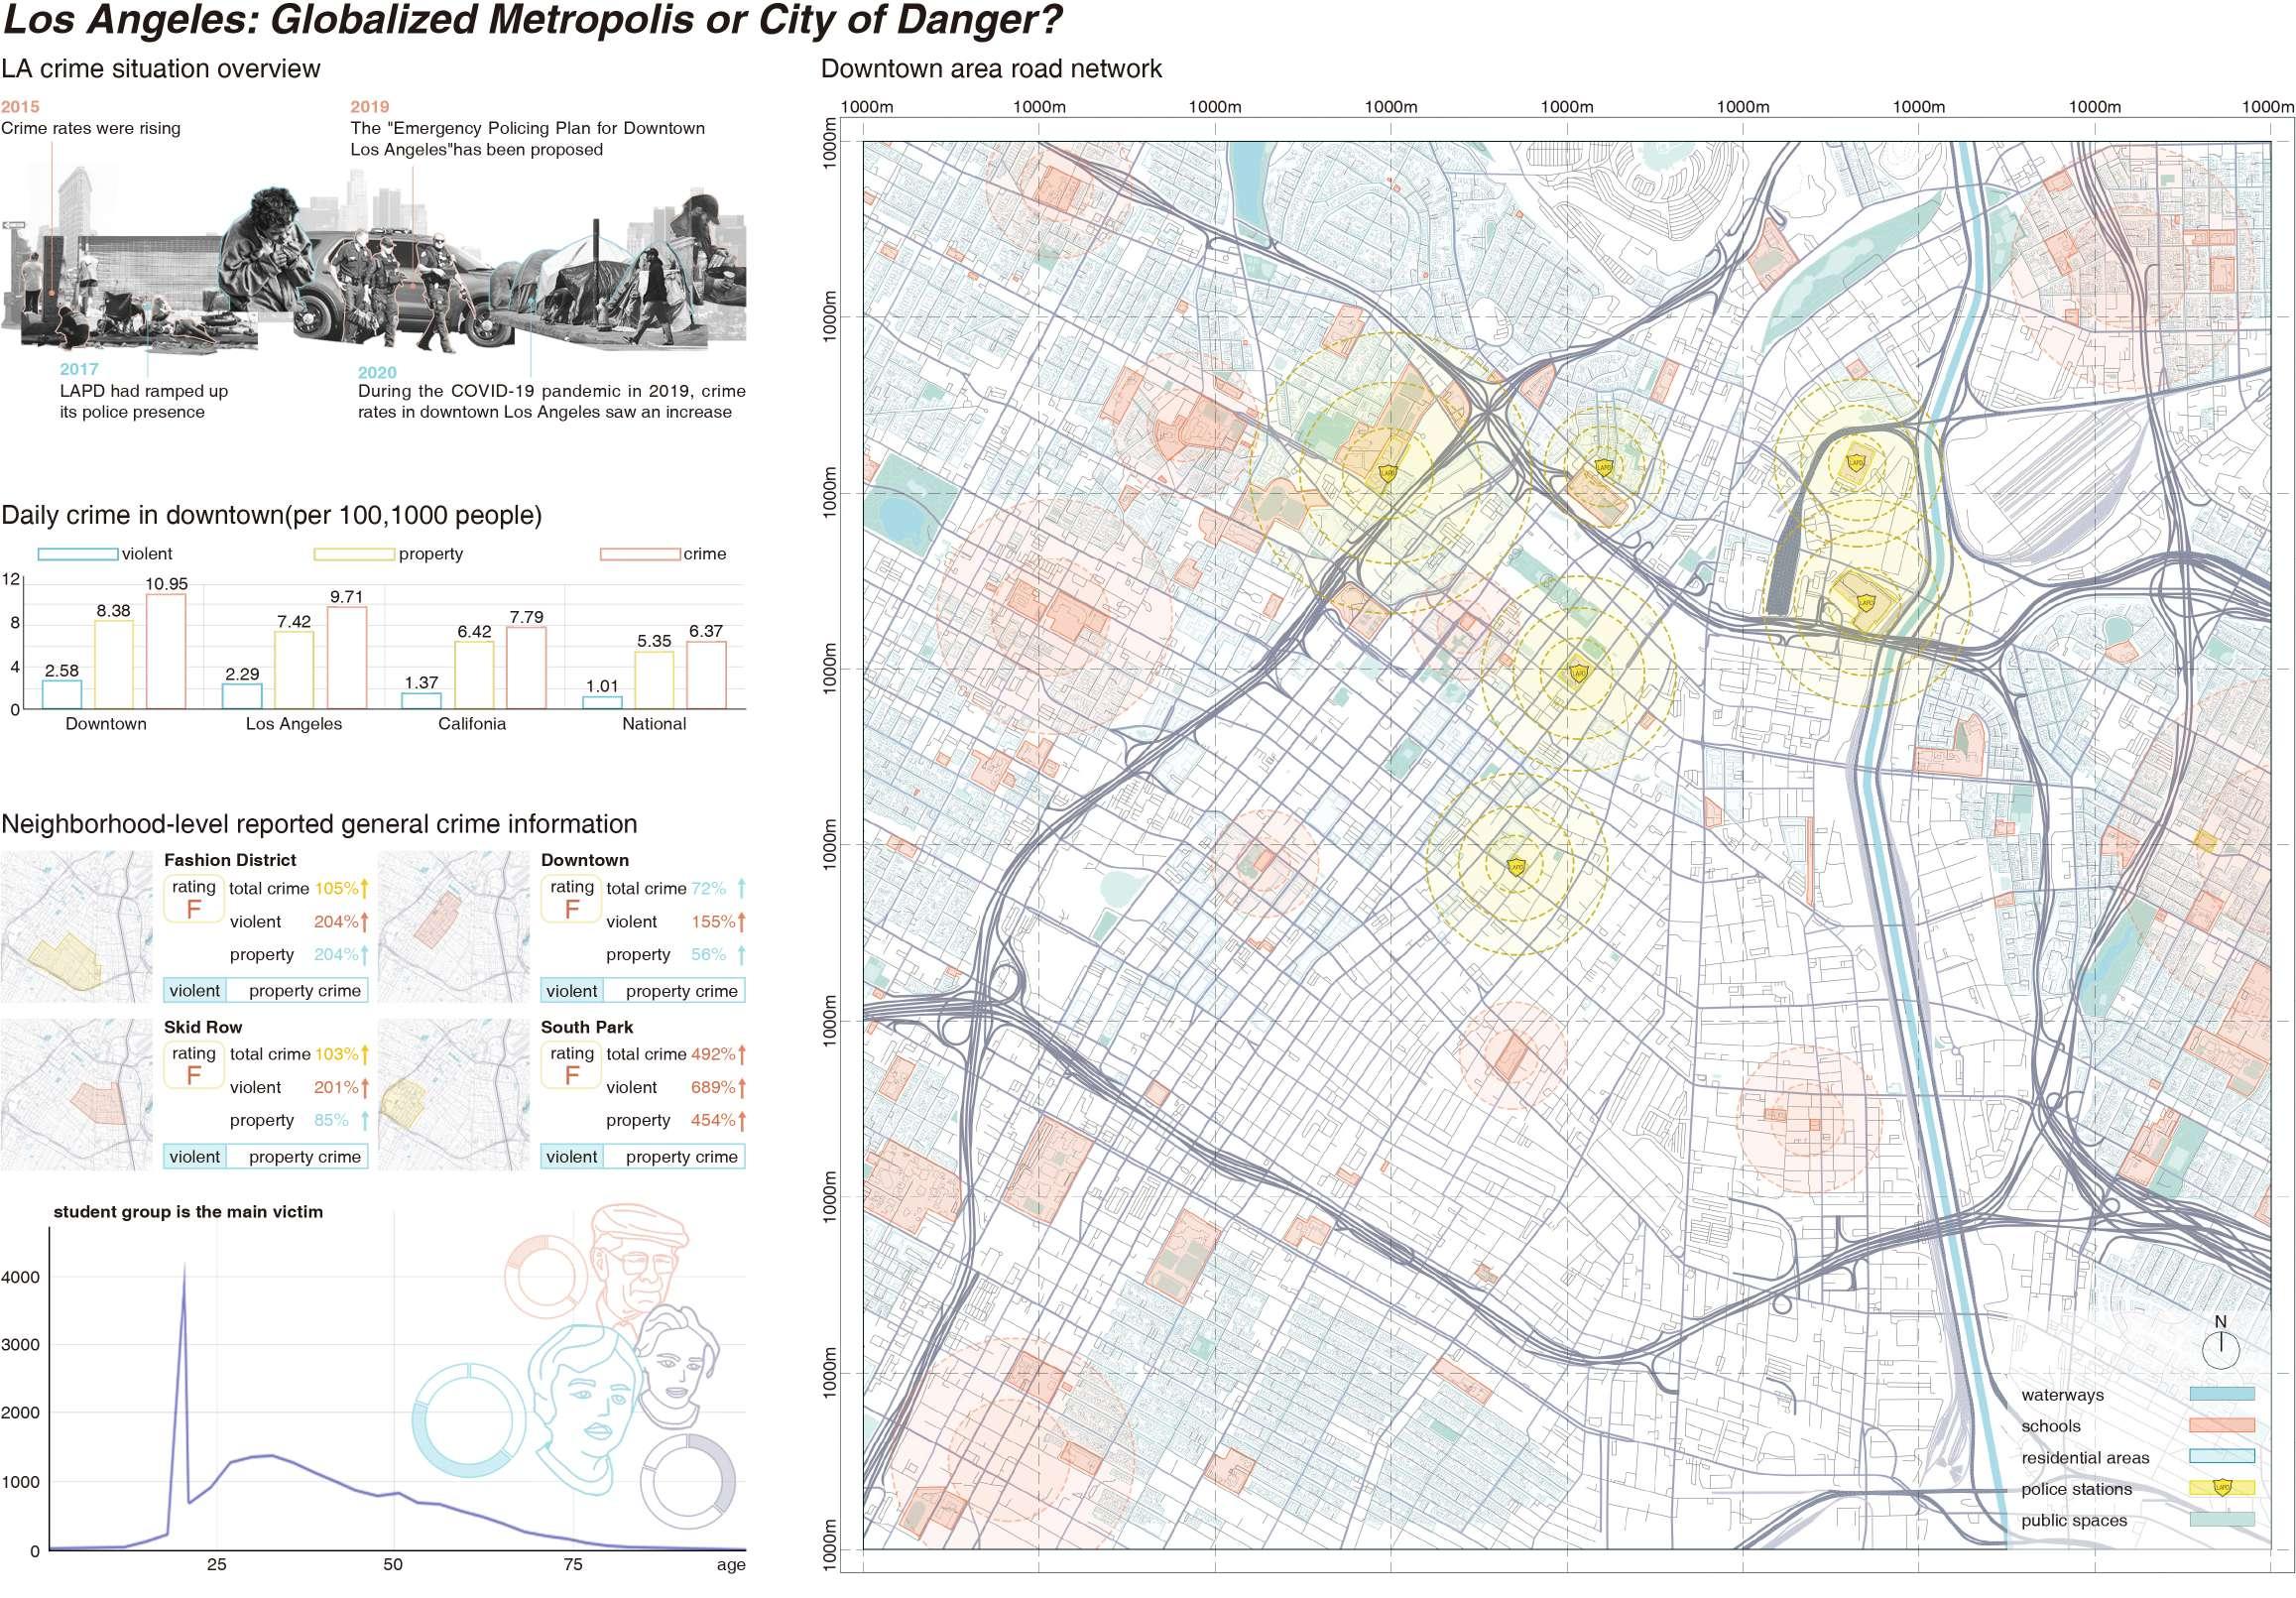
02 NO - RISK ROUTES
Crime-Reduction-Oriented Bicycle Route Generation
Los Angeles, California
Study Area: 5016 ha
Type: Individual Academic Work
Date: 06/2024-12/2024
Instructor: George Frantz frantz@cornell.edu
Keywords: Genetic Algorithm, Pedestrian Safety
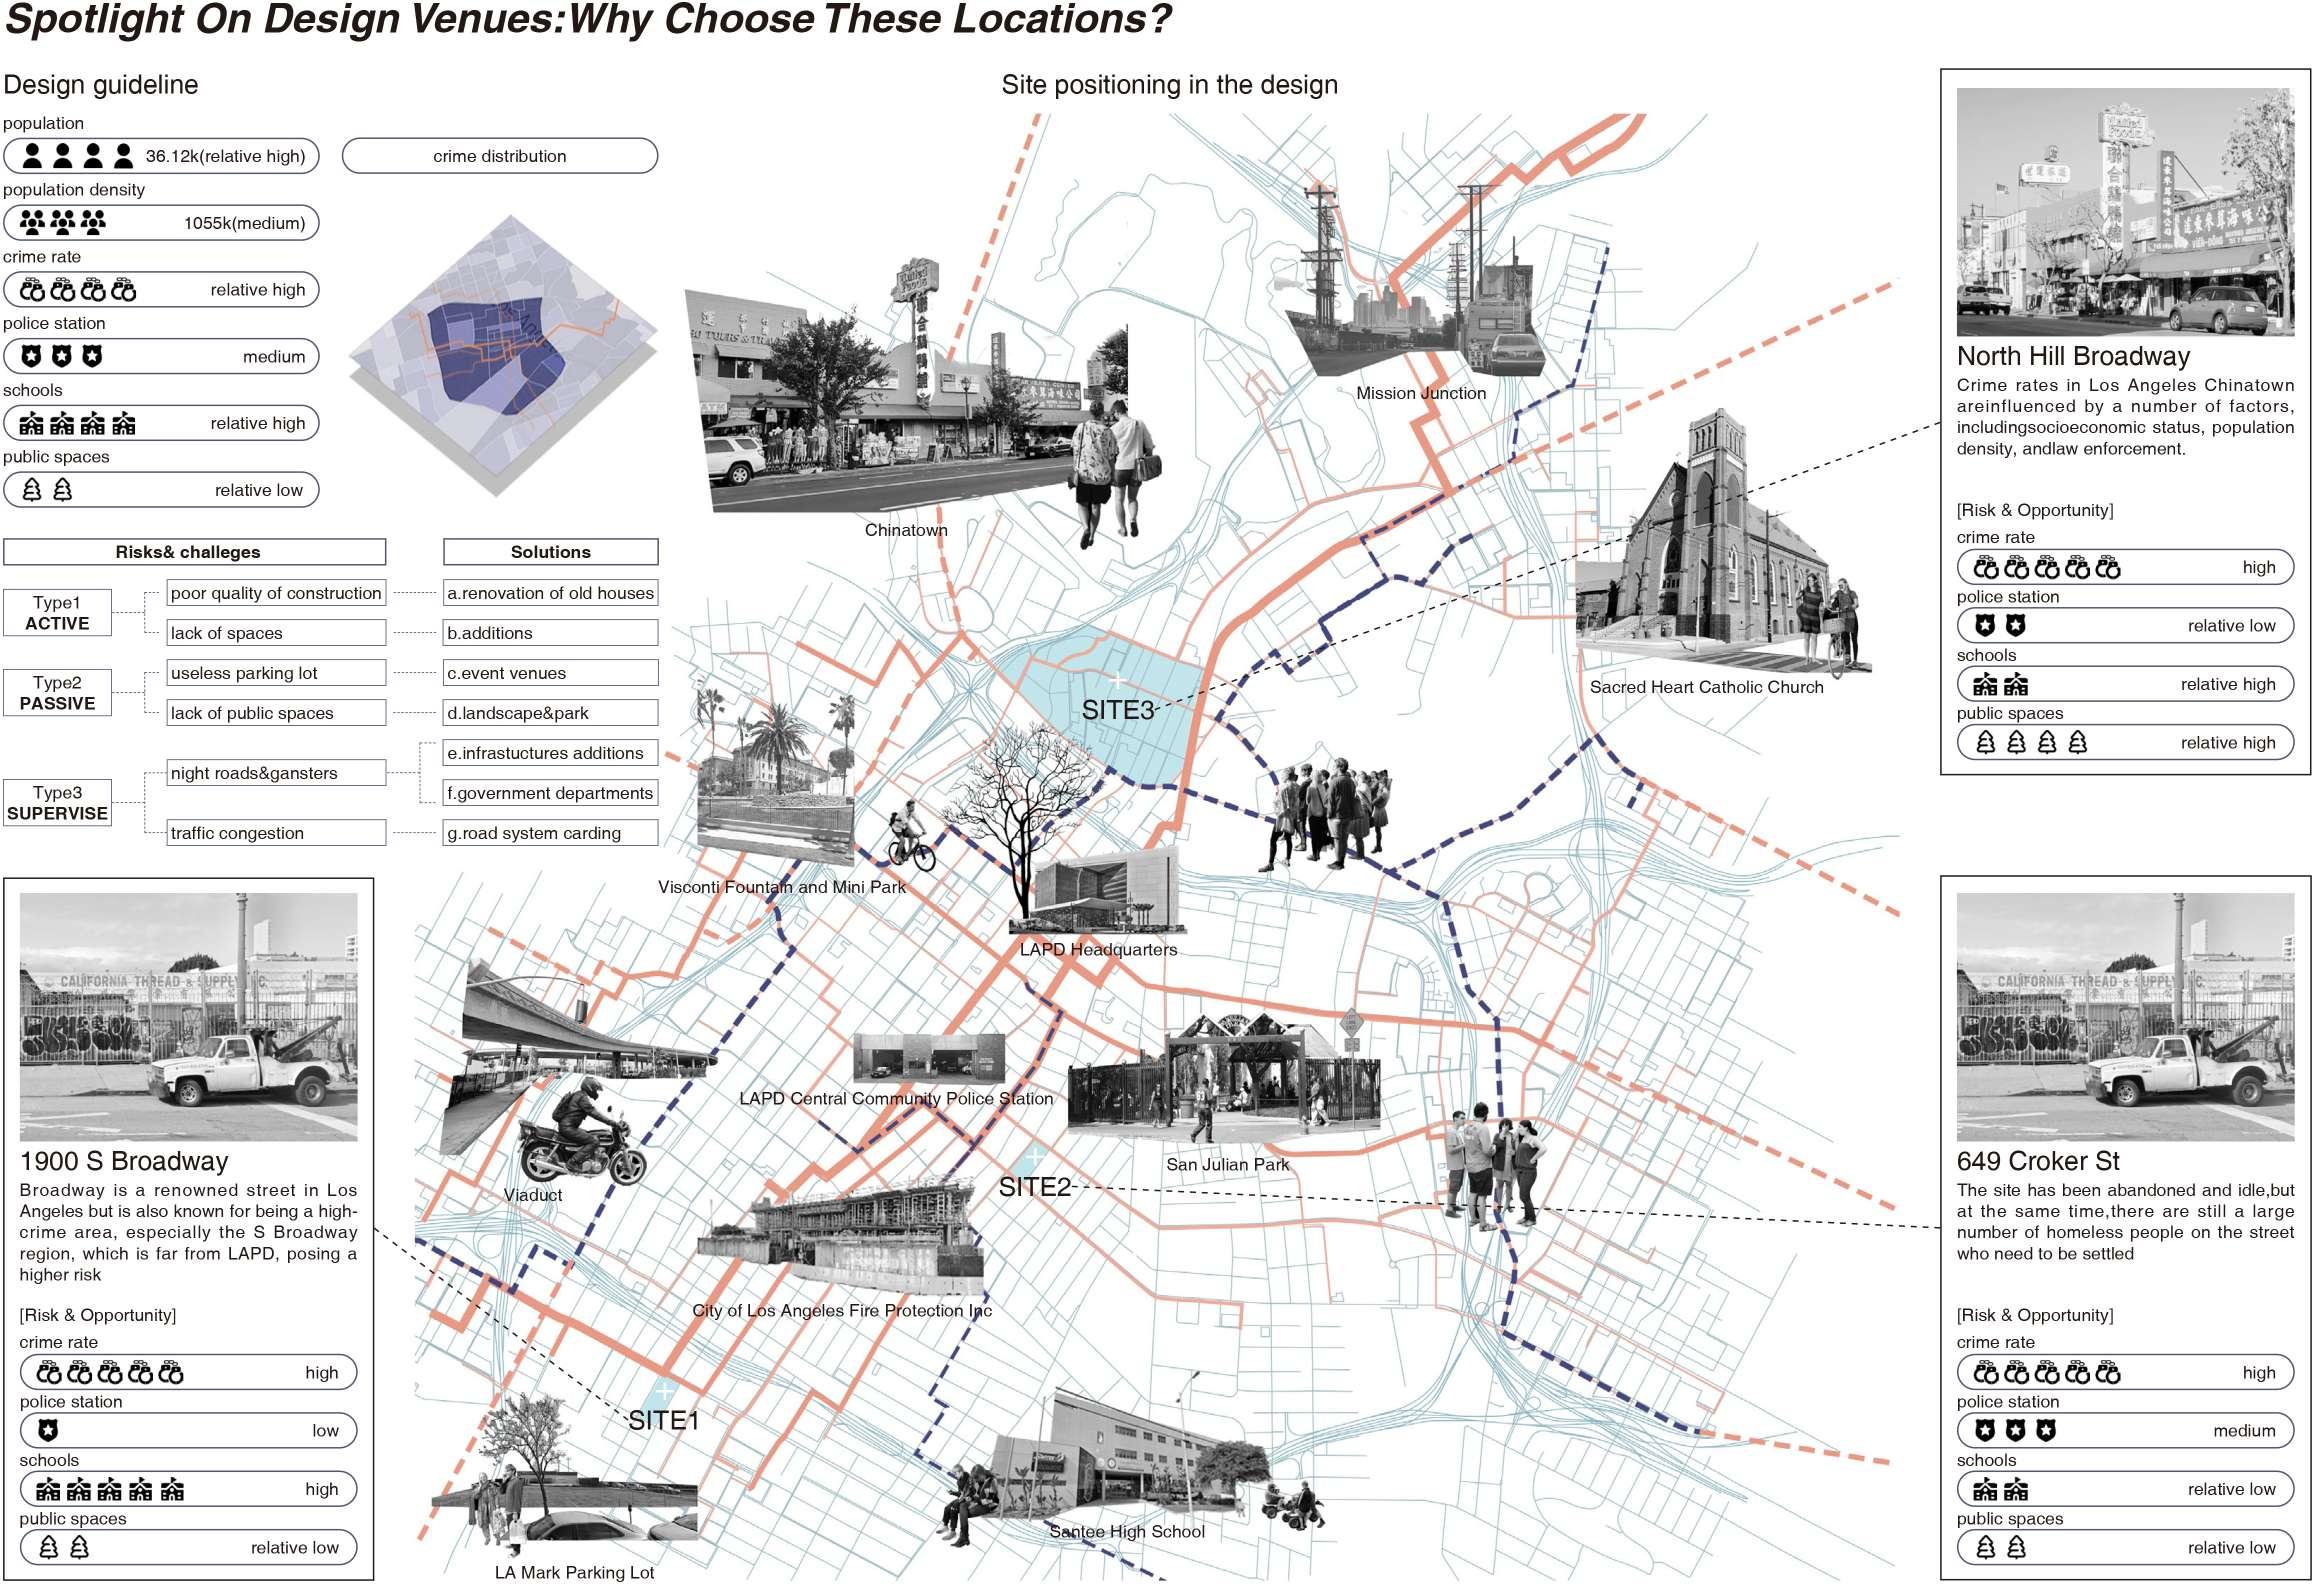
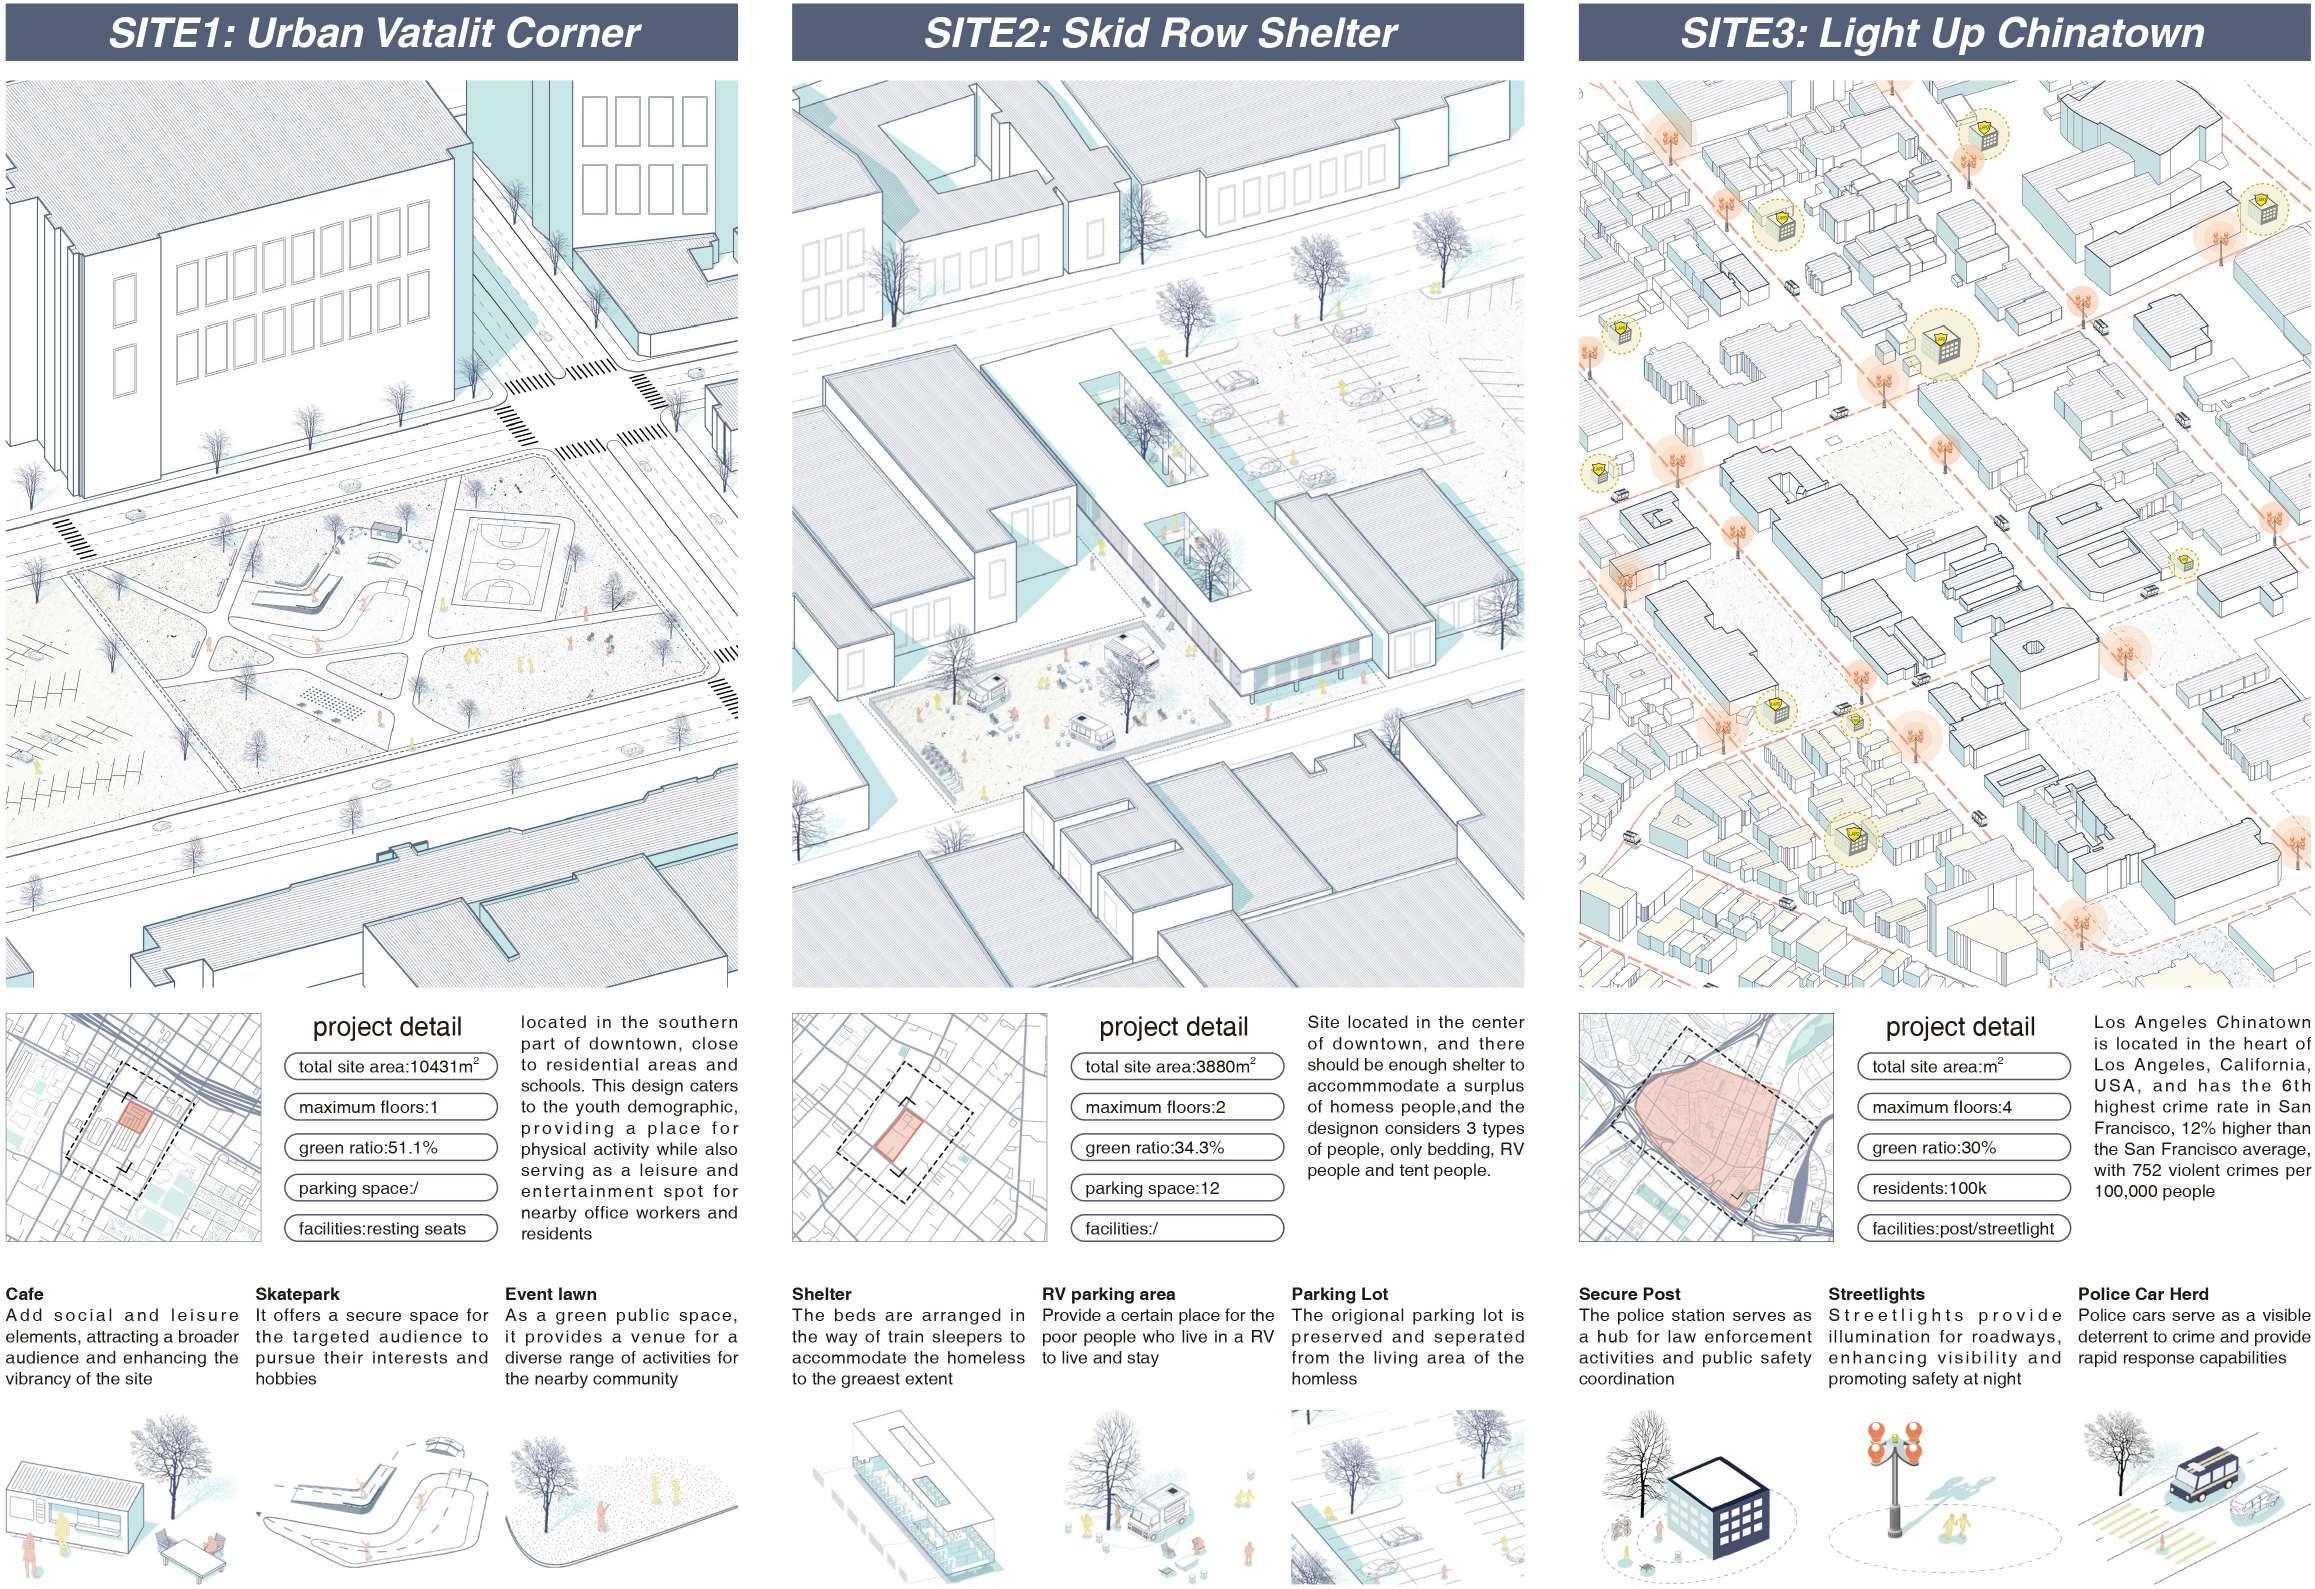
This project focuses on enhancing the safety of non-motorized travel and the overall social environment in downtown Los Angeles and surrounding areas through data-driven design approaches. The planning scope covers approximately 5,016 hectares, with particular attention to high-crime and socially vulnerable areas such as Skid Row and Broadway.
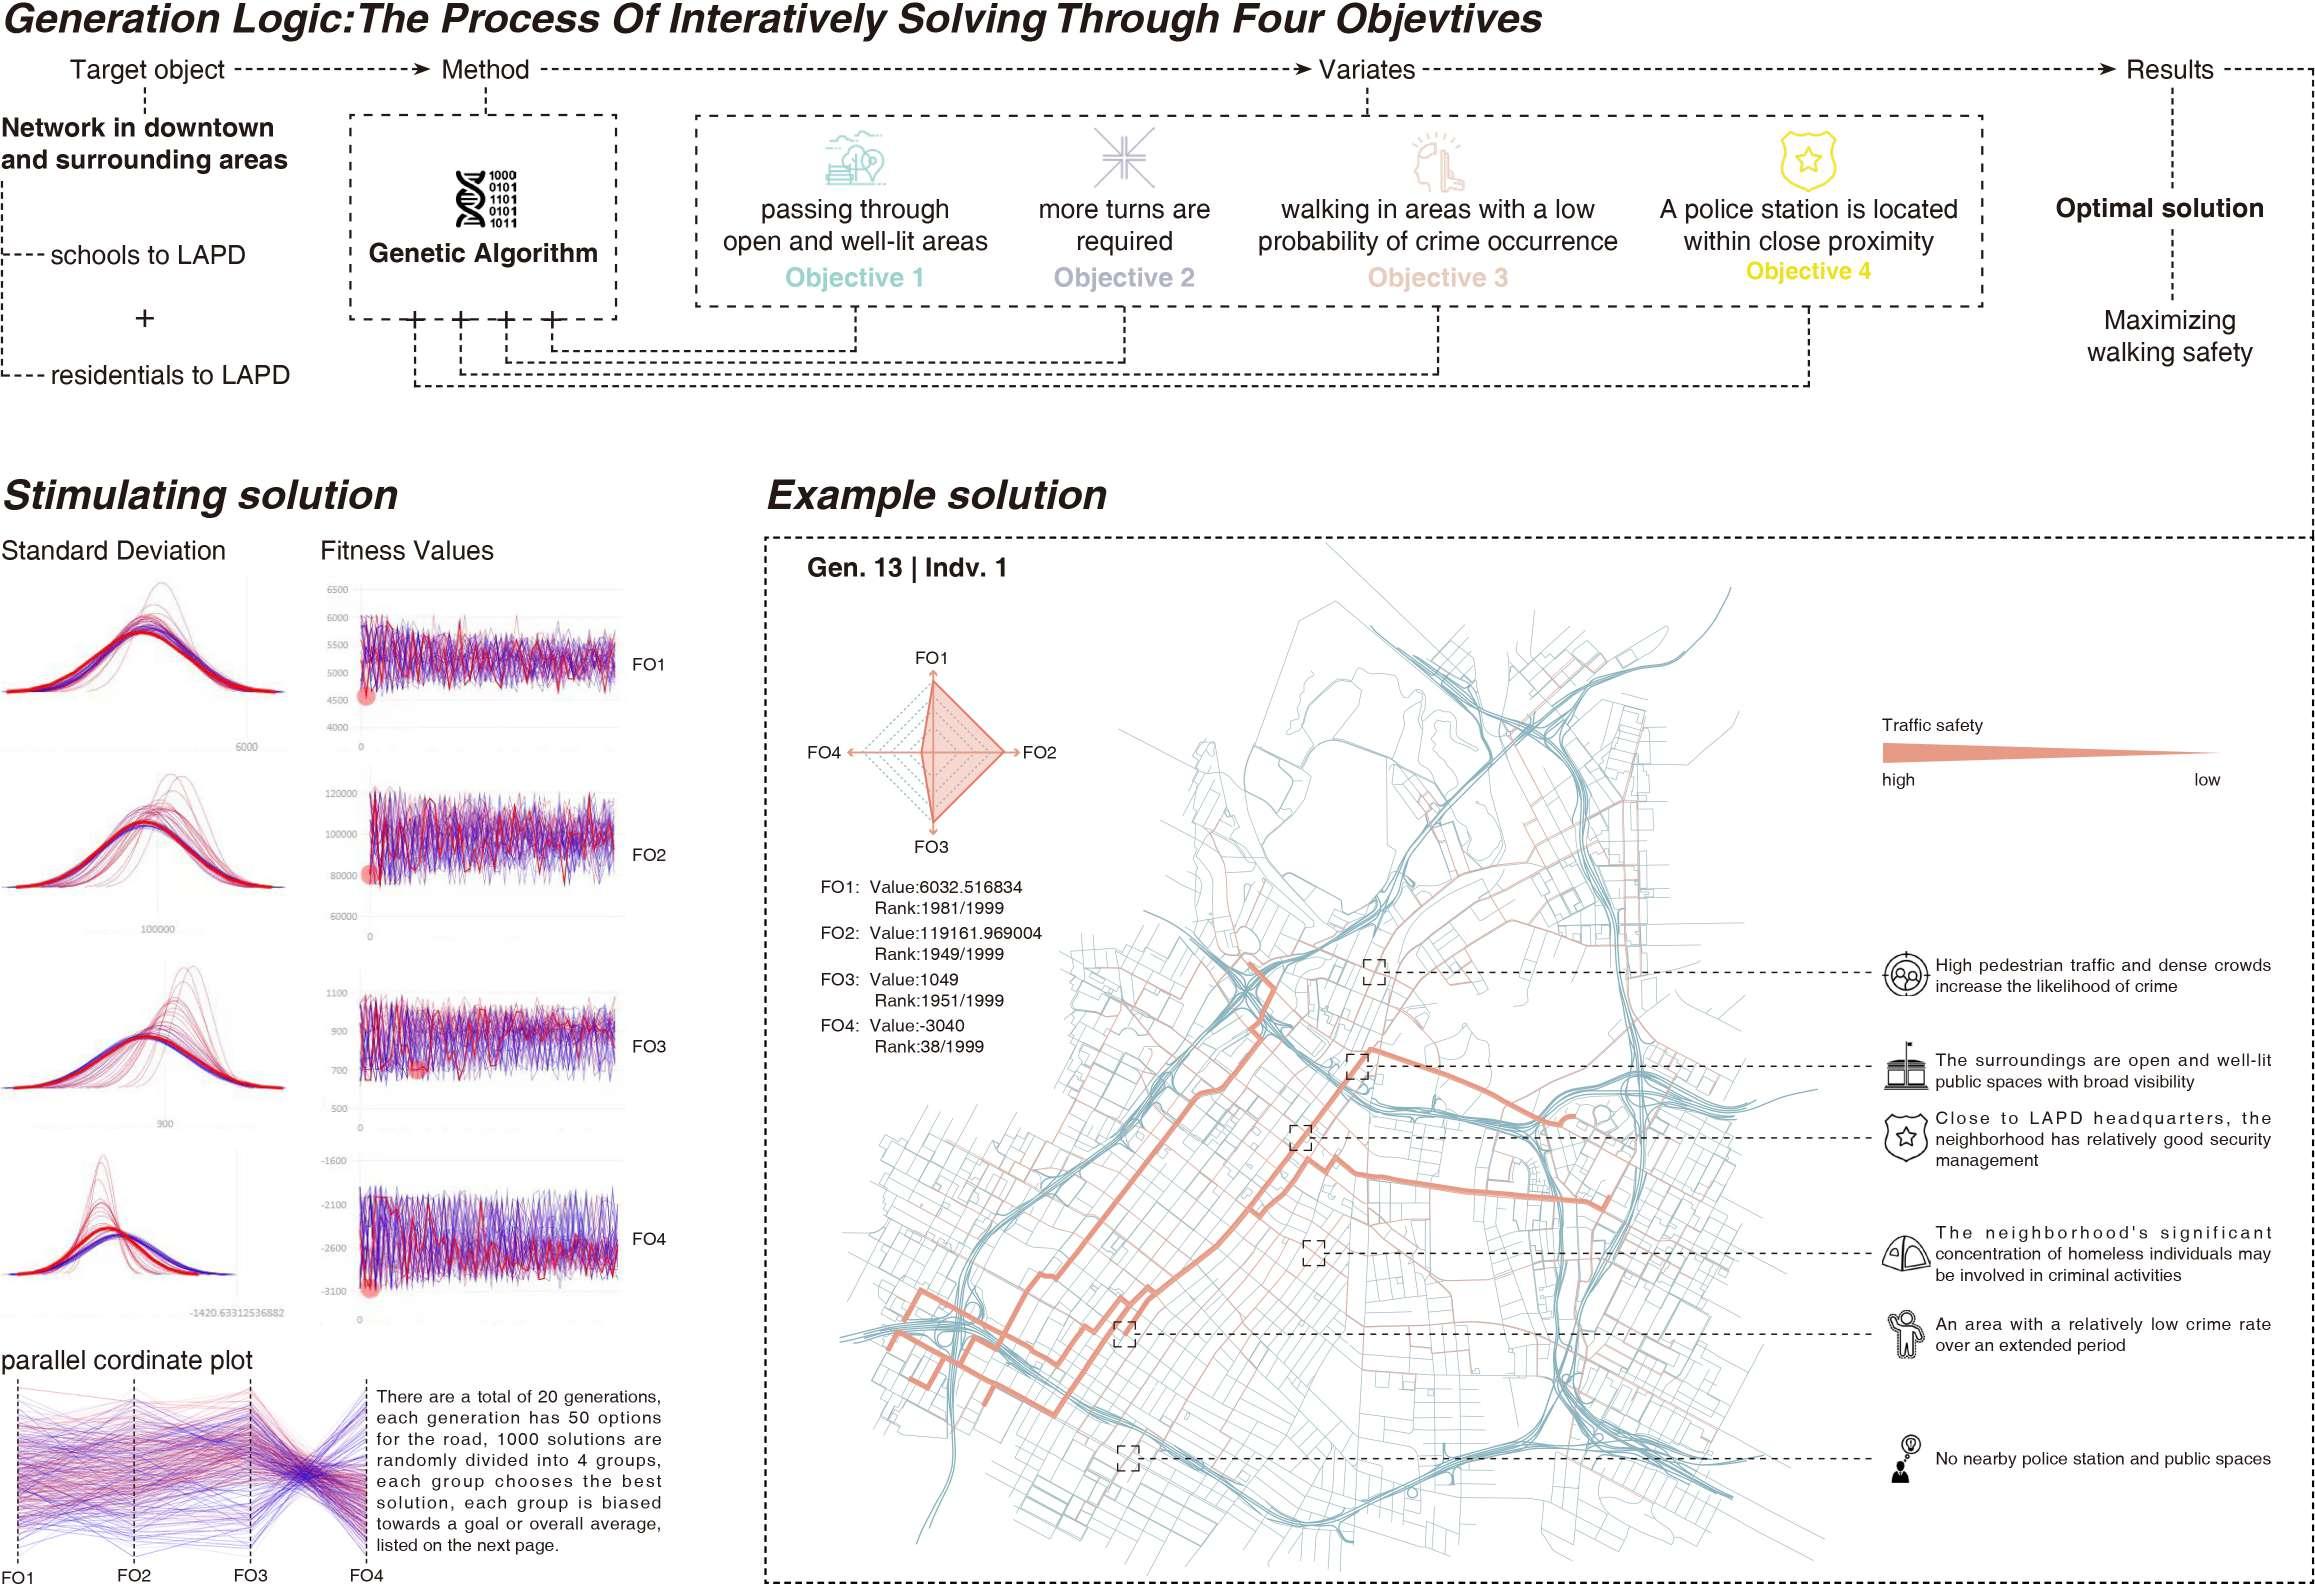
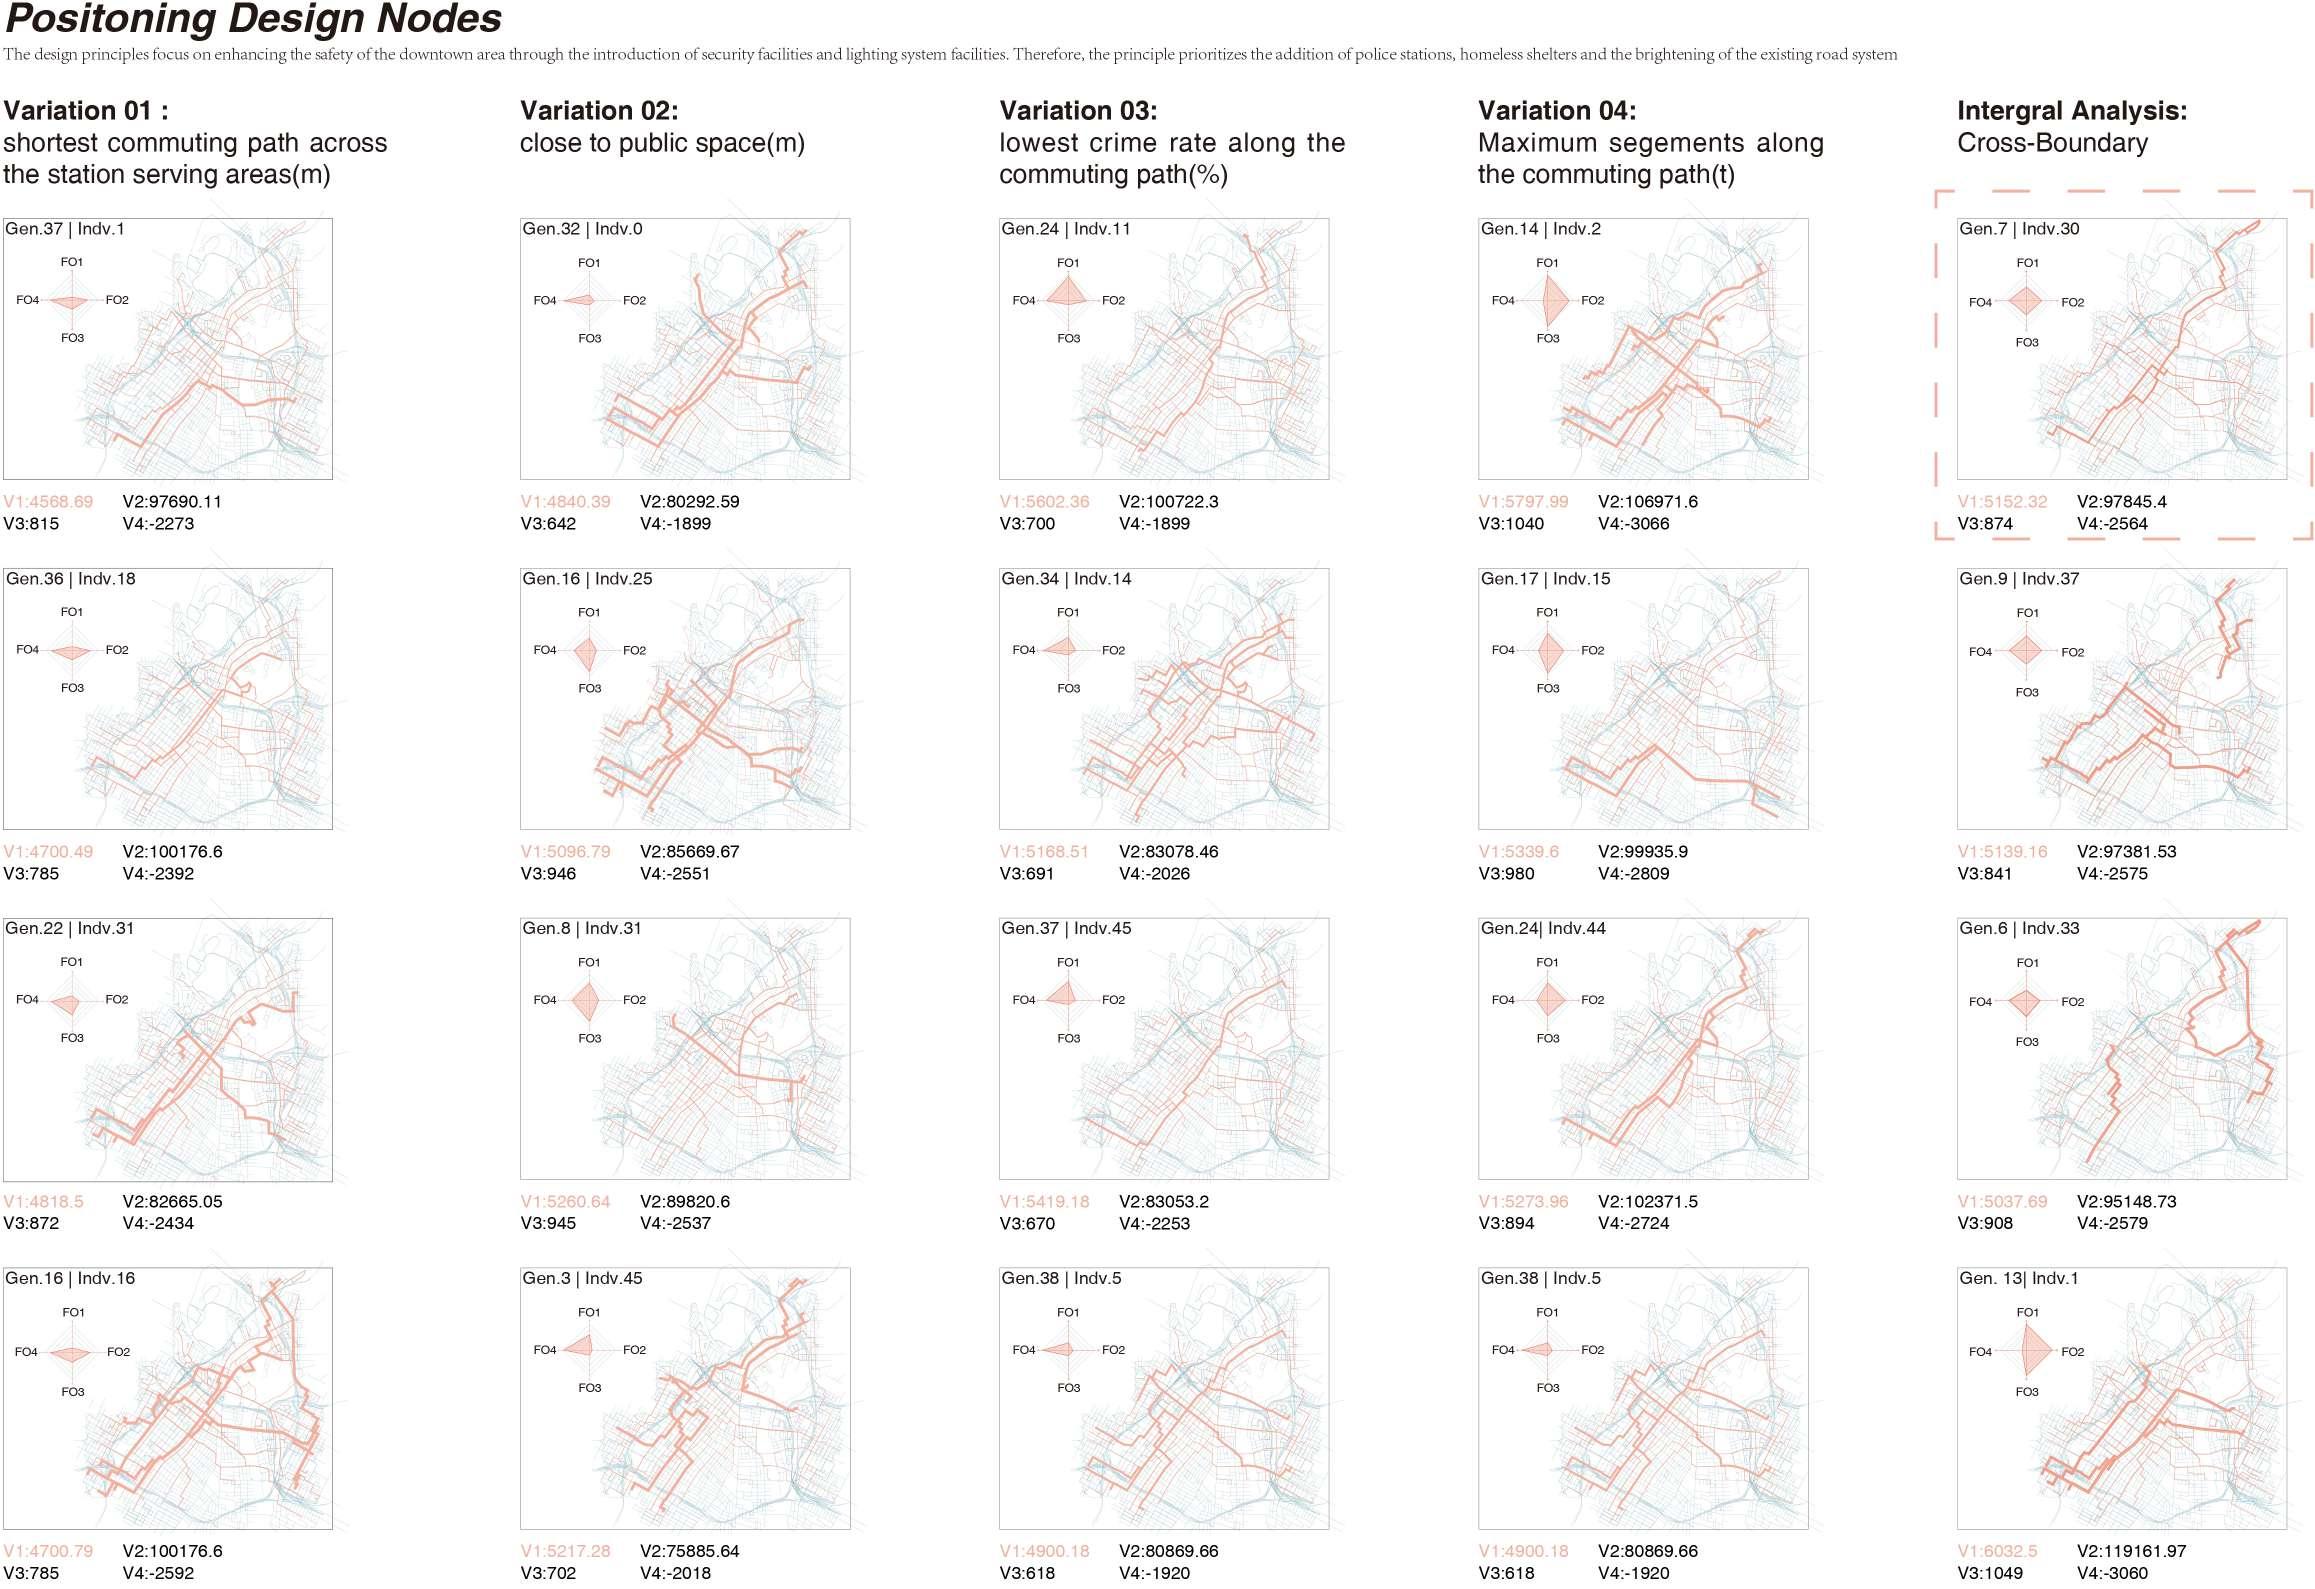
A multi-objective genetic algorithm was employed to generate optimal pedestrian routes that avoid high-risk zones. The analysis integrates diverse data sources, including crime distribution, urban lighting conditions, and the spatial locations of police stations and public spaces. Based on this, the project proposes spatial strategies such as optimizing security infrastructure, improving lighting systems, and implementing targeted interventions at critical nodes.
03 WEIGHING THE LAND
GIS-Based Evaluation of Environmental Carrying Capacity and Development Suitability
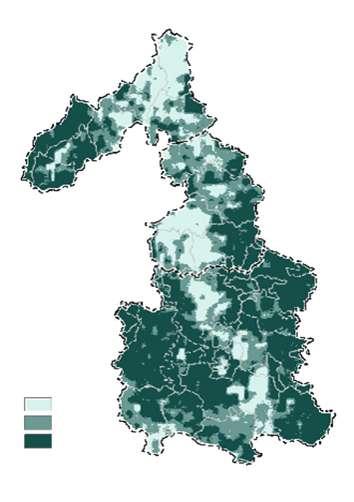
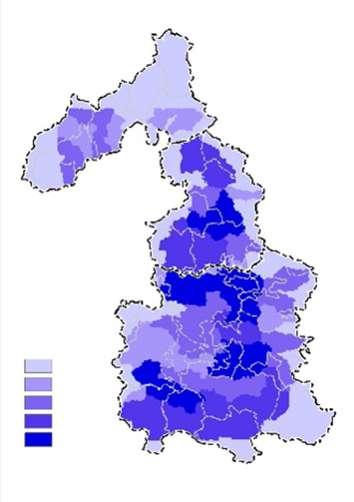
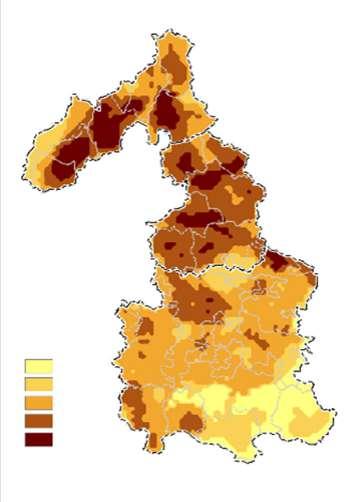
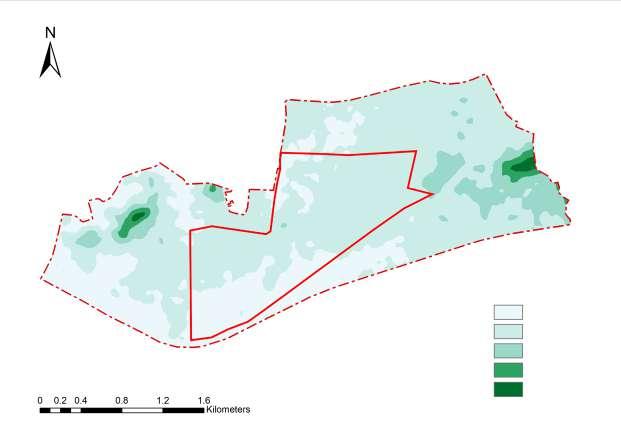
This project supports the territorial spatial planning of three western townships in Lancang County, Yunnan Province, through a GIS-based dual evaluation of environmental carrying capacity and development suitability. The analysis integrates ecological protection, agricultural production potential, and urban construction suitability. By combining data on natural resources, climate, hazards, and ecological functions, the study identifies critical ecological zones, limited areas suitable for farming, and highly constrained urban development zones. The results inform zoning strategies such as ecological redlines, farmland protection, and optimized construction layouts.
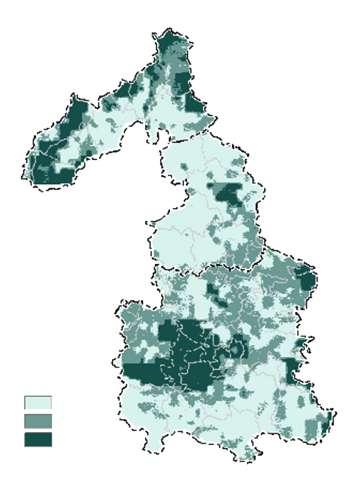
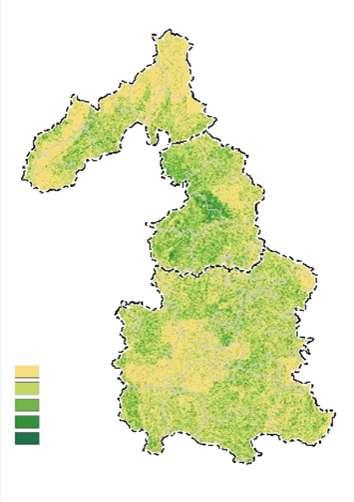
Evaluation of Ecological Conservation Importance
This project is part of the "Evaluation of Resource and Environmental Carrying Capacity and Territorial Spatial Development Suitability" in the master plan for three townships in western Lancang County. The first phase focuses on evaluating the importance of ecological protection, aiming to identify key ecological functional and fragile areas to support the delineation of ecological redlines and spatial layout optimization.
The analysis is based on two dimensions: ecological service functions and ecological sensitivity. The service function indicators include water conservation, soil retention, and biodiversity, evaluated using basic data such as NPP, slope, soil erodibility, temperature, and elevation. The sensitivity indicators assess the region’s response to external disturbances, using rainfall, topographic relief, vegetation cover, and soil erodibility to model soil erosion sensitivity.
After individual scoring of each indicator, matrix analysis was used to standardize values, assign weights, and apply linear weighted overlay to generate the final ecological protection importance scores.
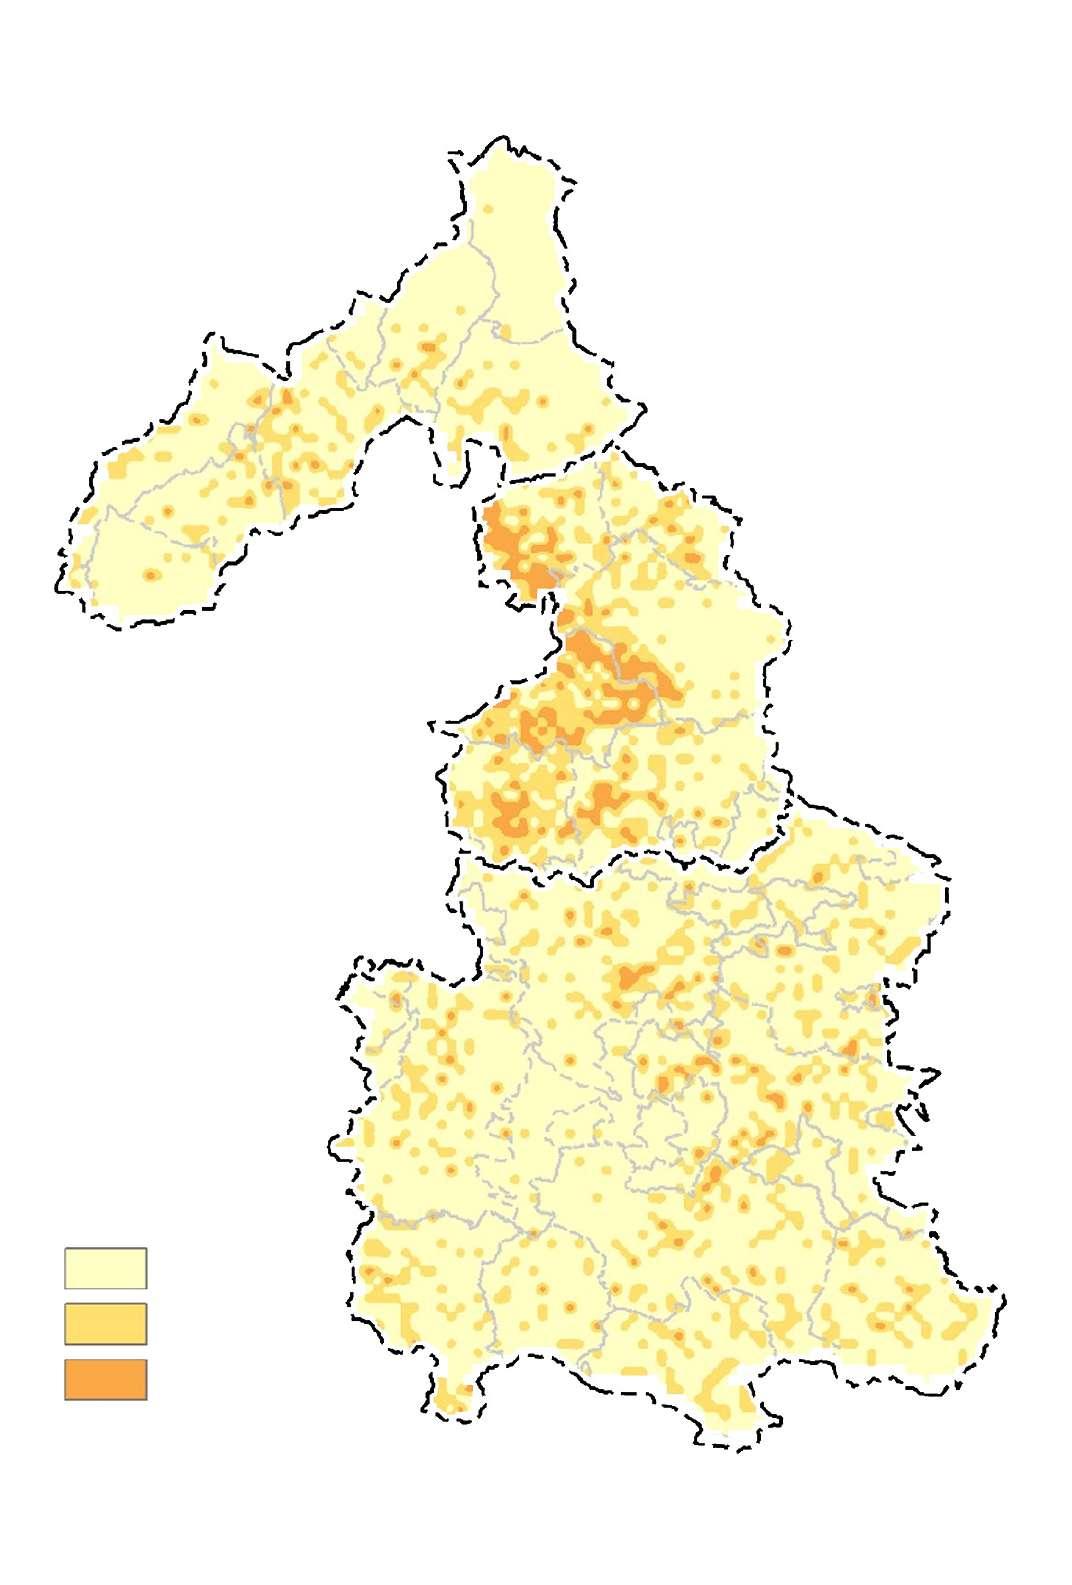
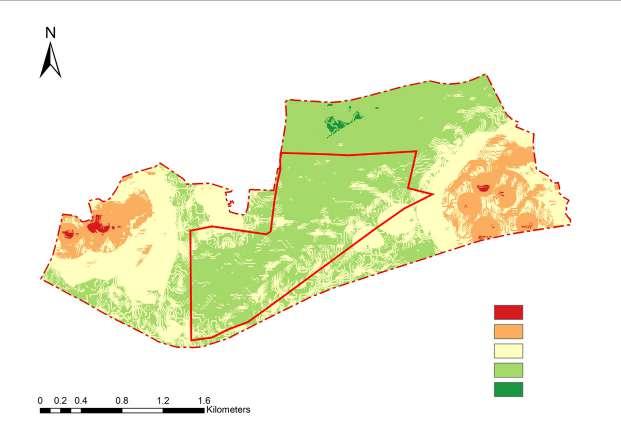
Results show that areas classified as “extremely important” account for 66.3% of the study area, mainly concentrated in the northern mountains and southern river valleys.
Individual Scoring
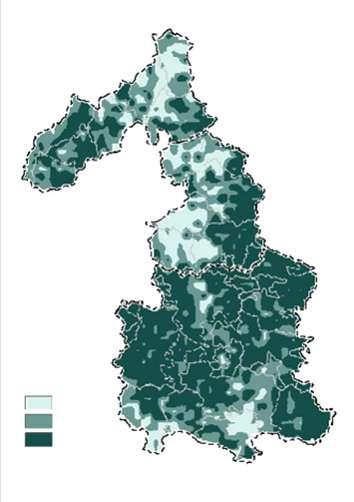
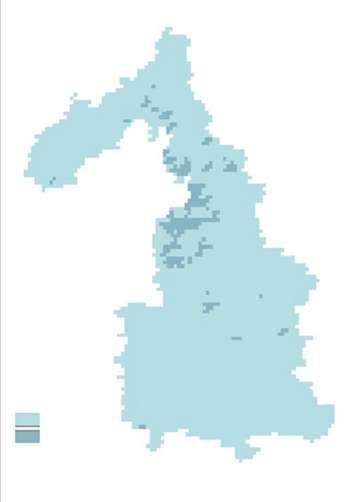
Evaluation of Agricultural Production Suitability
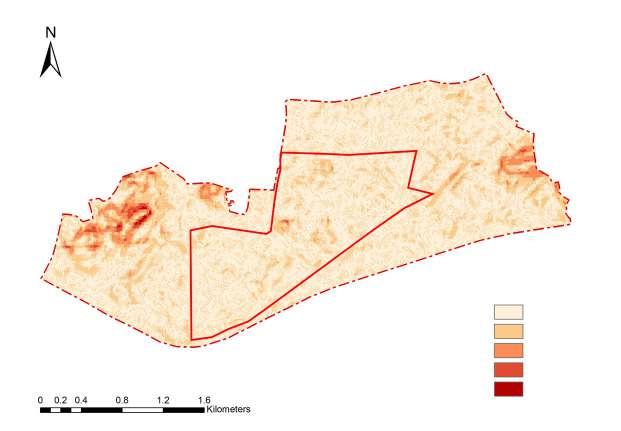
This section presents the Agricultural Production Suitability Evaluation, which aims to identify areas within the region with potential for agricultural development, thereby providing a scientific basis for agricultural spatial planning and farmland protection.
The evaluation is based on four categories of indicators: land resources, water resources, climate, and meteorological disasters. The data used includes terrain slope, organic matter content, and soil thickness for land resources; multi-year average precipitation and evapotranspiration for water resources; temperature and accumulated temperature for climate conditions; and data from surrounding weather stations on rainfall, temperature, and wind speed for disaster assessment.
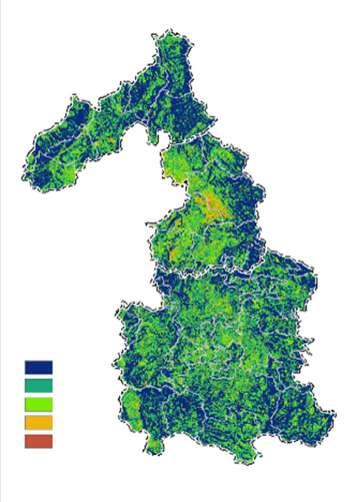
After conducting individual evaluations for each indicator, matrix analysis was applied to standardize and weight the indicators, resulting in a composite map showing the overall agricultural suitability. The results indicate generally low suitability for agricultural production across the region, with 79.2% of the area classified as 'unsuitable' and only 5.0% deemed 'suitable', primarily concentrated in the southeastern part, where the terrain is relatively flat and resource conditions are more favorable. This analysis provides technical support for future calculations of cultivated land quotas and the designation of permanent basic farmland.
Individual Scoring
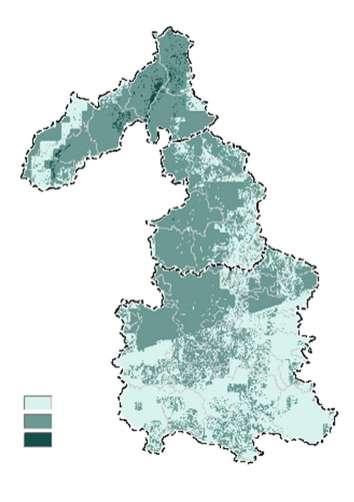
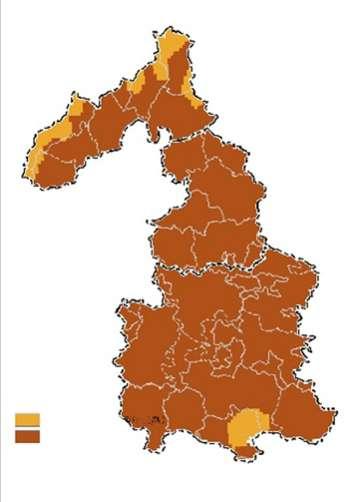
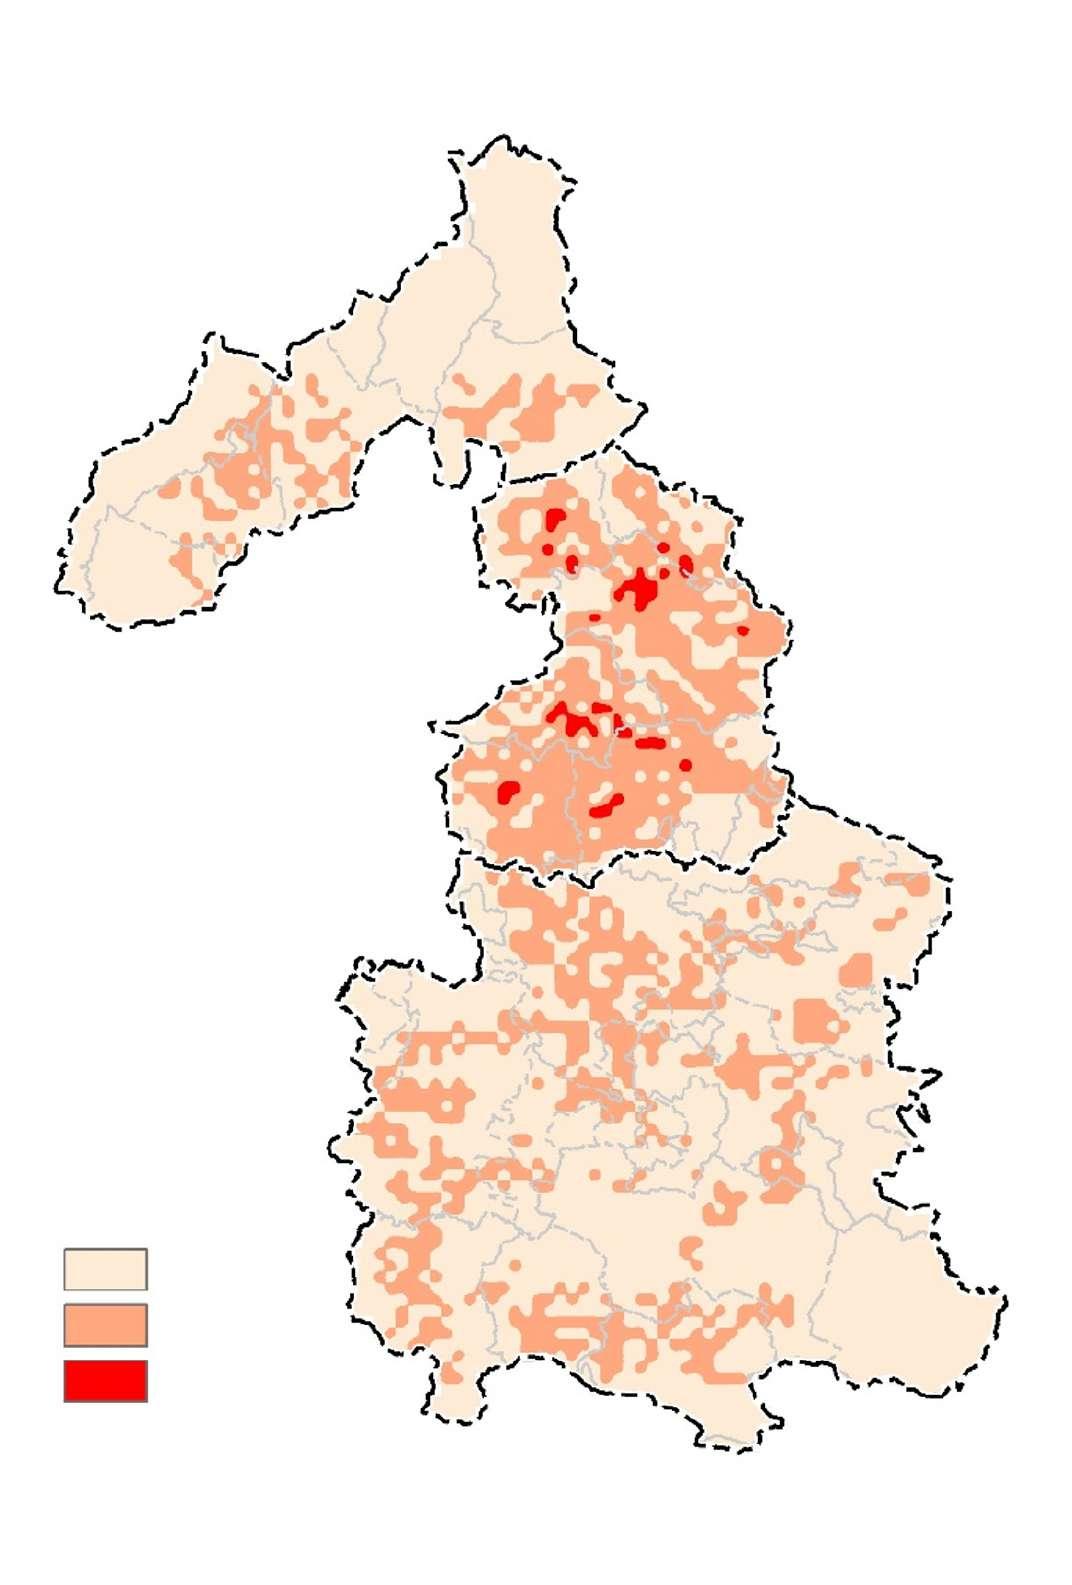
Evaluation of Urban Construction Suitability
This section presents the “Urban Construction Suitability Evaluation,” which aims to identify spatial areas suitable for urban development. The evaluation provides a scientific basis for optimizing urban spatial structure and guiding land development intensity.
The assessment is based primarily on evaluations of land and water resources, and is further refined by incorporating multiple factors including locational advantages, disaster risk, environmental quality, and climate conditions. Specific indicators include topographic relief, water supply capacity, seismic activity, average wind speed and calm days, as well as temperature and humidity levels. After standardizing all indicators, a matrix analysis combined with weighted overlay was used to generate a graded map of urban construction suitability.
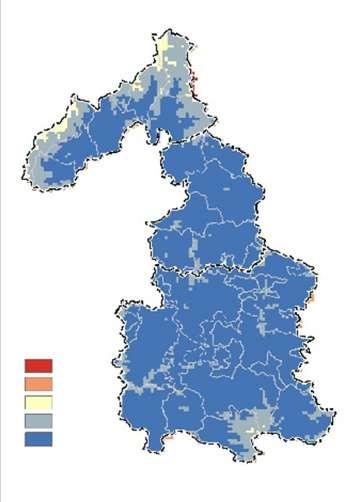
The results show that overall suitability for urban construction in the region is relatively low. About 70.5% of the area is classified as “unsuitable,” while only 1.04% is considered “suitable.” The suitable areas are primarily concentrated in the southeastern hilly basin with relatively flat terrain and favorable resource conditions. This outcome provides a scientific foundation for future urban land allocation and the delineation of growth boundaries.
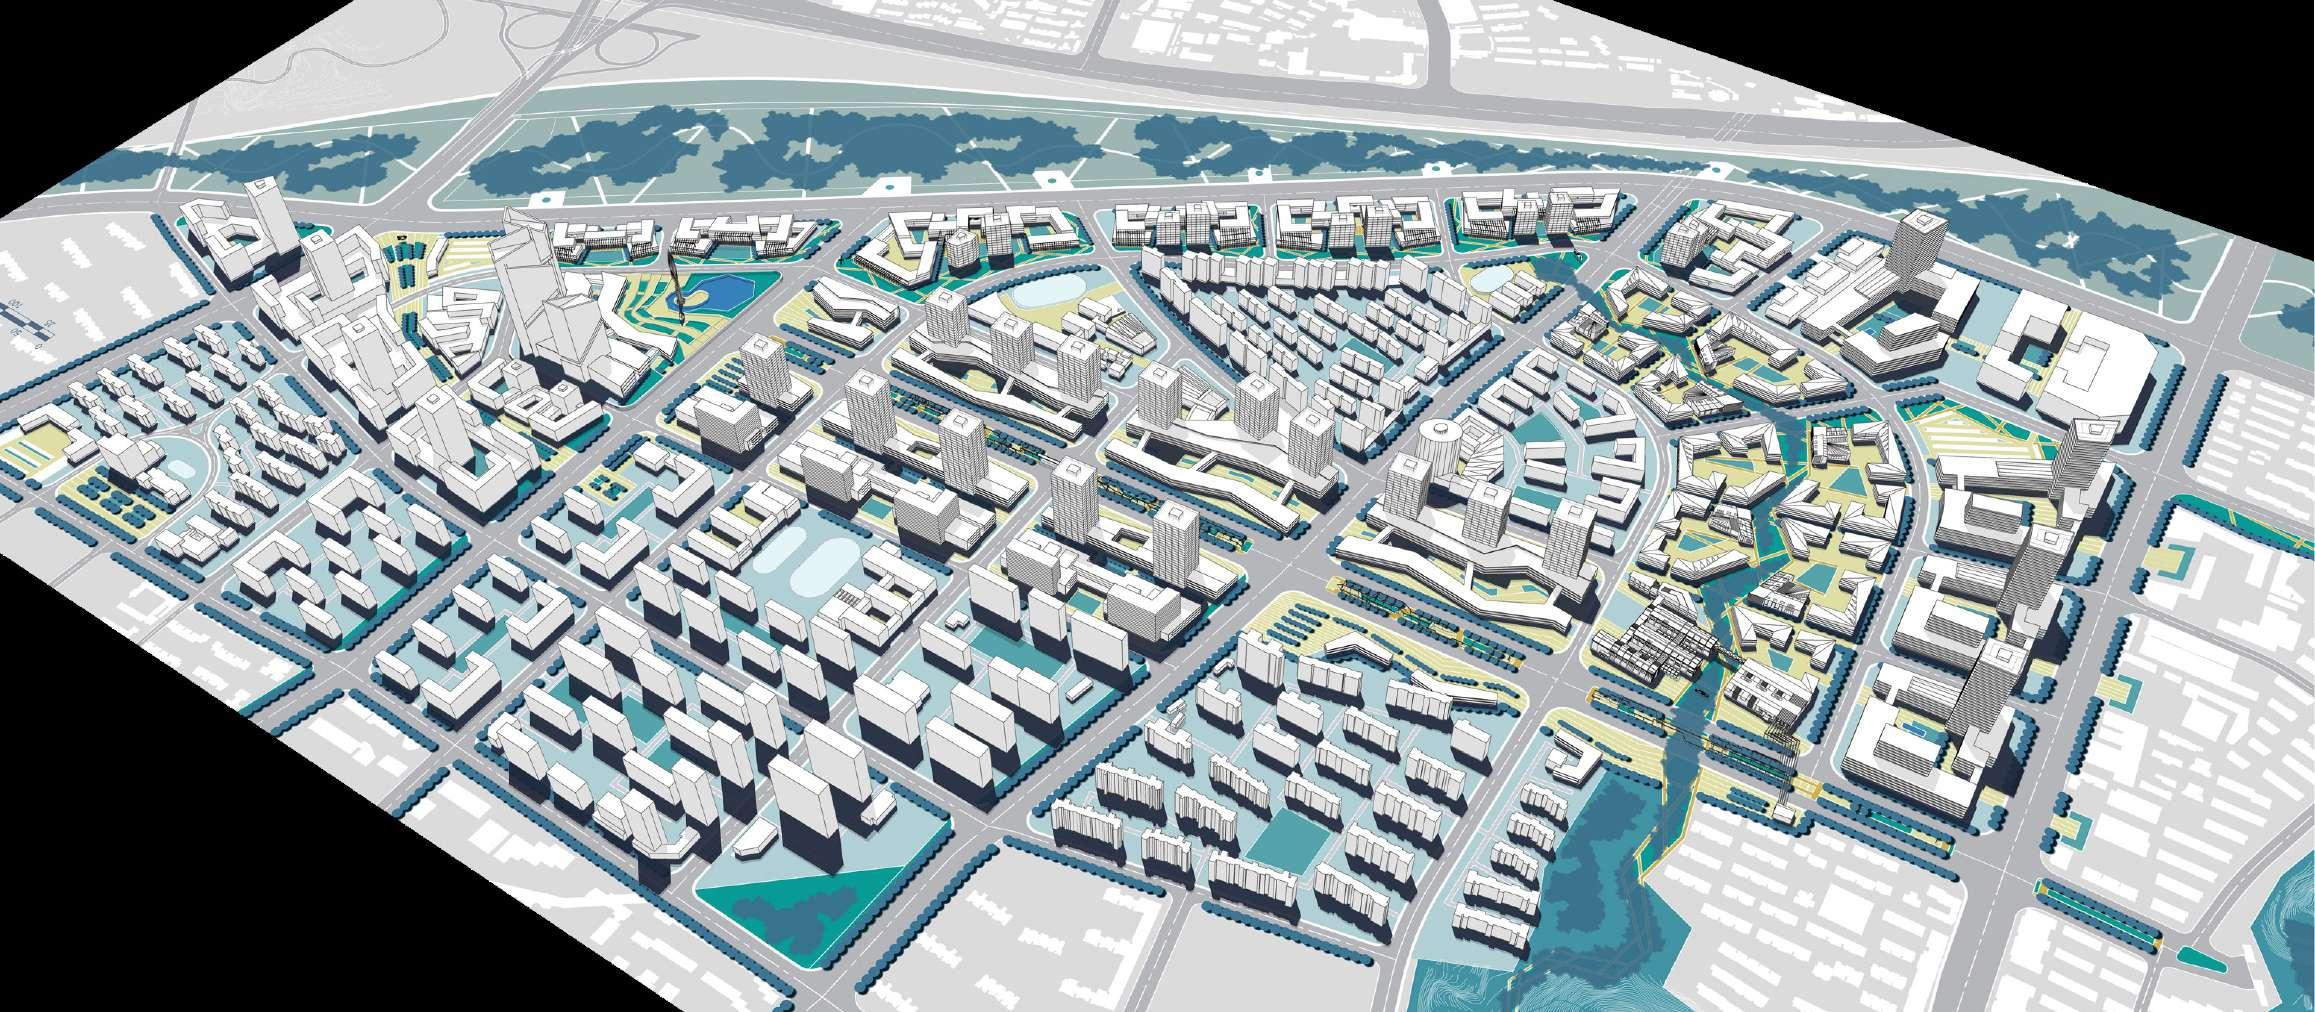
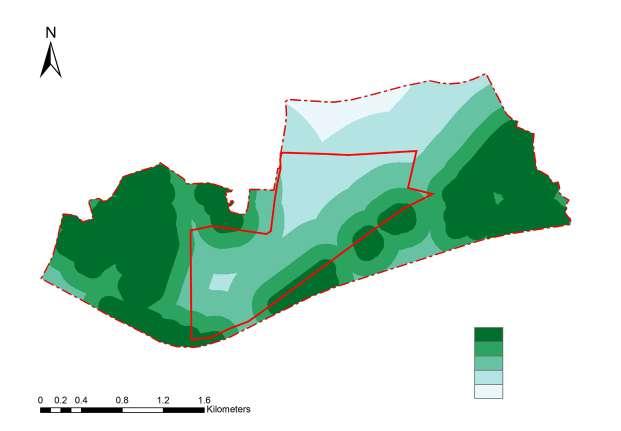
This project focuses on a GIS-based ecological sensitivity analysis to support the urban design of a selected site. By evaluating key environmental factors such as elevation, slope, aspect, and proximity to water bodies and green spaces, the study identifies areas of high ecological vulnerability. Each factor is weighted based on its ecological impact, and results are visualized using GIS to generate a comprehensive sensitivity map. The findings serve as a foundation for spatial organization and land-use decision-making, ensuring environmentally responsible development and guiding the formulation of an ecologically sound urban design strategy.
Urban Design Based on GIS Ecological Sensitivity Analysis
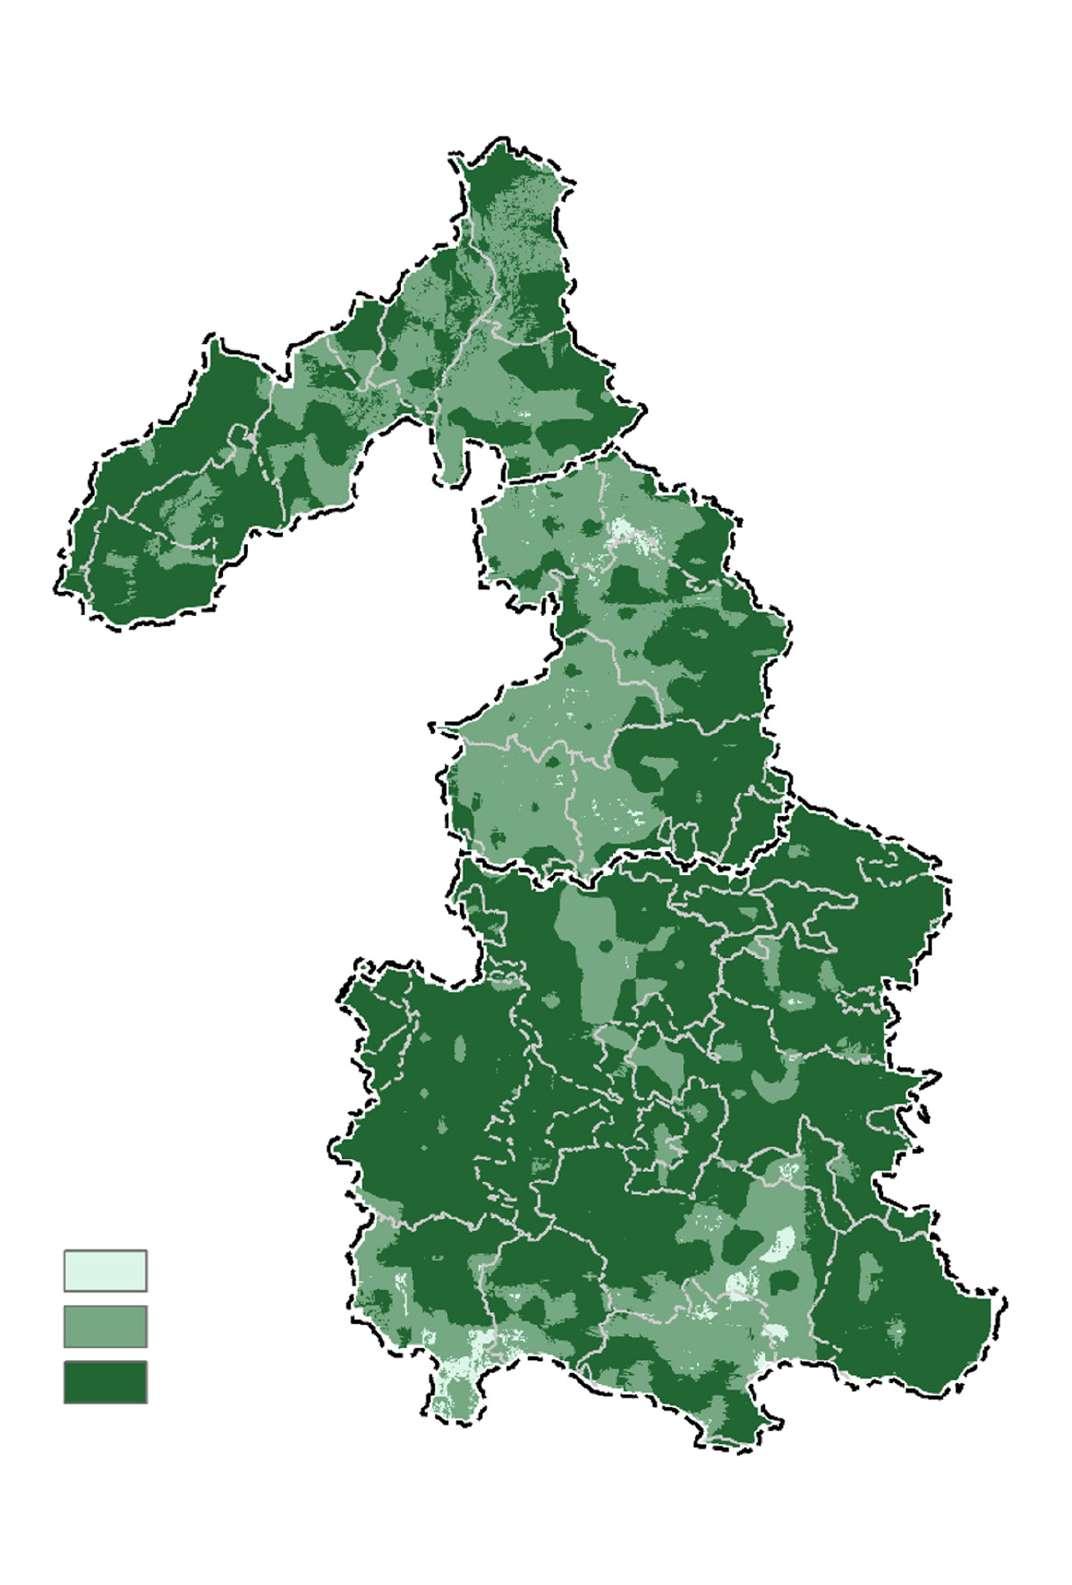
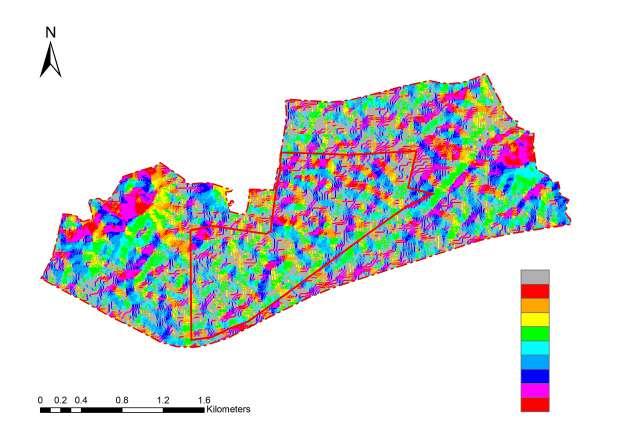
Ecological Sensitivity Analysis of the Site
Final Result of Ecological Sensitivity
This project conducts an ecological sensitivity analysis for the selected site of an urban design proposal, aiming to identify ecologically sensitive areas and provide a scientific basis for spatial layout and land-use decisions to ensure the environmental sustainability of urban development.
The analysis considers five key factors: elevation, slope, aspect, Euclidean distance to water bodies, and Euclidean distance to green spaces. Each factor is classified and scored based on its level of ecological sensitivity, and the results are combined using weighted overlay analysis. The weights are assigned according to the relative importance of each factor's impact on the ecosystem, with spatial visualization carried out using GIS tools.
The analysis highlights areas with high ecological sensitivity, which should be prioritized for protection or excluded from future development. These findings support a more scientifically informed and ecologically responsible approach to urban spatial planning.