

•
•
•
•
•
•





•
•
•
•
•
•


• 30 successful M&A transactions since 1997.
• Experienced, dedicated team with strong track record.


• Significant value creation through synergies and post-merger integration process.
• Financial discipline and accelerated deleveraging capacity.


Through the years we have developed a successful business that we continue to strengthen through:


• Deep consumer knowledge, innovation, and brand equity to exceed changing consumers’ needs.


• Execution with excellence and efficiency to deliver a winning value proposition.
• Margin Expansion based on revenue growth, costsaving initiatives, portfolio optimization, and leveraging on scale.



Sigma
Record quarterly Revenue driven by double-digit growth in Mexico, the U.S. and Latam year-on-year
3Q22 EBITDA down 14% year-on-year due to inflationary cost pressures, mainly affecting operations in Europe
Net Debt to EBITDA Ratio in line with long-term target of 2.5 times
Record quarterly Revenue driven by volume growth and price management amid inflationary cost pressures
Mexico
Second highest third quarter EBITDA, down 6% versus record 3Q21 figures
Highest third quarter Foodservice Revenue and EBITDA, up 21% and 35%, respectively, year-on-year
Europe
Euro-denominated 3Q22 Revenue up 12% year-on-year, driven by double-digit increase in average prices and slight volume growth 3Q22 EBITDA negatively impacted by rising energy costs and currency depreciation, among other unexpected inflationary pressures, as well as a lower Fresh Meats business contribution
U.S.
Latam
Solid 3Q22 performance highlighted by year-on-year growth in Volume (+5%), Sales (+14%), and EBITDA (+4%)
Record Revenue driven by higher prices in response to cost increases, and a sustained recovery in the Foodservice channel


15.2 14.6 12.4 1Q 2Q 3Q 4Q
15.2 13.7 13.3 13.8 14.5 13.9 13.9 2022 2021 2020 2019
1Q 2Q 3Q
4Q
Quarterly EBTIDA Margins EBITDA Margins (%) Mexico Europe US Latam 12.7 10.5 7.8 13.1 11.0 8.5 10.8 15.8 18.7 15.5 12.4 15 15.7 13.3 13.5 2.0 2.3 1.6 6.6 5.4 4.9 9 4.4 3.9 6.8 6.8 5.5 4.2 6.4 6.9 9.5 8.7 8 11 9.1 9.5 10.5 9.1 8.2 8.6 10.7 10 9.6 9.2 9.4 9.4 9.2 8.1 11.2 10.7 10.2 11.4 10.3 10.8 11.4 10.7 11 11.1 11.1 10.3 1Q 2Q 3Q 4Q 1Q 2Q 3Q 4Q 1Q 2Q 3Q 4Q
Quarterly EBTIDA Margins
11.2 10.7 10.2 11.4 9.4 9.2 8.1
11.0 9.1 9.5 10.5 9.5 8.7 8.0 36
1Q21 2Q21 3Q21 4Q21 1Q22 2Q22 3Q22 1Q21 2Q21 3Q21 4Q21 1Q22 2Q22 3Q22
U.S.
10.8 12.7 10.5 7.8 Sigma


(Thousands of pesos) (Thousands of U.S. Dollars)
III Quarter 22 III Quarter 21 III Quarter 22 III Quarter 21
Revenue 38,025,114 34,592,374 1,878,911 1,728,883
Cost of sales (28,642,644) (25,250,382) (1,415,354) (1,261,979)
Gross profit 9,382,470 9,341,992 463,557 466,904
Selling expenses (5,830,571) (5,419,603) (288,081) (270,848)
Administrative expenses (1,517,743) (1,567,208) (75,010) (78,325)
Other income (expenses), net 17,773 54,644 869 2,728
Operating profit 2,051,929 2,409,825 101,335 120,459
Financial Income 83,321 53,368 4,119 2,668
Financial expenses (647,518) (629,940) (31,986) (31,480)
Gain (loss) due to exchange fluctuation, net 98,507 18,765 4,813 921
Equity in income (loss) of associates 0 0 0 0
Profit before income tax 1,586,239 1,852,018 78,281 92,568
Income tax (694,774) (739,456) (34,391) (36,971)
Net consolidated profit 891,465 1,112,562 43,890 55,597
Profit (loss) attributable to:
Controlling interest 891,465 1,112,562 43,890 55,597
Non-controlling interest 0 0 0 0
(Thousands of pesos)
CURRENT ASSETS:
Cash and cash equivalents
(Thousands of U.S. Dollars)
Sep '22 Sep '21 Sep '22 (1) Sep '21 (2)
14,187,750 16,851,360 698,704 829,871
Restricted cash 6,500 0 320 0
Customers and other accounts receivables, net 8,724,946 6,985,005 429,678 343,987 Income tax recoverable 437,820 689,677 21,561 33,964
Inventories 19,138,313 17,431,489 942,505 858,440
Other current assets 3,028,494 583,632 149,144 28,742
Derivative financial instruments 10,224 126,197 503 6,215 Total current assets 45,534,047 42,667,360 2,242,415 2,101,219
Property, plant and equipment, net 29,771,792 32,560,357 1,466,172 1,603,485 Intangible assets, net 12,687,355 14,477,434 624,815 712,963 Right-of-use asset, net 1,846,658 2,267,329 90,942 111,658 Goodwill 12,307,546 14,267,104 606,110 702,605
Deferred income tax 2,118,237 3,285,378 104,317 161,793
Derivative financial instruments 557,481 870,128 27,454 42,851
Investments in associates and joint ventures 137,225 136,819 6,758 6,738
Other non-current assets 126,780 119,712 6,244 5,895 Restricted cash 6,500 32,500 320 1,601
Total non-current assets 59,559,574 68,016,761 2,933,132 3,349,589
CURRENT LIABILITIES:
(Thousands of pesos)
(Thousands of U.S. Dollars)
Sep '22 Sep '21 Sep '22 (1) Sep '21 (2)
Accrued interest payable 611,777 649,611 30,128 31,991 Financial Leases 460,991 591,409 22,702 29,125 Suppliers and Other Accounts Payables 28,016,242 28,305,706 1,379,716 1,393,958
Income tax payable 581,491 833,062 28,637 41,025 Provisions 66,084 114,285 3,254 5,628 Derivative financial instruments 484,241 145,546 23,847 7,168
Other current liabilities 2,645,538 76,809 130,285 3,783 Total current liabilities 32,866,364 30,716,428 1,618,569 1,512,678
NON-CURRENT LIABILITIES:
Non-current debt 45,641,712 47,807,946 2,247,718 2,354,375 Notes payables 241,770 63,096 11,906 3,107
Financial Leases 1,539,902 1,864,803 75,836 91,835
Deferred income taxes 3,853,433 3,753,204 189,770 184,832
Employees benefits 1,343,484 1,626,224 66,163 80,086
Provisions 73,459 82,815 3,618 4,078
Income tax payable 1,048,584 627,033 51,640 30,879
Other non-current liabilities 35,129 35,129 1,730 1,730
Total non-current liabilities 53,777,473 55,860,250 2,648,381 2,750,922
Total assets 105,093,621 110,684,121 5,175,547 5,450,808
Total liabilities 86,643,837 86,576,678 4,266,950 4,263,600
Total controlling interest: 18,449,784 24,107,443 908,597 1,187,208
Total non-controlling interest: 0 0 0 0
Total stockholders' equity 18,449,784 24,107,443 908,597 1,187,208
Total liabilities and stockholders' equity 105,093,621 110,684,121 5,175,547 5,450,808
(Thousands of pesos) (Thousands of U.S. Dollars)
III Quarter 22 III Quarter 21 III Quarter 22 III Quarter 21
Profit before income tax 1,586,239 1,852,018 78,281 92,568
Depreciation and amortization 1,013,042 1,109,371 50,059 55,444
Impairment of fixed assets and intangible assets (2,483) 6,177 (115) 309
Costs associated with seniority premiums and pension plans 121,560 185,168 6,006 9,255
Gain on sale of property, plant and equipment (24,269) (25,614) (1,197) (1,280)
Financial cost, net 534,325 559,867 26,393 27,977
Foreign exchange, net (98,507) (18,765) (4,813) (921)
(Increase) Decrease in customers and other accounts receivable (130,466) 552,034 (4,606) 27,610
(Increase) decrease in inventories (690,973) (677,670) (34,384) (33,829)
Increase (decrease) in suppliers and other accounts payable 843,739 (760,450) 46,302 (38,147)
Income tax paid (469,310) (107,191) (23,222) (5,358)
Other operating expenses (48,812) (241,412) (2,408) (12,076)
Cash flows from operating activities 2,634,085 2,433,533 136,296 121,552
Business acquisitions, net of cash acquired 0 730 0 37
Interest received 52,940 30,247 2,612 1,511
Acquisition of intangible assets (105,105) (161,824) (5,219) (8,086)
Acquisition of property, plant and equipment (1,120,207) (919,773) (55,361) (45,957)
Sale of property, plant and equipment 24,269 25,614 1,197 1,280
Restricted cash and other assets 19,500 24,022 956 1,198
Cash flows from investing activities
CASH
(1,128,603) (1,000,984) (55,815) (50,017)
Payments of loans and debt (19,500) (25,230) (956) (1,265)
Financial leases (177,541) (186,418) (8,773) (9,317)
Derivative financial instruments (245,037) (278,273) (12,120) (13,907)
Interest paid (412,120) (333,236) (20,489) (16,663)
Cash flows from financing activities
Net increase (decrease) in cash and cash equivalents
(854,198) (823,157) (42,338) (41,152)
651,284 609,392 38,143 30,383
Exchange gains (losses) in cash and cash equivalents 64,457 176,302 (13,555) (11,799)
Cash and cash equivalents at the beginning of the period 13,472,009 16,065,666 674,116 811,287
Cash and cash equivalents at the end of the period 14,187,750 16,851,360 698,704 829,871


Dutch TTF (Title Transfer Facility), is a virtual trading point for natural gas in Netherlands and is the primary gas pricing hub for the European market


We commit to establishing conditions that motivate and make it easier for people to adopt habits that improve their quality of life.
We promote healthy lifestyles through our innovative and high-quality products..


• Lead and authorize Strategic guidelines on ESG
• Review ESG progress on a quarterly basis
• Present ESG initiatives and share progress made on existing projects to the Executive Committee and Advisory Board
• Channel feedback to and from the different corporate governance bodies
• Develop the Sustainability Strategy.
• Establish priorities, commitments and goals
• Implement data intelligence systems
• ESG reporting to stakeholders
• Develop decarbonization, water stewardship, circular economy and responsible sourcing roadmaps.
• Evaluate new technologies, and provide technical and strategic support to business units
• Raise awareness and lead change management efforts on ESG
• Topic-specific experts for each Commitment or Goal
• Align local efforts to company-wide Goals
• Consolidate data and information used in the decision-making process
• Gather information on progress made by local teams
• Support local team in the implementation of initiatives related to their expertise
• Benchmark and cross fertilization
• Execute ESG roadmaps locally
• Comply with and improve sustainability governance
• Report progress and achievements
• Capex deployment




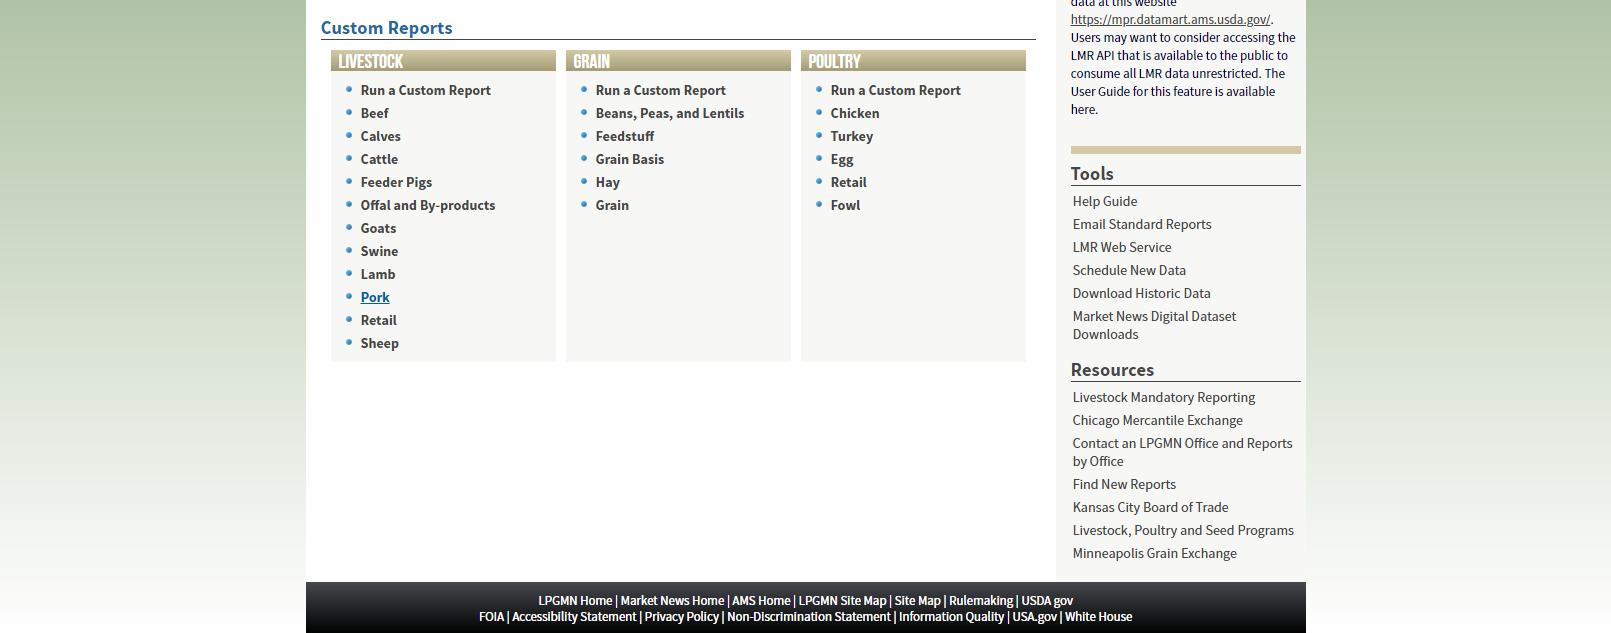
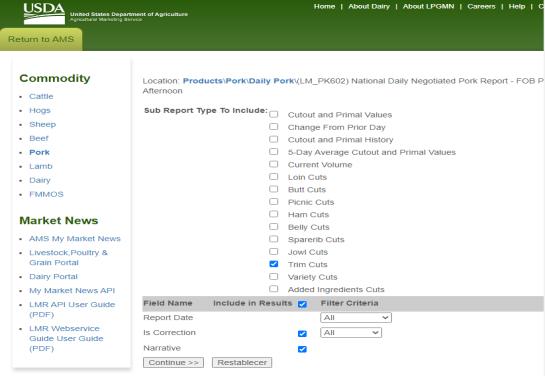
This appendix provides a detailed explanation on how to obtain key raw material price references from public sources. This is not intended as an exhaustive list of the company ´ s raw materials nor is it a direct representation of the company ´ s actual costs.
• USA – USDA PM Ham, 23-27# Trmd Sel Ham
• USA – USDA Pork Trimmings - 42% Trim Combo, FOB Plant
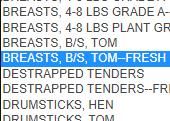
• USA – USDA Chicken - MSC, Some Skin, 15-20% Fat, Fresh
• USA – USDA Turkey - MST, Some skin, under 20% fat, Fresh
• USA – USDA Turkey - Breast, Young Tom, Boneless & Skinless, Fresh
• USA – USDA Turkey - Thigh Meat, Boneless & Skinless, Fresh
• USA – USDA Milk Class III
• USA – USDA Block Cheddar Cheese 40lb


