Apartment Supply Pipeline
A 2025 analysis of apartment dwelling supply in a focused South East Queensland
PRESENTED BY

Disclaimer: This report has been produced based on information provided to the Institute. This report has been prepared for the general information of the Institute's members and stakeholders only. However, the Institute is not liable to any person or entity for any damage or loss that has occurred, or may occur, in relation to that person or entity taking or not taking action in respect of any representation, statement, opinion or advice referred to herein.
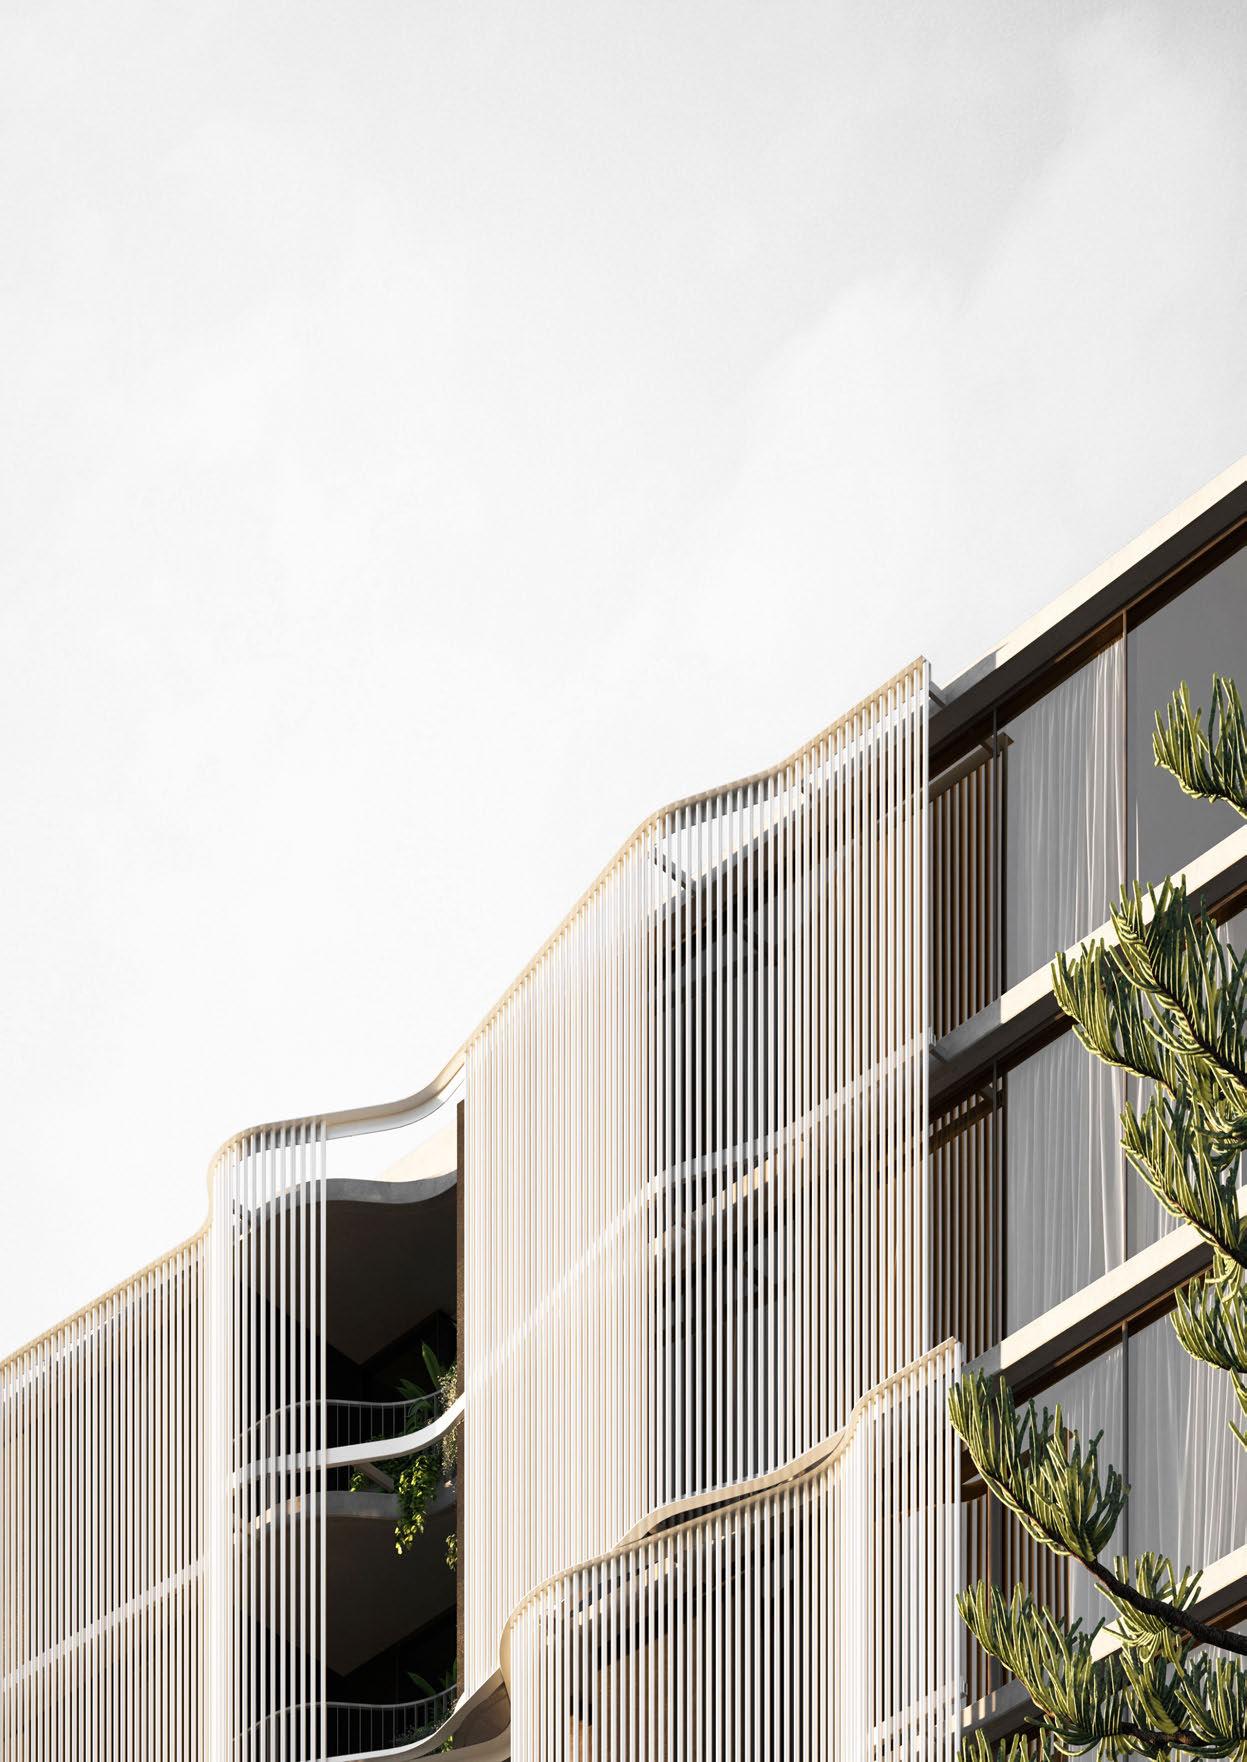
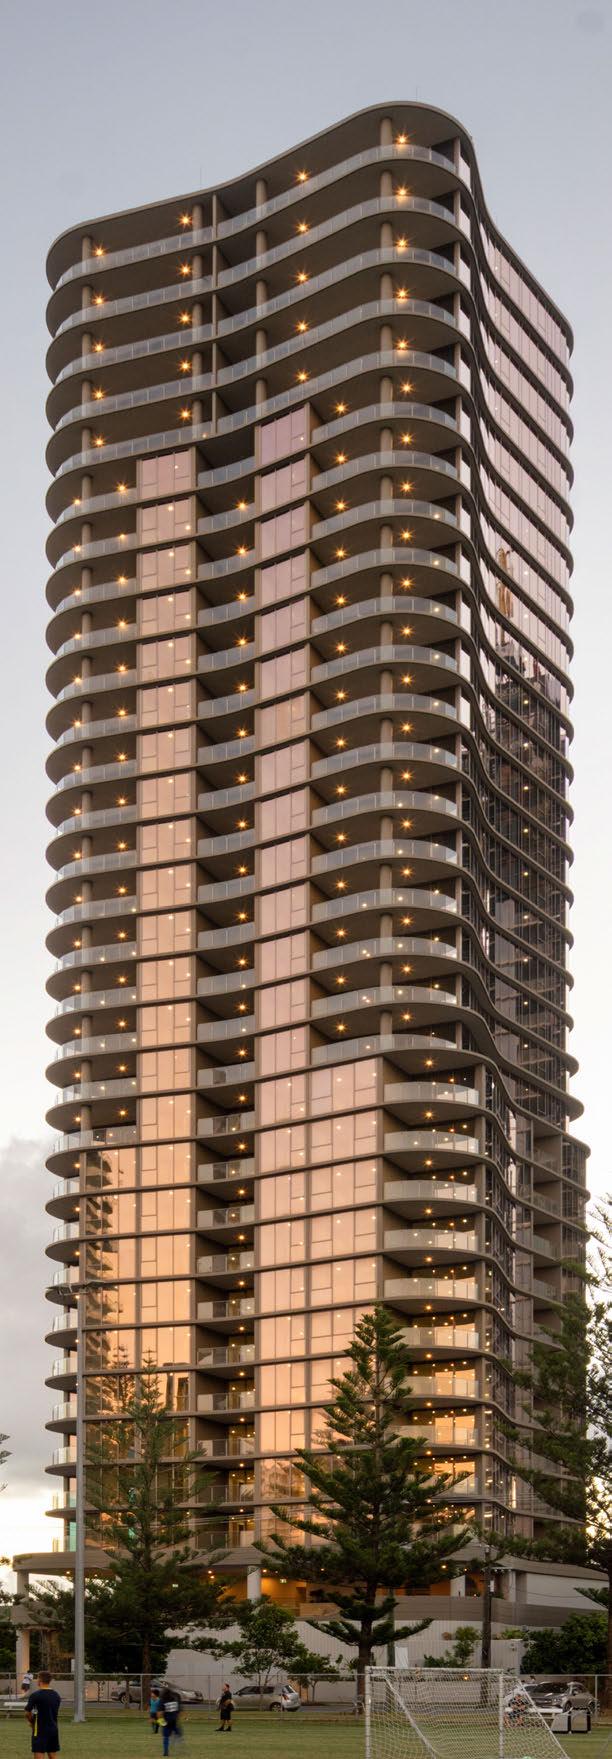
Cover image credit: Cala Dei by Spyre
ACKNOWLEDGEMENTS
The results published within this report would not be possible without the assistance and support from the following individuals and organisations.
Presenting Partners

Research Partner

Thanks to
Project Control Group for guiding the methodology and analysis
UDIA Queensland Board for guiding and supporting the research
UDIA Queensland SEQ Branches for guiding LGA-specific analysis and workshops
Technical Workshop Participants for volunteering their time to guide and provide expert advice on land supply viability. Workshop attendees included:
Rob McCready – Altum
Michael Hurley – Aria Property Group
Nick Bailey – DTS Planning
Scott Ullman – Frasers Property Australia
Mark McMahon – Gardner Vaughan Group
Ben Johnson – Keylin
Matt Hills – Lewis Land
Ben Crossan - Marquee
John Atkinson – McNab
Sam Crossin - McNab
Bruce Wortley – Mosaic Property Group
John Pradella – Pradella Property Ventures
Brent Thompson – Siera
Michael Ryall – Spyre Group
Charlie Daoud – Traders in Purple
Trellis
ABOUT THE RESEARCH
The Apartment Supply Pipeline research has been developed to give industry, government, and the community a shared understanding of the current and potential apartment supply across South East Queensland (SEQ). The research provides a clear picture of how current apartment projects are progressing, and where future supply will come from. This study brings together a comprehensive view of the apartment pipeline, categorised by timeframe for potential delivery:
Short-term (1-3 years)
Supply that is most likely to be delivered in the immediate future, including projects under construction. This timeframe reflects dwellings that are effectively ‘on their way’ to market.
Medium-term (3-6 years)
Projects that have development approval or are progressing through the approvals process but have not yet commenced construction. They represent the next wave of potential supply once current projects are completed.
The geographic scope of this research includes a defined region representing the largest and most active apartment markets within SEQ. This area includes key precincts within the Brisbane, Gold Coast, and Sunshine Coast Local Government Areas (LGA), as well as Redcliffe within Moreton Bay. This focused region represents the key activity areas for new apartment projects, representing upwards of 90 percent of total apartment supply delivered in SEQ.
By combining ‘top-down’ data (development activity and GIS site analysis) with ‘bottom-up’ data (industry intelligence), this research delivers a comprehensive overview of apartment supply. It highlights not only what is already in motion but also the realistic pipeline of projects that could shape SEQ’s housing future over the next decade.
Methodology
Long-term (6-10 years)
Sites that have been identified as suitable for apartment development but are yet to seek approvals. This category includes an assessment of future development sites based on zoning, site characteristics, and market feasibility, validated through technical workshops with industry experts.
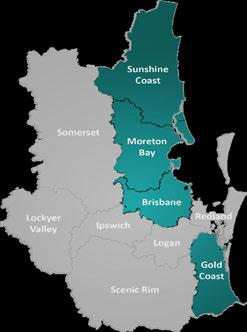
Focused SEQ study area
The research combines development activity data with industry insight to build a forward-looking view of the apartment supply pipeline for the focus region of Brisbane, Gold Coast, Sunshine Coast, and Moreton Bay over the next decade. The process involved mapping current projects, analysing future opportunities, and applying realistic delivery assumptions to estimate the number of apartments likely to be completed within the next 10 years.
Project scope and size
The analysis focuses on multi-unit residential developments of 15 apartments or more, which aligns with the scale of projects materially contributing to housing supply targets under ShapingSEQ . Some smaller projects (below 15 dwellings) were included where they were captured within Urbis’ Apartment Essentials database. The data included in this report extends to June 2025.
When referring to ShapingSEQ targets, this report specifically considers the attached dwelling targets for each relevant local government area (LGA), as outlined in ShapingSEQ 2023 . These targets provide the benchmark for assessing the forward supply pipeline across the Brisbane, Gold Coast, Sunshine Coast, and Moreton Bay regions.
Development activity data
The first step was to compile and analyse data on projects already in the planning and construction pipeline. This included three key categories:
▪ Applications: projects currently in the development application process with a lodgement date on or after 1 January 2023
▪ Approvals: projects that have received development approval on or after 1 January 2023, including those that have received an extension approval during this period
▪ Construction / Presales: projects actively marketing apartments for presale or under construction. There was no approval date cutoff applied to this category.
In Brisbane and the Gold Coast, this analysis drew on Urbis’ Apartment Essentials database, a quarterly monitor of apartment projects. Supplementary data sources were used to capture activity in the Sunshine Coast, Moreton Bay (Redcliffe Peninsula), and middle-to-outer Brisbane areas.
Industry insight: Passive supply
To capture the potential future supply of apartments, the research also considered sites that do not yet have an approval or recorded activity but could reasonably be developed within the next 10 years. This stage involved:
▪ Applying zoning, site area, and environmental constraints to identify developable sites
▪ Identifying opportunities for adjoining lots to be amalgamated into larger, more viable development sites
▪ Applying building parameters such as setbacks, allowable heights, and efficiency ratios to estimate potential yields (Appendix 2).
These findings were then reviewed through technical workshops with industry participants. This step provided insight into commercial feasibility, expected development timeframes, and the realistic highest and best use of sites.
Approval conversion
Not all approved projects proceed to construction. To reflect this reality LGA-specific conversion rates were calculated and applied to approval data. The application of LGA-specific conversion rates allows for a more accurate estimate of the forward pipeline by considering the proportion of projects likely to be delivered.
LGA-specific conversion rates were calculated using approval and construction data from the last three years, ensuring the conversion rate is calculated using data relevant to current conditions.
Glossary
Focused SEQ Refers to the study area of the research being Brisbane City Council, City of Gold Coast Council, City of Moreton Bay, and Sunshine Coast Regional Council.
ShapingSEQ
Refers to the Queensland State Government’s South East Queensland Regional Plan 2023. The full plan can be accessed here
AT A GLANCE
Construction costs are putting pressure on project viability, with a greater need for local governments and industry to have a shared understanding of feasibility realities and the impact of planning requirements on constructability.
Across the study area, five or more projects need to be approved in order for one to convert to construction.
To improve the conversion rate (from approval to project completion), the following is needed:
▪ The application of a feasibility mindset across local government, from plan making to development approval conditions
▪ Increased engagement with applicants to work through solutions that result in project starts
▪ Streamlined approval pathways to facilitate a greater level of project starts, faster.
Without considerable effort to increase approval conversions rates across the region, approvals will continue to be given to projects which are not financially viable.
13% of approved dwellings have commenced construction since 2023

6,131
46%
Within the Focused SEQ region, 6,131 attached dwellings are being delivered per annum - just 46% of the ShapingSEQ target.
7,230
181,463 dwellings delivered per year dwellings annual shortfall of the ShapingSEQ target dwellings 25 year shortfall
The Focused SEQ region is currently delivering 7,230 fewer dwellings each year than the ShapingSEQ target.
At the current delivery rate, this equates to a 181,463 attached dwelling shortfall over the life of the ShapingSEQ plan.
View from Rivière by Aria Property Group
2,139
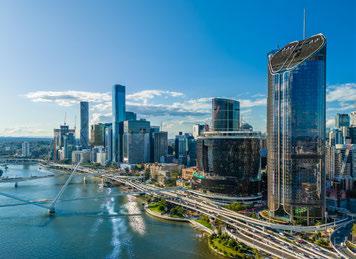
Annual dwellings shortfall in Brisbane
2,499
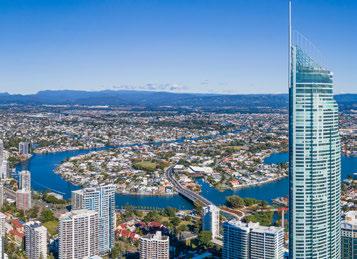
Annual dwellings shortfall in the Gold Coast
Brisbane is currently delivering
2,222 49.6% 47.7% 16.6%
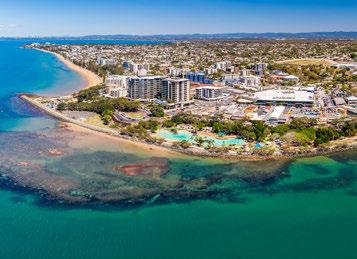
Annual dwellings shortfall in Moreton bay
of its annual attached dwelling target as stated in ShapingSEQ
The Gold Coast is currently delivering
of its annual attached dwelling target as stated in ShapingSEQ
Moreton Bay is currently delivering
of its annual attached dwelling target as stated in ShapingSEQ
2,756 apartments
The Southport Surrounds precinct has the largest long-term pipeline , signalling development opportunities over the next decade, subject to the viability of projects. Short-term
1,086 apartments in the Brisbane CBD precinct are set to be delivered in the next 1-3 years. Brisbane CBD has the highest amount of short-term supply in the Brisbane Inner North precinct are set to be delivered in the next 3-6 years. The Brisbane Inner North precinct has the highest amount of medium-term supply
FOCUSED SEQ REGION OVERVIEW
15,715
Short-term pipeline Identified in the short-term pipeline for Focused SEQ
6,901
Medium-term pipeline Identified in the medium-term pipeline for Focused SEQ
4,680
ShapingSEQ Target
40,083
61% shortfall dwellings dwellings
ShapingSEQ Target
40,083 dwellings dwellings
83% shortfall
Supply by Local Government Area
Long-term pipeline Identified in the long-term pipeline for Focused SEQ
ShapingSEQ Target
53,444 dwellings dwellings
91% shortfall
Key findings
▪ The short-term supply pipeline has the highest totals across each region compared to the medium-term and long-term pipeline, signalling a decrease in activity and new commencements after current projects reach completion
▪ The Focused SEQ delivery rate is currently sitting well below the 10-year average, signalling a significant decline in activity without any obvious signs of an increase in activity on the horizon
▪ Confidence is low in industry to delivery supply in the next 6-10 years with a large pipeline of Government infrastructure including Olympic and Paralympicrelated infrastructure to kick off in 2027.
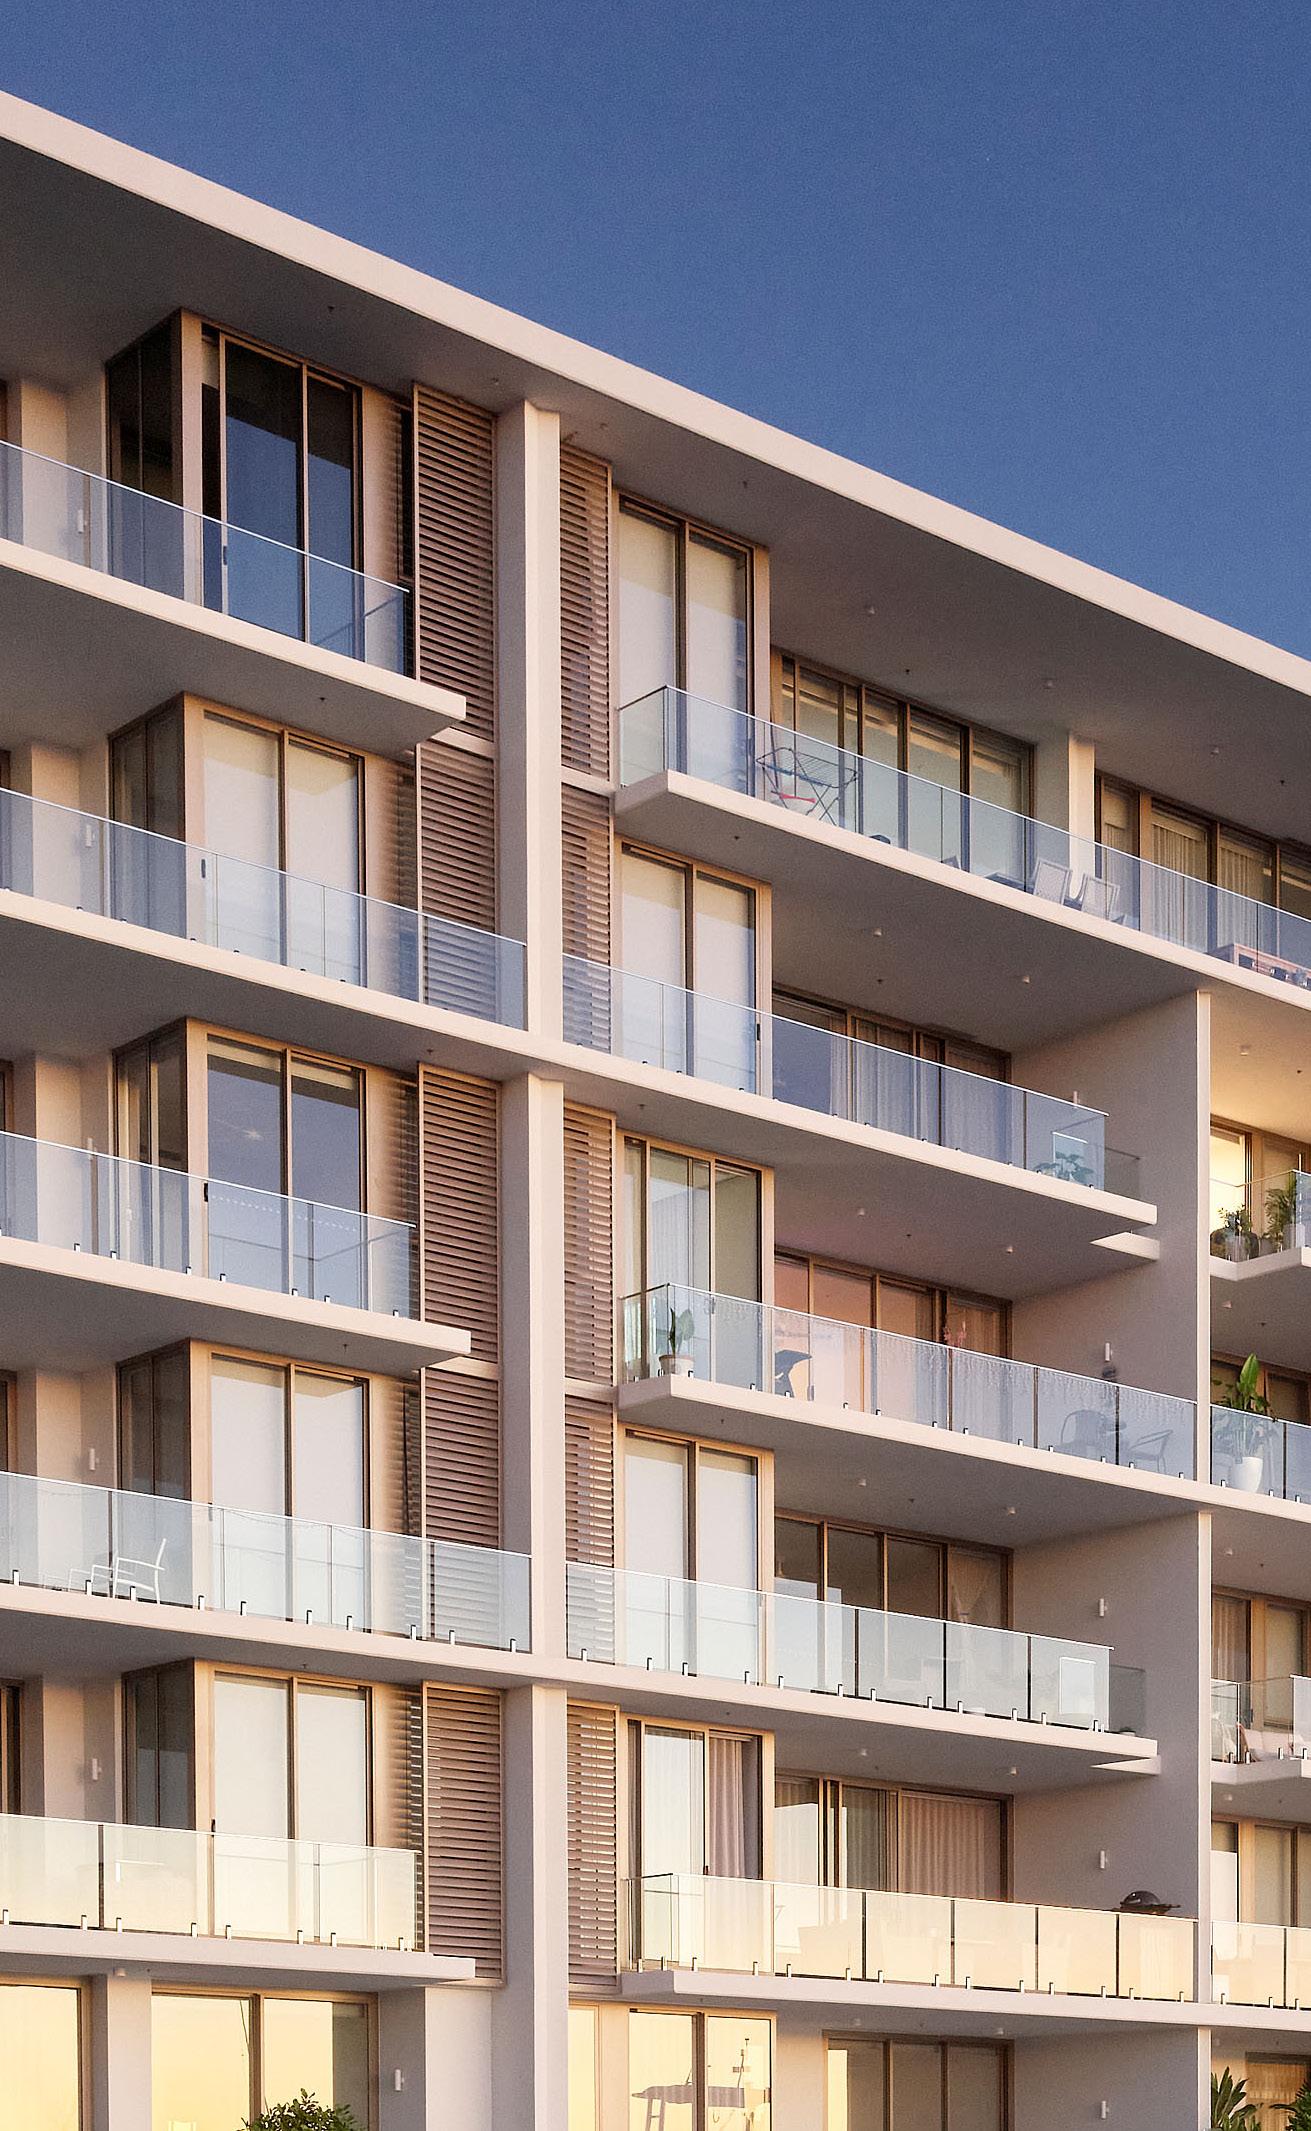
Lasail Newport by Traders in Purple
Delivery rate
6,131
Current annual delivery rate
QGSO 2024 attached lot registration total for the Focused SEQ region.
8,491
10-year average annual delivery rate
QGSO 2015-2024 average annual attached lot registration for the Focused SEQ region.
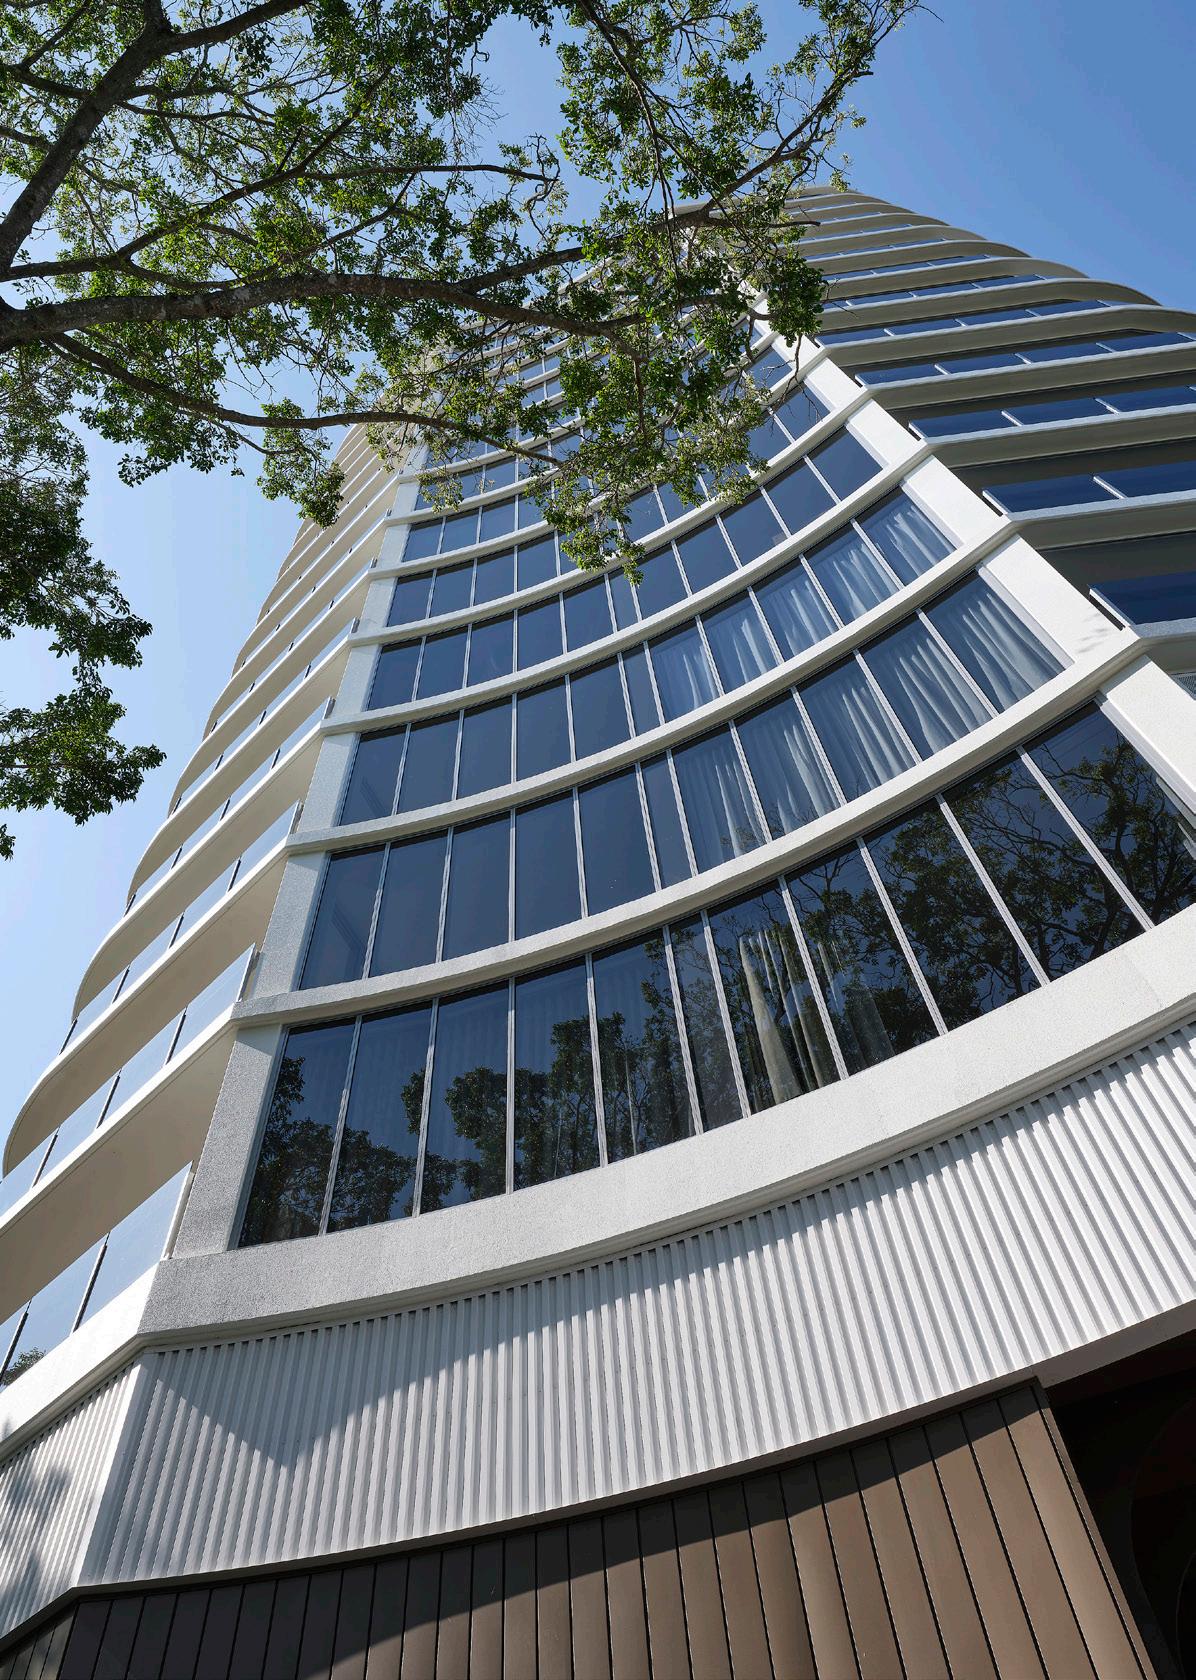
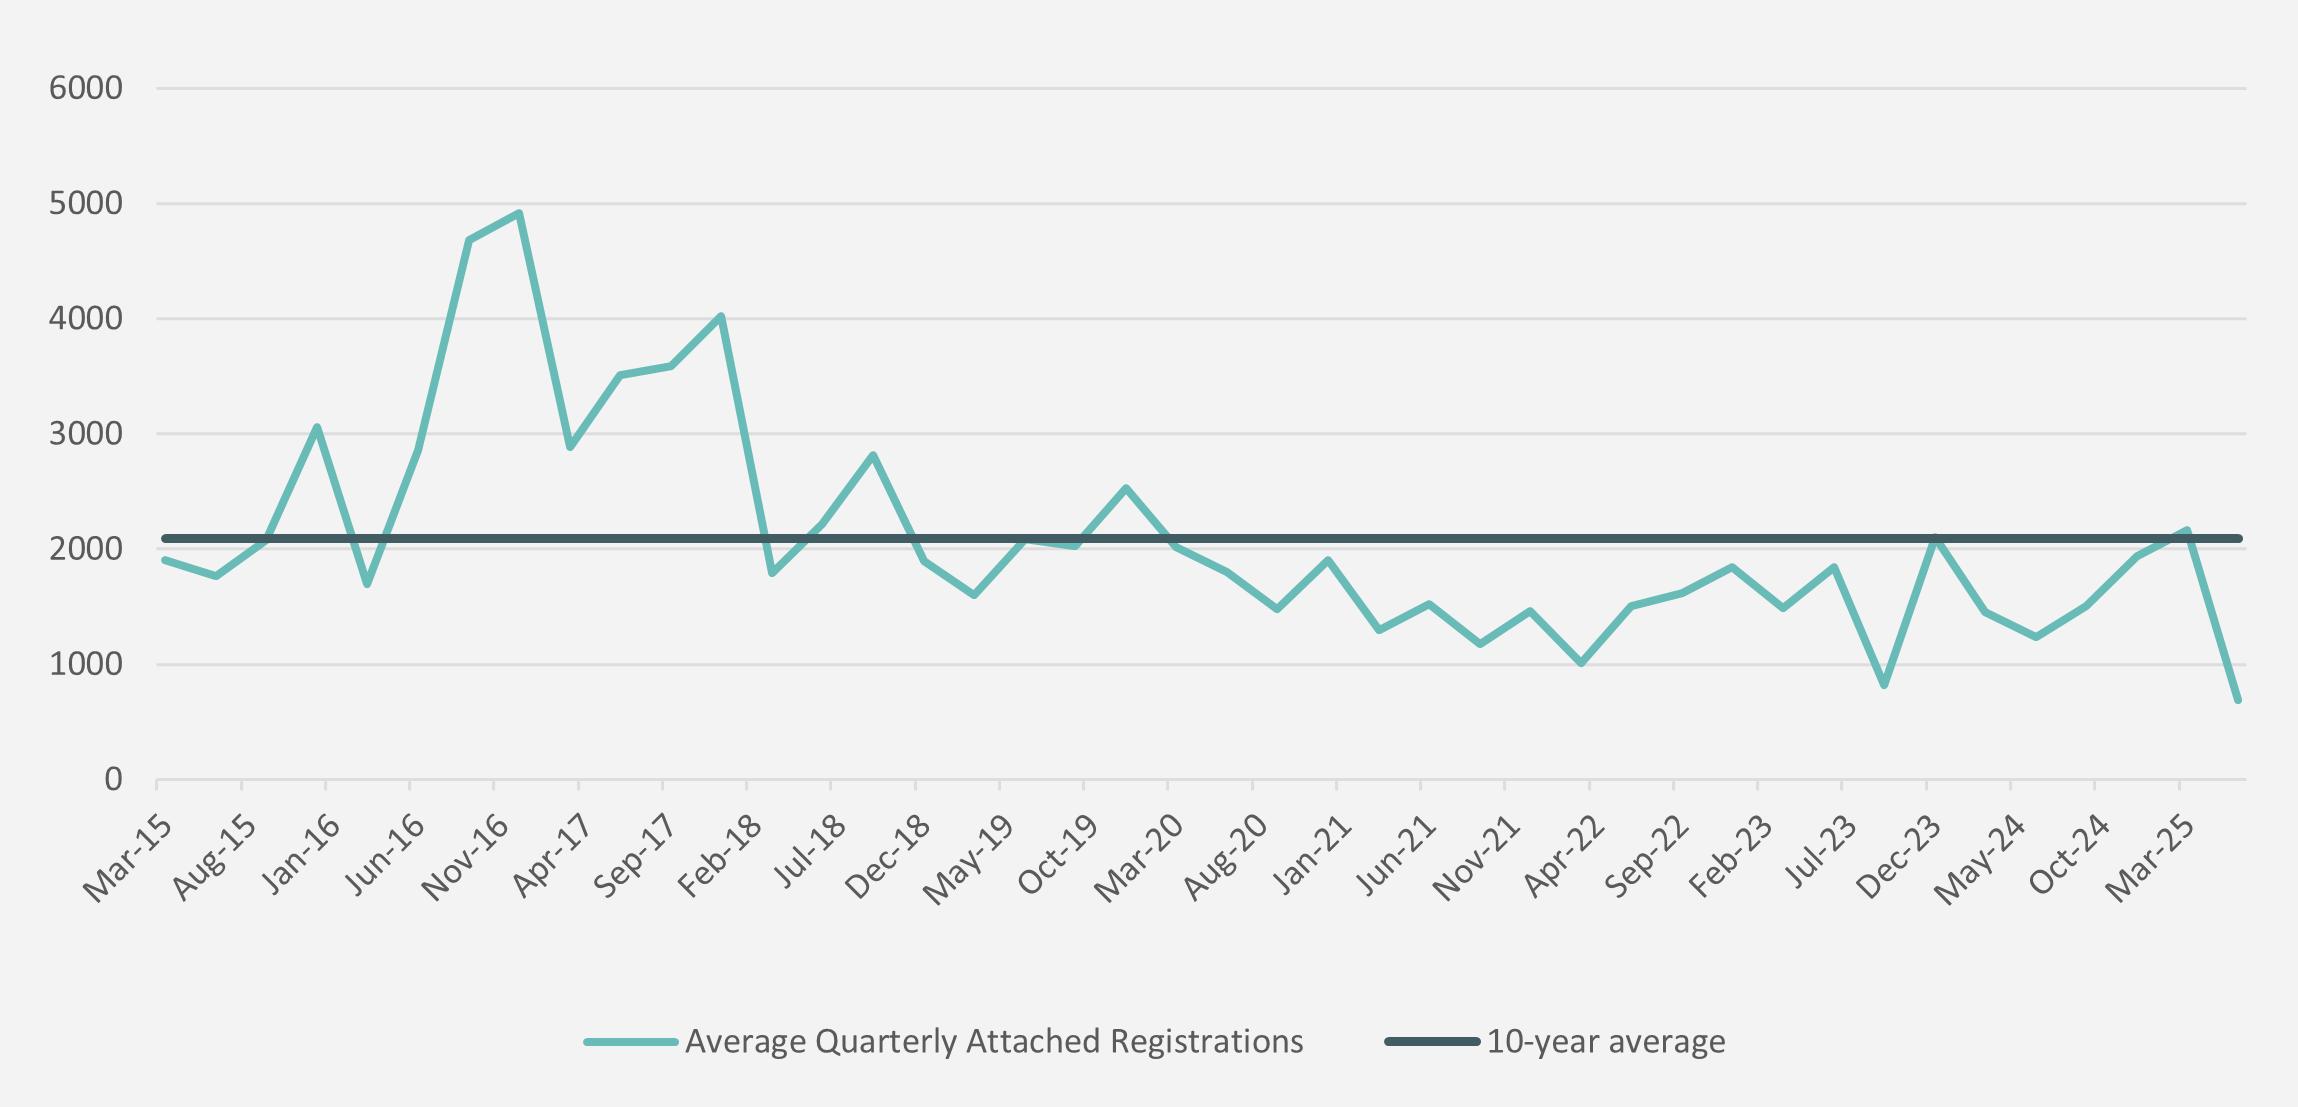
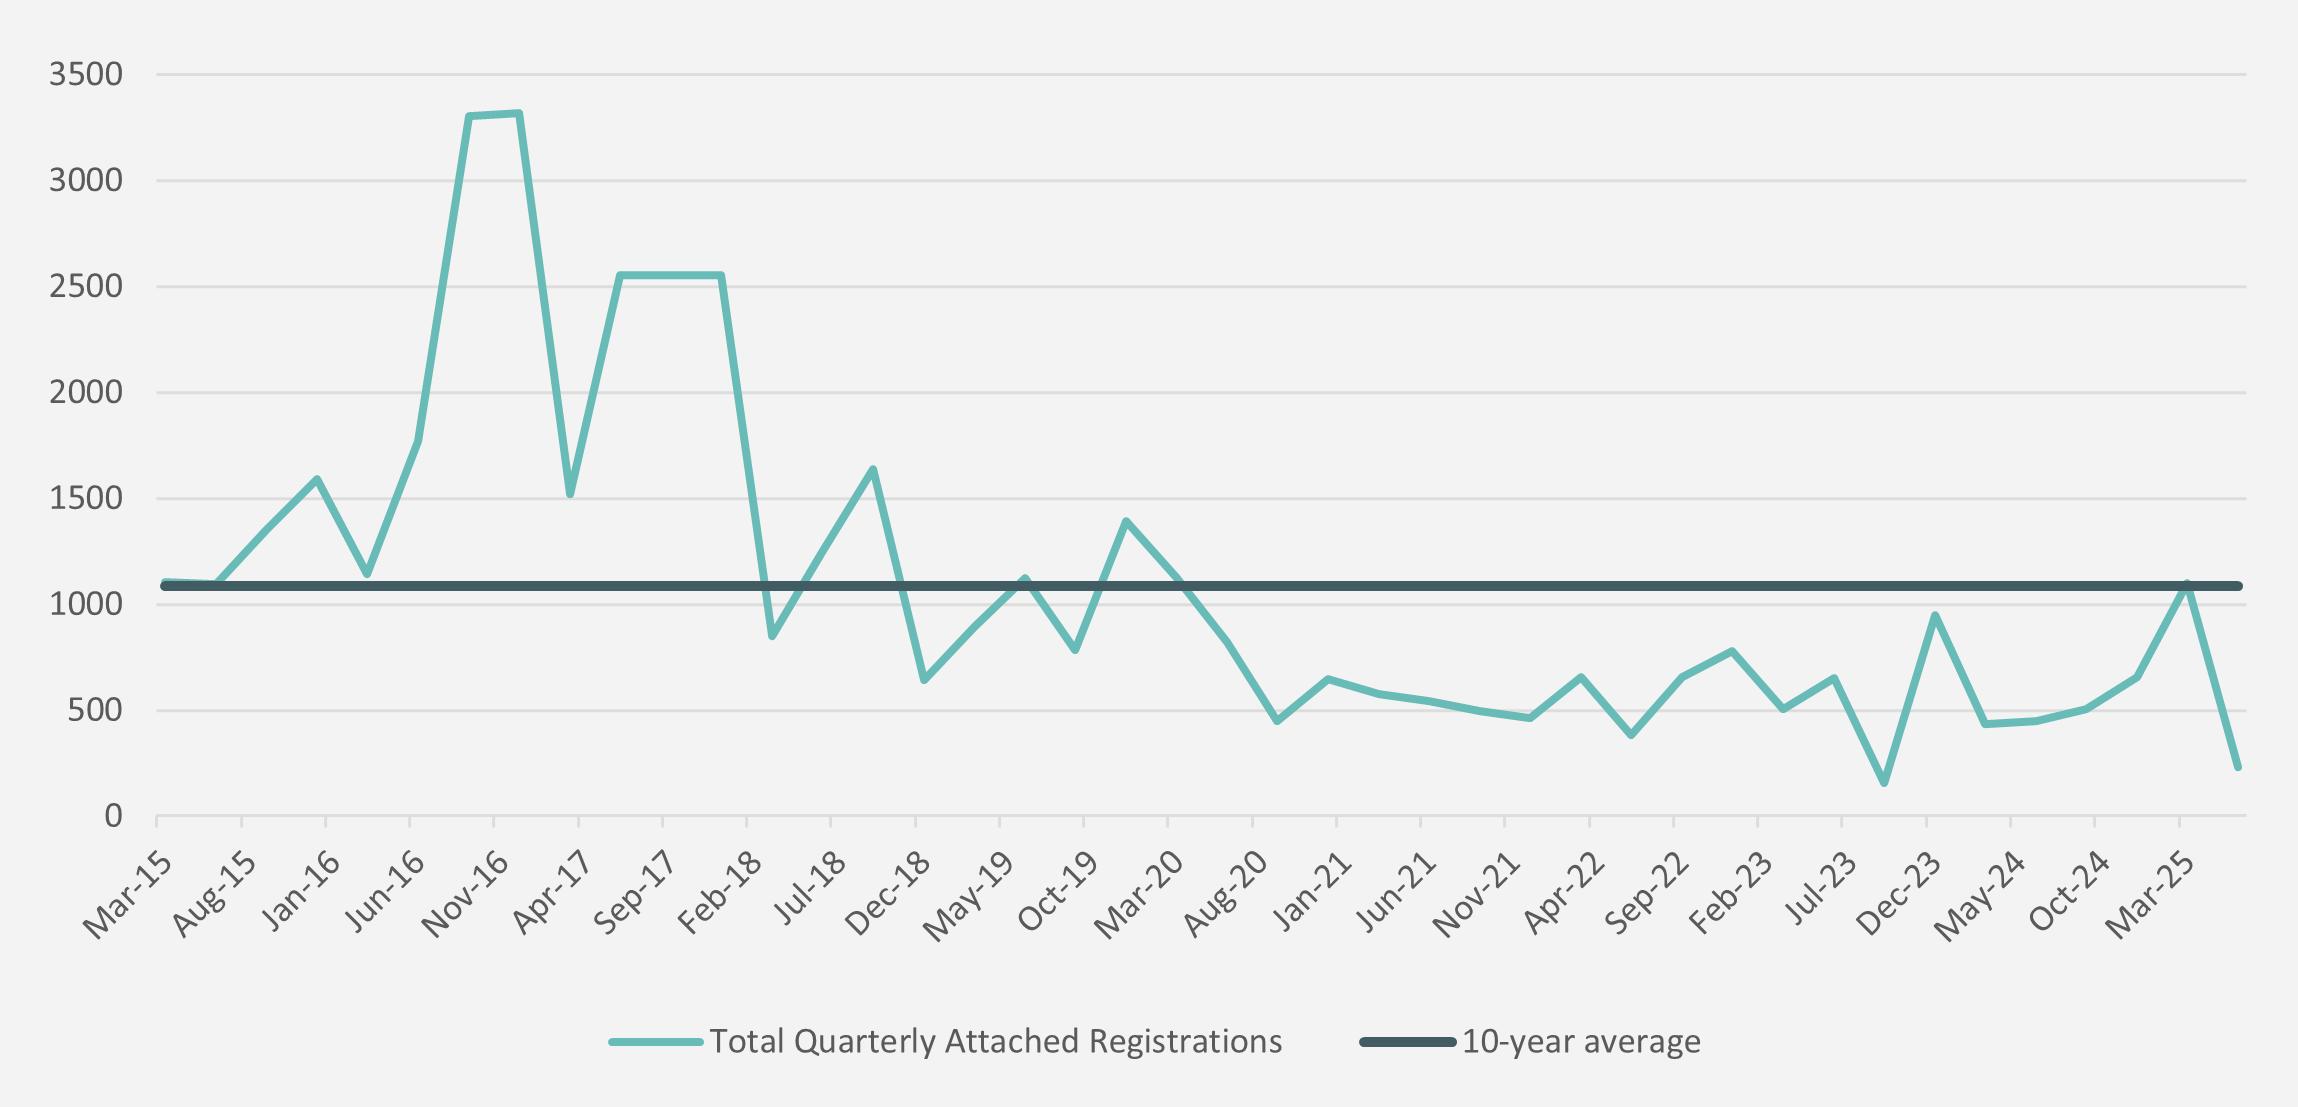
The Queensland Government Statistician’s Office (QGSO)’s Residential land development indicators report that the Focused SEQ region is currently achieving 6,131 attached lot registrations per annum, well down on the decade average of 8,491 dwellings, as a result of a significant decline in delivery since 2020. Figure 1 illustrates the quarterly change in delivery rate between 2015-2025, showing the highs of delivery in the 2016-2018 period and the significant slowdown since 2020.
Figure 1: Focused SEQ Quarterly Attached Lot Registrations (2015-2025) - QGSO
160 Macquarie by QM Properties
Approval conversion
Not all approved apartment projects proceed to construction. Some projects are delayed indefinitely, sold, or re-worked at a later date. To better understand the true forward supply of apartments in the Focused SEQ region, beyond what is already under construction, this research applies LGA-specific conversion rates to approval and application data as well as the passive supply data collected.
Why conversion rates matter
Applying conversion rates adjusts the theoretical supply to the realistic pipeline. This step ensures that medium and long-term forecasts reflect the actual proportion of projects likely to be delivered, avoiding an overstatement of future supply.
Conversion rates were calculated by analysing historic approval data against projects that proceeded to construction within each LGA. This analysis produced a percentage rate that represents the likelihood of total approved apartments becoming completed dwellings.
LGA-specific conversion rates
The following conversion rates were applied. Conversion rates were calculated looking at total units in approval/application compared to total units under construction to formulate a conversion rate percentage.
These rates demonstrate that some LGAs, such as the Sunshine Coast, have historically delivered a much higher proportion of approved projects, whereas major metropolitan markets like Brisbane and the Gold Coast experienced lower conversion rates due to factors such as project financing, market absorption, and developer timing decisions.
Applying a conversion rate enables a timeframebased view of supply that is grounded in market evidence. By discounting approvals and potential sites using historic conversion rates, the resulting pipeline represents a more reliable picture of apartment delivery across the Focused SEQ region, essential for industry and government planning efforts.
Feasibility challenge
A critical but often hidden constraint on apartment supply is financial feasibility. Regardless of a site’s zoning or location, a project will only proceed if the developer can demonstrate that the project will achieve a margin. Demonstration of a margin is one of the most critical requirements to secure financing for a project. When costs rise faster than what the market will bear, many approved or prospective projects simply ‘don’t stack up’ and are unable to achieve the required ‘hurdle rate’ to secure project finance.
Key cost pressures
Rising construction costs (labour, materials, and regulatory compliance) have increased the revenue required to deliver a viable development. This means that the rate per square metre increases to cover the construction costs, may place the pricing out of reach for many homebuyers.
Beyond direct construction costs, planning and approval conditions can also significantly impact a project’s viability. Requirements such as increased car parking ratios, larger building setbacks, and deep planting requirements, can all reduce the amount of saleable floor area within a building envelope. In dense or constrained sites, even small changes to these parameters can materially alter the development yield, increase the size and cost of basements, or reduce the number of saleable apartments, ultimately undermining project viability.
Table 2: LGA-specific conversion rates
Industry capacity and builder availability
A further pressure on feasibility is the limited availability of qualified builders in SEQ. The region’s construction capacity remains constrained, with many contractors prioritising government-backed projects that offer greater security and more predictable cash flow than high density residential projects. This shift has reduced competition for private-sector tenders, increased build costs, and introduced further delays to project commencements. Developers frequently report challenges in securing a builder willing to take on multi-residential projects, even where approvals and funding are already in place.
Feasibility thresholds and location limits
To ‘make an apartment project stack,’ in many cases the required cost per square metre is in the order of $15,000-18,000/sqm for saleable area. Saleable area includes areas that can be directly sold, specifically the area of an apartment. An apartment building includes a proportion of non-saleable area as well, the cost of which is recouped in the saleable area. Nonsaleable area includes service levels, lift shafts, lobby, carpark levels, common areas, exterior landscaping, and façade treatment. Such high saleable rates tend to limit viable development to premium, high-value precincts: riverside or waterfront sites in Brisbane, beachfront or high-amenity outlooks on the Gold Coast, prime Sunshine Coast beach locations, and select Redcliffe coastal frontages.
In more affordable or less premium areas, market price expectations are lower. Because the required cost to build is still high, many sites in these areas cannot deliver a return sufficient to justify development. Thus, they remain in existing (often lower-density) use or are left undeveloped despite zoning.
Highest and best use and land value constraints
The concept of highest and best use is a central tenet of land use and development assessment. For any site, a developer assesses the viability of the site, within the context of land values, construction costs, and the market to determine what its realistic highest and best use may be. That means, is the site’s current use generating as much value (after accounting for costs) as any alternative use permitted by planning and market desire? If not, redevelopment is theoretically the better option, but only if the financials make sense.
For many SEQ sites, even when zoning supports apartments, the cost of acquiring and developing the site (or paying a premium for a site in a premium location) is so high relative to what the apartment market will pay that existing uses (single-houses, lower density developments) remain the highest and best use in practice.
For example, if a beach-front or ocean-front lot is priced by sellers expecting premium price, but feasibility modelling only supports a lower valuation (because market demand or affordability constraints limit the achievable sale price per unit), then the seller’s expected value is less than the developer’s feasible return. The developer walks away. Consequently, many lots or improved sites stay in single low-density use, even though zoning allows greater density.
The Witton by Mosaic Property Group
Implications for the forward pipeline
▪ Restriction on supply: many potential sites with appropriate zoning will never be developed if the cumulative total of development costs, land acquisition, and holding costs cannot be recouped at marketable apartment prices
▪ Geographic concentration: currently, successful feasibilities are limited, with the exception of high value, meaning that these areas are likely to make up much of future supply. This limits the diversity of supply in terms of location, price point, and building type
▪ Delays and project cancellations: projects may obtain a development approval but then stall or are cancelled when final cost estimates, market conditions, or financing become difficult or the project is unable to secure a builder.
Labour force capacity
A key risk to the successful delivery of SEQ’s apartment pipeline is the capacity and capability of the construction workforce. While industry conditions have stabilised since the onset of COVID, workforce shortages remain one of the most critical constraints on housing delivery, particularly in the lead-up to the 2032 Olympic and Paralympic Games, which will add significant pressure to an already stretched labour market.
The scale of the challenge
Queensland’s construction pipeline reached a record $52.2 billion in June 2024, with the gap between work planned and work completed now double the pre-pandemic levels1. The workforce required to meet demand is forecast to peak at 156,000 workers in 2026–27, yet Construction Skills Queensland (CSQ) estimates a shortfall of around 18,200 workers1, particularly acute in the short to medium-term pipeline.
Nationally, the Master Builders Association estimates that the construction workforce would need to grow from 1.37 million to 1.5 million workers to meet the National Housing Accord’s targets2. This challenge is magnified in Queensland by contractor insolvencies, declining productivity, and competition for labour from the state’s ambitious infrastructure program.
Skills in demand
Key occupations identified as being in highest demand across the eight-year period to 2032 include carpenters and joiners, building and plumbing labourers, painting trades workers, plumbers, electricians, concreters, and plasterers1
Without targeted interventions, these shortages will continue to delay commencements and reduce the pace at which approved apartment projects can proceed to construction, constraining the forward supply pipeline.
Why it matters
A constrained labourforce limits the ability to translate planning approvals into delivered housing, effectively shrinking the short and medium-term pipeline. Resolving workforce shortages is not just a productivity issue; it is a precondition for meeting SEQ’s housing targets and closing the annual shortfall of 7,230 attached dwellings identified in this report.
1 csq.org.au/wp-content/uploads/2025/04/CSQ-Horizon-2032_Full-Report.pdf
2 Workforce-Blueprint_Final-1.pdf
Benchmarking against targets
When comparing current delivery rates to the ShapingSEQ annual target, a significant gap emerges:
6,131
dwellings per year
Current delivery rate
Annual delivery rate across the Focused SEQ region.
13,361
dwellings per year
ShapingSEQ Annual Attached Dwelling Target
Includes Medium-rise and High-rise targets in the Focused SEQ region, and Low-rise targets for Moreton Bay and the Sunshine Coast ( ShapingSEQ ).
7,230
dwellings per year
Annual shortfall
ShapingSEQ Target minus Delivery Rate
181,463
dwellings per year
ShapingSEQ cumulative shortfall
Across the life of the ShapingSEQ plan, 2021-2046.
This data highlights that the Focused SEQ region is currently delivering only 46 percent of its annual attached dwelling target , leaving a substantial shortfall that is compounding year-on-year.
Marella by Mosaic Property Group
Implications for the pipeline
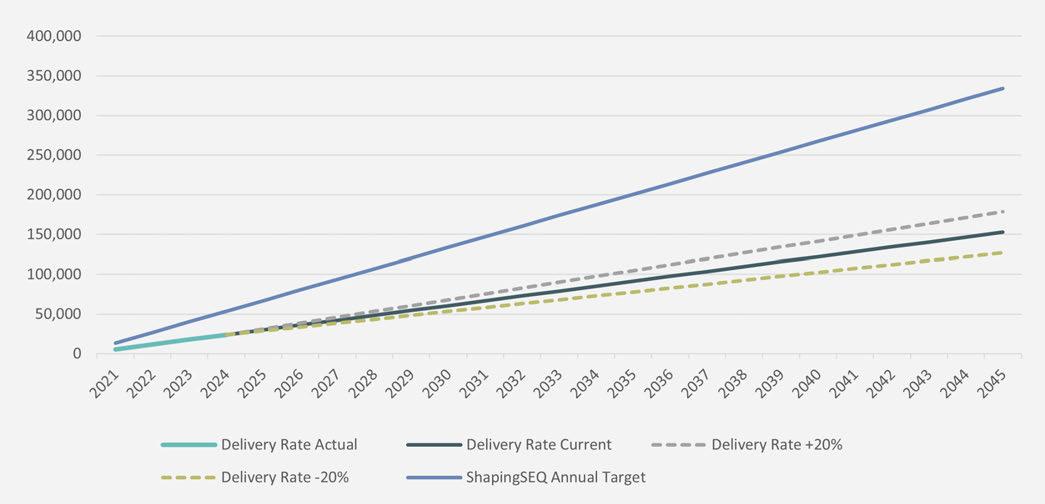
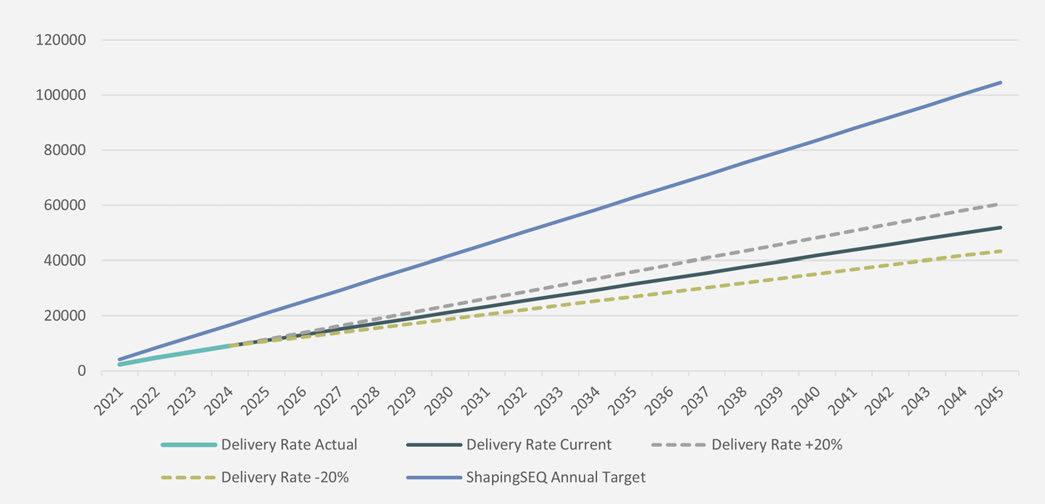
The annual shortfall (see Figure 2), if not addressed, risks deepening housing supply challenges in the Focused SEQ region, driving up pressure on affordability and reducing housing choice for the region’s growing population. This underscores the importance of not only tracking the short-term and medium-term pipeline but also creating conditions that enable long-term supply to be brought to market.
2: Focused SEQ Cumulative Annual ShapingSEQ Attached Target vs Annual Delivery Rate
Figure
SUB-REGIONAL ANALYSIS
In addition to analysis undertaken at the broader SEQ level, further analysis was conducted at the Local Government level to provide individual sub-regional findings. A sub-regional analysis has been undertaken for the following LGAs:
▪ Brisbane
▪ Gold Coast
▪ Moreton Bay
▪ Sunshine Coast.
Augusta by Mosaic Property Group
Brisbane
Key findings
▪ The majority of apartment supply is currently being delivered in Brisbane, with the medium-term horizon of supply significantly reduced
▪ Brisbane’s project conversion rate of 14.3 percent is the lowest in the Focused SEQ region indicating it is the toughest LGA for bringing apartment supply to market
▪ Brisbane’s low long-term pipeline of 2,187 showcases the worsening conditions for project delivery, with industry citing the major state infrastructure program ahead of the Olympic and Paralympic Games, as the primary reason for reduced confidence to deliver supply.
7,426
dwellings
Short-term pipeline Identified in the short-term pipeline for Brisbane
ShapingSEQ Target
12,546
dwellings
41% shortfall
Approval conversion
3,332
dwellings
Medium-term pipeline Identified in the medium-term pipeline for Brisbane
ShapingSEQ Target
12,546
dwellings
73% shortfall
2,187
dwellings
Long-term pipeline Identified in the long-term pipeline for Brisbane
ShapingSEQ Target
16,728
dwellings
87% shortfall
In Brisbane, the identified approval conversion rate currently sits at 14.3 percent , indicating a low conversion rate from approval through to delivery.

Precinct supply breakdown
Table 3: Brisbane precinct supply breakdown
Delivery rate
2,043
4,524 Current annual delivery rate
QGSO 2024 attached lot registration total for the Brisbane region.
10-year average annual delivery rate
QGSO 2015-2024 average annual attached lot registration for the Brisbane region.
The current Brisbane delivery rate for attached unit dwellings in Brisbane is below half of the average decade delivery rate for Brisbane. Figure 3 illustrates that the quarterly delivery rate experienced a significant reduction in 2020 and has not yet recovered.
Figure 3: Brisbane Quarterly Attached Lot Registrations (2015-2025) - QGSO
Quay Waterfront Newstead by Mirvac
Benchmarking against targets
Brisbane is currently delivering 49.6 percent of its annual attached dwelling target , leaving a substantial shortfall that is compounding year-on-year. See Figure 4 below for cumulative breakdown of expected delivery rate against ShapingSEQ target with modelling for a 20 percent improvement or worsening on delivery.
Figure 4: Brisbane cumulative Annual ShapingSEQ Attached Target VS Annual Brisbane Delivery Rate
Stonebrook by Gardner Vaughan Group
Gold Coast
Key findings
▪ Like Brisbane, the Gold Coast’s short-term pipeline presents the largest opportunity for supply
▪ While the current delivery rate of 2,282 attached dwellings per year is in line with the 10-year average, the Gold Coast needs to double its output to perform in line with ShapingSEQ targets
▪ In the short-term, the Gold Coast is projected to have a 50 percent shortfall against ShapingSEQ targets, increasing to 73 percent and 90 percent over the medium and long term
▪ Project conversion rate of 17.4 percent on the Gold Coast is marginally better than Brisbane but still illustrates the challenge of converting an approval to project commencement.
7,203
3,241
ShapingSEQ Target
14,343 50% shortfall dwellings dwellings
Medium-term pipeline Identified in the medium-term pipeline for the Gold Coast
14,343 dwellings dwellings
Short-term pipeline Identified in the short-term pipeline for the Gold Coast 73% shortfall
1,991
Long-term pipeline Identified in the long-term pipeline for the Gold Coast
ShapingSEQ Target
ShapingSEQ Target
19,124 dwellings dwellings
90% shortfall
Approval conversion
In the Gold Coast, the identified approval conversion rate currently sits at 17.4 percent , indicating a low conversion rate from approval through to delivery.
Precinct supply breakdown
Table 4: Gold Coast precinct supply breakdown
Delivery rate
2,282
Current annual delivery rate
QGSO 2024 attached lot registration total for the Gold Coast region.
2,258
10-year average annual delivery rate
QGSO 2015-2024 average annual attached lot registration for the Gold Coast region.
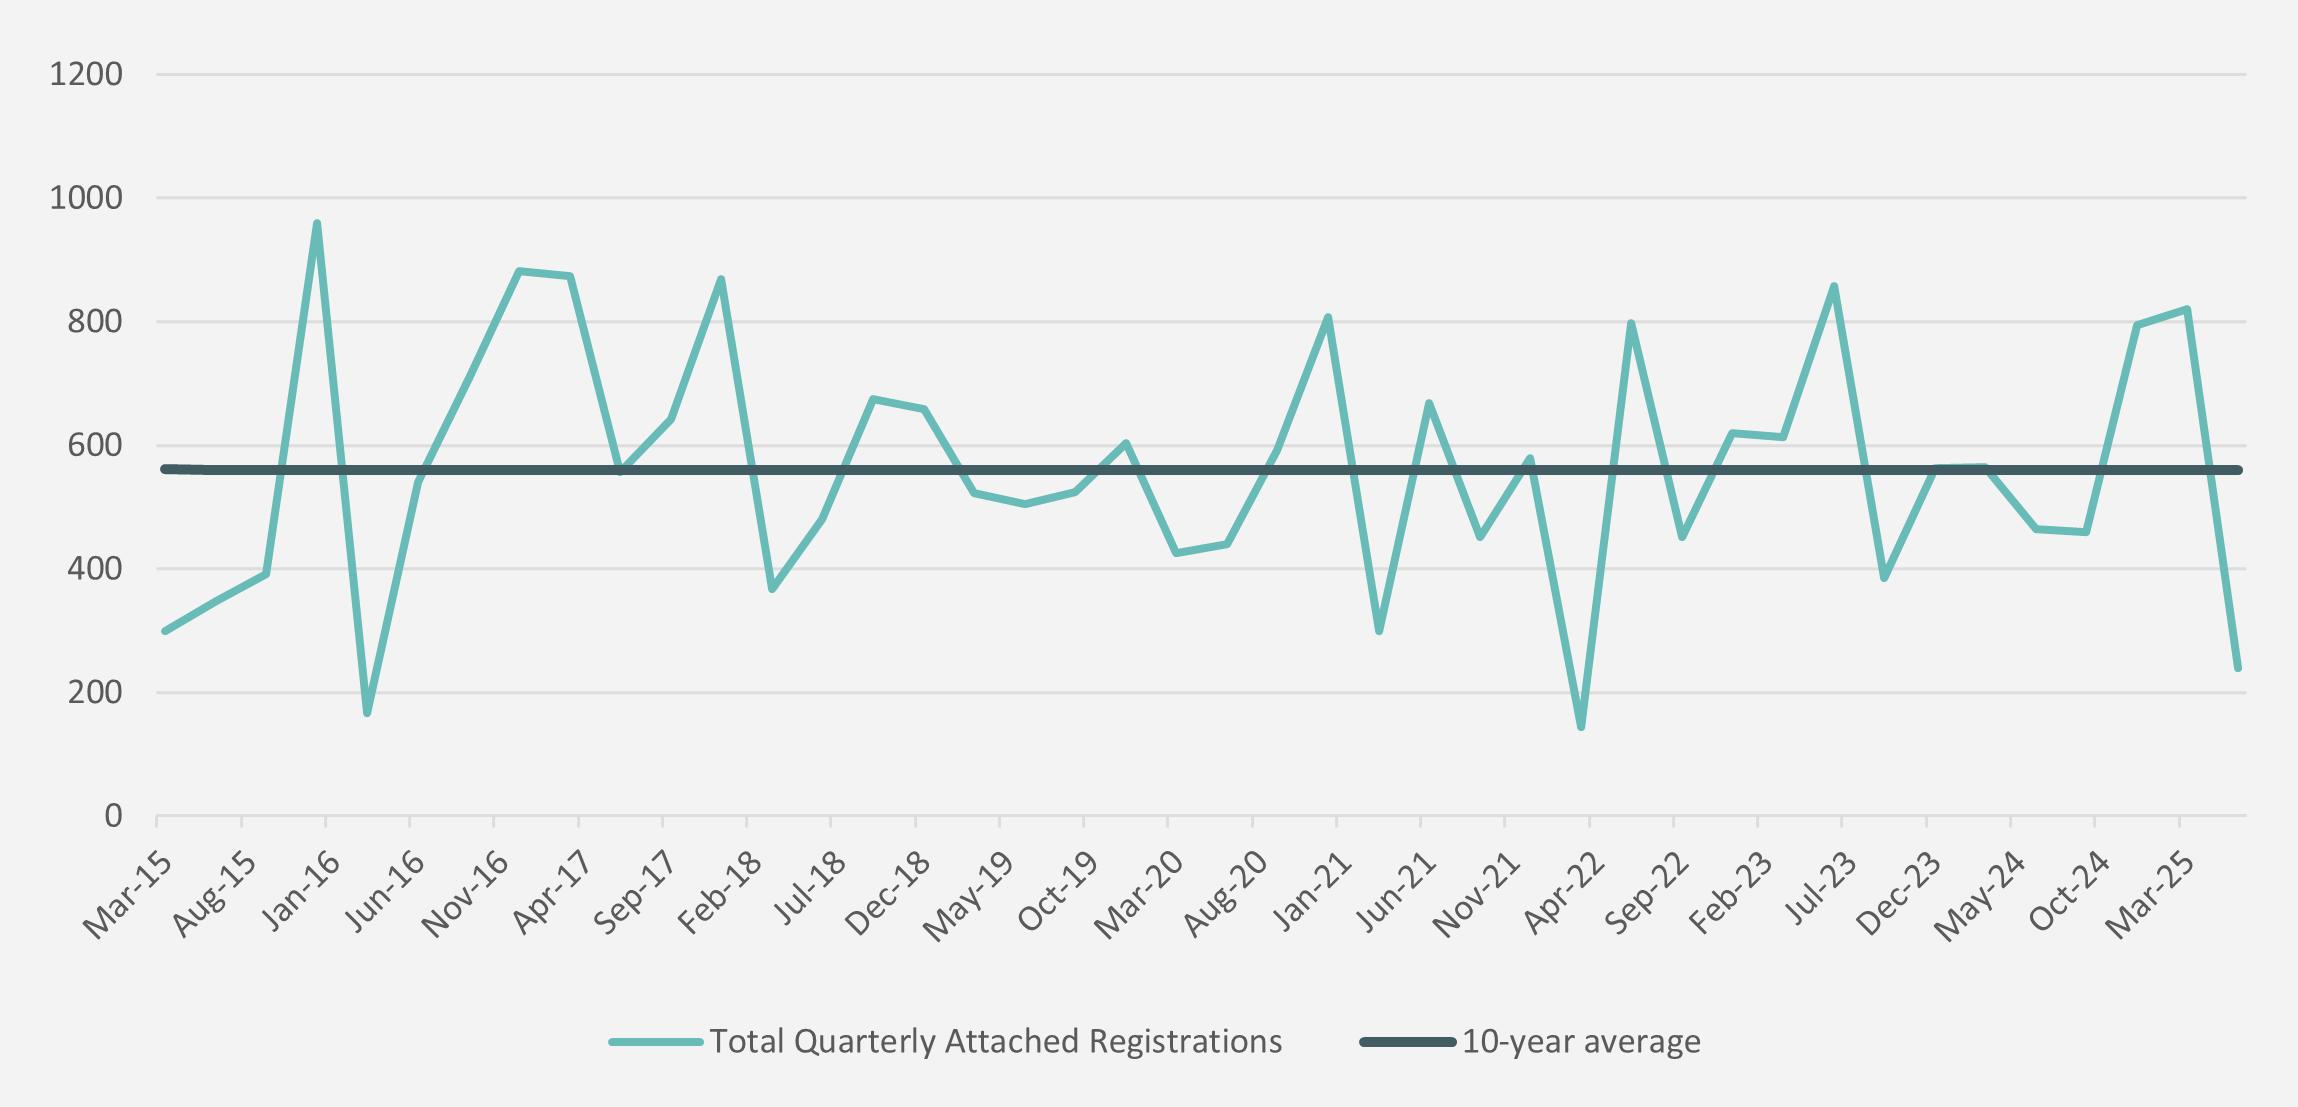
The current Gold Coast delivery rate for attached unit dwellings is sitting at approximately the same point as the 10-year average. Figure 5 below shows the varying ability to deliver apartment supply on the Gold Coast, with significant market deviations evident since 2015.
Figure 5: Gold coast Quarterly Attached Lot Registrations (2015-2025) - QGSO
Vantage by Rayjon Group
Benchmarking against targets
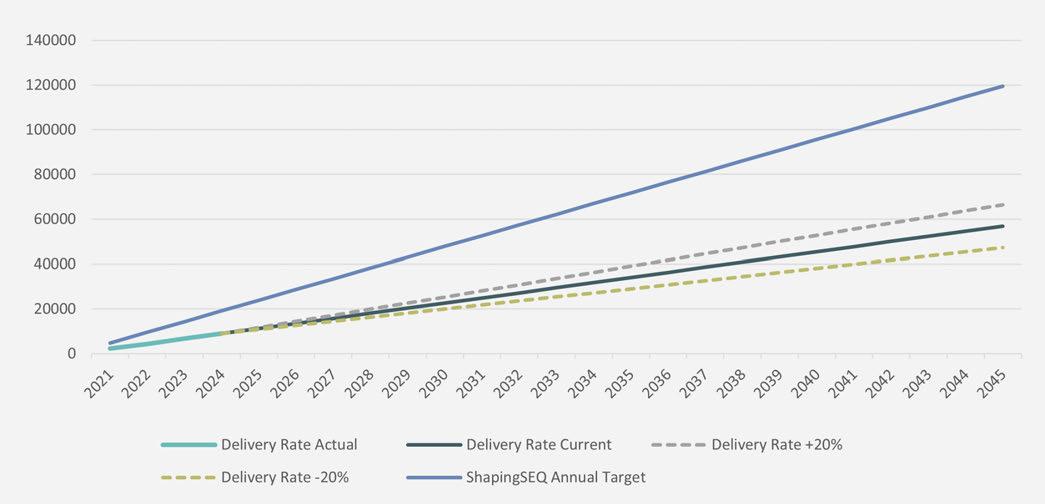
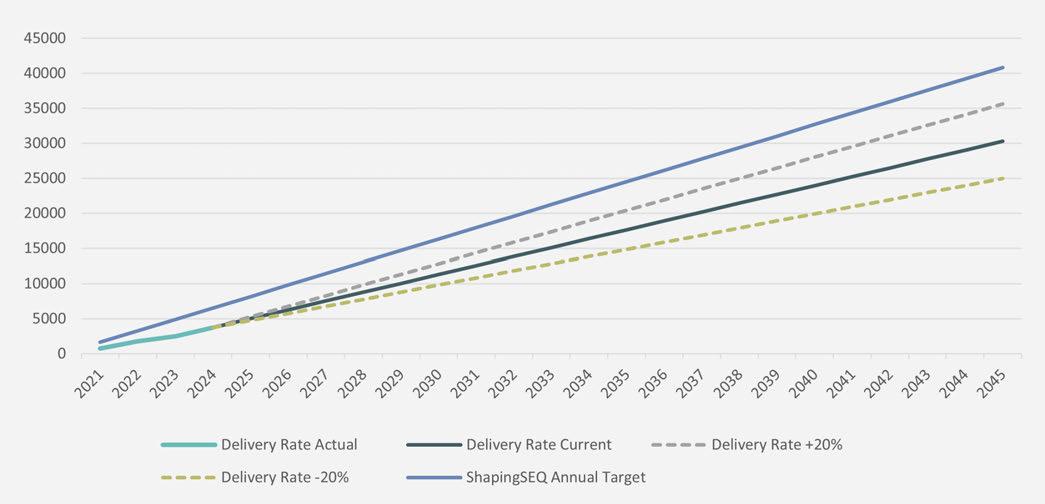
The Gold Coast is currently delivering 47.7 percent of its annual attached dwelling target , leaving a substantial shortfall that is compounding year-on-year. See Figure 6 below for cumulative breakdown of current delivery rate against ShapingSEQ target with modelling for a 20 percent improvement or worsening on delivery.
Figure 6: Gold Coast cumulative Annual ShapingSEQ Attached Target VS Annual Gold Coast Delivery Rate
Florence by Mosaic Property Group
Moreton Bay
Key findings
▪ Apartment supply in Moreton Bay represents the most modest contribution to total supply across the Focused SEQ region
▪ Challenges for apartment projects to occur in Moreton Bay unless they are premium sites on the water within the Redcliffe Peninsula
▪ ‘Highest and best use’ noted as the primary barrier to acquiring prime development sites.
313
Short-term pipeline Identified in the short-term pipeline for Moreton Bay
136
Medium-term pipeline Identified in the medium-term pipeline for Moreton Bay
179
ShapingSEQ Target
1,056
70% shortfall dwellings dwellings
ShapingSEQ Target
1,056 dwellings dwellings
87% shortfall
Long-term pipeline Identified in the long-term pipeline for Moreton Bay
ShapingSEQ Target
1,408 dwellings dwellings
87% shortfall
Approval conversion
In Moreton Bay, the identified approval conversion rate currently sits at 22.7 percent , indicating a low conversion rate from approval to delivery.
Precinct supply breakdown
Table 5: Moreton Bay Precinct supply breakdown
Delivery rate
542
Current annual delivery rate
QGSO 2024 attached lot registration total for the Moreton Bay region.
878
10-year average annual delivery rate
QGSO 2015-2024 average annual attached lot registration for the Moreton Bay region.
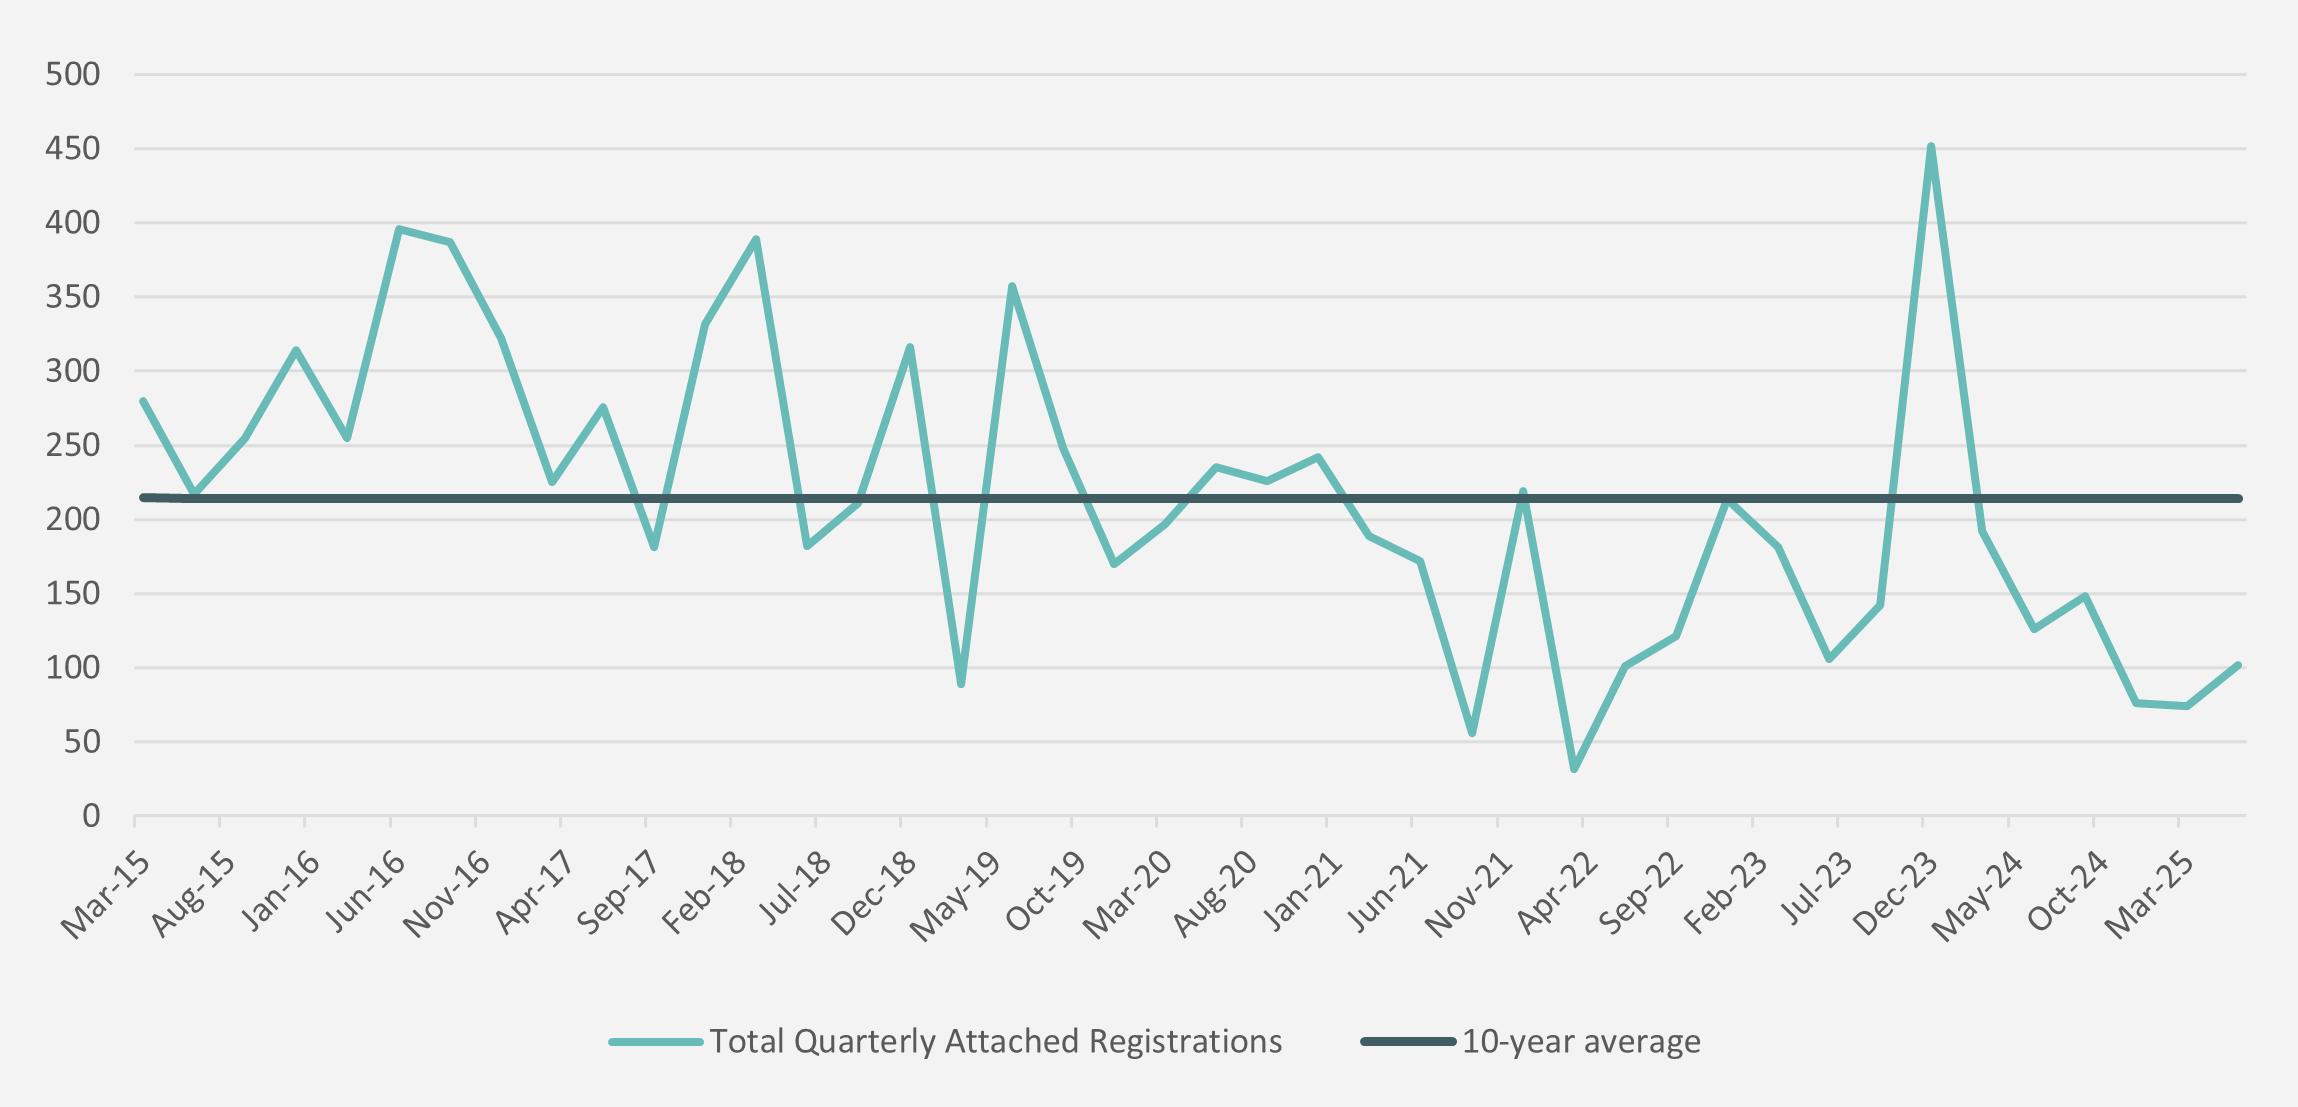
The current Moreton Bay delivery rate for attached unit dwellings is well below the 10-year average. For an LGA such as Moreton Bay, the majority of attached registrations come from townhouse product in greenfield areas, with an increasing amount coming from apartment stock in the Redcliffe Peninsula. Figure 7 below illustrates that quarterly delivery rate, currently operating well below the 10-year average.
Figure 7: Moreton Bay Quarterly Attached Lot Registrations (2015-2025) - QGSO
Lasail Newport by Traders in Purple
Benchmarking against targets
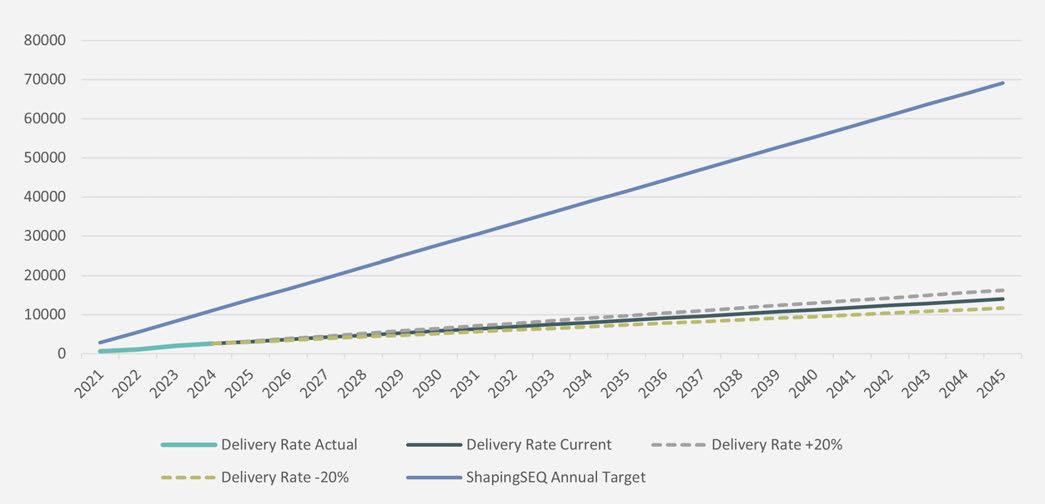
Moreton Bay is currently delivering only around 16.6 percent of its annual attached dwelling target , leaving a substantial shortfall that is compounding year-on-year. See Figure 8 below for cumulative breakdown of expected delivery rate against ShapingSEQ target with modelling for a 20 percent improvement or worsening on delivery.
Note: Moreton Bay’s cumulative ShapingSEQ target that was used to benchmark against the delivery rate includes Low-rise attached, Medium-rise attached, and High-rise attached as defined in the plan. This was due to the delivery rate figure including all attached dwellings.
Figure 8: Moreton Bay cumulative Annual ShapingSEQ Attached Target VS Annual Moreton Bay Delivery Rate
Lasail Newport by Traders in Purple
Sunshine coast
Key findings
▪ 22.5 percent of projects with an approval are progressing, but it is the low number of applications/approvals coming into the system that presents the real challenge
▪ ‘Birtinya Surrounds’ is most likely to deliver short-term supply, with Central Coast and Southern Sunshine Coast (see Appendix 1) showing signs of potential supply in the next 3-10 years
▪ Sunshine Coast currently has limited opportunities for apartment development, with viable sites few and far between.
773
Short-term pipeline Identified in the short-term pipeline for the Sunshine Coast
192
Medium-term pipeline Identified in the medium-term pipeline for the Sunshine Coast
322
ShapingSEQ Target
3,042
75% shortfall dwellings dwellings
ShapingSEQ Target
3,042 dwellings dwellings
94% shortfall
Long-term pipeline Identified in the long-term pipeline for the Sunshine Coast
ShapingSEQ Target
4,056 dwellings dwellings
92% shortfall
Approval conversion
The Sunshine Coast’s identified approval conversion rate currently sits at 22.5 percent , indicating a low conversion rate from approval through to delivery.
Precinct supply breakdown
Table 6: Sunshine Coast precinct supply breakdown
Delivery rate
1,264
Current annual delivery rate
QGSO 2024 attached lot registration total for the Sunshine Coast region.
938
10-year average annual delivery rate
QGSO 2015-2024 average annual attached lot registration for the Sunshine Coast region.
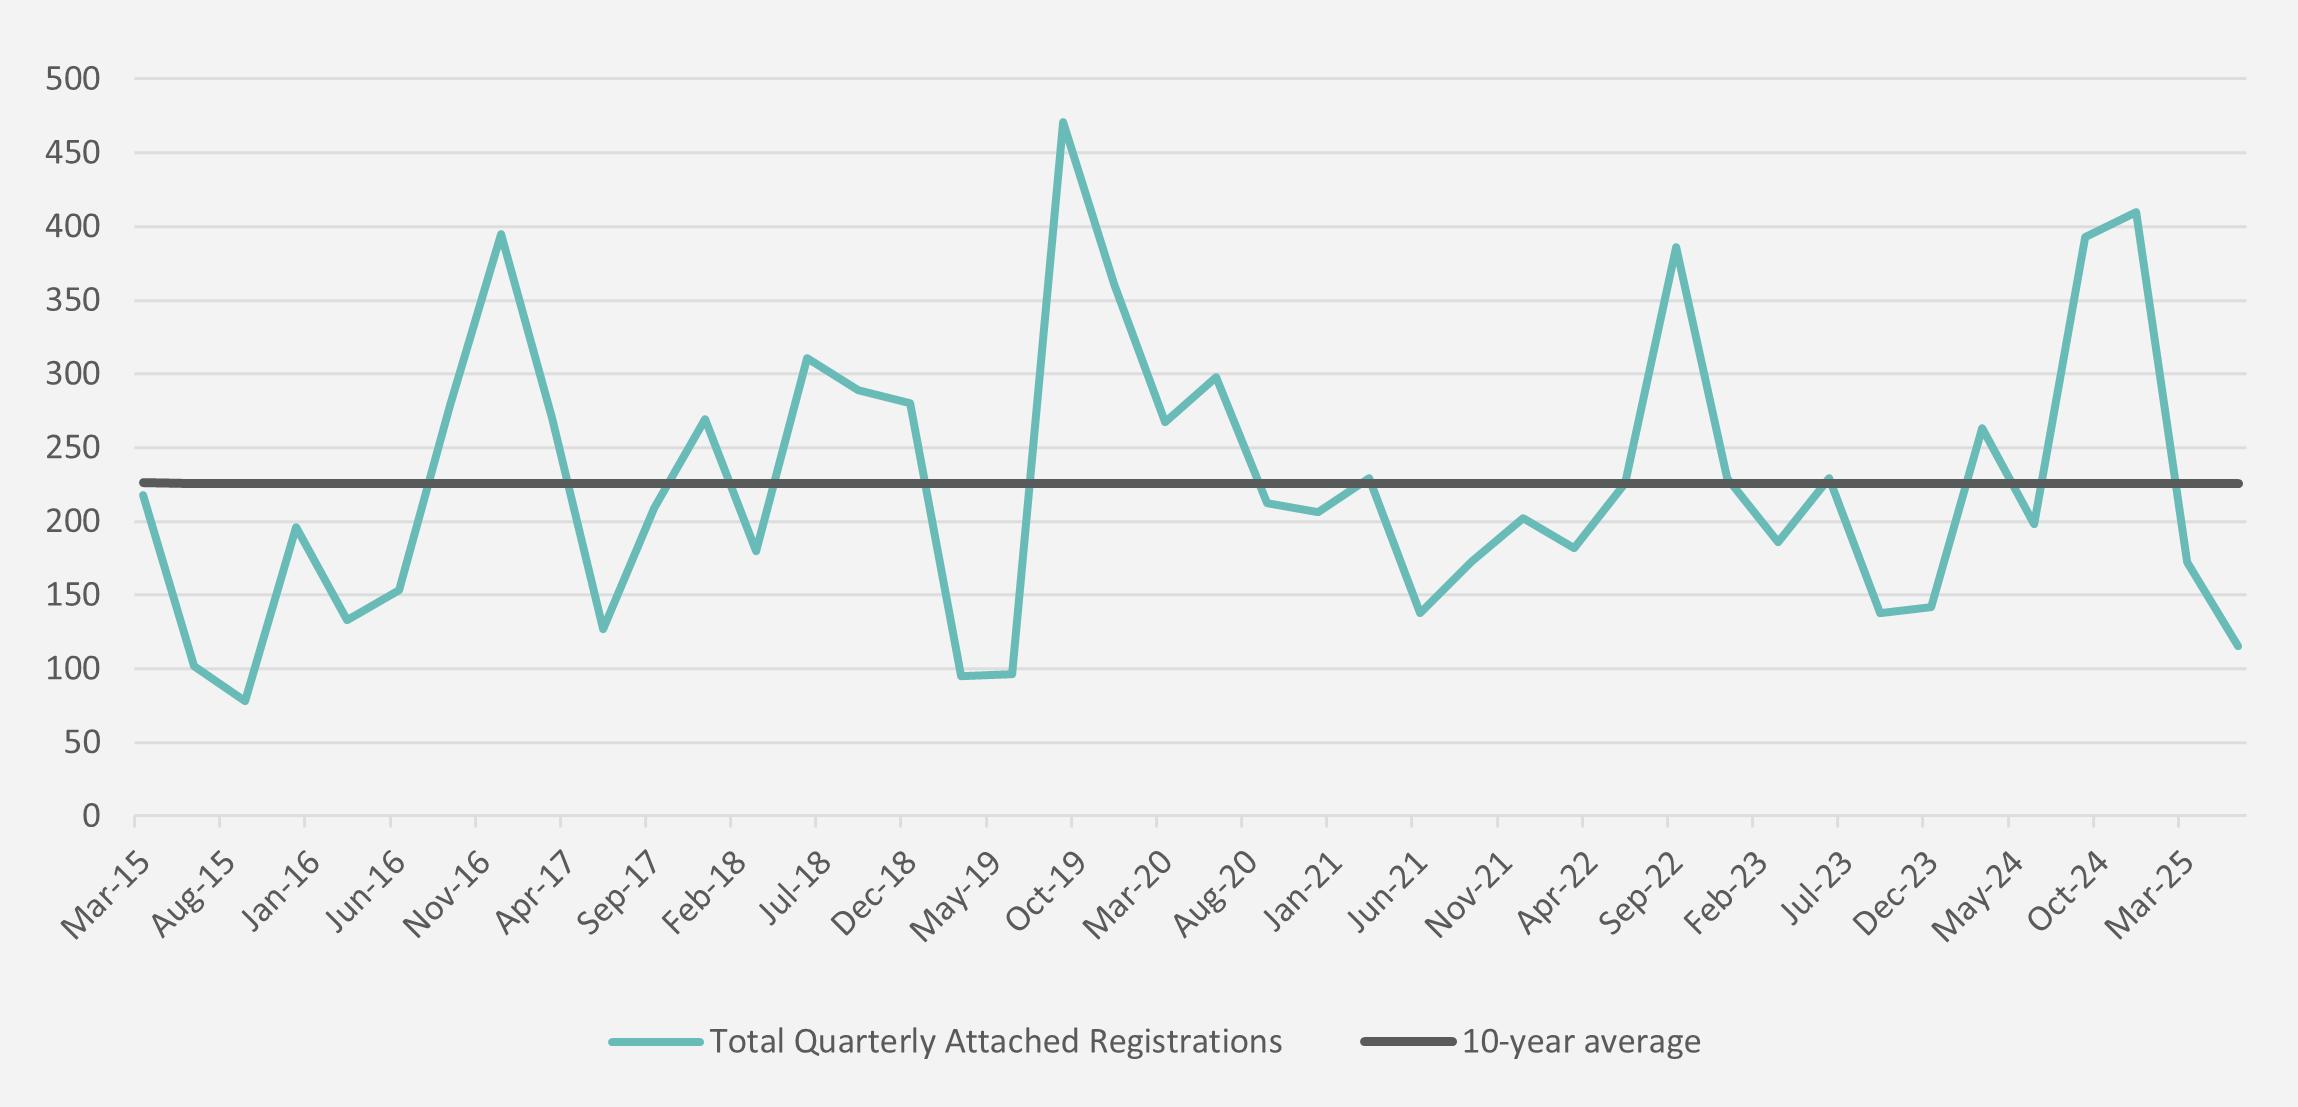
The current Sunshine Coast (2024) annual delivery rate is 1,264 attached units. Interestingly, the quarterly registrations data (Figure 9) shows a sharp decline in unit registrations at the start of 2025, indicating a significant reduction in the scale and number of active projects.
Figure 9: Sunshine Coast Quarterly Attached Lot Registrations (2015-2025) - QGSO
Avalon by Mosaic Property Group
Benchmarking against targets
The Sunshine Coast is currently delivering 77.4 percent of its annual attached dwelling target , leaving a shortfall that is compounding year-on-year. See Figure 10 below for cumulative breakdown of expected delivery rate against ShapingSEQ target with modelling for a 20 percent improvement or worsening on delivery
Note: The Sunshine Coast’s cumulative ShapingSEQ target that was used to benchmark against the delivery rate includes Low-rise attached, Medium-rise attached, and High-rise attached as defined in the plan. This was due to the delivery rate figure including all attached dwellings.
Figure 10: Sunshine Coast cumulative Annual ShapingSEQ Attached Target VS Annual Sunshine coast Delivery Rate
Zinc Bokarina by Gardner Vaughan Group
Augusta by Mosaic Property Group
SUMMARY OF RESULTS
The 2025 Apartment Supply Pipeline highlights the widening gap between South East Queensland’s apartment delivery and its housing targets.
Across Brisbane, Gold Coast, Sunshine Coast, and Moreton Bay, only 46 percent of the annual attached dwelling target is currently being achieved. While the short-term pipeline is providing some supply, the sharp fall-off in the medium and long-term horizons underscores a lack of new projects moving from approval to construction. With only around 13 percent of approvals progressing to construction, it is clear that approval alone is not translating to delivery.
Financial feasibility remains the single largest barrier to bringing projects forward.
Rising construction costs, higher financing costs, and elevated land values are narrowing the range of viable opportunities, limiting supply to premium, high-value precincts. This concentration of feasible sites reduces diversity across both location and price point, further eroding housing affordability.
Workforce constraints compound these pressures. The shortfall of skilled construction workers across Queensland threatens to delay project commencements and extend delivery timelines.
Without targeted initiatives to expand construction capacity, meet skills demand, and stabilise the industry’s operating environment, even viable projects will struggle to reach completion at the scale required.
These findings signal the need for stronger collaboration between industry and government to lift delivery performance. There is no single solution to closing the apartment supply gap, progress will require coordinated action across multiple fronts . Improvements in planning policy, approval processes and conditions, government fees and charges, infrastructure contributions, construction workforce capacity will all be needed to create the conditions for more projects to proceed.
Ultimately, the focus must shift from simply increasing approval numbers to supporting greater conditions for more financially viable projects
Improving the approval conversion rate is critical to bridging the supply gap, ensuring that the apartments approved today become the homes delivered tomorrow.
APPENDIX
Appendix 1
See below for full suburb groupings for precincts within the Focused SEQ region.
Precincts Included suburbs
Brisbane City Council
CBD ▪ Brisbane City
Chermside Surrounds ▪ Chermside
Eastern Surrounds ▪ Balmoral ▪ Bulimba ▪ Hawthorne ▪ Lota
Inner North ▪ Fortitude Valley ▪ Herston
Petrie Terrace
Chermside West
Manly
Manly West
Morningside
Murarrie
Kelvin Grove ▪ Bowen Hills
Inner Riverfront ▪ East Brisbane
Inner South ▪ South Brisbane
Inner West
▪ Norman Park
Wynnum
Hemmant
Wynnum West
Newstead
Teneriffe ▪ Spring Hill
Kangaroo Point ▪ New Farm
West End
▪ Auchenflower
▪ Indooroopilly
▪ Milton ▪ Paddington ▪ Red Hill ▪ St Lucia ▪ Taringa ▪ Toowong
Northern Surrounds ▪ Alderley
▪ Enoggera
▪ Gaythorne
▪ Enoggera Reservoir
▪ Everton Park
▪ Grange
▪ Gordon Park
▪ Kedron
▪ Newmarket
▪ Stafford
▪ Stafford Heights
▪ Wavell Heights
▪ Wilston
Northshore
Albion
Ascot
Nundah Surrounds ▪ Northgate
▪ Windsor ▪ Kalinga
▪ Lutwyche
▪ Wooloowin
▪ Clayfield
▪ Hendra
▪ Keperra
▪ Aspley
▪ Geebung
▪ McDowall
▪ Mitchelton
▪ Banyo
Pinkenba
Hamilton
Virginia
▪ Nudgee
▪ Nudgee Beach
▪ Fitzgibbon
▪ Taigum
▪ Everton Hills
▪ Ferny Grove
▪ Upper Kedron
▪ Zillmere
▪ Ashgrove
▪ Bardon
▪ The Gap
Nundah
Southern Surrounds ▪ Camp Hill
▪ Cannon Hill
▪ Carina
▪ Carina Heights
▪ Carindale
▪ Coorparoo
▪ Holland Park
▪ Holland Park West
▪ Seven Hills
▪ Tarragindi
▪ Coopers Plains ▪ Eight Mile Plains
Woolloongabba Surrounds
City of Gold Coast
Broadbeach Surrounds
Annerley
Dutton Park
Fairfield
Broadbeach Waters
Clear Island Waters
Burleigh Surrounds ▪ Burleigh Heads
Central
Burleigh Waters
Benowa
Bundall
Carrara ▪ Highland Park ▪ Merrimac
Main Beach Surrounds ▪ Main Beach
Mid North Gold Coast
Arundel
Ashmore
Biggera Waters
Coombabah
Helensvale
Northern Gold Coast
Southern Gold Coast
Coomera ▪ Hope Island ▪ South Stradbroke ▪ Ormeau
Stapylton
Luscombe
Currumbin
Tallebudgera
Southport Surrounds ▪ Southport
Surfers Surrounds ▪ Surfers Paradise
City of Moreton Bay
Redcliffe Peninsula ▪ Clontarf
Margate
Macgregor ▪ Mount Gravatt
Mount Gravatt East
Robertson
Burbank
Mackenzie
Rochedale
Runcorn
Nathan
Salisbury
Sunnybank
Sunnybank Hills ▪ Upper Mount Gravatt
Greenslopes
Stones Corner
Highgate Hill
Chelmer
Graceville
Corinda
Moorooka
Oxley
Rocklea
Sherwood
Tennyson
Yeerongpilly
Yeronga
Woolloongabba
Miami
Palm Beach
Bonogin
Mudgeeraba
Gilston
Mount Nathan
Nerang
Labrador
Molendinar
Gaven
Pacific Pines
Hollywell
Ormeau
Ormeau Hills
Yatala
Pimpama
Upper Coomera
Cedar Creek
Elanora
Tugan
Robina
Varsity Lakes
Tallai
Worongary
Reedy Creek
Paradise Point
Parkwood
Runaway Bay
Maudsland
Oxenford
Upper Coomera
Wongawallan
Kingsholme
Willow Vale
Coolangatta
Bilinga
Newport
Redcliffe
Scarborough
Woody Point
Sunshine Coast Council
Birtinya Surrounds
Central and Northern
Sunshine Coast
▪ Bokarina ▪ Parrearra
▪ Buddina
▪ Minyama
▪ Kuluin
▪ Maroochydore
▪ Alexandra Headland
▪ Mooloolaba
▪ Buderim
▪ Forest Glen
▪ Kunda Park
▪ Mons
▪ Buderim
▪ Mons
▪ Tanawha
▪ Sippy Downs
▪ Mountain Creek
▪ Mount Coolum
▪ Point Arkwright
▪ Yaroomba
Southern Sunshine Coast ▪ Aroona
▪ Currimundi
▪ Caloundra
▪ Kings Beach
▪ Baringa
▪ Bells Creek
▪ Caloundra West
Warana
Birtinya
▪ Marcoola
▪ Mudjimba
▪ Pacific Paradise
Twin Waters ▪ Yandina ▪ Burnside ▪ Coes Creek
▪ Highworth ▪ Image Flat
Nambour ▪ Parklands
Perwillowen
▪ Towen Mountain
West Woombye
Woombye
Bli Bli
Maroochy River
Parklands
Wurtulla
▪ Diddillibah
▪ Kiels Mountain
▪ Rosemount
▪ Bridges ▪ Kulangoor ▪ Maroochy River ▪ Ninderry
▪ North Arm
Valdora ▪ Verrierdale ▪ Yandina Creek ▪ Chevallum ▪ Eudlo ▪ Hunchy
▪ Ilkley
▪ Landers Shoot ▪ Montville ▪ Palmwoods
▪ Nirimba ▪ Golden Beach
Pelican Waters ▪ Little Mountain ▪ Meridan Plains
▪ Dicky Beach
▪ Moffat Beach ▪ Shelly Beach ▪ Battery Hill
▪ Beerwah ▪ Landsborough
▪ Diamond Valley
▪ Glenview
▪ Mooloolah Valley ▪ Mount Mellum
▪ Palmview
Appendix 2
See below for massing assumptions applied to sites identified as passive supply. To understand potential supply for these sites, massing assumptions were made depending on the location of the site.
Brisbane City Council
City of Gold Coast
Sunshine Coast Council
Medium Density Residential
High Density Residential 800sqm 15
Principle Centre 800sqm 30
Major Centre Zone 800sqm 15
Local Centre Zone 800sqm 12
City
of Moreton Bay
Next Generation Neighbourhood
Urban Neighbourhood