WE MAKE INVESTING EASIER

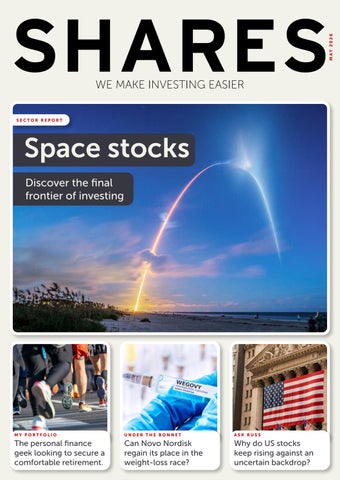
Discover the final frontier of investing

The personal finance geek looking to secure a comfortable retirement.

Can Novo Nordisk regain its place in the weight-loss race?

Why do US stocks keep rising against an uncertain backdrop?
How
Can Novo Nordisk regain its place in the
How
Space
Why are US markets close to record levels when there’s so much
Discover
The
How




It’s here to inform, not to give personal
Please don’t base your investment decisions on it alone. If you’re unsure, speak to an independent adviser. And remember: past performance isn’t a guide to the

As the domestic football season enters its final knockings and the winners are sorted from the losers its interesting and instructive to look at the fortunes of football clubs on the stock market and what it tells us about investing in general.
I may be a big football fan but there’s a reason why I don’t mix investing with the beautiful game. The first thing which stands out is the value of these businesses is very modest compared with their wider profile. Even Manchester United, the largest football club on the stock market through its New York listing and indeed one of the largest football clubs globally, has a market value which wouldn’t see it qualify for the FTSE 100.
To throw this into even sharper relief the company’s market value is less than software firm Softcat – an interesting business no doubt but one with nowhere near the profile or the brand value of the Red Devils. According to consultancy firm Brand Finance, Manchester United was number seven in terms of the most valuable global football franchises in 2025.
Celtic, while not on Manchester United’s level, is a huge global club in football terms but the London Stock Exchange’s only remaining listed football club is small fry when it comes to the financial markets.
Yet think about the level of loyalty displayed by your average football fan – it arguably exceeds even that of the fandom of devotees of Games Workshop – incidentally another stock market name whose valuation exceeds that of Manchester United. Even if the product isn’t up to scratch most football fans are for life and will grimly stick with their team through periods of underperformance. Tapping into this can be extremely lucrative –either by selling match tickets and merchandise or by attracting sponsorship from businesses which

want to be associated with the brand.
Added to this, sport is one of the few categories which guarantees a live TV audience. Broadcasting rights for the Premier League run into the billions.
Why are football clubs shunned by investors?
So why the disconnect and what can we glean from it about what to look for in a winning investment?
First of all, while football may be big business in 2026 it’s not exactly profitable and many clubs lose money. For the full year to 30 June 2025, Manchester United chalked up a net loss of £33 million.
That’s because a large proportion of the revenue they generate goes into paying talent in a competitive market to try and achieve success on the pitch. Huge sums are expended on players in transfer fees and wages which, thanks to injury and loss of form, might not even deliver any benefit to the club. That leaves very little left over for shareholders – with dividends a real rarity.
Businesses which, in contrast, can keep a tight control on the purse strings, can reward shareholders by returning cash and don’t face these sorts of extreme competitive pressures will often fly up the league table in stock market terms.
Second, football is unpredictable and the fluctuating fortunes of clubs can have a big impact on their revenue. Particularly if they are relegated from the top division or even if they narrowly fail to qualify for European competitions. What most investors are looking for when they put money into a share is consistent growth and some level of visibility on future revenue. For the most part, that just isn’t available in the world of football.

Two of the main protagonists in the AI infrastructure space – Nvidia and Broadcom –are set to offer an insight into the competitive dynamics in this surging market with their latest quarterly results.
Both chip makers coexist within the same AI hardware. Nvidia specialising in the ‘off-the-shelf’ high-performance GPUs (like its Blackwell series) which can be used to train AI models, Broadcom focuses in turn on custom-designed kit aimed to support a single customer’s specific workload. However, increasing evidence that the
hyperscalers like Alphabet-owned Google and Meta, who are pouring hundreds of billions of dollars into AI, are looking to build their own chips is a potential threat to Nvidia’s dominance of this market to date. While Broadcom is a beneficiary as the main partner for many of the hyperscalers ‘build your own’ projects.
When Nvidia posts first-quarter earnings on 20 May, data centre related work is likely to remain the primary engine of growth, accounting for roughly $62 billion of the $78.8 billion consensus forecast revenue for the quarter. The spotlight
Source: LSEG
will be on its gross margins and whether it has been able to sustain these above 75%.
Investors will also be hungry for updates on the next generation of Nvidia chips after the successful rollout of the current Blackwell iteration.
Despite continuing to outmatch expectations, Nvidia shares have struggled for momentum. Whereas Broadcom and Alphabet – whose Gemini chatbot seems to be going from strength to strength and is supported by Broadcom’s custom chips – have seen strong gains. This continues a trend of stocks with links to Gemini outperforming those like Nvidia and Microsoft associated with OpenAI's ChatGPT over the last six to nine months.
Forecast quarterly revenue for Broadcom for the month to 3 May of $22 billion implies 47% growth. The focus when it reports on 3 June is likely to be on the company’s ability to convert its backlog of $73 billion of orders into recognised revenue.
Unlike Nvidia, Broadcom derives meaningful recurring revenue from its software business which was augmented by the acquisition of VMware for $69 billion in November 2023.
As hardware takes a bigger share of overall business there is some risk of pressure on margins given it tends to be somewhat less profitable.

(Q1)☽ 20-May
& Co (Q2) ☼ 21-May
(Q1) ☼ 21-May
Source: Zacks
03-Jun
GDP (Q1) 28-May
jobs (May) 05-Jun Key: Q=Quarter. HY= Half year. FY=Full year. TS= Trading statement. ☽ = After market close. ☼ = Before market open. CPI = consumer price index. PPI = producer price index
Weekly discussions on everything investing from the teams at AJ Bell, all available on your favourite streaming platforms.
The easy way to stay up to speed with the investing world with new episodes each week from Dan Coatsworth, Laura Suter, Charlene Young and Danni Hewson.
LISTEN NOW





After working hard for years and saving money, retirement should be a time to relax and enjoy life. This is possible with a good financial plan.
Even though you might now be sitting on a nice pot of money, it is still important to manage your finances carefully during retirement. Luckily, there are effective ways to manage your money, and one of them is the bucket strategy.
The main goal in retirement is to ensure you do not run out of money. That means having a blend of growth and income from your investments. But what happens if markets go through a difficult patch?
A key risk is drawing down on your investments when they have fallen in value as that could deplete your pot sooner than you would like. One solution is to divide your money into different parts. Using three buckets helps you see which money will cover distinct stages of your retirement. Each bucket can have investments with different goals, risks, and time frames.
The three-bucket strategy is popular because it is simple to understand. This is not investment advice and there are no guarantees. It is just a method to think about.
The first bucket is for living expenses for the next two years. You might consider holding this money in cash or cash-like investments such as money market funds to shield yourself from any sudden downturn in financial markets.
It’s a similar approach to someone who might have invested over five years to buy a first home or pay for their child’s university – the last thing they want is for markets to drop just as they need to access that money so derisking ahead of the event is a natural strategy.
ISAs are ideal for bucket one as you can hold cash and money market funds in them, and you have complete freedom with withdrawals. Dealing accounts are subject to tax once you have used your personal allowances.
The second bucket focuses on income-generating investments. Having a steady income is important in retirement, so you should check where the money is coming from.
This might include equity income funds that invest in financially strong companies, investmentgrade bonds such as those issued by government or financially stable companies, or funds that contain a mixture of high-quality bonds.
These types of investments are not low risk, so the investor needs to be prepared to hold them for a longer period, such as three to seven years. That would allow for enough time to ride out any volatility in financial markets. The cash generated from dividends and bond coupons can feed bucket one.
The third bucket is for growing your money and is for funds you will not need for at least seven years. People are now living for longer so they might find their assets are insufficient at the point of retirement. Growing investments during retirement is often a necessity to avoid running out of money. Inflation is also a crucial factor to consider – you want to maintain the purchasing power of your money if goods and services are a little bit more expensive each year.
It can be comforting to have short-term spending money set aside in a separate bucket. It reduces the temptation of selling investments in the growth bucket during a market downturn. Financial markets
regularly move up and down, and patience is paramount.
Because bucket one pays the bills, and bucket two replenishes bucket one, an investor can have a much longer period with assets in bucket three. They might be happy to take slightly higher risks with investment choices and have time to ride out market ups and downs. This does not mean taking big risks, and you might not want to keep growth investments until you die, unless you plan to leave money to others.
Even though the strategy is easy to understand, it needs careful attention. This means regularly adding to bucket one without keeping too much cash that is not being used. Even though holding three to five years’ worth of cash might feel like a safety blanket, this might be an inefficient use of your money.
That said, think about any substantial changes to your spending needs in the near-term. You might need a new car or a new boiler, which means extra cash versus what you spent in the previous year.
It is also important to keep adding money to bucket two from bucket three. While you want to avoid selling investments from bucket three in a market downturn, there is still a need to periodically transfer funds into bucket two. One method might be to transfer more money when markets are rallying and less when markets are weaker.
Review the buckets every year to make sure the plan is working, you are comfortable with the risks, and your financial needs have not changed a lot.
You might argue that having a portfolio of 60% equities and 40% bonds is already structuring your retirement money into distinct pots with different risk profiles. The equities function as the growth engine while the bonds provide the income. However, separating assets into distinct buckets can be much easier for some people to understand. It is up to individuals to decide which method works for them, or even if they want to use a completely different approach.

By Dan Coatsworth Head of Markets

The phrase ‘it’s a marathon not a sprint’ was put to the test at this year’s London Marathon when two runners smashed the sub-two-hour barrier, with Kenya’s Sabastian Sawe taking home the ultimate prize. The 1:59:30 finishing time has changed expectations around the world of running forever and while his 4.33 per mile pace might challenge this slow and steady truism, the feat was achieved over years of dedicated focus, objectivity and hours of work.
This same long-term mindset is often applied to investing and just like taking on the immense task of taking part in a marathon, having a goal in mind when you start is key and planning for the longterm is crucial.
For Rayhan, his investment goals are simple: He wants to become ‘work optional’ before the state retirement age at which point he wants to be mortgage free and be able to use the 4% drawdown rule to affordably cover his family’s living expenses and enjoy at least a couple of UK holidays a year.
In monetary terms, this looks like around £1
million invested in his Stocks and shares ISA which “isn’t mega lavish, but it’s not a beans on toast lifestyle of scrapping by,” Rayhan says.
With roughly £128,000 in his ‘core’ Stocks and shares ISA today he has some way to go but, he also has a clear vision on how he’ll achieve his goal.
From premium bonds to investing in tech stocks
Growing up with three older siblings in Edinburgh, carving out any space for himself was appealing and Rayhan “definitely too young to be working” began to build up his financial independence at an early age working a paper round and cash-in-hand pot wash jobs as a young teen.
“I’ve always been attracted to having my own money and being independent,” he says. “I’ve also always been a bit of a personal finance geek.”
This hard-working mindset was inherited from his parents who moved over to the UK from Pakistan before he and his brothers were born. “I saw the work ethic of my parents, and I found it really important to be able to have a bit of money in my own back pocket,” he says.
His first foray out of just holding cash savings came in 2012 while he was studying at Edinburgh University and was introduced to premium bonds by one of his older brothers and a close friend, the latter he stills “geeks out” with about investing today.
The £25-£150 prizes he was ‘winning’ led Rayhan down a different monetary path to the one his dad had taken, largely investing in property and being “a big saver”, and he became immersed in the personal finance world and in particular, the FIRE movement.
An acronym for ‘Financial Independence, Retire Early’, FIRE is a financial movement defined by frugality, extreme savings, and investments. The idea gained traction among retail investors in the US from Vicki Robin and Joe Dominguez’s 1992 book Your Money or Your Life and took off more internationally after 2010 when Jacob Lund Fisker’s Early Retirement Extreme came out.
The central idea is determining when you want to stop working and doing the sums on what you realistically need to save to achieve one of three ‘ideal’ lifestyles
Rayhan sits somewhere between wanting more than the bare bones just paying the bills level but isn’t seeking to have “an absolutely luxurious life”.
The influences
Having made this first step into investing, Rayhan’s interest grew and he began to absorb more and more investment content through podcasts and books including Mad Fientist, BiggerPockets, The Simple Path to Wealth and Robert T Kiyosaki’s Rich Dad, Poor Dad was especially impactful on him. But while he understood the concepts, the practical steps of actually getting into the market felt elusive to him.
“I probably spent a bit too long learning about index funds...there was a confidence issue on pulling the trigger,” he says.
That gap was filled after graduation when a financial adviser came to his parent’s house to have a free 30-minute session with him, during which he was given the ‘how to’ knowledge and was told who the major platforms were and what products were most appropriate for him.
But even then it took another couple of years and it wasn’t until 2018 when he was 26 that he opened a Stocks and shares ISA and purchased
his first global tracker fund – the Legal & General International Index trust and e-learning firm Learning Technologies Group based on the idea that it was “a hot and a booming sector”.
The stock pick made a £1,500 return in one year, up 42%, “not a huge amount of money but it was a four-figure amount, and I remember thinking ‘woah ok this is good, this is making me more money than the premium bonds I had been in’”.
Getting over that initial hurdle was a big mental win, and once he’d pushed open that door, Rayhan was prepared to fully commit.
Taking the advice that his young age meant he could tolerate a more “aggressive” portfolio with a large allocation to stocks as he had time to “ride out the waves” Rayhan split his portfolio into 75% ‘core’ and 25% diversifying ‘satellite’ holdings.
The latter is made up of induvial stocks and precious metals like gold and silver through iShares trackers alongside some crypto “for a bit of excitement”.
Of the individual stock names, he currently owns: Advanced Micro Devices, Micron, Cameco, Vertiv, AstraZeneca and CrowdStrike are all up between 11% and 77% since he started holding them, while Novo Nordisk is down 70%.

His ‘core’ bucket is two global ETF trackers and arguably reveals one of the more integral parts of Rayhan’s investment philosophy. His faith.
Rayhan invests in Sharia-compliant assets, holding the HSBC Islamic Global Equity Index fund and HSBC MSCI Emerging Markets Islamic Screened Capped ETF, up 43% and 20% respectively.
The idea of choosing investments based on ethics and not just their potential for a financial return was formalised into the ‘environmental, social, and governance’ (ESG) investing during the pandemic, but many concepts within it already had decades of case study, including Sharia investing.
Pioneered back in the 1960s and 70s
when the first modern Islamic bank was foundedthe Mit-Ghamr Islamic Saving Associations (MGISA) – offering depositors a share of its profits instead of interest, otherwise known as riba and strictly prohibited in Islam.

While still regarded as a relatively niche sector, Islamic finance assets were estimated at $4.5 trillion in 2022, according to research by HSBC while the London Stock Exchange estimates that the global Islamic finance industry will reach $6.7 trillion in assets by 2027, citing strong demand from Muslim and non-Muslim investors.
When he made his pioneer investments Rayhan “didn’t know it was an option” to invest that way but since learning has made it a hard and fast investment rule.
Source:
While his confidence has grown Rayhan has had to learn some market truisms the hard way, in particular, don’t try and time the market.
“You tell yourself you’ll be levelheaded, but when you’ve made your first four figure profit you start thinking you’re Warren Buffett, that you’re the next guy.”
When the Covid sell-off happened, Rayhan was two years into his ‘proper’ investment journey and in the throes of his first bout of market volatility.
“I’m proud to say I didn’t panic sell when things first plummeted; I stayed invested. But I was hearing so much noise that everyone was predicting this W shaped double bounce so when it went back up after March, I cashed out, at a profit, but with the intention of buying back in when the second dip came.” In the end that didn’t happen, and equity markets rocketed to new record highs.
“It just kept going up and eventually I just accepted that I had missed out on some gains and jumped back in six months later in 2021,” Rayhan recalls.
“It was a lesson I had to go through that you just have to keep in it,” which he did during his second big market test after the announcement of Donald Trump’s Liberation Day tariffs in April 2025.
While still a way off his financial goals, Rayhan is enjoying the process of building a financial future for his wife and kids in a way that hadn’t felt accessible to his parents.
“My dad is proud of me, he doesn’t really care for the details so much but he’s happy I’m in a good position with my money,” he says.
Now aged 33 working in tech sales, Rayhan has become a bit of a financial guru within his extended family, with his siblings and nieces and nephews often coming to him with questions about how to be more financially educated and literate “and I love it”.
Not so far from the investment influencers he still follows, Rayhan has himself dabbled with the idea of creating investment content, especially around Sharia compliant content.
“I love talking about it and learning about it... I think that’s definitely a niche that can be further educated,” he says.

By Eve Maddock‑Jones Funds and Investment Trust Writer

Novo Nordisk
stats PE = price to earnings
Source: Stockopedia
Danish healthcare company Novo
Nordisk remains one of Europe’s largest companies by market value despite the shares falling 70% over the last two years.
The fall from grace was preceded by a 540% advance in the shares following US regulatory approval for Novo’s diabetes treatment Ozempic in late 2017.
Novo launched the world’s first treatment for obesity called Wegovy in 2021, which proved very popular among celebrities and politicians due to its effectiveness. It helped patients to shed up to 15% of their body weight over 16 months.
Wegovy became the leading weight loss brand in the US and was the only approved weight loss treatment available until Eli Lilly launched Mounjaro as a diabetes treatment in May 2022 and Zepbound as a weight loss treatment in November 2023.
Today, two companies maintain an effective duopoly in the branded weight loss market, although there are over 100 potential competitors’ products being developed as ‘next generation’ drugs.
Analysts at Morgan Stanley estimate the global obesity drug market could reach $105 billion by 2023 with optimistic scenarios putting the potential as high as $174 billion.
Studies show that obesity drugs also help to reduce risks of heart disease and other cardiovascular conditions related to obesity.
Why did Novo shares subsequently fall so precipitously?
The dramatic decline in the share price was not related to a single cause, but a combination of factors, creating a perfect storm.
Source: LSEG
Foremost was the intense competition from Eli Lilly’s Zepbound with head-to-head studies showing it induced greater weight loss in patients than Wegovy.
As a pioneer in the weight loss market Novo Nordisk became a victim of its own success and underestimated the huge demand, creating severe shortages and manufacturing bottlenecks.
While Lilly also suffered from shortages it managed the problem more effectively, allowing it to capture market share by having better product availability.
Product shortages changed the competitive landscape significantly because under FDA (Food and Drug Administration) rules competitors were allowed to make copycat versions, referred to as compounders, during periods of ‘official’ shortages.
Compounders are sold at a fraction of the listed price of branded obesity drugs which can cost hundreds of dollars a month without medical insurance.
Novo suffered more than Lilly and by mid2025 the Danish company was forced to slash its sales growth forecast to 14% from over 20%, as compounders gained market share.
These events ultimately led to leadership change at Novo with CEO Lars Fruergaard Jorgensen stepping down in May 2025 to be replaced by longtime company insider Mike Doustdar.
With shortages now removed the FDA has cracked down on compounding pharmacies and misleading marketing of obesity drugs, making it clear that the copycats are not equivalent to approved branded drugs.
Ozempic and Wegovy belong to a class of drugs called GLP-1s which stands for GlucagonLike-Peptide-1. They mimic a protein naturally produced in the body which regulates blood sugar and appetite.
Patients taking GLP-1s feel less hungry between meals and more satiated after eating.
Novo’s active ingredient is semaglutide which mimics a single hormone while Lilly’s treatment is a combination therapy comprising a GLP-1 plus
How has Novo Nordisk performed recently?
The Danish company revealed significantly better than expected first quarter results on 6 May with adjusted operating profit coming in at DKK 32.86 billion ($5.16 billion) compared with a companycomplied consensus analyst forecast of DKK 28.74 billion.
Novo raised full year guidance driven by increased growth expectations for obesity drugs. Sales growth and adjusted operating profit growth is expected to be in a range of 4% to 12% for 2026.
The company said: ‘The strong Wegovy performance, combined with continued growth in International Operations, has led us to raise our 2026 guidance for both adjusted sales and adjusted operating profit.’
oral pill takes early lead
The company launched the first ever oral obesity pill in the US on 5 January 2026 which represents a new battleground for the market, providing a needle-free alternative for patients.
Novo’s oral pill booked 1.3 million prescriptions in the first quarter which means it has now booked two million since launch, marking the company’s ‘strongest ever’ obesity launch in the US.
The pill generated sales of DKK 2.3 billion ($325 million) in the first quarter, beating analysts’ expectations.
Pending regulatory approvals, the pill is expected to launch outside the US in the second half of 2026. Unlike the superiority of Lilly injectable obesity treatment, Novo appears to have the efficacy advantage in the oral market.
Trials show the Wegovy pill helps patients lose
another hormone called a GIP (Gastric Inhibitory Polypeptide) which improves how the body breaks down fat.
Other pharmaceutical companies searching for next generation obesity drugs are testing triple action hormones combining GLP-1s, GIPs and Glucagon.
Common side effects of obesity drugs include like nausea, vomiting and other gastric issues which often prevent patients from staying on the medication.
Forecast PE Dividend yield (%)
Five-year average return on equity
Source: Stockopedia, LSEG. PE = price to earnings ratio
around 16.6% of their body weight which is more effective than Novo’s injectable version and Lilly’s oral pill.
Rival Lilly’s oral obesity pill Foundayo received FDA approval on 1 April and despite a strong start, prescriptions have lagged the take up seen for Novo’s pill.
One advantage for Foundayo which may prove pivotal is that it can be taken any time with or without food whereas the Wegovy pill must be taken on an empty stomach and 30 minutes before eating.
Uniquely Novo is controlled by the Novo Nordisk Foundation, through its holding company, Novo Holdings. This structure provides a stable, longterm ownership structure which prioritises research and development and sustainability over short term results.
Novo generates roughly two thirds of its revenue from selling GLP1 products to treat diabetes and obesity with most of the rest coming from selling insulin, and a small contribution from making drugs to treat rare diseases.
Insulin is a hormone which regulates blood sugar and the backbone of the company’s history. Novo is the world’s leading insulin maker with a market share of 50% followed by French company Sanofi and Eli Lilly. These companies hold a rough 90% share of the $27 billion global insulin market.
Patents play a key role in the pharmaceutical industry, typically giving companies 20-years of exclusivity on their inventions. When a product goes off-patent sales often slump due to competition from cheaper generics.
The ‘crown jewel’ patent for Novo is the active ingredient in its GLP-1 products, semaglutide. The primary patent was originally due to expire in the US in 2026, but patent extensions mean it is now protected until 2030.
In Europe and the UK the expiry date is 2031. Patents across China, India and Brazil expire in 2026.
The company generates industry leading operating margins north of 40% which allows Novo to selffund large capital expenditures such as the DKK 160 billion expansion manufacturing sites in Denmark and the US.
Novo has a long history of paying dividends, distributing between 40% and 50% of earnings per share. In 2026 the company launched a new DKK 15 billion ($2 billion) share buyback programme and since 2020 the company has returned over DKK 306 billion ($43 billion) to shareholders via dividends and share buybacks.


Ask Laura: Your questions answered

Ask the experts
Laura Suter is on hand to answer your personal finance questions.
If you’d like a question considered for a future edition send it in now.
I’m new to investing and have around £8,000 I’d like to put into the market, but I’m feeling overwhelmed by the number of funds available. I keep hearing about diversification, but I’m not sure what that looks like in practice.
Some people suggest just one global fund, while others talk about holding several funds across different regions and sectors. How many funds does a beginner actually need to be properly diversified?
I’m also concerned about accidentally overlapping investments if I pick multiple funds, and whether having more funds really reduces risk or just adds complexity. What’s the simplest way to build a diversified portfolio as a first-time investor? CF, via email

One thing’s for sure, you won’t be alone by being bamboozled by the options out there. Let’s tackle a key bit of jargon first: diversification. This means making sure you have a spread of different investments that react differently in market rises and falls. If you have a well diversified portfolio it means that if one part of the market falls, your entire portfolio won’t fall at once.
Diversification can mean spreading your money across investments in different countries and different sectors, as well as types of investment. To newcomers that might then feel like you need have loads of different investments or funds to achieve that goal – but that’s certainly not the case.
You could actually achieve this diversification goal with just one fund, like you reference, if you
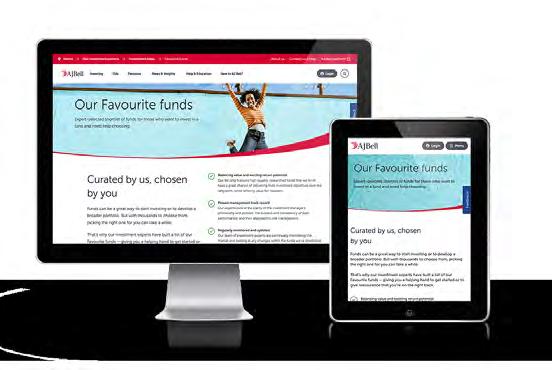
AJ Bell has its own list of Favourite funds curated by our investment experts. Key criteria include the value they offer investors, their ability to deliver on their objectives, the clarity of the manager’s philosophy, process and their track record. You can filter the list of names by size, charges, your investment goal, fund type, sector and whether they pay out or roll up income. The list is regularly monitored and updated as required.
buy a multi-asset fund, also called a readymade fund or all-in-one fund. This will spread your money across different investment types, so shares, bonds, cash and sometimes gold, and will split the money across different countries and sectors.
There are lots of different flavours of these funds, some will be badged as more adventurous and will have more invested in shares, where others will be more cautious, with a higher allocation to bonds, cash or gold. Equally, there are active and passive versions of these funds, depending on your preference. So that’s one easy option if you want a very hands-off approach.
investment platforms have a Favourite Funds list, where they have narrowed down the vast universe of funds to give a selection for different sectors, which can help with that selection process.
It’s important to note that you could own 20 funds and still be poorly diversified, so it’s more about the funds you own rather than the number of funds you own – it’s what’s inside the funds not how many you hold. That’s because you could buy two different funds that have overlapping aims and so also own very similar investments. This is particularly common with funds that have broad investing remits, such as global, US or UK funds. When picking funds you want to make sure you know what’s in each one and that each is serving a different purpose in your portfolio.
That means you could achieve a well-diversified portfolio with just three or four funds. For example, a UK fund, some emerging markets exposure, a US focus and then a bond fund. Or equally you could just own a global fund, that invests in shares around the world, plus a bond fund. Everyone’s approach will be different.
It depends how much you have to invest It also depends how much money you are investing. In your case £8,000 is a decent amount to get started with, but you don’t want to spend a chunk of your savings pot on fees. It costs money to buy and sell funds: with AJ Bell it’s £1.50 for funds and £5 for shares, ETFs and investment trusts. The more of your money you invest (rather than spend on fees) the better off you’ll be in the long term. If you had a much larger portfolio you might be more comfortable buying more funds and so spending more on trading fees. But that’s certainly not necessary.

But some people may prefer to put together their own portfolio of funds. You’re right that there are thousands of funds out there, so it can be a bit overwhelming picking the right ones for you. Most
As a first-time investor the best approach is likely to be to start off simple and build from there, as you increase your knowledge of investing and the money you are putting to work. You can start with a very simple portfolio and then add funds to it as you go. But equally many people who have been investing for a long time have a very simple portfolio – there’s no shame in that.

Space’s appeal to prospective investors is obvious. The scope and potential of what Star Trek romantically dubbed the ‘final frontier’ can feel endless.
NASA’s Artemis II mission which successfully sent four astronauts around the Moon has rekindled excitement and enthusiasm about heading to the stars – with Artemis III planning to land astronauts on the lunar surface in 2028.
Space industry dominated by satellites
And after a few failures to launch, the whole space investment theme looks set to get a lift-off moment in 2026.
While over time the space sector could encompass grand visions of colonising Mars and even moving beyond our solar system, for now a lot of the focus is on so-called low earth orbit or LEO satellites.
As their name suggests these are closer to Earth than conventional satellites and help enable things like high-speed and secure broadband and imaging.
Bank of America sums up the current thinking on the potential size and scope of this market.
In research published in late 2025 it observed: “Estimates of LEO market size range from $100 billion to $300 billion-plus and we estimate a total addressable market of $200 billion. Use cases range
LEO = low earth orbit
Source: BofA Global Research
from earthquake monitoring to 3D imaging and data storage. For our purposes we focus on the wireless, broadband, and defence markets, which we estimate at $80 billion.
“The industry is at a early stage with development, launch, operational and customer A $200bn total addressable market for LEO satellites
acquisition hurdles and the standard deviation of outcomes is enormous. But it is clear, in our view, that the market supports more than one viable LEO service provider.”
Why SpaceX is in the lead SpaceX’ Starlink business is by a distance the global leader in LEOs. Bloomberg Intelligence’s George Ferguson told AJ Bell’s Money & Markets podcast in April 2026 that: ‘Right now, SpaceX is I think a little bit shy of about 10,000 satellites in low Earth orbit, and Amazon Leo, which would be the competing product, they have something like 180 or something less than 200.’
Amazon Leo operates as a subsidiary of cloud computing and e-commerce giant Amazon and it is just one of several major technology firms participating in the corporate space race. Amazon’s Jeff Bezos is also behind space tech venture Blue Origin. Google’s Project Suncatcher is another example: this aims to advance the development of a cluster of solar-powered satellites designed to host AI processors, with initial trial launches scheduled for early 2027.
On April 27, 2026, Meta entered into a significant agreement with Overview Energy to secure one gigawatt of space-based solar power.
This system will collect energy in orbit and transmit it to Earth through infrared beams, supporting Meta’s terrestrial AI operations by 2030. SpaceX’s longer-term plans are even grander in scale with data centres in space and putting people on other planets part of Musk’s vision.
The other key area is space travel and exploration – centred around what is sometimes described as the lift or launch market. Again, as Bloomberg’s George Ferguson explains, SpaceX has a considerable headstart. “Last year SpaceX did something like 139,140 shots into orbit. And again, competitors are well beneath 100.”
SpaceX has a rare listed competitor in this area in Rocket Lab. Founded by Peter Beck in New Zealand nearly 20 years ago the company is now headquartered in California and listed on Nasdaq. Its Electron orbital rocket launches small satellites into space.
It joined the stock market in 2020 but has really taken off in the last 18 months over which the shares have advanced 624%. It is expected to remain loss making in 2026 before breaking

Richard Branson founded Virgin Galactic has sought to tap into the space tourism theme with at best mixed success. It has never turned a profit and the shares trade close to record lows. The company is in a period of transition having retired its first-generation spacecraft VSS Unity in June 2024 and is developing its next-generation Delta class fleet. Ticket sales for flights starting in the fourth quarter of 2026 have commenced. A seat will set you back the small matter of $750,000.
into very modest profitability in 2027. While full financials for SpaceX itself are not yet available Bloomberg’s Ferguson observes that it is very likely loss-making at group level.
As well as specialists, there are businesses from adjacent industries which have exposure to space. BAE Systems’ $5.6 billion acquisition of Ball Aerospace in 2025 was predicated on boosting its footprint in satellites, sensors and spacecraft.
Other big aerospace and defence businesses like Airbus, Lockheed Martin and Northrop Grumman, and smaller UK names like Melrose Industries, have some involvement in space. There is established and significant crossover between defence and space which can be traced back at least as far President Reagan’s proposed ‘Star Wars’ spacebased missile shield in the 1980s.
These offer a potential alternative way to play the space theme and, when compared to specialist operators, have more mature and reliable revenue streams from their existing operations.

Then there are the companies serving various elements of the space supply chain. One example is Filtronic – quoted on the UK’s AIM market. This County Durham business was founded in 1977 and makes specialised hardware that allows high-speed data to travel through the air using radio waves. SpaceX is one of its customers and excitement about its role supporting Musk’s space venture has helped catapult the company from a market value of £25 million three years ago to £552 million today. Revenue increased from £16.3 million in the May 2023 financial year to £56.3 million in the 12 months to 31 May 2025.
Investment bank Berenberg says: “Filtronic continues to be one of the best-positioned pureplay space names in the UK market, in our view. Recent months have seen a significant uptick in
sector newsflow, driven by increasingly frequent satellite launches and greater investor interest in the network services that will evolve to support this growth. The period has also seen developments for Filtronic, including new customer contracts and product launches, which we believe increase its potential growth.”
Based on Berenberg’s forecasts the shares trade on a price to earnings ratio for the May 2027 financial year of 56.3 times.
The fluctuating fortunes of space as an investment theme can be neatly traced through the performance of dedicated UK-listed investment trust Seraphim Space. The vehicle generated significant excitement at IPO in 2021 but subsequently stalled until late 2023. The shares
Company
Source: Serpahim Space Investment Trust, Morningstar, AJ Bell as at 30 June 2025
have really rocketed in the last 18 months – with the trust going from trading on a significant discount to net asset value to a chunky premium. Seraphim offers exposure to a diversified list of space names – many of which also have accompanying defence and security expertise.
Of its key holdings – HawkEye 360 which specialises in radio frequency signal geolocation – or in other words figuring out where something is by using the radio signals it emits – recently announced plans for an IPO. The expected $2.36 billion valuation could deliver a £11.1 million uplift to the value of Seraphim’s portfolio.
Seraphim avoids SpaceX competitors to focus on data and applications. It recently raised £137 million to enable it to capitalise on a pipeline of new opportunities.
Ongoing charges on the trust, in part reflecting its specialist nature and focus on private companies, are 1.77%.
Lower cost exposure to space-related investments is available through exchange-traded fund VanEck Space Innovators. Like Seraphim this is a concentrated fund with its top 10 holdings accounting for 60.6% of the portfolio.
Investors looking at space for the undoubted exciting potential should remember this is still a very nascent industry with lots of uncertainty over winners and losers.

By Tom Sieber Editor


You’ve spent your working life building up your savings. Hopefully making the most of the tax incentives pensions have to offer and compound returns over the long term. But retirement is the point where the impact of financial decisions can actually start to compound in reverse, if you take a wrong turn.
Here are five common pension pitfalls that could derail even the best laid plans. Avoiding them will give more control over your income in retirement and how long your money might last you.
According to the ONS, a 50-year-old man in the UK today has an average life expectancy of 84, and it’s 87 for females. Nobody knows exactly how long they are going to live for, but these estimates suggest that most people should expect their retirement savings to have to last them for
around 30 years.
Underestimating how long you’ll live, perhaps due to your family health history, could mean you run out of money too quickly and be forced to survive on the state pension alone, which might fall very short of the lifestyle you’d hoped for in retirement.
It’s also important to factor the cost of living into your figures, in other words, how inflation might impact your purchasing power over time. The state pension currently benefits from triple lock protection, but you’ll need to think about how you plan to support yourself if you’re planning on winding down before you claim it.
2
Assuming you need to take all your tax-free cash at once
Being able to take a 25% tax-free lump sum from pensions is widely recognised as one of the big pension perks, but many people either take their
full 25% tax-free cash upfront because they think they have to take it all at once or take it simply because they can.
If you don’t need the cash immediately, it might make better financial sense to access your pot in stages. You could do this by moving regular sections into drawdown – sometimes called phased or drip feed drawdown, or by taking ad hoc lump sums, officially known as uncrystallised funds pension lump sums, or UFPLS. Whatever you leave invested in the pension wrapper can continue to grow tax-free, which means the value of your total tax-free lump sum can also grow over time.
Let’s take the example of Nancy who has a £100,000 pension pot. Nancy could take up to £25,000 tax-free cash and the remainder moves into drawdown from where she can take a taxed income when she wants. She cannot take any more tax-free cash from that pension. But if Nancy doesn’t need all the tax-free cash immediately, she could access just £20,000, £5,000 will be paid out tax-free and £15,000 can move to drawdown. That leaves £80,000 untouched and continuing to grow, meaning her next slice of tax-free cash could be more than £20,000 (25% of £80,000), giving her a higher total tax-free cash amount overall.
Only withdrawing what you need will help your pension last longer and could help you manage your tax position more efficiently over time
The Money Purchase Annual Allowance (MPAA) applies when you take a taxable income using one of the flexible options, such as drawdown, or an uncrystallised funds pension lump sum (UFPLS). The MPAA doesn’t apply to any defined benefit pensions you hold or if you use your fund to buy an annuity in most cases.
Once triggered, your annual allowance for defined contribution pensions drops to £10,000 each year. You’ll face a tax charge on any
contributions over the allowance, and you’ll also no longer be able to use carry forward for your defined contribution pensions, which can limit your ability to rebuild pension savings if your plans change.
If you are still working and plan to continue paying into your pension, or you’re returning and might be auto enrolled, you might consider avoiding taking taxable income until you are sure you will not need higher contribution allowances.

This can be both in the run up to accessing your pension and if you’re already taking an income from your retirement pot.
You might run into problems if your investments and retirement plans are not aligned. For example, if you’re invested heavily in shares or equity funds, but you plan to turn all of some of your pot into a secure income by purchasing an annuity very soon, you’re leaving yourself exposed to short-term market volatility.
On the flip side, you might discover your workplace pension is invested in a lifestyle fund

or one that is targeting annuity purchase in the coming years when you actually plan to move your funds into drawdown when you access your pension.
As we highlighted at the start, your pension might need to last you 30 years or more, and a de-risking approach simply won’t stack up against inflation and withdrawals, running the risk that you outlive your savings.
History shows that being invested give you the best chance of beating inflation over the long term, but short-term market fluctuations can impact retirees who are withdrawing from their investments. The danger of having to sell your investments to withdraw income when markets are falling is sometimes called ‘sequence risk’. Most people are familiar with the benefits of compound returns when it comes to growing wealth, but withdrawals in downturns can work the opposite way, effectively locking in losses which could make it difficult for your portfolio to recover or mean you run out of money sooner.
You can mitigate sequence risk by holding short-term planned withdrawals in cash or cashlike assets, and medium-term ones (three years plus) in income-generating investments. The rest of a drawdown portfolio might be allocated to shares or equity funds, that aim to give you a real return over and above the rate of inflation in the long term.
Setting up a cash ladder or using cash like investments to help fund your planned withdrawals in the early years can help to mitigate some of this risk. It can give your invested portfolio time to recover before restarting withdrawals or even prevent you having to pause withdrawals in the first place.
Being caught out by HMRC’s emergency
Despite improvement to the tax code process for pensioners setting up regular drawdown income, the emergency tax and reclaim process remains a thorn in the side of anyone looking to make the most of pension freedoms with ad hoc withdrawals, as and when they need them.
Figures show that pensioners have actively reclaimed almost £1.6 billion in over taxation in the 11 years since pension freedoms began in 2015. But this doesn’t include many more people who’ve either chosen not to use HMRC’s forms or are unable to because they are already in the selfassessment system.
If you’re planning to take a single taxable withdrawal, one way to potentially avoid the shock of a big over taxation bill is by taking a small, notional withdrawal first. This should mean HMRC sends your pension provider the correct tax code to apply to the second, larger withdrawal. Otherwise, you’ll have to fill out one of three HMRC forms to help you receive overpaid tax back within 30 days. If you don’t do this, HMRC says it will put you back in the correct tax position at the end of the tax year.

Charlene Young Senior Pensions and Savings Expert
Ask Russ: Your questions answered


Why are US markets close to record levels when there’s so
Ask the experts
Russ Mould is on hand to answer your queries about the financial markets.
If you’d like a question considered for a future edition send it in now.
Why are US equities making new highs when there is so much uncertainty in the world, can you explain what I might be missing please?
Nigel

Russ Mould, AJ Bell Investment Director,
says:
The US stock market continues to defy the doubters. After paddling sideways for seven months, the S&P 500 index is brushing aside March’s brief stumble that followed the outbreak of war in the Middle East and moving to new, alltime highs.
For many investors this may seem counterintuitive, given the uncertain geopolitical backdrop, uncomfortably high oil prices, and the risk of further Presidential policy caprice, but there are
reasons for it.
The key now is to stress-test those reasons, check out their durability and reassess the ultimate arbiter of investment return, which is valuation: is the good news already priced in, or not?
Why does the US trade at a premium?
FactSet’s earnings estimates for 2026 put the S&P 500 on a forward price to earnings (PE) ratio of 21 times. This compares to the FTSE 100’s forward rating of 13 times, based on aggregate consensus analysts’ estimates for the UK’s premier stock index.
This may suggest UK stocks offer the better value, but it is easy to argue US why equities might deserve a premium rating.
The US is home to the world’s largest stock and bond markets, and has the deepest pools of venture capital, so entrepreneurs and companies can get ready access to appropriately priced, even cheap, funding for their businesses, especially for innovative technologies.
Regulation tends to have a lighter touch and there is also little, or no stigma attached to either enormous wealth or a business failure, so risk-
taking is encouraged, not penalised.
The 401k (employer-sponsored retirement scheme) investing and saving culture is more deeply embedded, thanks in turn to the lesser social security safety net that is available across the Atlantic.
The US is the world’s largest economy, so US firms benefit from operating at scale which generates higher profit margins. US firms are more efficiently run with few staff holidays, and lower rates of unionisation. This frees management teams to focus ruthlessly on quarterly earnings.
Are there any downsides?
None of this is new and there is scope for a political shift to the left owing to the development of, and desire to deal with, powerful quasi-monopolies and wealth inequality.
Presidential interference in the workings of the US Federal Reserve; and the prior rampant debt accumulation could crimp future spending by government and consumers alike, to the detriment of corporate profits.
The 1910s, 1970s and early 2000s respectively offer uncomfortable precedents with episodes of financial market turbulence to show for it.
In this context, it is interesting to note that the S&P 500 stands at a premium to its 10-year average forward PE of 19 times, let alone how the index’s cyclically adjusted price earnings (CAPE) ratio, as devised by Robert Shiller to take a 10-year view adjusted for inflation and interest rates, is about as high as it has ever been.
Why do investors keep buying the dips?
All that said, ‘buying on the dip’ seems to be working for US equities yet again, and there are several cogent explanations for this, too.
The strategy has a good track record that goes all the way back to the Emerging Market debt crisis of 1997-98. If the going gets tough, then investors are accustomed to central banks saving the day with interest rate cuts, bailouts or unorthodox monetary policy.
Conciliatory talks between Washington and Iran have begun, and a ceasefire declared. If this means the risk of escalation is behind us then the next logical steps are de-escalation and then peace, even if the journey may not be a smooth one.
If that is the case, the threat to inflation, growth, government finances, and interest rates from higher oil and gas prices could be more limited than initially feared. Investors can therefore focus on the prospect of interest rate cuts under the chair-elect Kevin Warsh and Republican efforts to boost the US economy in 2027, when the race to the White House in the 2028 Presidential election begins in earnest.
The first-quarter earnings season is off to a strong enough start to justify consensus analysts’ earnings growth forecasts of 19% for 2026 and 16% for 2027 for the S&P 500 overall, to new all-time highs in each year.
Research from FactSet also shows that the technology sector leads the way, with consensus forecasts pointing to 38% earnings growth in 2026 and 25% in 2027, thanks to artificial intelligence.
Source: http://www.econ.yale.edu/~shiller/data.htm
Source: FactSet
Finally, research from Goldman Sachs suggests that algorithm-driven traders and hedge funds were short in mid-March and have been caught off guard by the rally, with the result that they have had to cover those positions by buying equities, to create a multi-billion-dollar short squeeze.
A surge in the Most Shorted stocks index backs up the final argument and hints that the US equity rally may be technical, rather than fundamental, in origin.
That in turn suggests the foundations of the rally may not be as strong as they seem, especially as much rests upon AI delivering lofty productivity gains and returns on investment, but the manner in which markets ignored then Federal Reserve chair Alan Greespan’s December 1996 warning of ‘irrational exuberance shows that anything is possible. The technology, media and telecoms bubble did not peak until March 2000, after all.

At first glance, US stocks look fully valued based on traditional valuation metrics like the PE (price to earnings) ratio, but a new study by researchers at the Federal Reserve of Minneapolis suggests equity markets may be somewhat less expensive than generally thought.
This article ‘unpacks’ the new research to explain the key differences between the data used by both approaches. If the new research holds water, it could have big implications for stock markets and future investment returns.
What are traditional valuation models saying?
Looking through the lens of traditional valuation metrics like economist Robert Shiller’s CAPE (cyclically adjusted price to earnings) ratio, the US market is sitting on a ratio of 40 times, close to its highest ever mark of 44 times, hit in December 1999, during the dotcom era.
The CAPE differs from the PE ratio in that it uses 10-year average earnings instead of last year’s or next years expected earnings. Earnings are then adjusted for inflation.
Source: Robert J. Shiller
Dividends are another popular way to look at valuation although the increased use of share buybacks in recent years may have reduced their usefulness.
Nevertheless, the message is the same as seen from the PE ratio with the current dividend yield of the S&P 500 sitting at 1.1%, matching the lowest ever yield achieved in August 2000.
Shiller has also created a measure called the Excess CAPE Yield, which subtracts the 10-year bond yield from the earnings yield, calculated by taking the inverse of the PE ratio.
As Shiller points out, this measure of value has offered a great guide to how equities have fared over the ensuing decade. The current reading of around 1% implies US stocks are priced to deliver a miniscule 1% average annual return over the next 10 years.
Critics point out the Shiller PE is too backward looking. It can be argued that because businesses change, earnings from 10 years ago have little relevance to investors today. The stock market is forward looking, trying to figure out what might happen in the next decade.
One way to address this perceived drawback is to use the forward PE, which is based on consensus analysts’ earnings estimates for the next 12-months.
From a low of under eight times in 2008, the forward PE has more than doubled to sit close to around 22 times, just under the all-time peak of just over 24 times reached in January 2000.
Source: Robert J. Shiller
For context, US stocks have delivered close to 15% average annual returns over the last decade, which was only eclipsed in the 1950s when the market delivered close to 20% annual returns. Over the last 100 years, stocks have delivered average returns of around 9% a year. Excess CAPE yield and subsequent 10-year annualised excess returns
Unlike the CAPE, which dates to 1871, data for the forward PE only goes back to 1985. Although it varies to an extent it still largely gives the same ‘stretched’ valuations message as the CAPE and dividend yield.
Researchers from the Minneapolis Fed used macroeconomic data sourced from the IMA (Integrated Macroeconomic Accounts).
This is a big undertaking involving crunching data collected by the BEA (Bureau of Economic Analysis) and the FRB (Federal Reserve Board) from households, businesses and government.
They authors say this has the advantage of being a more detailed historical record of the economic factors which drive changes in free cash flow to shareholders, that isn’t available from financial accounting data for public firms. Importantly it includes the entire US corporate sector not just that component of it which is listed on the stock market
One downside of using national macroeconomic data is that it is not very timely, with the latest readings being late 2022.
The research focuses on free cash flow to enterprise valuation rather than earnings. Divide free cash flow by enterprise value and express it as a percentage (multiply by 100) to arrive at a free cash flow yield.
This is like the upside-down PE ratio we introduced earlier, except using free cash flow instead of earnings.
Annual free cash flow is the money generated by a business after deducting all operating costs,
Source: Federal Reserve Bank of Minneapolis
interest payments and investments to maintain or grow the business.
Free cash flow can be ‘lumpier’ than reported earnings which are designed to smooth expenditures like investments.
Enterprise value is the market value adjusted for debt and other liabilities. It represents the total value a buyer of company would need to pay.
The researchers show there is little difference between the two methodologies when looking at earnings-based metrics but using their version of free cash yield paints a less extreme picture of market overvaluation.
The chart shows that the free cash flow yield, while at the lower end of the spectrum, is about the same level as it was in 1982. One standard deviation is a statistical measure of how far something is from its average.
The reading in late 2022 was just shy of one standard deviation below the average which means it was within the realms of what might be expected during normal ebbs and flow in the data due to the economic cycle.
Why is the free cash flow yield not as extreme as the earnings yield?
The research paper suggests the different results stem from a greater proportion of free cash flow ending up in shareholders pockets than implied by earnings measures.
For example, free cash flow has increased from 4% of total cash generated in 1980 to 12% in 2022.
The researchers believe this can be explained by
a combination of a smaller amount of cash being paid to employees and companies forking out less in capital expenditures.
In other words, employees have taken a smaller share of the economic pie, and the pie has been able to expand with a lower investment since 1982. This could be explained by a rise in intangible assets relative to tangible or physical assets. Something which has been a feature of the corporate landscape over the past few decades. Tangible assets are things like buildings, factories and machinery.
Intangibles are things you cannot touch like brand names, client relationships, patents, installed databases and distribution networks. Intangibles are difficult to place a value on and hard to replicate from a competitive standpoint.


Source: LSEG
The authors of the paper suggest one other intriguing explanation for lower investment spending, namely a big increase in monopoly power in recent decades.
This points the finger at big technology companies which have enjoyed a period of unencumbered strong growth and influence.
The Magnificent Seven (Apple, Alphabet, Amazon, Meta, and Tesla) have seen their collective market value in the S&P 500 index more than double from 16% in 2016 to around a third, a record concentration level.
One feature driving the rise of these companies has been their strong free cash flow, due to ‘asset light’ business models.
This has changed dramatically since the arrival of AI with the combined capital expenditures of the hyperscalers projected to exceed $700 billion in 2026.
Since the Fed paper data is limited to late 2022, we do not yet know how the picture could have
changed due to the acceleration in AI investments seen over the last two years.
That said, given the technology firms represent such a significant proportion of the total free cash flow in the S&P 500, it seems reasonable to assume the free cash flow yield has dropped further since 2022.
Historically these firms have spent 12% to 15% of revenues on capital expenditures. In 2026 capital intensity is expected to hit 33% to 45% of revenues, some of the highest rates since the dotcom era in the late 1990s.
As the table shows, this will likely squeeze their combined free cash flow which is projected to drop by close to 60% before recovering in 2027, although they are expected to remain below 2025 levels.
The new research is interesting from the perspective of understanding free cash flows and their changing composition. While the free cash flow yield in 2022 was not as extreme as the earnings yield, it was still the lowest level seen in since the dotcom boom.

Ask Paul: Your investment questions answered
Ask the experts
Paul Angell is on hand to answer your questions about investments.
If you’d like a question considered for a future edition send it in now.
I’ve been investing for a while but mainly in index funds. I’m trying to become a more involved investor, but people are constantly referring to different figures and metrics. Which of these really matter?
Anne Paul Angell, AJ Bell Head of Investment Research, says:

Different investors are drawn to different metrics and there’s no golden ticket that will guarantee investment success. This doesn’t stop people from trying, and there are various formulas used to predict the success of a company, fund or bond. You don’t need to understand all of them, or even most of them, to be a successful investor. But there are a few that can help you cut through
some of the confusion and find the investments that match your needs. These metrics include total return, relative return, yield, PE (price to earnings) ratio, and sales growth.
This isn’t an all-inclusive list, but it’s a helpful starting point. In this article, we are going to focus mostly on how these metrics can be used when looking at funds, but they can also be applied to individual stocks and, in some cases, bonds as well.
Total return tells you how much the investment has grown over time, factoring in fees, dividend yields and price changes. You can find total return data on each fund’s information page on the AJ Bell website. For example, on this page you can see Fundsmith Equity’s total return in the right-hand column.
Most of us should be happy investors if our money is growing at a good rate over time, and this is what total return can tell us. It’s important to remember that past performance isn’t a guarantee of future returns, so just because a fund has had a
Ask Paul: Your investment questions answered
strong five-year run, the sixth could be different. If you are looking to invest in assets to beat an index, total return won’t tell you the full story, as it’s specific to an individual investment rather than what’s happening across the market. To make this comparison, you’ll need to look at relative return.
Relative return shows how a specific fund performed in comparison to a benchmark. This could be the average of other funds in the sector, an index that is in the same sector the fund invests in, or something else. It’s meant to give you a feel for how an investment performs relative to peers.
You can calculate relative return by simply subtracting the return of the benchmark from the return of the specific fund. If the number is positive, this means the fund is outperforming its opportunity set, and if it’s negative, it’s underperforming.
Funds that consistently outperform can be a sign of a strong management team, which could mean you earn more money than you would investing through a tracker fund. However, this is never guaranteed and often managers will go through periods of highs and lows.
When someone talks about yield, they are typically referring to the income you get from an investment. However, yield can also refer to other metrics such as free cash flow or earnings. You can find yields on that same fund or stock screener page used to see total return.
If you invest in an income fund, the income you receive is generated by the investments inside a portfolio, and that money is passed on to you.
For bond funds, yield is determined by the overall level of coupons earned, and then paid out, by the fund, along with the overall cost of the bonds / fund. So, if a bond costs £100 and has a
coupon of 5%, it will have a 5% yield and pay you £5 per year (usually split into two payments). While the yield can change depending on the price of the bond, what won’t change is how much you receive from it. This is because the bond issuer will have already agreed on the coupon they are paying on that bond over time. If they don’t make that payment, they are defaulting and this results in serious trouble for the issuer.
What this means for the investor is that the payments they receive from bonds are typically quite steady.
For stocks, you’ll be looking at dividend yield. Dividends are payments you receive from the company whose stock you hold (or hold indirectly through a fund). Note that not every company pays a dividend. Dividend payments can fluctuate so there is less certainty about the amount you will receive compared to income from bonds.
Dividend yield is calculated by the amount paid out per price of a share. So, if a share was valued at £20, and paid out £1 per share in dividends in a year, it would have a dividend yield of 5%.
If you invest in a distributing version of an income fund, the fund will pay these dividends out to you, however, if you hold the accumulation version of the fund, the dividends will be reinvested automatically.
Occasionally, you may come across an
Ask Paul: Your investment questions answered
investment with a very high yield, and you’ll want to ensure this isn’t a ‘yield trap’. A ‘yield trap’ is an investment offering a high yield to investors because it’s otherwise very unattractive and is likely to fail. For example, emerging market debt from a country like Venezuela could be considered a yield trap. While the debt offers a good payout for those that take the risk, the tumultuous nature of the investment and the high chance that it will not be paid means it is too risky for most investors.
deal – just like you might search through the sales section of John Lewis for something nice at half the price, value investors are looking for companies they believe the market is undervaluing.
The PE ratio is a great starting point for assessing value because it takes the current price of a share divided by the earnings the company has either made or is forecast to make over the coming year. If this ratio is low such as 12 or less, it indicates to value investors there could be an opportunity.
The price to earnings or PE ratio is one of the most important metrics to work out what something is worth compared to other investments. Some funds will hold a mix of PE ratios within their stocks, but other managers will lean towards lower or higher cohorts. Value investors typically look for a good
Fees aren’t a metric, but they can make a massive impact on how your money grows. In addition, unlike investment performance, you’ll often know exactly how much you’ll be charged in fund fees throughout a year. Funds can have a large range of fees, and they aren’t always tied to performance. If you don’t do your due diligence, you could end up paying more for a fund that performs worse than its peers.
Funds that have experts choosing the holdings (called active funds) are typically more expensive than those that track an index (called passive funds). The average annual charge for an active fund that invests in global equities is 0.64%, while the average charge for a passive fund tracking global equities is 0.2%, according to FE Analytics. These fees may seem miniscule, but they make a difference over time.
For example, if you invested £10,000 in two funds that both had a return of 5% over 10 years, but one had a fee of 0.2% and one had a fee of 0.64%, you’d be out £712 because of that extra fee.
PE ratios vary by region and sector. Areas more associated with growth, such as tech companies in the US, will typically have higher PE ratios of 25 times forward earnings or more. This is because people are more focused on the earnings potential of these companies.. On the other side, a utility company in the UK may have a much lower PE ratio because investors believe its earnings growth potential is modest.
If you want to understand how the PE ratio of a company has looked over time, you can use the CAPE or cyclically adjusted PE ratio. It shows the PE ratio across the past 10 years, and adjusts for inflation, so you can see in a single picture where the PE ratio sits now compared to historically. CAPE ratios aren’t always the easiest metric to gain access to, so it may be an option that is more for investors who pay for additional analytics services.
While value investors tend to prioritise ratios such as PE, growth investors will need to consider other metrics to decide if the higher price is worth the company’s potential. Sales growth shows the percentage change in the sales of a company over time. Typically, growth investors will go after a high (and positive) percentage change, but it’s not the only metric they consider. If you’re investing through a fund, it’s worth seeing which metric the fund tends to emphasise as this can be an indication of their philosophy.
There’s lots of metrics to consider when investing, but remembering the basics, like total return and investment fees, often still end up being the most important checks for investors to make.

The FTSE 100 has been enjoying a recent revival versus its S&P 500 counterpart in the first sustained rally since the 2007/8 financial crisis. Much to the joy of those looking around for some non-US equity options. While US stocks have still largely outperformed their UK counterparts, the gap is much smaller than it was.
Beyond Brexit, a revolving door of prime ministers and chancellors created an unsteady backdrop for the UK equity market which was put on a major discount for the US. That gap still exists, and is also a function of the more tech-focused growth names which dominate Wall Street, with the FTSE 100 trading on 13.1 times the next 12 month’s forecast earnings, a sizeable discount to the S&P 500’s 20.8-times rating.
Data from funds network Calastone’s shows £9.55 billion was withdrawn from UK-focused equity funds in 2025. This marked the 10th consecutive year of outflows with total outflows over the decade hitting £54.3 billion.
But some funds with a UK focus have managed to perform well despite these headwinds, among them investment trust Rockwood Strategic. “There’s been so much going on externally that you can always find a reason not to invest,” says manager Richard Staveley.
Noise is one thing investors are always told to ignore, and for those dedicated to UK stocks, the past 10 years have been a real test of this skill.
Source: LSEG
A mixture of global market dynamics and UKspecific events saw UK stocks perpetually unloved by international and even domestic investors for much of the last decade.
Staveley’s trust was the only member of its IT UK Small-Cap universe to have delivered top quartile returns over both 10 and five years, making it part of the 10% of UK focused funds which have beaten their peer average and performance benchmark during those periods.
How each one did it varies but a common thread
many of the managers point to is the stock picking discipline they’d applied across the years.
“What a lot of investors have told me is that they’re interested in good old fashioned stock picking. Someone with a bit of cajónes that isn’t buying next year’s nonsense drama but actually buying businesses that are real and is very focused on it,” says Staveley.
The UK is broadly characterised as a more cyclical market, made up of banks and energy stocks which are good for people seeking dividends but not so ideal when growth stocks are in vogue. And for several years, even the UK managers weren’t buying the banks.
The City of London investment trust, one of the largest of the UK Equity Income portfolios with almost £3 billion in assets under management, was one of the 33 names with top quartile returns over 10 and five years.
Up until three years ago it’d been underweight the banking sector as it “tends to have a defensive bias” manager Job Curtis explains, and in the aftermath of the financial crisis the banks were – to put it mildly – not in great shape.
But back in 2023 when interest rates began to rise for the first time since the crash, one of City’s analysts flagged that banks’ “structural hedge was being underestimated by the market”, Curtis said, creating a “very favorable tailwind” for the likes of NatWest and HSBC, both of which are in the trust’s top ten.
Since then, both stocks have made more than three times the FTSE 100’s 46% total return, but “banks were trading at discounts and tangible book value which shows the markets dim view of their prospects”, Curtis says.
It wasn’t just the interest rate environment swinging back in banks’ favour Curtis explained. In the years since the credit crunch banks had rebuilt their capital, and the regulatory environment has reassured investors’ faith in them.
Source: LSEG
How value investors have dealt with the defence rally Defence companies have been increasingly popular with investors in recent years, sparked by Russia’s invasion of Ukraine, changes in US defence policy
which are forcing European countries to up their military spend and broader geopolitical tensions.
After a stellar run, defence stocks suffered the largest fall in five years at the end of April, with a near 10% share price decline amid questions over manufacturers keeping pace with demand flared up.
Fidelity Special Situations and Fidelity Special Values are run by Alex Wright and Jonathan Winton, and the latter says that since he joined the management team in 2015 “we’ve probably invested in pretty much every defence company in the UK”.
Ultra Electronics, Meggitt, Chemring and more recently Babcock, have all featured in the trusts, but the team’s process is to look at companies “when they are out of fashion, which [for defence] was a few years ago,” Winton says.
When an area like defence suddenly captures the market’s attention Winton says this means the sell discipline is put to work given the trust’s status as a value investor which looks to recycle its earnings into new ideas and buy into early-stage turnarounds.
Winton adds: “There’s always a real risk of selling too early and leaving something on the table. That’s just what ends up making you a bit more comfortable as a value investor and sticking to your philosophy and process.”
Some of these names have been exited, while others have been taken over and left the stock market, Babcock, Rolls-Royce and Serco remain constituents of the portfolio.
The AJ Bell Investments team has both products
on their Favourite funds list, partly because of this dedicated contrarian approach.
“[They] look for overlooked or unloved companies with a catalyst for change that hasn’t been factored in by the market,” AJ Bell wrote.
Taking advantage of the moment
Along with some UK-specific sources of market worry since 2016, the Covid-19 pandemic and the global shutdown sent global markets into one of the biggest tailspins on record.
Nick Purves, one of the two managers of Temple Bar trust, says that the pandemic was a key buying opportunity for value investors like himself as equities across the board took a hit. But just because a company’s valuation takes a hit, that doesn’t mean it becomes a value stock, he explains.
On the flipside Temple Bar’s fellow manager Ian Lance has spoken a lot about not allowing ‘style drift’ when stocks are in soaraway mode and when bumper returns could tempt investors away from their rules.
“So much money in the market today is not invested in fundamentals or cash flow; it’s passively invested on a short-term investment basis. And that should increase the opportunity for those who continue to focus on the fundamentals,” Purves says.
By Eve Maddock‑Jones Funds and Investment Trust Writer

Every month in these pages AJ Bell’s head of markets Dan Coatsworth takes you through different facets of income investing. Generating an income from the stocks and funds you hold is a big part of why many people put their money to work in the stock market.
That’s because stocks do not just offer the ability to make gains when share prices go up – they also offer the prospect of income from the dividends they pay out.
You may want to take this income to help meet specific day-to-day expenses but, alternatively, by reinvesting this income investors can tap the full potential of the markets and not just protect their wealth but also create the possibility of giving it a major boost.
The power of compound interest was described by Albert Einstein as the eighth wonder of the world. How does it work? Well, if you put £1,000 into an account which pays interest of 6% you’ll have £1,060 after one year. Next year, you’ll be earning 6% on the £1,060 rather than just the original £1,000.
That might not seem like a big deal, but the
effects can really stack up over time. How does this concept apply to the dividends from shares? A company’s dividend yield is calculated by dividing its full-year dividend per share payment by its share price. In many ways this yield is similar to an interest payment – offering a return which is proportional to your holding.
The difference compared to interest payments is that by reinvesting the income you’ll be steadily increasing your level of holdings and setting yourself up for even greater returns down the line. This effect is magnified if the level of income paid out by an investment is also growing. A topic we’ll return to later in this article.
The Barclays Equity Gilt Study 2025, an annual piece of research which provides a useful benchmark of returns from different types of investment, shows that if you had put £100 in UK stocks in 1945 and reinvested income you would be sitting on £326,231 as at the end of 2024 compared with £11,570 if the income wasn’t reinvested.
There are two main things to look for when it comes to dividends. One of those is the dividend
yield but equally important can be the level of dividend growth.
Inexperienced investors might find it hard to comprehend why income growth might ever be preferable than income yield. However, high dividend yields are often the result of a falling share price. This can be a warning sign that something is wrong with the company or its end markets and therefore dividends may not be sustainable.
Strong share price performance means the yields offered by dividend growth companies may not be the most eye-catching but over time they could still prove excellent investments. The ability to consistently grow a dividend implies a stock is cash generative, shareholder-friendly and has consistent track record.
You can run a few checks to assess whether a company is able to sustain dividend payments. An excessively high yield such as more than 8% suggests the market sees the dividend as unsustainable and it is often proved right. Dividend cover – that is how many times the forecast dividend per share is covered by earnings per share – can also provide some insight.
Dividend cover of two times or greater offers some comfort. A dividend cover figure below one times implies the dividend will be paid out of retained earnings and/or debt. There are only so many times you can raid the corporate piggy bank or back-up funds before the money runs out.
Ultimately a dividend is paid entirely at a company’s discretion. Investors can limit the risk of being too heavily exposed to a dividend cut by investing in income funds. By doing so it you also benefit from the expertise of the fund manager who can do the research to check the income stream from an individual company looks sustainable (albeit at a cost).
Investment trusts are particularly good at delivering dividend growth and consistency in that growth thanks to a structure which allows them to hold back income from bumper years to cover them in leaner years.
Industry body the Association of Investment Companies compiles a list of ‘’Dividend Heroes which have increased their dividend every year for the last two decades. Some can trace their dividend growth streak all the way back to the 1960s.
1. Are dividends guaranteed
No. They is no obligation for any company or fund to pay you dividends; they are free to start paying and then scale back or cancel them in the future.
2. Why are they paid in the first place?
They are management’s vote of confidence in a company’s future prospects. They tend to be paid out of cash generated from operations that isn’t needed for investment in the business. A fund will have stakes in lots of different companies who may pay dividends, so it collects those payments as a shareholder and then distributes some or all of that cash to its own investors.
3. I want to buy a stock or fund to get its dividend – is there a cut-off point to qualify?
Companies and funds will publish dates in their financial results that specify the timetable for dividend payments. The ex-dividend date is the most important. This is the point at which the share price will adjust to assume the money had been allocated to the qualifying investors. You need to own the shares before this date to qualify for the dividend.
4. How quickly does the money get paid?
Payment periods vary from company to company, or fund to fund. Some will pay you the cash in a matter of weeks; others can take several months to distribute the money. The exact payment date will appear alongside the ex-dividend date in the financial results.
5. How often are dividends paid?
Again, the frequency is variable. The ‘norm’ is for companies to pay every six months. Funds are increasingly paying dividends on a quarterly basis; there are even some who pay every month. This is because their underlying investments will probably be paying dividends at different times through the year, so the fund scoops up what’s come in every quarter and then redistributes the cash to its own shareholders.
6. Are dividends always paid in cash?
Generally, yes. A few companies will also offer payment in new shares – known as ‘scrip’ –although these are becoming increasingly rare.
However, these increases can be fairly piecemeal as having this status is a useful marketing tool.

There are two main ways a company can return cash to shareholders. They are dividends (either regular or one-off ) and buybacks. Typically, once a firm has purchased its own shares they are cancelled, thereby reducing the number of shares in issue. The positives to take from a buyback is they can be more tax efficient for shareholders assuming they would prefer to be taxed on a capital gain than the income from dividends, if you opt to retain your shares you will have an enhanced stake in the company and will be liable for more dividends in the future (if they are paid) and finally it implies the management team of a company, rightly or wrongly, believe the shares are undervalued.

By Tom Sieber Editor
Source: Association of Investment
to 7 May 2026
To provide a greater level of insight, the table ranks these Dividend Heroes by their annualised dividend growth.
You can access the free AJ Bell Money & Markets Deep Dive podcast in the usual podcast places. It looks at a range of investment topics in detail including pensions. Income
will be covered in
Ask Rachel: Your retirement questions answered


Ask the experts
Rachel Vahey is here to answer questions on pensions.
If you’d like a question considered for a future edition send it in now.
I want my employer to make contributions into my SIPP. How do they do this for the first time and what do I have to do?
Tom Rachel Vahey, AJ Bell Head of Public Policy,

says:
Saving for retirement can sometimes seem a daunting task. However, it’s always good to remember that you have got some valuable
help from both your employer and from the government.
If you are 22 or older and earn over £10,000, then your employer has to automatically enrol you into a pension scheme. The minimum contribution is 8% of a band of earnings, with at least 3% coming from your employer. When you pay in 4% the government adds in another 1% in respect of tax relief on your pension contributions. That employer contribution can make a massive difference to the size of your final pension pot, especially if your employer offers to pay a higher contribution, which is sometimes dependent on you also increasing your contributions too.
Although automatic enrolment has been a big success in getting more people to save for retirement it’s not without its flaws. One is that your employer controls which pension scheme you use to save for your retirement; usually employees

Want to find out more about pensions – our hub has a series of video guides and articles covering topics from how to build a pot in the first place to what happens to your pension when you die and how you can access your pension at retirement.
There are also useful tips on how to avoid fraudsters targeting your retirement savings and how to use AJ Bell’s very own pension finder tool to track down those longforgotten pots.
don’t get a choice and instead have to settle for the pension scheme the employer has picked.
Any employee who doesn’t want to save in the employer’s chosen pension scheme should act carefully. There is little point in opting out of that scheme if it means that they miss out on the employer’s pension contribution, which can be very valuable.
Instead, a good starting point is to ask the employer if they are willing to contribute to the employee’s chosen pension scheme instead. Some may choose not to as this means additional administration for them. But if they are, then that may mean the employee has to opt out of the automatic enrolment scheme and instead the employer can pay the contribution into their chosen pension scheme. If the employee opts out of automatic enrolment they will have to be reenrolled into the main scheme again in three years’ time, when they can opt out again.
The employee may have more control over
the employer’s pension choices, if they are a director or if it’s their company. In this case, paying a pension contribution alongside dividends or salary as remuneration, and to extract profits from the company, may make sense to reduce tax liabilities. Employer pension contributions are normally allowable business expenses that reduce Corporation Tax and are not subject to income tax or national insurance contributions.
Onto the logistics. Employer contributions are paid gross – in other words without corporation tax being deducted first. Employers can usually pay into an AJ Bell SIPP through bank transfer or direct debit. They can pay a lump sum or regular contributions.
If your employer wants to pay a lump sum you will need to set up a single payment request. You can do that by adding in your employer’s details. We may need to do some checks on your employer, but if everything is confirmed we will provide you with payment details to give to your employer so they can make the payment.
If your employer wants to set up a regular payment by direct debit, they should complete an employer monthly contribution form and send it back to us.

DISCLAIMER IMPORTANT

Shares magazine is published by AJ Bell, authorised and regulated by the Financial Conduct Authority. It’s here to inform, not to give personal advice. Please don’t base your investment decisions on it alone. If you’re unsure, speak to an independent adviser. And remember: past performance isn’t a guide to the future. Tax benefits depend on your circumstances and tax rules may change.