
How the experts pick the winners




Weekly discussions on everything investing from the teams at AJ Bell, all available on your favourite streaming platforms.
The easy way to stay up to speed with the investing world with new episodes each week from Dan Coatsworth, Laura Suter, Charlene Young and Danni Hewson.
LISTEN NOW



04 EDITOR’S VIEW
When everyone owns the same stocks, where should investors look next?
05 MONTH AHEAD
UK bank earnings: rates, buybacks and capital returns in focus
07 UNDER THE BONNET
Could Apple’s cautious approach to AI turn out to be the smart move?
10 UNDER THE BONNET
Every little helps – Tesco uses scale, data and loyalty to stay ahead
13 FUNDS
How to distinguish genuine investment themes from ‘fads’
17 FEATURE
The cash flow metric private equity loves and the stocks it helps uncover
20 ASK RUSS
What are the signs of a market bubble?
23 RETIREMENT IN FOCUS
Are the newly updated Retirement Living Standards up to scratch?
26 SECTOR REPORT
Hidden UK industrial champions investors should know about
31 ASK PAUL
Why would I invest in an active fund when trackers are cheaper?
33 INCOME INVESTING
Why companies cut dividends – and how to spot the next ones at risk
36 ASK SARAH
How much capital gains tax will I pay if I sell an investment in different chunks?
38 MY PORTFOLIO
How I invest: The dad making sure his kids will retire early as well
41 ASK RACHEL

20 13

What will happen when my daughter inherits my pension? 38 26



Shares magazine is published by AJ Bell, authorised and regulated by the Financial Conduct Authority. It’s here to inform, not to give personal advice. Please don’t base your investment decisions on it alone. If you’re unsure, speak to an independent adviser. And remember: past performance isn’t a guide to the future. Tax benefits depend on your circumstances and tax rules may change.


Going against the tide means fighting against our inherent make up. It’s a longstanding tenet of behavioural finance that humans are driven by herd behaviour and we can see this dynamic at play in the markets on a regular basis.
For us as investors, this creates the risk of getting involved in a crowded trade which the US Treasury has defined as situation “in which market participants have large and similar positions, creating the risk that there will be insufficient liquidity should market participants seek to unwind their positions simultaneously”.
During the dotcom boom people frantically put huge amounts of money into internet-related stocks even though they often had no track record of cash flow, profits or sometimes even revenue.
They were then left to absorb painful losses when sentiment towards the sector turned and everyone rushed to exit these speculative investments at the same time.
This is an extreme example but a relevant one given the comparisons drawn with the current AI trade which has dominated financial markets in recent years.
Investment bank Bank of America notes: “Higher rates, lower free cash flows [as hyperscalers like Amazon, Alphabet and Meta spend heavily on AI] and record index concentration have sent investors into stocks that are smaller, less expensive, and less crowded.”
It believes there is scope for more rotation with $21 trillion in US household cash, some 33% over
the pre-Covid trend, and notes the returns from cash still look limited when you factor in inflation.
At the same time, the AI trade, and the US tech sector more broadly, has been a great place to invest for a long period up until 2026. Many of us will have significant exposure to it because, as Bank of America points out, the market is very concentrated and lots of people start their investment journey by investing in vehicles which offer broad exposure to global markets.
It might not be practical or even sensible to steer clear of AI entirely but you can consider investing elsewhere to help bring a bit more balance to your portfolio. Bank of America highlights four areas which it thinks offer relative value compared with AI-related stocks.
These include Latin American shares, banks, gold miners and undervalued small caps. On Latin America it says: ‘Latin America equities are the least expensive region globally at 10.6% [earnings yield], with relative earnings yield to the US approaching all-time highs.’
The earnings yield is the inverse of the price to earnings ratio, where you divide the earnings by the share price and express the result as a percentage.
On gold miners it observes that “free cash flow is 10 times higher than it was in 2020, with half the long-term debt as a percentage of equity”. While on global small cap value stocks it notes they trade at an 8.6% earnings yield which is 3.7 percentage points higher than the S&P 500.

The major UK banks are schedule to report firsthalf earnings between the back end of July and early August 2026.
Heading into the numbers, bank shares have continued to outperform the FTSE 100 benchmark with HSBC shares up by around a fifth and Lloyds up around 12% while NatWest and Barclays have lagged.
Interest rate expectations, which are critical for bank’s net interest margins have been on
rollercoaster ride, with expected rate cuts giving way to hikes after the outbreak of the US-Iran war led to an inflation scare.
Current expectations are pricing in a quarter of a percentage point hike for November, which would bring official rates to 4% and there is a 50/50 chance of a further hike in December.
The higher for longer rate environment means banks continue to enjoy solid returns of their loan portfolios, while mortgage pricing has
stablised since March.
Structural interest rate hedges (where banks look to smooth income) continue to act as a tailwind for the sector as older hedges roll over at higher yields.
For example, in its first-quarter results on 29 April, Lloyds said year-on-year net interest income growth of 8% was driven by ‘strong’ structural hedge income.
A focal point of interest for investors will be possible changes to capital allocation policies following the Bank of England’s plan to relax leverage rules, freeing up hundreds of billions in balance sheet flexibility.
Shore Capital’s Gary Greenwood believes that while the BoE’s proposal could in theory support a bigger balance sheet on the same amount of regulatory capital, he doesn’t expect a large change in lending appetites.
Over the past couple of years banks have used their strong balance sheet to return capital to shareholders via dividends and share buybacks.
Lloyds is in the middle of a £1.75 billion share buyback, and NatWest is returning £750 million while Barclays has already deployed a £1.5 billion program in 2026 as part of its commitment to return more than £15 billion to shareholders between 2026 and 2028.
NatWest’s £2.7 billion acquisition of wealth manager Evelyn Partners has drawn some negative attention, in part because it reduced the bank’s minimum regulatory capital ratio.
Alongside the current £750 million buyback, management paused the next programme until for first half of 2027 as the bank focuses on integration of Evelyn Partners.
Analysts anticipate HSBC could resume share buybacks in the second half of 2026 after pausing them to absorb the rest of its Hong Kong subsidiary, Hang Seng bank in 2025.
The bank has indicated a minimum Tier 1 Capital ratio of 14% as the trigger for a resumption of share buybacks, making an announcement at the half year results feasible.

Overseas stocks Alphabet (Q2) ☽ 22-Jul Tesla (Q2) ☽ 22-Jul
Texas Instruments (Q2) ☽ 22-Jul
Intel (Q2) ☽ 23-Jul
Exxon Mobil (Q2) ☼ 24-Jul
American Express (Q2) ☼ 24-Jul
Visa (Q2) ☽ 28-Jul
Coke-Cola (Q2) ☽ 28-Jul
Boeing (Q2) ☽ 28-Jul
Microsoft (Q4) ☽ 29-Jul
Meta Platforms (Q2) ☽ 29-Jul Arm (Q2) ☽ 29-Jul Apple (Q3) ☽ 30-Jul
Amazon (Q2) ☽ 30-Jul
Berkshire Hathaway (Q2) ☽ 01-Aug
Pfizer (Q2) ☼ 04-Aug
Eli Lilly (Q2) ☼ 05-Aug
SpaceX (Q2) ☽ 05-Aug

Some analysts believe Apple is at risk of falling behind in the AI race due to its slow adoption and the delayed roll-out of advanced features.
Critics point to the recent revamp of its natural language interface Siri, which was unveiled at the Worldwide Developers Conference and met with a decidedly muted response from investors.
Rather than building its own foundational AI technology, Apple is partnering with companies like OpenAI and Alphabet-owned Google alongside integrating third party technology into its devices.
There is a view that this approach could damage Apple’s image as an innovator and turn the iPhone into a ‘delivery mechanism’ for competitors’ technology.
Analysts at Morningstar see this as a problem because historically, Apple’s innovations have acted as a hook for consumers to upgrade to the latest iPhone and other Apple devices, creating a flywheel effect.
Staying out of the AI arms race Apple’s caution might be vindicated if the AI arms race turns out to involve billions of wasted capital expenditures, not able to earn a decent return.
Apple Share price: $313
Market cap: $3.2 trillion
PE 2026: 33.7
Dividend yield: 0.35%
PE = price to earnings
Source: Stockopedia, as at 5 July 2026
In contrast to hyperscalers like Alphabet, Microsoft, Amazon and Meta who are depleting their cash resources and adding debt to their balance sheets, Apple has net cash of $54 billion on the balance sheet, giving the company financial flexibility which its competitors are foregoing in their hunt for AI dominance.
Apple is essentially making a bet that owning the interface and the device, and pushing its best-inclass privacy and security standards will be more important for its customers in the long run.
It is worth taking a moment to consider the significant differences in capital expenditures and free cash flows that analysts are projecting for Apple compared with the hyperscalers.
As the tables show, Alphabet is forecast to allocate $238.5 billion to capital expenditure in 2027, nearly 20 times more than Apple is expected to spend.
Consequently, analysts believe Apple’s free cash flow will be almost 10 times that of Alphabet ($151.3 billion versus $16.8 billion) in 2027. Free cash flow is the money left over after deducting all expenses, taxes and capital expenditures from revenues.
Apple generates oodles of free cash flow, which represented 36% of annual revenues and around 90% of earnings per share in 2025.
Apple has been regularly buying back shares and reducing the cash on its balance sheet over the last decade.
Share repurchases took a notable step up after the 2017 US Tax Cuts and Jobs Act allowed Apple to repatriate its overseas cash pile at a reduced rate.
Since fiscal 2012 through the first quarter of 2026 Apple has returned a cumulative $1.2 trillion to shareholders through buybacks and dividends.
Analysts are projecting a further $108 billion of share buybacks and $16.2 billion of dividends in fiscal 2027.
Apple has reduced its net cash pile from $153 billion in 2012 to $54 billion at the end of the second quarter 2026.
Shares repurchased and cancelled reduce the share count which mechanically increases earnings per share. Over the last 11 years, roughly twothirds of earnings growth has come from the effect of share buybacks.
The iPhone generates half of group revenues, but it is far more important than just a piece of welldesigned hardware because it is also the gateway to 2.5 billion active users who sit at the heart of Apple’s money-making machine.
Apple just doesn’t sell phones; it is increasingly becoming a services business fuelled by recurring subscription revenues, which generate double the margins achieved by the hardware business, growing two to three times faster.
What matters is how much the installed user base will spend over the coming years across Apple’s services hub. As long as iPhone sales keep chugging along at 4% to 5% growth, the installed base keeps widening.
Services now comprise more than a quarter of group revenues and are likely to grow to around of

third over the next five years.
Within the $109 billion service revenue segment, the App Store is the largest, generating revenues of $32 billion, with the remainder spread across iCloud, Apple Music, TV+, Apple Pay, advertising, and AppleCare.
The App Store averaged 850 million weekly users globally in 2025, with Apple typically taking a 15% to 30% commission on app purchases and subscriptions.
Advertising is Apple’s fastest-growing sub-segment and possibly one of the least appreciated by investors. Within the App Store search results are controlled by Apple which means it creates valuable ‘high intent’ users.
Indirect advertising is dominated by Apple’s deal with Google, which independent analysts estimate the latter could be paying Apple around $25 billion a year to remain the default search engine on Safari.
The smallest segments including Mac, iPad and Wearables, which collectively bring in another $100 billion of annual revenues.
Apple’s strategy is simple and effective: to sell premium hardware which attracts customers into its ecosystem and keep them there.
Like many successful businesses Apple operates a vertically integrated business model. It designs its own chips (A-series, M-series), operating systems, apps, and it owns the retail experience and distribution.
Apple never competes on price but on desirability, which limits the markets in which it can operate but also protects the brand’s identity. It also protects margins as seen recently when Apple announced price hikes related to the rising cost memory chips.
Increasingly, Apple’s strong privacy policy is becoming a key competitive advantage against the likes of Google and Meta who have been accused of data-harvesting and allowing bad actors to exploit their customers.
Because Apple is vertically integrated it faces competition across several industries including hardware, software, and digital services in entertainment, media and financial services. For practical purposes, Apple is commonly compared with the large US technology companies and looking at these, Apple trades on a premium 12-month forward PE (price to earnings) ratio of 35 times.
To give some historical context, this is the highest forward PE Apple has traded on since November 2007, when it reached 37.6 times.
Interestingly, in 2011 Microsoft traded on a forward PE of just 9 times while Apple was on 10 times, and Google was on 14 times, while Meta was yet to make its debut on the stock market.

Martin Gamble Shares and Markets Writer

There’s little doubt about Tesco’s position in the UK grocery sector. It dominates in a way which is beginning to match the high watermark of the 2000s when its share of the market was above 30%. The share price too has surged in recent years to approach levels last seen in the late noughties and early 2010s.
But what is behind Tesco’s competitive strengths and what can the business do to sustain them in the future?
Most people reading this will be very familiar with Tesco, you may even shop there, but it is still worth taking a moment to go through all elements of the business in detail. Its retail business generates the lion’s share of revenue with 3,724 stores across the UK, Ireland, Czech Republic, Hungary and Slovakia. This part of the group operates across a range of formats, including online, large and convenience stores, selling food and groceries as well as clothes and homewares under its F&F brand. Its Tesco Marketplace platform, launched in 2024, sells a range of third-party products.
Tesco
Share price: 455p
Market value: £28.7 billion
PE 2027: 14.7
Dividend yield 2027: 3.4%
PE = price to earnings
Source: Stockopedia, as at 26 June 2026
Leading UK food and drink wholesaler Booker is the next largest contributor to revenue, serving caterers, independent retailers and other customers. One Stop is a retail convenience business with more than 1,000 company and franchise stores across the UK.
Tesco Mobile has some 5.5 million UK customers and has nearly 600 phone shops across the
different countries in which it operates. Plus, while it sold its banking operations to Barclays in 2024, Tesco still offers insurance and money services while operating the third largest ATM network in the UK.
What might surprise people more is that this humble grocer also owns an analytics business –dunnhumby. This outfit uses AI to parse customer data and deliver insights which can drive loyalty –not just in Tesco’s own business but for third parties too. While its contribution is modest in the context of the wider group, it still generates hundreds of millions of pounds in revenue.
Using data to drive customer loyalty
Tesco was an early adopter in this sphere thanks to the launch of Clubcard in 1995. More recently this loyalty scheme has been used to offer discounted
prices to members, with a relaunch in June 2026 allowing 16- and 17-year-olds to take advantage of its benefits. A recent probe by UK competition authorities into loyalty card schemes put Tesco and others in the clear as it confirmed the loyalty prices offered did provide genuine savings.
Clubcard prices and the personalised and targeted offers served up by Tesco using its customer data have been a powerful tool in driving repeat business and lifting its market share to the current 28.7%. These advantages and the company’s huge scale, which conveys enviable buying power and allows it to keep a lid on prices, have also helped it to see off the challenge posed by the German discounters which have had a more damaging impact on the likes of Morrisons and Asda.
Supermarkets typically operate with razor thin
Based on rolling 12-week periods
Source: Kantar Worldpanel
Under the Bonnet: Tesco
margins, though they do benefit from typically taking cash from customers for products before they pay suppliers, and Tesco’s latest trading statement for the first quarter of its current financial year created some concerns and saw the shares slip back.
One area of worry was that profitability could be squeezed as it expands its Aldi Price Match scheme to Tesco Express stores. A continued weak showing for Booker, which reflected a tough catering market, was another negative.
CEO Ken Murphy was also conservative in his commentary on the outlook which accompanied the update.
Undoubtedly, a difficult consumer backdrop is a challenge for Tesco, particularly if there is a significant spike in food prices thanks to the disruption from the Middle East conflict, but ultimately demand should prove resilient given a weekly shop is a non-negotiable for most households.
A more structural risk to consider is the proliferation of weight-loss drugs and the impact this might have on shoppers’ figurative and literal appetites. Though some observers, notably seasoned retail sector analyst, Shore Capital’s Clive Black, believe there are opportunities for Tesco here. Black notes there is a ‘notable fresh food opportunity’, and adds: ‘Overall, our gut feel, no pun intended, is that such drugs are positive for Tesco.’
How can Tesco grow earnings and how is it valued by
Earnings growth has two obvious drivers, assuming Tesco doesn’t pursue a significant international expansion, having largely failed with previous efforts in Asia and the US.
One is to continue leveraging its scale. This can help to drive down prices, thereby further strengthening its competitive position, and boost margins as costs rise less quickly than volumes. The other is to use its strong cash generation to buy back shares. When you add in growth in the dividend there is potential to generate attractive total returns for shareholders.
The company’s valuation on a price to earnings (PE) basis is some way in excess of its sole remaining point of comparison on the UK market: Sainsbury’s which it has comfortably outmatched on the stock market for a long period.
Source: LSEG
However, it does trail a long way behind US retail giant Walmart in terms of forecast PE. The size of the latter’s e-commerce operations, its presence in a US market which enjoys a broader valuation advantage over the UK and its burgeoning use of technology put it in a different category to Tesco in its current guise.
Tesco- forecast price to earnings
Walmart- forecast price to earnings ratio
Source: LSEG
But even trading on half the multiple Walmart enjoys would represent a significant rerating of the shares and provides something for Tesco to aspire to, assuming it can continue to deliver and build on its existing strengths.

By Tom Sieber Editor

Markets are full of investment themes, the most popular of late being AI, with debates around robotics and drones abounding in conversations about the next emerging cutting-edge area.
But what actually makes something a long-term, investable strategy versus a flash in the pan frothy fad or trend?
A myriad of ETF and thematic investment experts distilled the distinction down to several factors, but the key one was longevity.
Joanna Smith, head of ETFs at stockbroker Peel Hunt, says trends are typically driven by headlines and hype “with popularity pushing prices and causing market momentum over relatively brief periods.”
A recent example of this was the ‘meme stock’ craze, which took off during the pandemic after short sellers co-ordinated their efforts on social media to bid up certain shares, often paying little to no regard to the sales and profits of these companies.
The most notable example was the ‘GameStop saga’ in 2021, when the flagging video game retailer
saw its share price rise from $20 to nearly $500. GameStop was a very specific market event involving a retail investor rebellion against hedge funds, but it has become emblematic of the hypeand-crash cycle of trend investing.
“Trends are often characterised by significant price swings and higher risk,” Peel Hunt’s Smith says, while Yi Shi, a manager for thematic equities at Pictet Asset Management, colloquially calls them “fads...reflecting more cyclical or time-bound developments”.
A theme on the other hand is not just looking at the next few weeks or months, but over years and even decades, underpinned often by government spending, societal shifts and viable, profitable revenue streams.
BlackRock tracks data points from academic research, patent filings, and private market funding to help them discern what products and potential themes are launchable. “All of this is about real-world adoption. We want to see clear evidence of basically investment, demand, and economic impact,” says Omar Moufti, lead product strategist for thematic and sector ETFs at iShares .
“An investment trend is typically something
Renewables and nuclear now account for 41% of global electricity, but intermittency remains the key challenge. Global storage capacity growing at 23% per year, led by next-gen batteries and hydrogen.
Global storage capacity growing at 23% per year, led by next-gen batteries and hydrogen. AI coding tools already boosting corporate software developers’ productivity by 20–40%.
150+ extreme weather events in the past year globally caused $320 billion in economic losses, 40% above the decade average. Climate adaptation (infrastructure, retrofits, early warning systems) now as critical as mitigation.
Generative AI enabling a revolutionary leap in robotics. ~619,000 industrial robots expected to be installed in 2026; humanoid robots and robotaxis emerging.
Agentic AI enabling more sophisticated attacks; a hacker infiltration occurs every 39 seconds. Global cybersecurity spending growing around 14% per year — major opportunity for AIpowered defence.
Ageing populations driving shift to preventative healthcare. Ageing populations driving shift to preventative healthcare. AI accelerating drug discovery, diagnostics, and disease prediction. Proactive investment could add up to 15 extra healthy years per US citizen, per Deloitte research.
Consumer shift away from ultra-processed foods toward natural, local ingredients. GLP-1 drugs and tighter food regulation accelerating the trend.
Behind the shift sits a much larger ecosystem including power grids, renewable energy generation, battery storage and the industrial companies building the infrastructure needed to generate, store and distribute electricity.
AI and ‘big data’ are not just about the applications consumers interact with. They also rely on semiconductor manufacturers, data centres, cloud infrastructure providers and the growing energy demand required to support more intensive computing.
Quantum computing continues to advance, ranking highly in terms of academic research papers and patents filed. By share of total US patents, quantum is comparable to where AI was in 2019, i.e still at an early stage but showing tremendous promise.
investors can see here and now. It often appears in headlines, drives short-term market moves and centres on a small number of companies attracting significant attention,” says Sam Manchanda, head of North EMEA at Xtrackers..
“Trends focus on what is winning today, while themes focus on what could drive growth tomorrow,” adds Manchanda.
Why is thematic investing so popular?
“Why do people like themes? Because we’re wired to like stories,” says Steve Wreford, manager on the Global Thematic Equities team at Lazard Asset Management.
Traditional portfolios are usually “anchored” to a region, sector, or benchmark Wreford says, “or nothing and they are just a handful or names... all methods which we think are suboptimal”.
“Anchoring a portfolio to the biggest structural changes is a very sensible way to begin the process of asset allocation,” he explains.
ETF’s role in galvanising thematic investing
Thematic ETFs are one of the main ways investors engage with the practice of thematic investing, and these vehicles have brough it to a wider audience.
“What was once a niche, expensive and timeconsuming exercise is now available to a wider range of investors,” Peel Hunt’s Smith says.
“ETFs were designed to provide fast and costeffective access to areas of the market that might otherwise be difficult for many investors to get
exposure to.”
iShares’ Moufti calls this the “democratisation” of markets, how ‘you are able to apply what you see in the real world to your portfolio”.
They can also provide access to a theme which may not pass Wreford’s ‘investment pool size’ mark but could be a good future investment opportunity.
HANetf announced the world’s inaugural Ukraine Reconstruction ETF, which is “very early to market... there isn’t a defined category for how companies will generate revenue from the rebuild of the country. But we think they will in the future... but you don’t want it to come later, you want to have the product in place”, HANetf’s head of research Tom Bailey notes.
Does a flood of fund launches signal you’re too late?
When an area is popular you will often see a rush of passive products come to market. In 2025, this was evident with the ‘European Defence’ trade.
This does lead to concerns that by that point “it’s already been well picked over by the market”, Wreford says and that the smart money had already been made. But WisdomTree’s Tahir counters that there would be a very easy way to measure if this was true.
“Thematic funds would never make any assets under management increase post launch if that was the case or go on to perform well, but that isn’t the case.”
One of the biggest investment themes at the moment is space, with the record-breaking IPO of Elon Musk’s SpaceX acting as a catalyst.
It’s been attached to high valuations and a bubble debate, making some wonder if ‘space’ was a niche trend or a fully fledged theme.
Wreford focuses on three criteria to determine this and, according to him, space only passes two out of three.
1. Does it tie into other themes?
“In my mind, a great theme encapsulates multiple structural changes,” Wreford says.
“It’s all very well saying there’s going to be one big thing happening in markets and buy those companies, but finding a set of stocks which participate in multiple themes that’s very, very powerful because you have multiple tailwinds and increases the return opportunity.”
“It also builds in some humility in case you get one wrong,” he adds.
Space does tie into multiple structural trends, such a technological change, supply chains, communications technology and less realised ideas such as ‘orbital commute “so it passes there,” Wreford says.
2. Time horizon
On time frames, Wreford says this is what previously relegated space to a “frontier theme”, since it wasn’t something that would generate a lot of growth over the next three to 10 years. “Now though, we’ve reached a point where you can start to have that conversation and say ‘absolutely it’s there.”
3. Enough stocks genuinely making money from this theme
Finally, you need a big enough investment pool for diversification.
AI has been a recent case study of this, with firms desperate to attach themselves to the huge amount of investment interest in ‘AI winners’.
For Lazard’s Global Thematic Focus fund, Wreford said there should be at least 10 stocks per theme able to make a “reasonable return on investment... but you want to have 20 to 30 names
broadly associated with that theme, otherwise you’re just a leader for those 10 names”.
The exact number varies from manager to manager and, according to Mobeen Tahir, a member of WisdomTree’s research team, theme by theme.
Taking UCITS regulations as a given baseline, Tahir says that their strategic metals and rare earths, renewable energy or battery solution ETFs have 100 plus names, while uranium, nuclear energy and quantum computing are 40 to 50 with cybersecurity around 25 to 50.
This range can change as the theme develops but “if you don’t have 100 publicly listed, liquid companies that you can include in an ETF that are ‘pure players’ you don’t want to be diluted by putting Amazon or Google or ‘big tech’ in cybersecurity say... So you can’t set a minimum number of companies, but it’s not going to be five either”, Tahir says.
Revenue is also a key metric for determining whether stocks are really part of an investment theme or just a very niche trend.
This also has ranges depending on where a firm sits in the hierarchy of the theme, but generally, you’d want a company to be generating say 50% of its revenue. This avoids portfolios having a thematic strapline of ‘AI’ or ‘space’ say, but when you look under the bonnet it’s essentially a repackaged version of the Nasdaq 100 Tahir explained.
Going back to space, Wreford argues that while it ticks the boxes in terms of multiple structural drivers and time horizon there’s some “warranted scepticism” about the ‘investability barrier’ for public markets.
Not everyone agrees, with others arguing that space will be one of the main sources of growth and returns in the coming years, with the former heavily invested in SpaceX.
Seraphim Space Investment Trust has become a posterchild for the space economy theme, however, it is worth noting that most of the companies which the trust holds are private.

By Eve Maddock‑Jones Funds and Investment Trust Writer
Free cash flow yield has a strong following among value and quality-oriented investors. It is seen as a cleaner measure of value than traditional valuation metrics like the PE (price to earnings) ratio.
Unlike reported earnings which are shaped by accounting choices like how to reflect the valuation of assets, when to recognise revenue, and whether to deduct certain items of spending, free cash flow is harder to manipulate.
Free cash flow is the amount of cash left after deducting from sales, all operating costs, taxes, interest payments, investment in working capital (inventories and receivables) and capital expenditure, sometimes shortened to capex.
Quality-oriented investors like Terry Smith split capex into two parts. Maintenance capex is the part needed to keep the lights on and remain competitive while growth capex is the part related to expanding operations.
Fast growing companies tend to redeploy free cash into the business, with the goal of generating a return on that investment and increasing profits.
Because they use up free cash flow to invest, they often end up showing zero free cash flow.
This makes it hard to compare growing companies so, investors like Smith estimate maintenance capex and deduct that from operating cash flow. In doing so they can achieve the effect of looking at companies in a steady, ex-growth state.
How do you calculate free cash
yield?
Free cash flow yield is simply free cash flow expressed as a percentage of market value or free cash flow per share expressed as a percentage of the share price.
For example, Unilever generated free cash flow per share of 415p in 2025 and dividing that by the recent share price of £45.47, gives a yield of 9.1%.
Though sometimes enterprise value, which is the market value with any debt or cash on the

balance sheet added on or subtracted respectively, is used instead.
How do you interpret free cash flow yield?
Investors use a threshold yield to signal whether a company might be attractively valued. Terry Smith tends to compare a company’s free cash flow yield to the market’s free cash flow yield.
In his recent first-half report Smith stated that the weighted average free cash flow yield of his portfolio was 4.3% while the S&P 500 had an estimated yield of under 2%.
“Hopefully this reinforces the suggestion that we have not abandoned our strategy of seeking to own good companies at fair or better valuations,” wrote Smith.
Smith expects the companies he owns to grow their free cash flows, so he tends to think about free cash flow yield plus the expected growth rate in free cash flow as an approximation of expected investment returns.
Growth-oriented investors tend to use discounted cash flow models to calculate the theoretical value of a business, sometimes referred to as intrinsic value.
The concept of calculating intrinsic business value based on future cash flows was first mathematically formalised by John Burr-Williams in his seminal book: The Theory of Investment Value in 1938.
The idea was adopted and popularised by Warren Buffet and his business partner Charlie Munger. Decades before it became common
practice on Wall Street, Buffett would spend hours scrutinising corporate cash flow statements.
Private equity investors often use free cash flow yield to search for potential takeover targets.
Because private equity firms borrow money from banks to make acquisitions, they look for companies which are moderately indebted which have high free cash flow yields.
This indicates a company can generate sufficient free cash flows to service a higher debt burden.
In summary, a high free cash flow yield indicates a company is generating lots of cash in relation to its market value. This could be a signal the shares
are undervalued, or it could mean investors are questioning the sustainability of cash flows.
As always, valuation metrics like free cash flow yield and PE are just starting points for conducting further research and they should never be used in isolation.
With that caveat in mind, we have searched the FTSE 350 universe, excluding investment trusts to uncover companies with the highest free cash flow yields.
The following table shows the highest free cash flow yields based on analysts’ average one-year forecast free cash flow forecasts.
To provide a wider perspective and sense check, we have also included year two free cash flow yields and one-year forward PE ratios.
Harbour Energy sees cash flow boost from big acquisition
Independent oil and gas company Harbour Energy has a cash flow yield of 35%.
This unusually high yield can be partly explained by the combination of a falling share price, linked to scepticism over the sustainability of high oil prices, and a transformational acquisition which has boosted oil production and cash flows.
The company recently completed the $11.2 billion acquisition of Wintershall Dea which turned Harbour Energy from domestic player into a global company with production assets in Norway, Germany and Argentina.
Harbour Energy recently raised its 2026 free cash flow guidance from $600 million to $1.4 billion, based on a Brent Crude price of $80 per barrel.
Harbour estimates a $5 change in the price of Brent oil impacts free cash flow by $150 million.
Endeavour Mining is showing capital discipline
Endeavour Mining sits on a 25% free cash flow yield which partly reflects the risks associated with the countries it operates in due to its gold mining operations in the Africa nations of Côte d’Ivoire, Burkina Faso, and Senegal.
There is some investor scepticism over the sustainability of the gold price which has rocketed from under $2,000 per ounce three years ago to its recent high of more than $5,200 per ounce.
The West African gold miner delivered record profits and free cash flows in the first three months through March, driven by realisation of high gold prices.
Between 2026 and 2028 the company expects to return minimum dividends worth $1 billion, provided the gold price remains above $3,000, and return $2 billion at prevailing gold prices, comprised of dividends and share buybacks.
Vistry is hit by a perfect storm Housebuilders have faced the perfect storm in recent years created by rising interest rates which
have reduced mortgage affordability and rising input costs which have impacted profitability.
Vistry has issued several profit warnings over the last two years and its latest warning in July was accompanied by the departure of its chief finance officer Tim Lawlor.
The company’s high free cash flow yield reflects a few factors including a falling share price, the shares are down around 80% over the last two years, and recent management actions to improve cash flow.
Vistry entered 2026 with around £600 million worth of unsold homes and to clear them, the company has been heavily discounting while also cutting back on buying land.
These actions are expected to result in a surge of cash flow in the short term.
The cash is expected to remain in the business to reduce debts, rather than be paid out to shareholders, after the company suspended share buybacks in May and dividends in March 2025.
The priority is to build a net cash position by the end of December 2026.
Diversified oil and gas major BP has cut its annual capex budget to roughly $13.5 billion for the next couple of years while also targeting structural cost reductions of $4 to $5 billion.
These actions are expected to see a greater proportion of operating cash flows convert into free cash flows and partially explains BP’s 16% free cash flow yield. BP is targeting a growth rate of more than 20% a year on in adjusted free cash flows on average across 2026 and 2027.
Investor scepticism around BP’s pivot away from investing in the energy transition has impacted the shares which have underperformed peers over the last few years.
Activist investor Elliot Investment Management, which built a stake in early 2025 has urged BP to be more aggressive in its corporate overhaul including selling off underperforming refineries and retail networks.

Martin Gamble Shares and Markets Writer


Ask the experts
Russ Mould is on hand to answer your queries about the financial markets.
If you’d like a question considered for a future edition send it in now.
There’s a lot of excitement about the SpaceX IPO but I keep hear people talking about a market bubble. How I am I supposed to know if we’re really in one? Are there any signs to look out for?
Emma

Russ Mould, AJ Bell Investment Director, says:
The SpaceX initial public offering (IPO) continues to stimulate debate. Whether that relates to the structure of the deal; the company’s valuation; whether it will prompt rivals to also come to market; the direction of the Artificial Intelligence (AI) industry; how AI’s development is to be funded; the impact of AI spending and investment on the economy and jobs, good or bad; and whether all of this means stock markets, or at least the AI- and technology-related parts of them, are in bubble territory.
What is undeniable is that SpaceX’s shares got
off to a flying start. However, bearing in mind legendary, if now retired, investor Warren Buffett’s aphorism that, “rising prices are a narcotic that affects the reasoning power, up and down the line”, it may be worth trying to step back to take a look at the potential wider implications for investors’ portfolios.
SpaceX does not affect just Elon Musk’s personal wealth and the development of the space and AI industries, but the wider economy and also stock markets. Colossal investment in the data centres that drive the Large Language Models (LLMs) that power AI, and all of the construction work and components behind them, from silicon chips to cables to cooling kit to earthmovers, is boosting US GDP right now. The idea is also that AI drives longterm growth thanks to productivity gains.
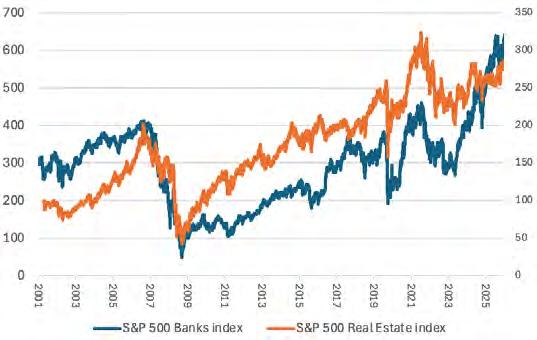
Bears will growl about malinvestment to match the Japanese property bubble of the 1980s, the global internet bubble of the 1990s and US real estate boom of the early 2000s, and this remains a risk. An investment bust to match those could have deleterious consequences for the real economy as well as the financial one, where any downturn could play to the naysayers’ fears a bubble is forming.
After Space X’s soaraway debut, 13 of the world’s 14 biggest firms by stock market capitalisation are technology or AI related. Such a skew does seem reminiscent of prior episodes where one industry, sector or group of companies fired investors’ imaginations and came to dominate sentiment and stock market indices as a result. Others include the ‘onics and ‘tronics stocks of the late 1960s in the US; America’s Nifty Fifty in the early 1970s; technology, media, and telecom stocks worldwide in the late 1990s; and residential real estate and mortgage-lending specialists in the early 2000s. All of those were rewarding for supporters during the boom and deeply painful during the subsequent bust. Spotting the turning points is the hard bit. Anyone went bearish on the technologyladen Nasdaq Composite in June 1999 at 2,500, on the grounds it had shot up by 70% in nine months, eventually looked pretty smart, given how the index bottomed at 1,114 in autumn 2022 and took until 2015 to recapture its eventual high. But in the meantime, the benchmark motored from 2,500 to a peak of 5,048 in March 2000 to leave any bears looking very foolish for another nine months, while the internet, mobile telecoms technology and semiconductors eventually delivered everything of what investors thought they were capable – and then so much more besides.
Market timing is a fiendish business, as noted by another retired money management titan, Fidelity Magellan fund’s Peter Lynch, when he asserted: “Far more money has been lost by investors preparing for corrections, or trying to anticipate corrections, than has been lost in corrections themselves.”
Selling everything in a particular asset class and then buying it all back is not practical, for reasons
of expense, liquidity, and tax, as well as market timing. But exposures can be flexed to calibrate risk, protect wealth, and potentially augment it, so investors might like to use this checklist as a guide to where they think tech and AI stocks, and equities more generally, may be in this particular upcycle.
Bubble indicators could include:
Stock indices that are heavily skewed toward a select band of strongly performing or in-favour companies or sectors
Companies change their name so they can jump on the hot-sector bandwagon
Looser accounting standards and greater acceptance of companies’ own preferred profit metrics and ‘EBBS’ (earnings before bad stuff)
A lowering of the accepted standards of corporate governance and executive conduct in the pursuit of profit
Stock splits
It is presented without comment, but classic developments in the later stages of an equity bull market – and especially a bubble –can include the following. 1 6 2 7 3 8 4 9 5 10
A rash of new stock market initial public offerings (IPOs) and then follow-on share; sales by management or early-stage backers in (often loss-making) companies
Brokers and bankers use increasingly inventive valuation methodologies to justify current share prices and further increases in them
Launches by, and leaps in assets under management at, new investment funds or products which specialise in fashionable market areas
Advertising during media coverage of major global events is dominated by a particular hot and fashionable industry or group of companies
Financial markets move from the middle-to-back sections of newspapers, magazines and website and up to the front


It’s rare that pensions are out of the news, but we’ve seen a sharp focus on whether people are saving enough for a decent retirement and what a decent retirement looks like. The interim report from the Pensions Commission report was published in May, estimating a whopping 15 million people weren’t saving enough and we also saw an update to figures that illustrate costs of different lifestyles for retirees, which also estimated that less than one in 10 had a chance of a ‘comfortable’ retirement.
There’s no doubt the headlines are shocking, but it’s important to dig into the detail of how retirement lifestyles are measured and calculated. It’s not a perfect science, but knowing a bit more about they’re calculated can help you work out what you need personally, which might be different to the headline figures.
How much do you need to retire?
Two of the most widely used benchmarks to help people crunch the numbers in the UK are:
• Pensions UK’s Retirement Living Standards (RLS); and
• Target Replacement Rates (TRR).
The RLS are designed to give a guide to what the public thinks should be part of minimum, moderate or a comfortable lifestyle in retirement, and how much they would need to spend to reach these living standards. Each level uses a range of common goods and services to calculate an income figure, after tax.
As a guide, the moderate living standard allows for one two-week holiday abroad together with a UK mini-break every year, some help with DIY, and a used car replaced every seven years. It also allows for takeaways and eating out a couple of times a month as well as money to spend on clothing and personal items.
A TRR takes a different approach. Instead of focusing on spending, it uses your earnings at or before retirement and how much, as a percentage, you need to replace with a retirement income. TRRs assume pensioners would want to maintain the same standard of living in retirement that they had during their working life, and to do that, they’d need to maintain a level of pension income related to their pre-retirement earnings. The Pensions Commission favour using TRRs in their reports. Rather than fixed monetary values for certain
Increase from last year
Previous Updated
Minimum (basic)
Moderate
Comfortable
£13,400
£13,900
£31,700
£32,700
£43,900
£45,400
£10,000£15,000£20,000£25,000£30,000£35,000£40,000£45,000
Source: Pensions UK. Living standards after spending figures, after any tax
Increase from last year
Previous Updated
Minimum (basic)
£21,600
Moderate
Comfortable
£20,000£30,000£40,000£50,000£60,000
Source: Pensions UK. Living standards after spending figures, after any tax
lifestyle targets, TRRs work on what you’d need to replace to meet an ‘adequate’ income.
For example a median earner, would look to replace 67% of their pre-retirement earnings. Someone earning less than £15,900 might need 80% of that in retirement, while anyone earning more than £67,000 may need less, at 50%.
The Department for Work and Pensions continues to use TRR to measure whether people are saving enough for retirement. In its 2025 adequacy analysis, the DWP estimated that 43% of working-age people were under saving when measured against their target replacement rates.
What are the limitations of the RLS?
One of the biggest limitations of the living standards is that housing costs are not included in the headline figures. This might reflect retired life for those becoming mortgage free, but we are expecting to see more people continue to rent through retirement or face having to pay their mortgage even as they start accessing their pension. Extra housing costs will of course reduce what you can spend in retirement compared to
someone who is mortgage free. There is also the risk that the pension pot values quoted to generate each living standard, particularly at the top end, simply put people off.
Earnings Bands (2023) TRR
Less than £15,900
£15900 to £29,000
£29,001 to £42,000
£42,001 to £67,000
Above £67,000
Source: Pensions Commission Report Evidence Pack
Inflation remains very sticky and has been baked on top of the double-digit prices hikes we saw in the cost-of-living crises in the early 2020s. This has all led to the pension pot values required to generate those incomes soaring at a time when many are struggling to make ends meet each month.
The RLS are also not personalised to you, because they reflect a public consensus rather than individual needs. How much I want to spend in retirement and what I want to spend it on will be different to you.
They also assume spending remains at the same level in real terms, when many retirees do not spend the same amount throughout retirement. Spending could be at its highest in the early active years of retirement, then fall in older age with less activity, before rising again if professional care needs to be paid for.
Although the study does share some indicative pension pot figures, these are based on an assumption that an annuity is purchased. That might have been the case in the past, but 90% of people who use their pot to give them a regular income now choose drawdown rather than an annuity.
TRR has limitations too
While a retirement income may satisfy a target replacement rate, it could still be inadequate for pensioner needs when the time comes. Someone on a very low income could achieve a relatively high replacement rate yet still fail to achieve an acceptable living standard in retirement.
pension age.
Like RLS, target replacement rates are not personalised and assume living costs are proportional across incomes, failing to consider how housing wealth can shape needs in retirement and how housing costs can be volatile in retirement for those who are not homeowners in retirement.
Which measure is best?
I can’t pick one over the other. It’s vital we look at our own numbers and both measures can help people work out what they might need in retirement.
Retirement Living Standards aim to provide an absolute measure of retirement adequacy and are a good starting point to help translate retirement into something tangible, based on spending. But as we know housing costs, health needs and personal preferences can dramatically increase that

Replacement rates provide a relative measure, showing how retirement income compares with pre-retirement earnings, but might miss the reality of day-today spending needs. If you rely solely on a replacement rate, you might achieve your target percentage while still lacking enough income to fund the retirement you want.
The Pensions Commission acknowledged that TRRs work particularly well for middle earners, but lower earners should also aim to meet a minimum standard. Using Pensions UK’s measure, that would be £13,900 for a single person household and £22,500 for two. For the latter, two lots of full new state pension would make the cut, while a single person would still have a gap to bridge at state
A good approach is to start with the lifestyle you want and use the Retirement Living Standards to estimate the income you might require as a start point. You could then use replacement rates to check whether your projected retirement income is broadly in line with your current standard of living. That combination provides a far more reliable guide than relying on either measure alone.

Charlene Young Senior Pensions and Savings Expert

In the not so distant past the UK industrials sector could be characterised as a collection of low-margin metal bashers producing commoditised products for mature economies. There has been significant improvement since then with leaner, more technologically focused companies operating in a far more diverse mix of geographies.
Many are leaders in their respective niches and while these businesses are not as high profile as others on the UK stock market; this can, nonetheless, be characterised as an area where London really excels. A large portion of these companies have been rewarded by the market with premium valuations to reflect their strengths.
The industrials space encompasses several industries including: automobiles and parts; aerospace and defence; paper and packaging; electronic and electrical equipment; general industrials and industrial engineering. Our focus is on those names outside the aerospace and defence and packaging space. With the former on a different trajectory driven by a step change in European defence spending and the latter also having very separate industry dynamics.
Broadly speaking, industrial companies are driven by demand for construction and manufactured products. When the economy contracts and consumers save more and spend less, activity in this sector drops because companies will postpone expansion and produce fewer goods.
As discussed, defence companies operate in an area with separate drivers and are not so directly exposed to the economy but are reliant on military spending by governments.
The risk profile varies considerably although nearly all industrial companies are cyclical because they are involved in the manufacture of goods for which demand fluctuates in line with the economy.
Smaller firms tend to be higher risk as they may have more exposure to specific markets or clients. Stories with a disruptive technology at their heart come with an even higher degree of risk but can also lead to significant rewards.
The disruption caused by the Middle East conflict has seen the FTSE 350 Industrial Engineering sector slip some way behind the performance of the broader FTSE 350 index on a 10-year view and shares in this sector have given back a good portion of the bumper gains they delivered coming out of the Covid-19 pandemic.
Source: LSEG
Because many of these companies operate in specialist areas they are typically less exposed to the cyclicality which industrial firms experience and, while these are not technology companies per se (the lack of tech is a criticism often levelled at London’s stock market), they often operate at the cutting edge of their specific area of expertise.
They prosper by applying their engineering expertise to the problems their customers face and solve them in a unique way which helps drive repeat business. They are also exposed to emerging themes like the rollout of data centres required to power AI – providing equipment which can help manage challenges around heat management.
Source: Source: Sharescope, data to 16 June 2026
The wider transformation in the sector is demonstrated by strong operating margins – with many companies generating margins in the midteens and some even in the 20s. This is a key metric to watch in the results of companies from this part of the market.
Investors in the sector are likely to be looking for capital growth as these companies are rewarded for expanding their earnings as they tap into long-term themes and/ or benefit from improving economic conditions. Industrial companies do not tend to be the most generous dividend payers but several are models of consistency on this front. Cheltenhambased Spirax has delivered consecutive increases in its payout for nearly 30 years. It’s not just investors which have recognised the attractions of this sector, takeover activity means it is getting smaller, with product testing business
Intertek recently agreeing to an £10.7 billion bid from private equity firm EQT.
The global context

In a global context, all UK engineering firms remain relatively small. As in many other industries, the US is at the forefront. Agriculture specialist Deere & Co and diversified industrial outfit Caterpillar are the big beasts. Some of the substantial players in Europe include French electronics outfit Schneider Electric, Swedish-Swiss business ABB and Stockholm-based Sandvik. There are few if any trackers offering specific exposure to the engineering sector but investors can gain access to the wider industrials space. The table on the next page shows a selection of relevant products, many of which include some of the names we have examined in this article.
Source: Source: JustETF, data to 24 June 2026
Source: LSEG
A global manufacturer of safety, health and environmental technology products. It employs around 6,000 people in roughly 50 individual small to medium-sized enterprises and operates across more than 20 countries. By doing so it taps into non-discretionary spending often backed by regulatory and legislative drivers.
This has enabled it to put up more than 20 years of dividend growth and, excepting 2021 when the company felt an impact from the pandemic, earnings growth across a similar timeframe too.
It has a pretty vast product portfolio that encompasses things like radiation hazard detectors, water quality monitors and fire safety kits and sensors. Halma owns Avo Photonics, which makes high-precision optical switches and photonics components used by hyperscale data centres to move huge volumes of data quickly without overheating.
The company served up a rare disappointment
in June 2026. Revenue growth is expected to slow considerably from the 12-month period which ended in March, and margins are expected to be broadly unchanged. This could represent a sensible dose of conservatism from management against an uncertain backdrop.
For the time being, markets are clearly taken aback given Halma, thanks to its focus on safety critical and regulatory driven markets, has been prized for its consistency.

Smiths Group is a diversified industrial technology business with four global divisions. John Crane supplies mechanical seals and filtration systems that control the flow of liquids and gases in industrial processes. Smiths Detection makes sensors and screening technologies used to detect threats at airports and borders. Flex-Tek produces specialist hosing and tubing. Smiths Interconnect designs electronic and radio-frequency components for secure, demanding environments such as aerospace.
The share price has performed robustly over the last decade thanks to a rejig of the business which involved exiting non-core assets, including its medical division in 2022. Like Halma it has an extensive track record of dividend increases,
A specialist engineer which focuses on the design and manufacture of high spec products for fluid and motion control. Having restructured the business IMI has moved away from low-margin commercial valves to areas aligned with big global drivers like carbon reduction, automation and the transportation of energy supplies. Improved profitability has been rewarded by the market over the last 12 months with a strong share price showing.


Glasgow-headquartered Weir is a leading provider of technology to the mining sector. The company was historically focused on industrial pumps and served a broader spread of industries but has refined its focus to concentrate on providing the big global miners with end-to-end solutions used in processing minerals and metals. In an environment where miners are looking to reduce their environmental impact as they look to play a part in an energy transition, Weir’s expertise in helping reduce waste, limit water usage and minimise energy consumption is in heavy demand. This is supporting margin expansion along with ambitious cost savings targets.
Spirax makes products which help regulate the flow of fluids and steam. It has really shone in this niche area, allowing it to generate sector-leading margins and making it a market darling for a period. A material shift through acquisitions to position itself for long-term drivers such as the energy transition arguably increased the complexity and risk around the business. Berenberg analyst Andrew Simms explains why this has acted as a headwind to the share price. He says: “Group margins, returns and cash flow are below historical levels and unlikely to materially recover to previous levels in the near term, in our view.”
By Tom Sieber Editor
Ask Paul: Your investment questions answered


Ask the experts
Paul Angell is on hand to answer your questions about investments.
If you’d like a question considered for a future edition send it in now.
It’s hard for me to understand the case for active funds for stock investing. If tracker funds are almost always cheaper, when would you choose an active fund instead?
David M

Paul Angell, AJ Bell Head of Investment Research, says:
You’re correct in saying that tracker funds, which follow an index, are typically cheaper than active funds, where investments are chosen by a fund manager. Further, research carried out by AJ Bell shows that tracker funds have outperformed most active funds across the past decade. That said, past performance is not a guide to future returns, so there’s always a possibility that picture could change.
In some cases, active funds can be a helpful way
to bring diversification to a portfolio. For most tracker funds, the largest companies will account for the largest chunk of assets. But if just a few companies are disproportionately bigger, it means the performance of your fund is largely reliant on those names, creating concentration risk. Tracker funds also don’t have limits on how much money can go towards a specific sector or region. For example, a global fund tracking the MSCI World would currently have over 70% of its assets in the US, and nearly 30% in technology stocks.
Active managers have more control over this type of concentration, along with regulations to follow. Part of the regulation of active funds available for sale in the UK is the 5/10/40 rule, which means that no more than 10% of a fund’s money can be in a single stock, and the top five stocks can’t make up over 40% of the allocation. Most tracker funds are exempt from this rule.
Fund managers can also monitor for themes if they worry certain parts of the market are growing too quickly or becoming too dominant. For example, an active manager may choose to have less exposure to AI companies than a tracker fund because they want to mitigate the risk for their investors of the AI trend being a bubble which eventually bursts.

Another consideration for active versus tracker funds is where you plan to invest. Some markets seem to present more opportunity for active managers to outperform than others.
The US, for example, has established itself as a market where it’s difficult for active managers to outperform their tracker counterparts. It’s the largest market in the world, which means it is well-traded and the companies are covered by a plethora of research analysts.
Active managers succeed by finding ‘market inefficiencies’, which is a fancy way of saying certain companies are trading at a lower price than they should be. Because there are so many eyes on the US market, it’s difficult to see something unique, and in the past decade, just 13% of active managers investing in the region have outmatched their benchmark, according to AJ Bell research.
The level of outperformance in emerging markets has been much higher, with 48% of active managers surpassing the benchmark in the past decade. There are several factors that play into this trend, but one reason is that emerging markets tend to be much less efficient. They are smaller, and have fewer analysts researching companies, so it’s easier for managers to spot something appealing.
Emerging markets also have a high amount of stock concentration, so some investors might prefer the diversity of an active option. For example, chip specialist Taiwan Semiconductor makes up nearly 15% of the MSCI Emerging Markets index and electronics group Samsung accounts for another 8%. If investors are looking for a broader range of companies, they may want to explore active options.
Certain fund managers choose stocks with a strategy that goes directly against the logic of an index.
Contrarian fund managers tend to invest against the market. They might take a different view on macroeconomic conditions, and invest accordingly, or they might look for stocks unloved by the market, but where they see potential. This can be an effective way for investors to diversify their portfolio and possibly offer a bit of downside protection in a future market sell-off.
One of the simplest ways to check if a fund is truly contrarian is by looking at its top holdings. If they are similar to those of the index for that region, the fund won’t be contrarian and means you would get similar exposure with an index fund.
Not convinced? You don’t need to be Active funds appeal to certain investors, but they aren’t the right fit for everyone. Fortunately, you can still have diversity without them.
One method is looking into equal-weighted funds, which hold the same companies as a traditional index fund, but allocate the money equally between the holdings instead of divvying it up depending on market cap (size).
You can also find value-themed tracker funds that use an algorithm to determine if the company is undervalued by a typical index standard. These types of tracker funds tend to have higher charges, but still less than the typical active alternatives.
There’s also the option to be ‘actively passive’, which is what we do in the AJ Bell funds. Our team looks at each region and determines how much we’d like to allocate, factoring in expected returns, geopolitical risks and regional concentration to name a few. We then use passive funds to get the desired, efficient and low-cost, exposure.
If all this feels like a lot to consider on your own, you can always choose to invest through a multiasset fund so someone else handles the asset allocation for you. Or, if you feel comfortable, you can choose the funds yourself. Our Favourite funds list can be a helpful starting point to find active and tracker funds that have been researched by our team, and where we think they have a great chance of delivering their investment objectives over the long term.


Income investors should never rule out a dividend cut. There are no guarantees with dividends and sometimes companies have no choice but to lower the amount paid to shareholders.
Dividend cuts are a live issue, and they are happening across the market. For example, we have already seen two FTSE 100 firms cut dividends this year, being drinks group Diageo and packaging specialist Mondi.
In the FTSE 250, there has been dividend disappointment from gas producer Energean, cider maker-to-pubs group C&C, recruitment agency PageGroup and retailer Pets at Home – all of whom have made cuts in 2026.
Among investment trusts, Capital Gearing Trust recently trimmed its dividend, while NextEnergy Solar Fund reset its dividend policy and guided for the payout to effectively halve this year.
With this list growing longer, it is time to wise up on the topic. Here’s why dividend cuts happen,
how to spot companies most at risk of a cut, and ways to mitigate the impact on your portfolio.
Are dividend cuts a reason to sell?
Cuts happen for a wide range of reasons, and they are not always a red flag from an investment perspective. Nevertheless, they are disappointing whatever the reason as it means less money in your pocket as an income investor.
It begs the question: should you sell the investment upon a dividend cut? There is not a one-size-fits-all answer. As with all investments, you need to understand why the cut has happened, whether the investment case has changed, and whether a lower dividend still fits your needs. Just remember that dividend cuts can often be temporary, not permanent.
Why do companies cut dividends?
Dividend cuts can happen when a company has high borrowing levels and wants to repair its balance sheet by prioritising debt repayments.
Occasionally, a company might opt to cut back on share buybacks for the same reason but keep dividends flowing – which is what happened with oil producer BP in February.
A company can cut or suspend dividends if headwinds imply more challenging trading conditions in the near-term, so they preserve cash as a precautionary measure. In April, airports-torailway stations retailer WH Smith suspended its dividend and lowered earnings guidance as its shops saw a downturn amid weaker travel activity following the Middle East crisis.
More cyclical companies can pay out big dividends in the good times, yet they are also prone to dividend cuts in more challenging times. For example, mining companies tend to pay out a fixed percentage of profits so a substantial downturn in metal prices can lead to lower dividends.
Just look at diversified miner BHP – in the good times it is a highly profitable business and can pay out big cash rewards to investors. The reverse is true when the backdrop is less favourable, with a dividend cut last year amid weaker demand from major commodities consumer China and lower iron ore prices.
Diageo’s dividend setback
Dividend cuts can be common when a company is enacting a turnaround plan. That recently happened with Diageo whose recovery efforts are taking longer than expected.
The Guinness maker traded on a 4.6% prospective yield just before resetting its dividend in February to strengthen the balance sheet. The combination of the new dividend policy and subsequent share price weakness has now put the stock on a 3.2% yield. That is a double blow for someone owning the shares as a source of income.
Diageo’s dividend cut is a good example to study. The company’s 2025 annual report hinted that its dividend was on shaky ground after reporting a third year in a row of declining earnings per share.
The policy at the time was to make sure earnings were 1.8 to 2.2 times greater than the dividend paid out (known as dividend cover). The company fell short with 1.6 times cover in 2025 (the previous year it achieved 1.7-times, which was also below target), and so investors had no dividend growth that year, although they still pocketed something rather than nothing.
Six months later at the 2026 half-year results, Diageo reported another decline in earnings per share, down 2.5% year-on-year. Free cash flow –the amount of cash generated from operations minus capital expenditure – was also in reverse, falling by $164 million to $1.5 billion.
New chief executive Dave Lewis announced a new dividend strategy where the payout has been rebased – effectively halving what investors used to get. It was not good news for investors and income funds holding the stock, but understandable given the business still is not firing on all cylinders.
There are few steps to follow if you want to run a health check on companies in your portfolio from a dividend affordability and sustainability perspective.
The first is to divide a company’s earnings per share by its dividend per share, which gives you the dividend cover. The higher the number, the better. A figure above 2 is ideal, but investors might be happy with a figure above 1.5 for companies with predictable earnings like utilities.
Investors use the dividend cover number to check if a company can afford the dividend and whether there is scope for future dividend growth.
While the dividend cover measure is informative, it is not perfect. Hard cash pays for dividends, so you also need to look at the cash flow profile of
the company.
The other step is to look at the dividend yield and compare it to what the company normally offers. If the yield is much higher than normal and the share price is falling, there could be danger ahead.
A falling share price is the market’s way of saying it is worried about something, which might be the strength of a company’s finances, trading conditions, or competitive threats.
To calculate a dividend yield, divide the expected dividend per share (DPS) by the latest share price (SP) and multiply by 100. If the SP part of the equation becomes a lower number and the DPS part remains the same, the yield will be higher.
Sometimes a higher-than-normal yield might represent a year when a company pays a special dividend on top of the normal one. But in cases where there is no special dividend, the yield might simply be too good to be true. In this situation, do not be surprised if it a precursor to the company paring back the dividend if it goes through a difficult patch.
Mondi is a good example – it was trading at 6.5% yield last October, whereas its yield over the past 10 years was more in the 3% to 5% range. Lo and behold, a dividend cut happened earlier this year amid weak trading for the packaging group and the yield is now back to 3%.
Unfortunately for investors, analysts are often
slow to downgrade their dividend forecasts and might not change their estimates until the dividend cut has happened. In short, a much higher yield than previous years is typically the market’s way of saying the current dividend rate is unsustainable.
Income investors looking for ways to mitigate the impact of dividend cuts might want to consider investment trusts and certain types of funds.
Investments trusts can hold back 15% of their annual revenue in reserves to top up dividends in leaner years. This can help to smooth dividend payments and make up for unforeseen setbacks with portfolio income.
Actively managed income funds will consider a company’s ability to pay dividends and will seek to avoid stocks that fail short of the qualities needed for sustainable income.
Alternatively, there are various exchangetraded funds that invest in baskets of shares exhibiting certain characteristics such as financial strength and a history of dividend growth.

By Dan Coatsworth Head of Markets

Ask Sarah: Your questions answered

Ask the experts
Sarah Coles is on hand to answer your personal finance questions.
If you’d like a question considered for a future edition send it in now.
I’d like to sell an investment to reduce the capital gains tax. The first sale was for £5,000 = £2,000 (initial price) + £3,000 (the tax free allowance). For the consequent sales, is it only £3,000 each or can the initial price be used again to increase the tax free allowance to £5,000 again?
Victoria

Sarah Coles, Head of Personal Finance, says:
Calculating a capital gain is easy in theory but can be trickier in practice. The basic rule is that to find the gain, you take the selling price of those specific assets and subtract the purchase price and any transaction costs. That leaves you with your capital gain.
Capital gains equation
You can then subtract the first £3,000 each tax year
Ask Sarah: Your questions answered
to take account of your annual allowance, formally known as the Annual Exempt Amount. If there’s anything left, this is the taxable portion of your gain.
You can only use your annual exemption once a year, not once per sale. And you can’t carry forward capital gains tax exemptions from previous years. However, if you have made a loss elsewhere during the year, you can offset that loss against your gain too. Unused losses can generally be carried forward, provided they are reported to HMRC within the relevant time limits.
In your case, if this is your only gain in each tax year, and there are no losses to offset, if you paid £2,000 for this first tranche of shares and are selling them for £5,000, then after subtracting the £3,000 annual exemption, there’s no tax to pay. When you sell the next group in the next tax year, you’ll have another £3,000 annual exemption , and can also subtract whatever that portion cost you.
If you paid £2,000 overall for the assets, then you will need to go back to your calculations and work out what you paid for the specific portion that you sold. You can only subtract the purchase price of the assets in that first tranche. Then in the coming year, you’ll be able to subtract the purchase price of the second portion, as well as the new annual exemption of £3,000.
If this leaves you with a tax bill in the current tax year, don’t forget you can subtract transaction costs too.

Be mindful of add-ons over time One common issue people run into is where they’ve added to investments over time and they don’t know what purchase price to use.
If you buy the same class of share in the same company, this is classed as a section 104 holding, so when working out what you bought it for, you can use the average cost per share for the whole holding.
If you have a capital gains tax bill, the rate you pay on it will depend on what you earn elsewhere.
If you’re a higher rate or additional rate taxpayer selling shares or funds, you pay 24% on your taxable gain. If you’re a basic rate taxpayer, you need to add the taxable bit of your gain to your income for the year. If the total comes in below the higher rate threshold, you pay 18% on it all.
If the total pushes you over the higher rate threshold, you pay 18% on the slice below the threshold and 24% on the slice above it.
If you have income of £45,270 for example and a gain of £13,000, you would subtract the annual exemption of £3,000, then you’d pay 18% on the first £5,000 and 24% on the other £5,000.
It’s worth knowing that you don’t just pay capital gains tax when you sell an asset. You might also pay it when you give assets away to anyone other than a spouse or civil partner, if you exchange assets with anyone, or if you sell, exchange or spend cryptocurrency.
As we said up top, capital gains tax isn’t straightforward to calculate, and because you need to tell HMRC about it, there’s also admin to get through before you can pay a bill. Given the fact that there could be capital gains any time you buy or sell any asset, it adds an extra layer of legwork to managing a portfolio and regularly rebalancing it outside of a tax wrapper.
However, when you hold stocks and shares within an ISA wrapper, you don’t have to worry about capital gains tax at all on those assets - whether you’re tweaking the portfolio or cashing it in entirely. It’s also free of dividend tax, saving you another source of potential cost and admin.

Robert, 65, is currently enjoying the slower pace of retired life. A keen cyclist, now with more time explore the National Cycle Network routes near –and far – from his home in the northeast, and bond with his first grandchild.
But the foundations of this were set over 40 years beforehand when, at aged 21, Robert got his first job and asked the interviewer “what sort of pensions arrangement do you have?”
A rare mindset for any 20-year-old to have, but Robert says he felt “compelled to ask because I did have this sense, even back then, that I had my future life in mind”.
“Every £1,000 you put away buys you a month off work at the end of your life,” Robert says (although with inflation this is now around two to three weeks). But the premise of ‘saving for your future self’ was a very clear concept to him, even then.
“What people don’t realise is doing that is an investment in bringing forward that retirement
date,” Robert says.
“It’s also buying you flexibility later in life. You might want to go part-time or drop down to three or four days a week and you want the flexibility and resilience to be able to do that without exiting your job fully is a really powerful thing.”
Now, Robert is applying that future planning to his kids, and not just because he wants them to become as time-rich as him, but he says, he’s worried at how they’ll be able to retire at the state pension age – 67 – purely because of how “tough” their pension pathway is versus his.
Mid reading Eliza Filby’s book Inheritocracy, which argues that our futures are not determined purely by how hard we work and save, but whether or not we have access to the Bank of Mum and Dad, and that financial leg up.
“I’ve always been conscious that it’s up to me to sort it out and not relying on someone else,” Robert says, but says that his kids face a more financially demanding future than he did at their age and it worries him.
“I’m really conscious of the pressures on young people these days. I’ve got a son who lives and works in London, so the sort of pressure on young people to be able to afford just to make the end of the month without going into the red is pretty significant,” he says.
“I’m mindful of being in a position to be able to support our children even if they’re grown up now when they’re laying their foundations and having a family and doing the things that we did 40 years ago is important to me.”
To do this Robert has taken a three-pronged approach to his money in retirement, with a split focus on what he and his wife need for income and building and protecting their wealth to pass onto their family.
While investing for their kids is a major focus, Robert needs to make sure he will be able to cover his own retirement first, especially with how expensive a good road bike is nowadays.
Alongside his two defined benefit (DB) pensions he’s now cashed in from his years working in a publishing house and later for the government as well as his own firm, Robert has what he calls his ‘cash and bonds SIPP’, which he uses as his ‘drawdown’ account to generate the income needed.
The second strand is a second SIPP, but this one is for his children and grandchild(ren) to inherit.
When his kids were 15, Robert opened a SIPP for each of them with a lump sum of inheritance money and added to it year-by-year. When his grandchild was two, they got the same, potentially making them the youngest person ever to have a pension pot.
As Robert was getting ready to retire a couple of years ago and recalibrating what he’d need from his portfolio he also made the decision to overhaul the pension pots he’d set up for the next generation when it became apparent that a lot of the wealth he’s accrued would likely go unspent during his own retirement.
Working with a financial adviser, Robert moved his kid’s SIPP into a more aggressive risk profile on
the basis that he was projecting a 30-year time horizon for their pots.
“We said if this is going to sit invested for another 30 years or so, until our children are of pension age, why on earth are we taking a moderate risk attitude towards that? We should be maximising the risk on that because it’s likely to be invested for another 30 years or so, or even longer,” Robert says.
Now sat at a mid-six figure sum, this portfolio has 20 funds in it, with a quarter focused on a “drawdown” element if it’s needed, while the rest is “just going to sit there and grow”.
25% 'drawdown' 75% leave it to grow
Schroder Asian Income
BNY Mellon Global Income
Schroder Global Equity Income
CT Global Equity Income
JPM Global Equity Income
Lazard Global Equity Income
BNY Mellon Asian Income
M&G Global Dividend
Polar Capital Global Healthcare Select
AXA Framlington Biotech
Jupiter Ecology
Guinness Sustainable Energy
AXA Framlington Global Thematics
Guinness Global Innovators
Baillie Gifford Global Discovery
Pictet Global Megatrend Selection
Polar Capital Global Technology
abrdn Europe ex UK income Equity
Sarasin Food and Agriculture
This has resulted in a blend of global equity income funds, providing that dividend element, and a series of thematics, namely; sustainable energy, biotech, healthcare, and agriculture”.
“It’s very much with an eye on the future,” Robert says.
On how the funds were chosen, Robert left that call to the adviser and their recommended list.
“They run with it,” he says. I’m not going to interfere with that. I’m handing money over and letting professionals do their job.”
So far, it’s paying off, with the SIPP up 23% over the past year, 43% over three and 51% since 2021.
Plan 3: Buy what you can see
Robert also has a Stocks and Shares ISA, on which he also leans on professionals’ expertise, but not via an adviser.
Taking his own “hands on” approach, Robert invests in four investment trusts and 11 individual UK companies.
Trusts Stocks
Alliance Witan Whitbread
City of London
F&C
Scottish Mortgage
Tesco
Standard Life
SSE
National Grid
M&G
Legal & General
Land Securities
GSK
British Land
Aviva
The former is where the ‘expert’ element is, giving him access to “tons of companies across the globe” with deliberately different remits via active

managers.
“The big four”, as Robert called them, investing in Alliance Witan, City of London investment trust, F&C and Scottish Mortgage investment trust.
“That gives sort of global diversification across a lot of sectors and a lot of growing companies, and I’m happy to just let them do their job.”
When it comes to the stocks, Robert takes a very literal approach. “Just travelling around the country and seeing what’s going on you can see things and the trends that are obvious to me.”
Seeing workmen putting in cables for the multibillion-pound grid overhaul led to National Grid and SSE “was a no brainer”, for Robert.
Next were insurers, those underwriting the development of the cities he could see changing around him: Legal and General, M&G, Aviva and Standard Life.
Robert is big on ‘buying what you see’ investing in “real things”, like supermarkets (Tesco is his pick), bricks and mortar (British Land and Land Securities) and healthcare (GSK) and hospitality (Whitbread).
He steers clear of things he feels have too much regulatory risk, namely bank or water companies and telecoms.
So far, the active and stock blend has turned his initial £100,000 into nearly £300,000, up 7% in the past year.
By Eve Maddock‑Jones Funds and Investment Trust Writer
Ask Rachel: Your retirement questions answered


Ask the experts
Rachel Vahey is here to answer questions on pensions.
If you’d like a question considered for a future edition send it in now.
I have a question about inheritance tax and pensions. I will be over 75 years old at the time of my death. My property and cash will use up most of my exemption allowance of £500,000. I am divorced and my daughter is my only beneficiary. I have a SIPP with AJ Bell.
Can you confirm if my remaining SIPP is transferred to my daughter after payment of IHT, can she access the pension straightaway and what income tax would she pay? If I add my daughter’s two children as beneficiaries, would this would be beneficial from an income tax point of view, as they are non-taxpayers ?
If I bought a single life annuity with part of my SIPP funds, would there be any IHT payable?
John

New rules will bring pensions into inheritance tax (IHT) calculations from April next year. While that may seem some way off, there is limited time for those affected to understand what the changes will mean for them and their families.
Let’s start with nil rate bands – these must be split proportionately between the estate and the pension. Estates won’t have the flexibility to, say, count the pension against the whole remaining nil rate band.
Once the proportioned nil rate band has been deducted from the pension fund, IHT will be worked out as 40% of whatever is left, if it’s not going to an exempt beneficiary such as a spouse, civil partner or charity. The personal representative (PR) could pay the IHT due from the estate’s other money, or the beneficiary could pay the IHT from their own pocket. These options would mean the
Ask Rachel: Your retirement questions answered
whole SIPP fund passes to the beneficiaries (less any income tax due).
Another option is for the beneficiaries or PR to ask the pension scheme to pay the IHT directly to HMRC from the SIPP. It’s important to note the pension scheme can only pay the IHT arising from the assets held within the scheme - it can’t pay IHT that has arisen due to assets in the wider estate.
The balance can then be passed to the beneficiary. You say you will be older than 75 on your death so your daughter would pay income tax on any money she withdraws. If you have named her on your expression of wishes form, she could take the money as either a lump sum or through drawdown, giving her flexibility over when and how much she withdraws, which may help her manage the tax due.
She can access the money as soon as the money has moved into beneficiary’s drawdown, in other words, she doesn’t have to wait to reach the age of 57. However, if the PR acting for the estate believes that IHT will be due on the payment from the pension, then it can apply a withholding notice. This means the pension has to hold onto 50% of the pension funds and can pass only the other 50% onto the beneficiary until the IHT is paid, the notice is withdrawn or 15 months after death. This is to stop the situation arising when IHT is due, but the whole pension fund has been paid out and it’s difficult to get the IHT paid.
You could nominate your grandchildren as beneficiaries. As non-taxpayers they could take up to their personal allowance out of the pension each year without paying tax. However, there is the question of what do they then do with it? If they don’t have any immediate need, it may be better to keep it in the tax wrapper where it can grow tax-free and be there for when they do need it, although they may have to pay income tax on it later.
If you buy a single life annuity it will stop on your death. You can choose to set up a guaranteed period where if you die within the guaranteed period the payments will continue to be paid until the guaranteed period ends. This guaranteed period can be up to 30 years. However, those guaranteed payments will be subject to IHT. You can also choose to set up something called value protection which returns a lump sum based on the annuity purchase price less the instalments that have already been paid out. But again that lump sum would be subject to IHT.
As you can see, the new rules have the potential to be complicated. But it’s good to find out the options now to help you and your family plan.


Shares magazine is published by AJ Bell, authorised and regulated by the Financial Conduct Authority. It’s here to inform, not to give personal advice. Please don’t base your investment decisions on it alone. If you’re unsure, speak to an independent adviser. And remember: past performance isn’t a guide to the future. Tax benefits depend on your circumstances and tax rules may change.