To deliver independent and high-quality public company risk management data analytics solutions to protect Directors & Officers by enhancing transparency in the securities class action arena
The analytical tabulations presented herein provide dedicated risk managers and investment professionals transparent, data-driven insights into the frequency and severity of Adverse Corporate Events (“ACEs”). These insights help identify corporate disclosure trends that increase the likelihood of private securities-fraud litigation or enforcement actions brought by the Securities and Exchange Commission (“SEC”) against directors and officers of companies listed on the NYSE or NASDAQ. Our analysis is based on close-toclose stock price performance, adjusted for general market and sector-specific factors, to isolate the impact of company-specific disclosures. SAR provides unique, verifiably independent, factual analytics that reveal how equity investors respond to financially material disclosures. Our semi-annual publication of this data equips practitioners with actionable insights of securities litigation risk of U.S.-listed companies—empowering practitioners with well-informed risk management and equity investment strategies.
Adverse Corporate Events (“ACEs”). SAR categorizes ACEs that have materialized during a two-year period prior to the evaluation date into three mutually exclusive categories. This classification is based on a single-firm event study methodology, which tests the stock price impact of each corporate disclosure for a given issuer. All ACEs identified by SAR exhibit a close-to-close stock price decline that is statistically significant at the 95% confidence standard. The analysis controls for broader market effects using the S&P 500 Total Return Index and adjusts for sector-specific influences using the target company’s Global Industry Classification Standard (GICS) index.
TYPE I ACE:
• Stock price declined by a statistically significant amount at the 95% confidence level over the close-to-close event window, driven by company-specific news.
• Company issues a public statement via a press release, or a representative discloses information at a press event or earnings call.
TYPE II ACE:
• Stock price declined by a statistically significant amount at the 95% confidence level over the close-to-close event window, driven by company-specific news.
• Company made filings with the Securities and Exchange Commission (“SEC”), and no other relevant company news was identified.
HIGH-RISK ACE:
• Stock price declined by a statistically significant amount at the 95% confidence level over the close-to-close event window, driven by company-specific news.
• Company issues a public statement via a press release, or a representative discloses information at a press event or earnings call.
• Company made filings with the SEC.
U.S. Securities Litigation Risk. SAR quantifies the potential securities litigation risk of an issuer according to the frequency and severity of High-Risk ACEs . The estimate is equal to an issuer’s cumulative market capitalization losses on all High-Risk ACEs identified during the corresponding two-year evaluation period.
The quantification of securities litigation risk presented herein is based on the economic impact of a company’s corporate disclosures on its common stock traded on the NYSE or NASDAQ. It does not constitute potential litigation exposure, aggregate damages, or liability that may be asserted by private investor plaintiffs or regulatory agencies in securities-related claims or actions against the issuer or individual defendants.
SAR Risk Score℠. The SAR Risk Score℠ is a proprietary score assigned to every public company listed on the NYSE or NASDAQ according to the frequency and severity of ACEs during a two-year period from the designated evaluation date. The SAR Risk Score℠ is equal to the market capitalization losses observed on High-Risk ACEs divided by the issuer’s market capitalization as of the preceding trading day. For example, company ABC, Inc.’s market capitalization is $500 million. SAR identified three High Risk ACEs during the preceding two years that amounted to $100 million in market capitalization losses. The SAR Risk Score℠ for ABC, Inc. is 20%. SAR caps risk scores at 100% for issuers whose market capitalization losses on High-Risk ACEs exceed the company’s current market capitalization.
Analytical Tabulation. The report presents tabulated summary analytics on three types of ACEs across eleven sectors, classified according to GICS, and segmented by company size.
Disclosure: Due to changes in S&P Dow Jones Indices’ market capitalization eligibility criteria, from this edition onward, SAR’s Large, Mid and Small Cap categories will encompass those stated to be typical by the Financial Industry Regulatory Authority (“FINRA”). Large, Mid and Small Cap defendant companies are defined as those with market capitalizations greater than $10 billion, greater than $2 billion but less than $10 billion, and less than $2 billion, respectively, as of the end of the evaluation date.
All new data and analysis presented herein are based on corporate disclosures disseminated to investors between the close of trading on June 30, 2023, and the close of trading on June 30, 2025 (hereafter, July 2025).
U.S. Securities Litigation Risk
The securities litigation risk of U.S. public companies is driven by the frequency and severity of ACEs that are identified through the application of the court-approved event study methodology. The identified ACEs, originating from corporate disclosures, had a significant impact on stock price performance during the relevant trading day and were publicly disseminated within the preceding two years.
Frequency: Number of High-Risk ACEs
Independent, single-firm event study results across 4,544 U.S. public companies indicate a rise in the average number of High-Risk ACEs compared to the 2025 H1 Risk Report (hereafter, January 2025). The average frequency increased by 2.18%, from 2.29 to 2.34 events per company. In total, the number of High-Risk ACEs grew from 10,536 in January 2025 to 10,631 as of July 2025.
The three sectors with the highest number of average High-Risk ACEs are Industrials, Consumer Discretionary, and Information Technology with 2.70, 2.67 and 2.58 events per company, respectively. All three remained in the top 3 compared to January 2025, underscoring the sustained vulnerability of securities litigation risk across these sectors. No sector averaged fewer than 1.6 High-Risk ACEs during the two-year evaluation period. At the issuer level, 16 companies recorded 10 or more High-Risk ACEs, while 877 companies experienced none—highlighting the importance of assessing securities litigation risk based on the stock price impact of company-specific disclosures.
Trends in High-Risk ACEs by market capitalization category reveal that such events are more prevalent among Large Cap companies. In July 2025, Large Caps reported an average of 2.71 events per company, representing a 10.12% increase from January 2025. Mid Caps also saw an uptick, with the average rising from 2.44 to 2.51 events. In contrast, Small Caps experienced a decline, with the average number of High-Risk ACEs falling by 1.38% to 2.18 events per company.
Severity: Market Capitalization Losses on High-Risk ACEs
Losses per High-Risk Event ($B)
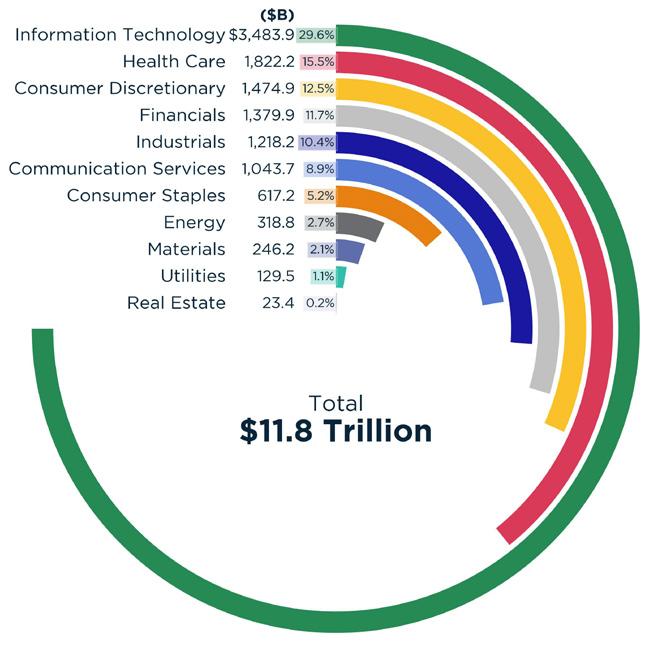
The magnitude of severity amounts to the cumulative market capitalization declines observed during the close-to-close event windows on High-Risk ACEs over the preceding two years. Figure 1a ranks the 11 sectors according to the magnitude of market capitalization losses impacted by High-Risk ACEs. At approximately $3.5 trillion, issuers in Information Technology exhibited the highest level of sector-specific market capitalization losses, comprising 29.6% of the global quantum. Health Care and Consumer Discretionary followed as the second and third largest contributors to overall losses, respectively. In the aggregate, total losses rose by $1.8 trillion, marking an 18.1% increase. Compared to January 2025, only the Materials and Consumer Discretionary sectors experienced a decline in market capitalization losses.
Figure 1b displays market capitalization losses per High-Risk ACE across sectors. Real Estate recorded the lowest losses per event at $0.30 billion. In contrast, Information Technology posted the highest losses per High-Risk ACE at $2.21 billion, reflecting a 27.7% increase. Since January 2025, Materials, Consumer Discretionary, and Utilities have been the only sectors to experience a decline in losses per High-Risk ACE. Information Technology sits at the top in both Figures 1a and 1b, underscoring the heightened securities litigation risk impacting directors and officers in the sector. Health Care, on the other hand, sits second in aggregate market capitalization losses but is fourth lowest in losses per High-Risk ACE. This dynamic is partly driven by the high frequency of High-Risk ACEs among Small Cap companies within the sector—a trend that continues to persist.
Figure 1a: Market Capitalization Losses on High-Risk ACEs
Figure 1b: Market Capitalization Losses per High-Risk
U.S. Securities Litigation Risk Quantification
A high-level snapshot of U.S. securities litigation risk may be evaluated by the ratio of a sector’s cumulative market capitalization losses from High-Risk ACEs to its current aggregate market capitalization.
Figure 1c displays the change in the ratio of market capitalization losses to each sector’s current aggregate market capitalization relative to January 2025. Eight out of the eleven sectors increased their sectoral market capitalization loss ratio relative to January 2025. The Health Care sector exhibited the most pronounced increase, with its ratio rising sharply from 19.15% to 25.88%, representing a 6.73 percentage point uptick. This increase is attributed to both a reduction in market capitalization and a rise in market capitalization losses. Across all sectors exhibiting an increase in securities litigation risk, the average ratio rose by 2.99 percentage points, up from 2.19 percentage points in January 2025. Empirical data indicates a broad-based escalation in securities litigation risk. The sectoral market capitalization loss ratio declined in three sectors—Materials, Consumer Discretionary, and Utilities—registering an average decrease of 1.10 percentage points. Notably, Consumer Discretionary stands out as the only sector to have experienced two consecutive reductions in its securities litigation risk.
-7-6-5-4-3-2-1
7 Δ Ratio in Percentage Points
Figure 1d ranks each sector by the ratio of market capitalization losses to each sector’s aggregate market capitalization as of the end of the evaluation period. The range spans from 8.15% (Utilities) to 25.88% (Health Care). This ratio highlights the potential magnitude of securities litigation risk for each sector by accounting for the cumulative material impact on stock price performance when constituent companies issued corporate statements and filed documents with the SEC.
The ratio of market capitalization losses to market capitalization may or may not align closely with the sector’s median SAR Risk Score℠. While the average difference between the two measures across all eleven sectors is approximately 2.67 percentage points, certain sectors exhibit larger divergences. The sector-specific median SAR Risk Score℠ is most appropriately applied when assessing company-specific risk on a near-real time basis. It allows risk managers and investment professionals to evaluate the relative risk of a particular constituent company with respect to the median constituent. In contrast, a sector’s ratio of market capitalization losses to aggregate market capitalization serves as a measure of absolute sectoral securities litigation risk. It quantifies a sector’s overall exposure to securities litigation based on the scale of capitalization losses associated with material corporate disclosures. Understanding the interaction between these two measures—especially in the presence of skewed distributions or disproportionate capitalization influence—provides deeper insight into both systemic and company-specific risk dynamics.
SAR quantifies the SAR Risk Score℠ at the sector, group, industry and sub industry level. See Appendix 1 for a breakdown across all sectors.
Figure 1c: Change in Ratio of Market Cap. Losses to Sector Market Cap.
Figure 1d: U.S. Securities Litigation Risk by Industry Sector
U.S. Securities Litigation Risk Footprint
SAR evaluates trends in securities litigation risk across sectors using a two-step analytical process. First, it maps five key variables— Type I ACEs, Type II ACEs, High-Risk ACEs, Market Capitalization, and Market Capitalization Losses—onto a polar coordinate system, with each variable occupying a distinct axis. This produces a sector-specific five-sided polygon. Second, SAR calculates the area enclosed by the five plotted points at two points in time, corresponding to evaluation periods ending on December 31, 2024 (January 2025), and June 30, 2025 (July 2025). The change in a sector’s footprint is calculated as the absolute difference between the two areas, divided by the area of the five-sided polygon in January 2025.
According to this methodology, Consumer Staples, Financials, and Utilities exhibited the greatest changes in their footprints across the aforementioned 5-factors. The relevant metrics for January 2025 and July 2025, are expressed as percentages of their respective global quantum to enable cross-sector comparisons, and are presented in the figures below.
Consumer Staples. Consumer Staples exhibited the greatest change in the securities litigation risk footprint among all sectors. As of January 2025, losses associated with High-Risk ACEs accounted for approximately 4.15% of the global quantum, rising to 5.25% by July 2025. As illustrated in Figure 1e, four of the five factors increased within the Consumer Staples sector. The most significant shift was observed in Type II ACEs, which rose by 1.19 percentage points. The Type I and High-Risk ACE factors also increased, by 1.11 and 0.80 percentage points, respectively. Meanwhile, the sector’s market capitalization as a share of the overall U.S. equity market declined by 0.16 percentage points.
1e:
Utilities Figure 1g presents the variation in the securities litigation risk footprint for the Utilities sector across the five factors. The relative proportions of all three ACE categories, as well as market capitalization, increased compared to January 2025. Type I, Type II, and High-Risk ACEs rose by 0.6, 0.4, and 0.2 percentage points, respectively. The sector’s share of total U.S. equity market capitalization also increased, from 2.09% to 2.26%. However, losses associated with High-Risk ACEs declined as a proportion of the global quantum, falling from approximately 1.25% to 1.10% by July 2025.
Financials. Figure 1f illustrates the changes observed in the Financials sector, which recorded the second-largest shift in securities litigation risk footprint. The data reveals a broad-based decline in the sector’s contribution across the relevant factors, with a pronounced decrease in the frequency of ACEs. Four out of the five metrics declined relative to January 2025. As of the evaluation period ending December 31, 2024, High-Risk ACEs in Financials accounted for approximately 15.36% of total High-Risk events across all sectors. This proportion declined to around 12.17% by July 2025. Meanwhile, the sector’s share of total U.S. equity market capitalization rose by 0.3 percentage points, reaching approximately 15.3%. The share of total market capitalization losses fell by 0.9 percentage points despite a $119.22 billion increase in losses within this sector over the same period.
1g: Utilities
Figure
Figure 1f: Financials
Figure
All Sectors
U.S. Securities Litigation Risk
Key Takeaways
• The aggregate quantum of securities litigation risk demonstrates that companies listed on the NYSE and NASDAQ experienced approximately $11.8 trillion in market capitalization losses as of June 30 2025. This figure reflects the cumulative single-day, statistically significant stock price declines associated with High-Risk ACEs over the preceding two years.
• Single firm event study analysis on 10,631 corporate disclosures of 4,544 U.S. public companies indicates that High-Risk ACEs continue to exhibit the highest frequency among SAR’s three ACE categories. The average frequency and aggregate severity of High-Risk ACEs increased by 2.18% and 18.1%, respectively, relative to January 2025.
• The median SAR Risk Score℠ for U.S.-listed companies is 18.86%. Health Care exhibits the highest median SAR Risk Score℠ at 33.18%, followed by Consumer Discretionary and Information Technology with 26.39% and 25.41%, respectively
[1] The Global Industry Classification Standard (“GICS”) is a widely used industry taxonomy developed by MSCI and S&P Dow Jones Indices. All issuers are categorized into 11 major sectors.
[2] SAR analyzes the actively trading common stock and ADR issuances of every public company on the NYSE or NASDAQ with sufficient data to perform a robust event study analysis that applies court-accepted statistical standards using a uniform two-year evaluation period and assigns a SAR Risk Score℠. This column displays the number of analyzed issuers in each sector. The cumulative quantum of market capitalization losses on identified High-Risk ACEs for issuers during the preceding two years from June 30, 2025.
[3] Adverse Corporate Events℠ are statistically significant negative single-trading day stock price movements corresponding to company-specific news identified by SAR. There are three types of ACEs. Type I are company-originating news that do not include regulatory filings (i.e., press releases, earnings calls, corporate statements.) Type II relates to corporate disclosures made via filings with the SEC. High-Risk are both company-originating news and regulatory filings made with the SEC.
[4] The average number of Type I ACEs identified among the sector.
[5] The average number of Type II ACEs identified among the sector.
[6] The average number of High-Risk ACEs identified among the sector.
[7] The cumulative quantum of market capitalization losses on identified High-Risk ACEs for issuers during the preceding two years from June 30, 2025.
Table 1: Frequency and Severity of Adverse Corporate Events by Sector
U.S. Securities Litigation Risk
Key Takeaways
• Securities litigation risk in the Energy sector rose compared to January 2025, evidenced by a 25.4% increase in market capitalization losses, equivalent to roughly $64.5 billion.
• The observed rise in the securities litigation risk stems from higher frequency and severity of HighRisk ACEs. Losses per High-Risk ACE increased across all three market capitalization categories.
• The average frequency of High-Risk ACEs rose from 1.62 to 1.84, marking a 13.74% increase. This places the sector second only to Consumer Staples in terms of relative frequency growth.
• The median SAR Risk Score℠ of the 216 constituent companies in the Energy sector is 11.21%. The Large, Mid, and Small Cap median scores are 7.11%, 11.20% and 16.02% respectively.
Table 2: Energy — Frequency and Severity of Adverse Corporate Events
Figure 2a: Frequency of ACEs
Figure 2b: Total ACEs by Market Cap
U.S. Securities Litigation Risk
Key Takeaways
• The Materials sector’s securities litigation risk declined relative to January 2025, driven by an increase in market capitalization and a decrease in market capitalization losses. It recorded the second largest reduction in risk among all sectors.
• The decline in market capitalization losses reflects a reduction in the severity of High-Risk ACEs Losses per High-Risk ACE fell from $0.56 billion to $0.49 billion, a 13.18% decrease.
• Among Large Cap companies, the sector exhibits the lowest average number of High-Risk ACEs at 1.67 events – 0.35 events fewer than Energy, the second-lowest sector.
• The median SAR Risk Score℠ of 217 constituent companies in Materials is 17.76%. The Large, Mid, and Small Cap median scores are 8.17%, 19.82%, and 25.70%, respectively.
Table 3: Materials — Frequency and Severity of Adverse Corporate Events
Figure 3a: Frequency of ACEs
Figure 3b: Total ACEs by Market Cap
U.S. Securities Litigation Risk
Key Takeaways
• The Industrial sector’s securities litigation risk held steady compared to January 2025, though signs of an upward trend emerged. The ratio of market cap. losses to market capitalization increased from 17.63% to 18.26%.
• Market capitalization losses increased by 13.55%, reaching $1.2 trillion. The rise is associated with a higher frequency of ACEs, as the average number of High-Risk ACEs rose from 2.57 to 2.70.
• The Industrials sector maintained a relatively steady share of total market capitalization losses, contributing to 10.4%, a slight decrease from 10.8%. It remains the fifth-largest source of aggregate losses.
• The median SAR Risk Score℠ of 647 constituent companies in Industrials is 21.17%. The Large, Mid, and Small Cap median scores are 16.51%, 20.86%, and 28.49%, respectively.
Table 4: Industrials — Frequency and Severity of Adverse Corporate Events
Figure 4a: Frequency of ACEs
Figure 4b: Total ACEs by Market Cap
U.S. Securities Litigation Risk
Key Takeaways
• The securities litigation risk declined relative to January 2025, reflecting decreases in both market capitalization and market capitalization losses. The Consumer Discretionary sector exhibited the largest reduction in risk among all sectors.
• The reduction in market capitalization losses is triggered by a decline in the severity of High-Risk ACEs Losses per High-Risk ACE fell from $1.20 billion to $1.02 billion, a 14.80% drop.
• A decline in losses in the sector occurred despite an increase in the frequency of High-Risk ACEs. On average, the number of such events rose from 2.48 to 2.67, illustrating that material impacts on stock price performance can stem from either frequency or severity.
• The median SAR Risk Score℠ of 542 constituent companies in Consumer Discretionary is 26.39%. The Large, Mid, and Small Cap median scores are 15.97%, 25.05%, and 33.13%, respectively.
Table 5: Consumer Discretionary — Frequency and Severity of Adverse Corporate Events
Figure 5a: Frequency of ACEs
Figure 5b: Total ACEs by Market Cap
U.S. Securities Litigation Risk
Key Takeaways
• Consumer Staples recorded the second largest increase in securities litigation risk among all eleven sectors. Market capitalization losses rose by $204.52 billion, representing a 49.6% increase.
• The marked increase in the securities litigation risk is driven by a rise in both the frequency and severity of High-Risk ACEs. Losses per High-Risk ACE increased across all three market capitalization categories, raising overall per High-Risk ACE losses in the sector by 21.50%.
• The frequency of High-Risk ACEs increased on average from 2.02 to 2.48 events, reflecting a higher average of High-Risk ACEs across Large, Mid, and Small Cap companies compared to January 2025.
• The median SAR Risk Score℠ of 189 constituent companies in Consumer Staples is 19.07%. The Large, Mid, and Small Cap median scores are 14.76%, 13.84%, and 29.03%, respectively.
Table 6: Consumer Staples — Frequency and Severity of Adverse Corporate Events
Figure 6a: Frequency of ACEs
Figure 6b: Total ACEs by Market Cap
U.S. Securities Litigation Risk
Sector Market Capitalization Losses Amount to $1.8 Trillion
Key Takeaways
• Health Care experienced the largest increase in securities litigation risk among all eleven sectors, with market capitalization losses increasing by $467.78 billion—a 34.54% gain.
• Despite a substantial increase in market capitalization losses, the sector ranks fourth lowest in average losses per High-Risk ACE, at $0.75 billion. The comparatively low average reflects the high number of High-Risk ACEs among Small Cap companies in the sector, which recorded 1,884 events during the evaluation period.
• Health Care overtook Consumer Discretionary as the second-largest contributor of losses on High-Risk ACEs, accounting for 15.5% of total aggregate losses—up from 13.6%.
• The median SAR Risk Score℠ of 1,029 constituent companies in Health Care is 33.18%. The Large, Mid, and Small Cap median scores are 21.09%, 22.30%, and 42.20%, respectively.
U.S. Securities Litigation Risk
Sector Market Capitalization Losses Amount to $1.4 Trillion
Key Takeaways
• The Financials sector’s securities litigation risk remained stable compared to January 2025. The ratio of market cap. losses to market capitalization increased from 12.53% to 12.78%.
• Market capitalization losses increased by 9.46%, while market capitalization rose by 7.35% during the same period, keeping the loss to market cap ratio largely unchanged.
• The increase in severity is driven by the magnitude of the High-Risk ACEs. Losses per High-Risk ACE increased from $0.78 billion to $1.07 billion – a 36.9% gain. The average number of High-Risk ACEs decreased from 2.20 to 1.81 events.
• The median SAR Risk Score℠ of 715 constituent companies in Financials is 6.70%. The Large, Mid, and Small Cap median scores are 9.94%, 6.99%, and 5.21%, respectively.
Table 8: Financials — Frequency and Severity of Adverse Corporate Events
Figure
U.S. Securities Litigation Risk
Sector Market Capitalization Losses Amount to $3.5 Trillion
Key Takeaways
• The Information Technology sector remains the largest contributor to market capitalization losses on High-Risk ACEs, totaling $3.5 trillion—an increase of approximately $0.7 trillion since January 2025. IT leads all eleven sectors with an increased share of total aggregate losses, rising from 27.8% to 29.6%.
• The sector has the highest market capitalization losses per High-Risk ACE at $2.21 billion. Losses per High-Risk ACE increased by $0.48 billion, or 27.7%. It also has the third highest average frequency across all sectors with 2.58 events.
• Mid and Large Caps IT companies ranked second in losses per High-Risk ACE at $0.59 billion and $8.74 billion behind Consumer Staples and Communication Services, respectively.
• The median SAR Risk Score℠ of 611 constituent companies is 25.41%. The Large, Mid, and Small Cap median scores are 19.62%, 25.84%, and 30.11%, respectively.
Table 9: Information Technology — Frequency and Severity of Adverse Corporate Events
U.S. Securities Litigation Risk
Key Takeaways
• Securities litigation risk in the Communication Services sector rose compared to January 2025, evidenced by a 29.31% increase in market capitalization losses, equivalent to roughly $236.56 billion.
• The increase in market capitalization losses reflects a rise in both the frequency and severity of High-Risk ACEs. Average losses per High-Risk ACE grew from $1.59 billion to $1.95 billion. The sector continues to rank second highest in losses per High-Risk ACE
• The frequency of High-Risk ACEs increased on average from 2.04 to 2.22 events, an 8.82% gain.
• The median SAR Risk Score℠ of 241 constituent companies in Communication Services is 20.98%. The Large, Mid, and Small Cap median scores are 12.59%, 18.41%, and 24.03%, respectively.
Table 10: Communication Services — Frequency and Severity of Adverse Corporate Events
Figure 10a: Frequency of ACEs
Figure 10b: Total ACEs by Market Cap
U.S. Securities Litigation Risk
Sector Market Capitalization Losses Amount to $129.5 Billion
Key Takeaways
• The Utilities sector’s securities litigation risk declined relative to January 2025, due to a larger increase in market capitalization compared to market cap losses.
• Market capitalization losses rose from $124.37 billion to $129.54 billion, or a 4.16% uptick. It is the smallest increase in severity among all sectors that exhibited an increase in risk.
• Market capitalization increased to $1,589.27 (or 13.77%) from $1,396.96 in January 2025. Utilities experienced the highest relative increase in market capitalization among all sectors.
• The median SAR Risk Score℠ of 89 constituent companies in Utilities is 6.11%. The Large, Mid, and Small Cap median scores are 7.16%, 4.17%, 7.11%, respectively.
Table 11: Utilities — Frequency and Severity of Adverse Corporate Events
Figure 11a: Frequency of ACEs
Figure 11b: Total ACEs by Market Cap
U.S. Securities Litigation Risk
Sector Market Capitalization Losses Amount to $23.4 Billion
Key Takeaways
• Market capitalization losses in the Real Estate sector increased by $8.28 billion compared to January 2025. The sector experienced the third largest increase in securities litigation risk.
• Despite the large relative increase in severity, Real Estate continues to have the lowest capitalization losses and losses per High-Risk ACE among all sectors with $23.4 billion and $0.30 billion, respectively.
• The sector comprises merely 0.2% of all market capitalization losses on High-Risk ACEs. Its share of total aggregate market capitalization losses has not changed and ranks last.
• The median SAR Risk Score℠ of 48 constituent companies in Real Estate is 8.79%. The Large, Mid, and Small Cap median scores are 11.63%, 11.15%, and 6.95%, respectively.
Table 12: Real Estate— Frequency and Severity of Adverse Corporate Events
Figure 12a: Frequency of ACEs
Figure 12b: Total ACEs by Market Cap
Securities Analytics Research
SAR is the leading data analytics company specialized in securities litigation risk of public companies that trade on the NYSE or NASDAQ.
Our goal is to harmonize the application of event study analysis across the risk management industry by following the standards adopted by the Federal Judiciary and developed in academia to optimize executive and financial risk-transfer solutions through responsible innovation in technology and data science.
Our organization is focused on the proactive and uniform application of the court-accepted event study methodology to identify securities litigation risks more accurately and quantify the corresponding economic impact on the market capitalization of U.S.-listed companies. SAR delivers value through transparency by proactively monitoring corporate disclosures of U.S. and non-U.S. issuers to detect Adverse Corporate Events that have a material impact on stock price performance.
Our company empowers leading multinational insurance carriers, re-insurers, risk management executives, legal counsel and investment professionals with proven securities litigation risk analytics and high-quality data licensing solutions. We have high standards of raw data requirements and quality control to ensure the tried-and-true technologies of the SAR Platform℠ deliver superior data-driven advantages to better protect corporate directors and officers of companies that choose to trade in American stock exchanges — the gold standard.
Our analytics solutions apply highly specialized data science to identify and quantify the securities litigation risks that corporate directors and officers of public companies may face from company-specific disclosures that materially impact an issuer’s stock price performance. SAR maintains two comprehensive industry-leading databases that comprise the knowledge bank of SAR Platform℠ The ACE Database catalogues stock price performance data on all corporate disclosures that are disseminated via corporate press releases or announcements and filings made with the Securities and Exchange Commission. The SCA Database catalogues stock price performance data on all corporate disclosures that are claimed to be fraud-related by investor plaintiffs in private securitiesfraud litigation. Documented standard operating procedures and assigned process owners in both data science and software engineering ensure that SAR remains at the forefront of responsible technological innovation backed by human accountability to deliver unmatched insights on the securities litigation risks facing directors and officers of public companies
We invite you to learn more about SAR by taking the time to read our industry-leading thought leadership at sarlit.com/thought-leadership
U.S. Securities Litigation Report Disclaimer
This independent research report presents SAR’s quantification of securities litigation risk for both U.S. and non-U.S. issuers listed on the NYSE or NASDAQ. The analysis is based on the proactive and uniform application of the court-accepted event study methodology. SAR continuously tests stock price performance over the corresponding close-to-close event window in response to corporate disclosures disseminated by issuers. This approach enables more precise identification of Adverse Corporate Events, which are categorized based on the issuer’s specific disclosure mechanism. All content published by SAR and presented in this report is based on securities analytics and research performed by professionals employed by the organization. SAR does not rely on any machine learning (ML) or artificial intelligence (AI) to produce the quantitative and statistical analyses presented herein or via the SAR Platform℠ and ACE Alert℠ subscription service. SAR actively maintains two highly comprehensive databases that archive and categorize all ACEs of U.S. and non-U.S. issuers in addition to all alleged corporate disclosures that are claimed to be fraud-related by investor plaintiffs in private securities-fraud class action litigation. SAR ranks all public companies that trade on the NYSE or NASDAQ according to the SAR Platform℠ on a near-real time basis and publishes summarized analytical tabulations and trends on a semi-annual basis.
Securities litigation risks associated with observed Adverse Corporate Events identified by SAR may or may not materialize into securities claims filed by allegedly harmed shareholders. Such claims, if brought, may be directed against the corporate directors and officers of the defendant issuers, or against the underwriters of the related securities offerings.
Securities claims may include, but are not limited to, securities class actions whereby investor plaintiffs allege violations of the federal securities laws under Section 11, Section 12(a)(2), and Section 15 of the Securities Act of 1933 (“Securities Act”), and under Section 10(b) and 20(a) of the Securities Exchange Act of 1934 and Securities Exchange Commission (“SEC”) Rule 10b-5 promulgated thereunder (“Exchange Act”). Securities litigation risks may also materialize from enforcement actions filed in federal court by the SEC for alleged violations of the anti-fraud provisions of the securities laws of the Exchange Act, Securities Act, or the Investment Advisors Act of 1940. The economic impact of securities litigation risks presented in this equity research report amounts to the cumulative market capitalization declines over close-to-close event windows on all High-Risk ACEs during a two-year evaluation period identified by SAR’s application of the court-accepted event study methodology.
SAR Risk Report Event Study Application Disclosure
The results of the analyses presented in this report employ a court-accepted event study methodology to identify ACEs ACEs are identified by estimating statistically significant, single-day negative stock price movements that coincide with company specific news. For each issuance analyzed, statistically significant price movements are identified using a single-firm control regression model, incorporating a minimum of 100 trading days of historical observations. The model adjusts for both general market and industryspecific factors. The general market factor is represented by the S&P 500 Total Return Index, while industry-specific factors are derived from indices aligned with the target company’s GICS classification. The applied methodology is conducted after market close and is limited to public companies listed on the NYSE or NASDAQ. Each analysis covers a two-year retrospective window from the applied evaluation date and assesses stock price performance in response to all company-specific corporate disclosures. Economic estimates by SAR are only estimates or projections, and actual results may vary, and may vary substantially, from those estimates or projections, which are based on many variables, assumptions, and forecasts, many of which are beyond the control of SAR and any of which may present differences with estimates that are quantified using different techniques that may or may not be submitted by officers of the court for review by the Federal Judiciary. No fraud or wrongdoing of any kind is alleged or implied by any such results derived by SAR and presented herein in this equity research report.
Sources: SAR ACE Database as of June 30 2025, FINRA, Securities and Exchange Commission, S&P Global Market Intelligence, and S&P Down Jones Indices.
How to Reach Us.
For any technical inquiries contact Stephen Sigrist, Senior Vice President of Data Science.
To learn more about how SAR can help your organization deliver superior executive and financial risk transfer solutions please contact Anthony Kabanek.
202.436.9994 anthony@sarlit.com
Appendix 1: SAR Risk Score℠ (Median), by GICS Classification
The following tables provide the median SAR Risk ScoreSM by Group, Industry, and Sub-Industry, as defined by the Global Industry Classification Standard (“GICS”). These scores are based on a sample of 4,544 companies. The last column shows the change in median SAR Risk ScoreSM between January 2025 and July 2025, expressed in percentage points. A positive value (e.g., +1.0) indicates a one percentage point increase in the median score—signaling a deterioration in securities litigation risk. Conversely, a negative
(e.g., –1.0) indicates a one percentage point decrease—reflecting an improvement in risk.