thereservoirsinPuertoRico
R.DeJesusCrespo*†,M.Valladares-Castellanos, VolodymyrV.MihunovandT.H.Douthat†
DepartmentofEnvironmentalSciences,LouisianaStateUniversity,BatonRouge,LA,UnitedStates
Impoundingsurfacewatersinreservoirsisamajormechanismforprovidingwater forhumanconsumption,includingpotablewater,hydroelectricpower,and industrialuses.Buildingreservoirsincursenvironmentalandsocialcosts,and thereforesafeguardingtheireffectivenessandlongevityisaconcernofclear publicinterest.Onefactorthataffectsthelongevityofreservoirsissedimentation, aprocessexacerbatedbylanduseconversioninupstreamwatershedareas. Despitetheeconomicimportanceofpreventingsedimentationinexisting reservoirs,fewconsumersareawareofthenaturalfeaturesthatprovide sedimentretentionservicesandtherelevanceoftheirconservationintheir dailylives.Moreover,managingforlandscapelevelsedimentretentionservices ischallengingduetoalackofclarityregardingsupplyanddemand flowsthat transcendwatershedboundariesandjurisdictions.Ourstudyseekstobridgethese gapsbycharacterizingthe flowofsedimentretentionservicestoreservoirsand linktheseservicestothespecificconsumersthatbenefitusingasocio-ecological network(SEN)framing.WeconductedthisstudyontheislandofPuertoRico(PR), thepopulationofwhichisheavilyreliantonreservoirsasaprimarywaterresource, whileexperiencingsevereandchronicreservoirsedimentationproblems.Our studymodelsavoidedsedimentexport,andthecostswereavertedthankstothis service.Wecharacterizedprotectionasopposedtovulnerabilityofthese sedimentretentionservicesbyestimatingtheproportionofnaturalareas undersomeformoflegalconservationstatusandtheleveloflandscape fragmentation.WeframetheseservicesasanSENbyusingwaterdistribution linesaslinkstoestimatethenumberofbeneficiariesandtheirlocationrelativeto thereservoir’swatersource.Ourresultsidentifywatershedswithconservation needs,theirbeneficiaries,andwherewithinthosewatershedstoprioritize conservationeffortstosafeguardaccesstocleanwaterinPR.Morebroadly, ourstudyprovidesamodelcasestudyforestablishingsupplyanddemandservice flowsofwaterpurificationservicesanddemonstratingtheutilityofmapping socio-ecologicalnetworksofservice flowsinordertojustifyconservationpolicies basedonecosystemservices.
KEYWORDS ecosystemservices,sedimentretention,reservoirs,socio-ecologicalnetworks,Puerto Rico
Reservoirsareamongthemostimportantsourcesoffreshwater forhumanconsumption,withusesrangingfromhouseholdto industrialconsumption,agriculturalirrigation,hydropower,and floodcontrol.Withpopulationgrowthandtheeverincreasing consumptionpatterns,thedemandforfreshwaterhasledtothe impoundmentofmanyoftheworld’sriversandtributaries.Today, itisestimatedthatover60%ofthemajorriversworldwideare interruptedbydams,andoftenattheexpenseofalteringtheriver’ s connectivityandecologicalfunction(Grilletal.,2019),including changesin flowregime(PoffandZimmerman,2009), geomorphology(Chongetal.,2021),andthemigratoryroutesof aquaticfauna,allleadingtofreshwaterbiodiversitydecline(Turgeon etal.,2019).Giventheirimportanceacrossthemajorsectorsof society,andtheenvironmentalcoststhattheyrepresent,ensuring theeffectivefunctioningandlongevityofexistingreservoirs(and hencepreventingtheneedfordevelopingnewdams)shouldbeakey societalpriority.
Themostimportantdriverofreservoirlifespandeclineis sedimentation(PodolakandDoyle,2015).Sedimentationis largelycausedbynaturalprocessesintheupstreamwatershedsof reservoirs,includingerosion,landslides,andinstreamdeposition (Schleissetal.,2016);however,anthropogeniclandusessuchas deforestation,agriculture,andurbanizationcanalsoaccelerate reservoirsedimentationrates(Gellisetal.,2006; Yuanetal., 2015; Attulleyetal.,2022).Conversely,naturalareas,suchas forestsandwetlands,havethecapacitytomitigateerosionand retainerodedsediments,helpingpreventtheirdepositioninstreams andrivers(Hammeletal.,2015; Guerraetal.,2016).The conservationofthesesedimentretentionecosystemservices(ES) shouldthereforebeincorporatedintoreservoirmanagement strategies,whichoftenrelysolelyonreactiveandcostly approachessuchasreservoirdredging.
Incorporatingwatershed-scaleESmanagementforreservoir longevityrequiresclearlydefiningtheextentoftheservicesand thebeneficiariesofsuchservices.Accordingly,anincreasingnumber ofstudieshavefocusedonmappingandidentifyingtheservice flows fromESsupplyanddemand(Weietal.,2017).Inthecontextof waterquality,ESsupplyconsistsofupstreamtodownstream watershed-scalehydrologicalprocessesincluding evapotranspiration,infiltration,andrunoffgeneration,which influencewaterpurificationanderosioncontrol.Mappingthe extentofhydrologicalESsupplyhasbeenadvancedbyremote sensingandgeographicinformationsystemtechnologythat facilitatesaccesstospatiallyexplicitdataontopography,land cover,soil,andclimate.Thesedatacanbeusedasinputsfor existinghydrologicalmodelingapproaches(Renardetal.,1997; Borsellietal.,2008),whichinturnhavebeenincorporatedintouserfriendlyplatformsreadilyaccessibletoESmanagers(Hameletal., 2015; Sharpetal.,2020).
ForESdemand,clearlydefiningthespatialrelationshipsrelated tohydrologicalES flowsisanimportantsteptowardcoordinated governancestrategiesthatexplicitlylinkthediversesetofinfluential actorsandusersforamorestrategicwatershedmanagement.While themappingofESsupplyisnowmoreaccessiblethanever,the governancecapacityofES flowshasbeenchallengingduetoalackof landscape-levelpolicysupportsystemsandtools,aswellasthe
difficultyofcommunicatingthesocialandeconomicimportanceof landscape-levelEStorelevantstakeholdersandend-users(DeGroot etal.,2010).
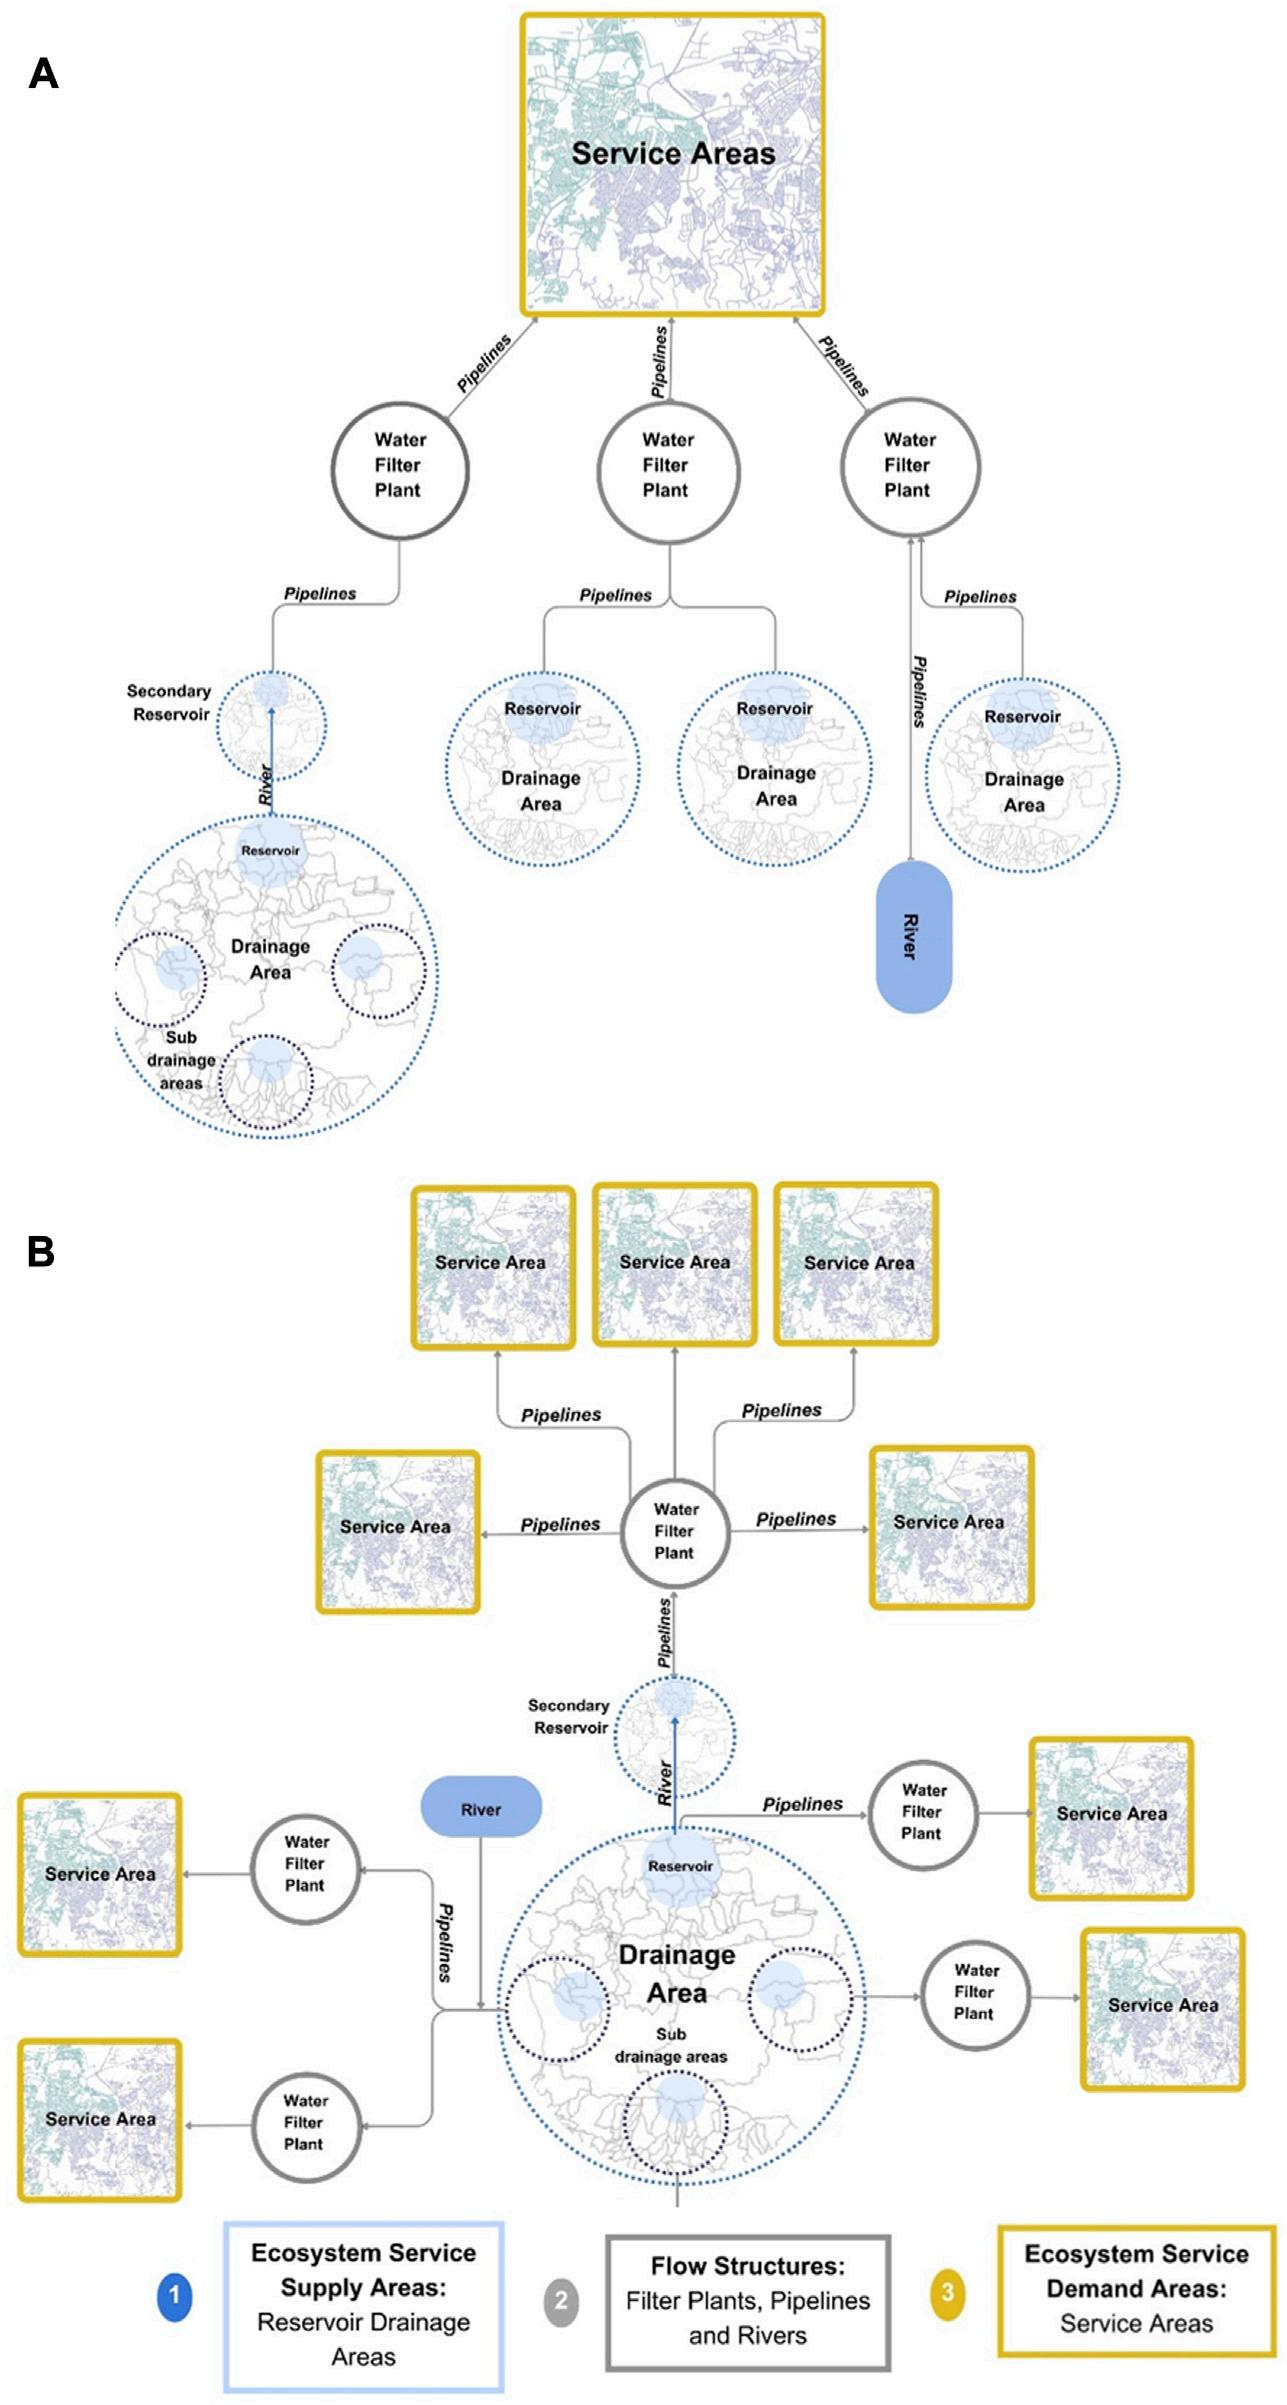
Onewaytodosoistoframethesystemofservicesasanetwork graph,withnodesandlinks(oredgesinnetworkterminology) connectinglandscapestopeopleviaamixofnaturalandconstructed features(Felipe-Luciaetal.,2021, Figure1).Thisapproachto describingtherelationalcomponentsofcoupledsystems exemplifiesasocio-ecologicalnetwork(SEN)framing(Saylesand Baggio,2017; Saylesetal.,2019; Felipe-Luciaetal.,2021). IncorporatingSENframingallowsforlinkingthespatialand scalardimensionsofthefunctionsthatsupportthelandscape productionofES(e.g.,riverstreamnetworks)tothescalesof demandandconsumptionforthe finalservicesandtheirlinkage tohumanpopulations(i.e.,pipelinesconnectingwatersourcesto households).ThereisaneedforthestandardizationofESstructures andformappingESsocialandeconomicvalues(DeGrooteetal., 2010).SENframingfacilitatesthestandardizationofdyadic componentsofES flows(nodesandties)andalsothemapping ofservice flowstoend-users.Thisisinturnimportantforvaluing tradeoffsfromdifferentpolicydecisionsrelatedtoplanning infrastructureandlandusethatimpactlandscapefunctions.
Inthecaseofsedimentretentionservices,theimportantnodes arethelandscapeunits(watershedsandmicro-catchments),the reservoirs,the filterplants,andtheserviceareastoconsumers.They arelinkedby flows,oredges,vianaturalfeaturessuchasstreamsin thecaseofthelandscape-to-reservoirnetworks,whichthenconnect totheconstructedfeaturesofpipenetworksto filterplantsandthen toend-users.ApplyinganSENframeworkcanhelpidentifythe naturalandhumancomponentsofecosystemsupplyanddemand, allowingresearcherstofocusmoreconcretelyonsometimeshardto conceptualizeinter-relationships.Indoingso,ithelpsinform managementwithincomplexsystems,especiallyquestionsof governanceinspatiallymismatchedsystems(Bodinetal.,2019; Saylesetal.,2019;Wangetal.,2019),asisthecasewithsediment retentionandotherhydrologicalecosystemservices.
Inthisstudy,wewillusetheSENframeworktofullycharacterize thesedimentretentionservice flowsforreservoirsintheCaribbean IslandofPuertoRico(PR).ThereservoirsinPRaretheprimary waterresourceforthemajorityofPR’spopulation(Ortiz-Zayas etal.,2004; PRDNER,2008a; Quiñones,2022).Theyarealso importantforhydroelectricpowergeneration, floodcontrol, fisheries,andrecreation(Ortiz-Zayasetal.,2004).MostofPR’ s reservoirshaveexperiencedsignificantcapacitylossdueto sedimentation(Ortiz-Zayasetal.,2004; PRDNER,2008b; Quiñones,2022).ReservoircapacitylossesinPRdueto sedimentationrangefrom12%to81%,dependingon topography,rainfallpatterns,andanthropogenicimpact(USGS, 2019).
Theeffectsofclimatechange(droughts,morefrequent hurricanes,and floods)couldpotentiallyexacerbatereservoir capacitylossinthefuture,increasingtheneedforpreventative watershed-scalesedimentmanagementstrategies.Forexample,in PR,therecenthurricanesMaria,Irma(2017),andFiona(2022) contributedtoaseverecapacitylossformanyoftheisland’ s reservoirs,includinga16%capacityreductionforDosBocas,one ofthemostimportantreservoirsoftheisland,renderingits remaininglifespanto37years(Quinones,2022).Moreover,
FIGURE1
Conceptualrepresentationofthesedimentretentionecosystemservicesupplyanddemand flowsusinganSENapproach.Panel (A) representsthe networkofasingleservicearea,whichrepresentsthelocationofendusersandtheirlinkagestoseveralreservoirsandtheirrespectivewatershedareas. Panel (B) representsthenetworkofasinglereservoir swatershedareaanditslinkagestomultipleserviceareas.Wepresentanexampleofeachofthese derivedfromourdatain Figure6
88milliondollarsoftheFederalEmergencyManagementAgency (FEMA)disasterrecoveryfundsforPRhavebeenallocatedforthe dredgingofanotherimportantreservoirthatbecameseverely affectedduetorecenthurricanes(FEMA,2022a).Thecritical stateoftheisland’sreservoirsmakesthemespeciallyvulnerable todroughts,asevidencedintheperiodof2014–2016,whenasevere droughtcompromisedaccesstopotablewaterontheIsland, requiringtheimplementationofrationingpracticesto householdsduringthesummermonthsandresultinginsevere agriculturallosses(PRDNER,2016).TheseeventsshowthatPR’ s waterresourcesarevulnerabletoclimaticeventsandshouldbe prioritizedforpreventivemanagement.Therecentinfluxoffederal resilienceplanning(FEMA,2022b),andmorerecentlyfornaturebasedsolutions(NOAA,2023)toPR,suggesttheneedforempirical dataandstrategiestosupporteffectiveprioritizationand management.
Ourspecificobjectivesforthisprojectareasfollows:1)to quantifyandvaluethesedimentretentionservicesupstreamof importantreservoirsforwaterconsumption,2)todeterminethe locationofthebeneficiariesoftheseservicesandcreateservice-shed networkmapsillustratingthe flowsofsupplytodemand,and3)to determinethevulnerabilityoftheseservice flowsbylookingatthe leveloflegalprotectionand/orfragmentationofnaturalareas. Addressingtheseobjectiveswouldhelpinformprioritizationfor watershedlevelmanagementofthereservoirsinPR.Moreover,by framingtheseobjectivesaroundanSENapproach,thisstudy providespracticalstepsforoperationalizingthestudyofES flows andhelpsinformtheirmanagement.Whiletheoutputsofthisstudy mostdirectlyinformES flowmanagementbyenvironmentaland waterresourceagencies,authorities,andengagedadvocacygroups, ourstudyalsoprovidesinformationthatcanaidincreatinggreater generalawarenessaboutES flows,whatareasareimportantfor conservation,andwhobenefitsfromthem.Theconnectionofwater consumergeographiestorelevantESlandscapeunitscanbeuseful forabroadswathofthesociety,rangingfromconcernedindividuals toclientsofwaterutilities,aswellasgrassrootsorganizations interestedincommunity-basedplanningandengagement.
2Methods
2.1Studysite
PuertoRicoisaCaribbeanislandwithanestimated 3,221,789inhabitants,apopulationdensityof960peopleper squaremile,andatotallandareaof3,424.32squaremiles(US Census,2022,dataasofJune2022).Annually,temperatureaverages rangefrom22to25°Cinthemountainsto24–27°Cincoastalareas (USGS,2013).Acentralmountainrangedividesthenorthandsouth endsoftheIsland,creatingdistinctrainfallpatterns.Rainfallinthe mosthumidareasofPRcanreach169inches/year(4292.6mm/yr), whereasinthemostaridregions,itaverages30inches/year (762mm/yr)(USGS,2016).Overall,theislandhasatropical climatewithlocalmicroclimaticvariationsduetotopography andtradewinds.
Fromtheenvironmentalgovernanceperspective,PRiswellpositionedtodeveloplandscape-levelmanagementefforts comparedtootherUSjurisdictionswithmoredecentralized
planningsystems.AcentralizedPuertoRicoPlanningBoardwas createdduringtheNewDealandaimedtocreatecomprehensive economicandlanduseplanningthroughacentralizedgovernment entity(Howell,1952; Pico,1953).Waterutilitiesandsewersystems arealsocentralizedunderasingleutility,PuertoRicoAqueductand SewerAuthority(PRASA),thePuertoRicoDepartmentofNatural andEnvironmentalResources(DNER)hasbeentheisland’ s resourceandpollutionregulatorsincethe1970s,andaJoint PermitRegulationforConstructionWorksandLandUseissued bythePuertoRicoPlanningBoardgovernslandusepermitunder thePuertoRicoPlanningBoardOrganicAct(1975)(Diaz-Garayua andGuilbe-Lopez,2020),butotherfunctions,e.g.,administering localcollectionsandparcelinventories,arepartofthePuertoRico MunicipalRevenueCollectionsCenter(CRIM).Withinthat context,the1991AutonomousMunicipalitiesActprovided significantpowerforsomeplanningandpermittingandrevenue activities,aswellastraditionalroleswithlocalinfrastructure(e.g., municipalroads)tomanymunicipalities,leadingtogreater fragmentationindecision-making.However,withinthissystem, muchofthecoordinationandinformaticsforplanningisstill managedbytheplanningboard,whichwasauthorizedin 2004tocreateaPuertoRicoLandUsePlan,harmonizingland useclassificationandzoning,inconjunctionwithexistingmunicipal plansthroughouttheentiretyofPR.Theplanwasenactedin 2015withlanduseclassifications,andspecificzoningis containedintheTerritorialOrdainmentPlanforeach municipalitywhereapplicable(USGS,2015).Thecombinationof partialMunicipalplanningcontrol,strongmayoralpoliticalpower, privatepropertyrightsandinterests,andamixofstatewide planningauthoritiesmeansthatPuertoRicoissomewhat polycentricintermsofthelandscapemanagementscale,but amenableinstructureandsizetocomprehensivelandscape approaches.
Theseapproachesmaybecollaborativeorpolycentric(Berardo andLubell,2016,AnselandGash,2018),buttheyneedtodefine salientlandscapescalesandareasifcollaborativeplanningisgoing tooperate.Speciallegislationandparticipationinnationalprograms hascreatedlandscapelevelwatershedeffortsintheenvironmental qualityrealm,suchastheSanJuanBayEstuary(SJBE)program. Theseeffortsrecognizechallengesfortheintegrationoflocaland communitydecision-makingintothelandscape/watershedcontext, butfacethecomplexitythatwatershedsaregovernedbydiverse domainsintersectingwithplanningandinfrastructure,notjust environmentalinterests.Withinthiscontext,thescalesand geographiesofESnetworksand flowsmustbedefinediftheyare goingtobegoverned,regardlessofwhetherthepolicystrategyis centralizedorpolycentric.However,thecollaborationtobuild structuresforlandscapegovernancemayrequirecreatingforums andby-insfromactorsatdifferentscalesanddomainswhocan recognizetheirinterdependentinterestsingoverningES flows, whichrequirestheirdefinitionandmappingtoresolve informationasymmetries.Thislargerneedwasidentifiedinthe PuertoRicoWaterPlan(PRDNER,2008a),whichhasnotbeen executed,andispartofthedriversofthelegacychallengestothe PuertoRicowatersector.
Weappliedawatershedscaleanalysisforthisstudytohelp informwaterqualitygovernance,focusingonreservoirssupplying waterforconsumption.PuertoRicohas36reservoirsthathavebeen
TABLE1SedimentretentionserviceisquantifiedasavoidedsedimentexportsandavoideddredgingcostsforthewatershedsdrainingtoreservoirsinPuertoRico. *LoizaisalsocalledCarraizo.
Reservoir Watershedarea(km2) Avoidedexport(tons/yr)Avoidedexportperarea(tons/km2) Avoidedcost(USD/yr)
Carite21.47369,88717,229$144,253 Cerrillos45.096,627,713146,986$3,512,921
Cidra21.04291,54513,859$165,839
DosBocas218.0915,479,42670,977$39,387,024 Fajardo27.372,602,03495,083$1,614,172
Garzas15.861,069,71867,453$1,324,658
Guajataca60.46847,08414,010$1,048,077
Guineo4.24249,70358,846$202,981 LaPlata445.9825,103,70356,288$16,082,985
Loco21.842,255,803103,284$1,595,812
Loiza*497.8722,039,97844,268$11,473,798
Luchetti45.066,945,401154,147$7,868,101
Matrullas11.57539,88246,671$541,416
Patillas66.657,382,188110,757$3,571,233
Portuguez27.103,661,004135,115$1,911,653
Prieto24.602,845,787115,667$2,029,552 RioBlanco25.93385,73514,874$153,765
RAN21.733,244,650149,336$2,634,199
ToaVaca57.496,507,227113,187$5,155,293
Valenciano40.041,396,68634,878$1,027,483 Vivi16.791,846,721109,984$1,197,390 Max497.8725,103,703154,14739,387,024 Min4249,70313,859144,253 Mean855,318,66178,6624,887,743
useddirectlyforservicessuchashydroelectricpowergeneration, irrigation,andwaterconsumption,aswellasindirectservices,such as floodcontrolandrecreation(Ortiz-Zayasetal.,2004; Quiñones, 2022).Itisestimatedthat70%ofthepotablewaterhandledbythe PRASAcomesfromreservoirs(Ortiz-Zayasetal.,2004; Quiñones, 2022)andthat96%oftheresidentsofPRareservedbyPRASA (USGS,2018).Mostofthereservoirsarelocatedinthecentral mountainousregiontotakeadvantageoftheabundantrainfallin thisarea(Ortiz-Zayasetal.,2004).Allreservoirshaveseenreduction intheircapacityduetohighsedimentationrates,representingan importantissueforwaterresourceconservationintheIsland(OrtizZayasetal.,2004; Quiñones,2022).Outoftheexistingreservoirs,we selectedthetrendson20reservoirsfordetailedstudy(Table1)due totheircurrentimportanceforwaterconsumption,excludingthose thatarenolongerinuseorthatareprimarilyusedforother purposes.Wealsoincludedinourstudyasmallartificiallagoon (RetencionAcueductoNorte,RAN Table1),whichisdownstream fromoneofthemajorreservoirs(DosBocas)andwhichcontributes watertooneofthemostimportantpipelinesoftheIslandthe
“AcueductoNorte’’ (Ortiz-Zayasetal.,2004).Theselectedreservoirs hadwatershedareasrangingfrom4to498km2 (Table1).The sedimentretentionsupplycalculationsfocusonthesewatershed areas(entireupstreamdrainagesincludingallstreamtributaries) andalsoonthemicro-catchmentareas(thedrainageareasof individualtributaries)withintheselargerwatersheds(Figure5). Weconductedouranalysisatbothscalesinordertoprovideconcise summariesandvaluationsbroadly(watershedscale)andcreate mapstoidentifyareaswithinthewatershedsthatprovidethe mostservicescurrentlyandthatcouldbetargetedfor conservation(micro-catchmentscale).
2.2Estimatingsedimentretentionservice supply
Toestimatesedimentretentionecosystemservices,weusedthe IntegratedValuationofEcosystemServicesandTradeoffs(InVEST) modelingplatform.InVESTisasuiteofopen-sourcemodeling
softwarethatgeneratesspatiallyexplicitestimatesofecosystem serviceswhichcanthenbeusedforenvironmentalmanagement applications(NaturalCapitalProject,2022).Weappliedthe sedimentretention(SR)model(Hameletal.,2015; Sharpetal., 2020)whichmapsthegenerationanddeliveryofsedimentsfrom overlanderosiontothestream.Themodelcomputestheannualsoil lossfromeachpixel(uslei)andthesedimentdeliveryratio(SDRi), thatis,theproportionofthesoillossthatwasnotretainedby vegetationandtopographicfeaturesandthusreachedthestream. Theproductofthetwovaluesequalsthesedimentexportfroma givenpixel,measuredintons ha 1yr 1.Onceinthestream,the sedimentisassumedtoreachitsoutlet,andnoin-streamprocesses aremodeled.
Theannualsoillossonpixeli,uslei,measuredintons ha 1yr 1, isestimatedusingtheRevisedUniversalSoilLossEquation (RUSLE1; Rendardetal.,1997),whichisawidelyusedand validatederosionmodelpredictingannualsoillossbasedon runoff,slope,andlandcover(Rendardetal.,1997).Inparticular, RUSLEisaproductof fivevalues:Ri rainfall,erosivityKi soil erodibility,andLSi slopelength-gradient,estimatedfrom elevationrelationships(slopes)ofagivenpixelandits neighboringareausingmultiple flowdirectionalgorithms, Ci cover-managementfactor(usle_cinthebiophysicaltable)
Pi supportpracticefactor(usle_pinthebiophysicaltable)
Inturn,SDRi,aproportion,isafunctionofSDRmax,maximum theoreticalSDR(chosenbasedontheinputfortheentiremodel), connectivityindex,andtwoothercalibrationparameterschosenfor themodel(Borselli’sIC0andk),whichdefinethefunction describingthegrowthofSDRovertheconnectivityindex,which isanS-shapedincreasingfunction.Lowerkdefinesasteepergrowth ofSDR,andlowerIC0producesafunctionwithhigheroverallSDR values.Theconnectivityindex,similarlytotheslopelength-gradient factor,usesmultiple flowdirectionalgorithmsandcapturesslope relationships,butincontrastalsoaccountsforthecovermanagementfactorvaluesofpixels.Thisindexhydrologically linkstheoverlandsourcesofsedimenttostreams(sediment sinks),withitshighervaluescorrespondingtohigher connectivity,forexample,duetothesparsevegetationorhigher slope,or viceversa.Oncethesedimentexportisestimatedasthe productofusleiandSDRi,theretainedsedimentamountsforeach pixelcanalsobemeasuredasthedifferencebetweenthesediment generated(uslei)andsubsequentlyexportedfromthepixel.
Forthisstudy,theerosivityraster(R-factor)wasacquiredfrom NOAACoastalServicesCenter(2014b) andconvertedfromUS customaryintoSystemInternational(SI)unitsbymultiplyingthe rastervaluesby17.02,asdetailedinAppendixAoftheUSDA RUSLEhandbook(Renardetal.,1997).Soilerodibilityraster (K-factor)wastabulatedfromthegNATSGOdatabase(USDA NRCSSoilSurveyStaff(2021a) andsimilarlymultipliedby 0.13toconvertintoSIunits(Renardetal.,1997).The biophysicaltablefortheSDRmodelcontainedusle_candusle_ p-valuesforeachlanduseandlandcover(LULC)codeandwas derivedfrompreviousstudies(WischmeierandSmith,1978; Stone andHilborn,2012)andadaptedfrom Smithetal.(2017),which conductedthemostrecentmodelingeffortforESinPuertoRico.For thelanduseandlandcoverlayer,theNOAA2010CoastalChange AnalysisProgram(C-CAP)30MeterLandCoverofPuertoRico rasterwasused(NationalOceanicandAtmosphericAdministration
OfficeforCoastalManagement,2022).Toourknowledge,thisisthe mostrecentLULClayerfortheIsland.ItclassifiesLULCin 23classesdescribedindetailintheNOAAOfficeofCoastal Management(2022).Adigitalelevationmodel(DEM)rasterwas required,andforthisweusedtheAdvancedSpaceborneThermal EmissionandReflectionRadiometer(ASTER,2019)data.The ASTERDEMwascorrectedby fillinginsinks(usingthe filltool inArcGISPro; Esri,2022a),andtheoutputstreammapsfromthe InVESTmodelwereconfirmedtobeconsistentwithexistingstream shapefiles(USGS,2017).Thecalibratingparametersweresetto defaultvaluesaccordingtoInVESTguidelines(Sharpetal.,2020), andtheywereasfollows:threshold flowaccumulation(numberof pixels) 100,BorselliKparameter(whichwastestedatvalues rangingfrom1to3,with0.5increments;seethevalidation/ calibrationsection),BorselliIC0-0.5,maximumSDR (proportion)setat0.8,andmaximumLvalue122.
PreviousvalidationstudiesusingtheInVESTSRmodelhave foundsupportfortheuseofthetoolforthe first-orderESassessment toprioritizeandrankareasforconservation(Hameletal.,2015). Theuseoflocaldataformodelvalidationandcalibrationis recommendedtoimprovetheperformanceandaccuracy(Hamel etal.,2015; Hameletal.,2017).Ourcalibrationandvalidation processisdescribedinthenextsection.
2.3SedimentRetentionServiceModel ValidationandCalibration
TovalidatetheoutputsoftheInVESTSRmodel,wecompared themodel’ssedimentexportestimatesfrom22watershedsdraining intothereservoirstothemeasuredvaluesofaverageannual sedimentationratesonthesamereservoirs(Quiñones,2022). ThesevalueswerecompiledasMm3 peryear,soweconverted ourtonsperyearestimatestothisunitusingthestepsdetailedin SupplementaryMaterialS1.Inaddition,theInVESTSRmodelwas testedwithdifferentvaluesoftheparameterkb,whichhasbeen foundinpreviousstudiestobethemostsensitivetovariation (Anjinhoetal.,2022).Wetestedthemodelwithvaluesranging from1to3,with0.5increments,anddeterminedtheirrelative performanceusingacoefficientofdeterminationcriteria(Raufand Ghumman,2018; Anjinhoetal.,2022).Thecoefficientof determinationvaluesrangedfrom R2 =0.72forkb =1to R2 = 0.77forkb =3.Allthetestedmodels’ performanceswereclassifiedas “good” accordingtocriteriafrompreviousstudiesvalidating observedvs.modeledsedimentexports(RaufandGhumman, 2018; Anjinhoetal.,2022).Whilethesedimentestimates correlatedtoobservations,theestimatedvaluesrangedin magnitudebasedonthekb parameterused(thehigherthekb, thehigherthevalue,SM2).BecausetheInVESTSRmodelonly accountsforoverlanderosion,anddoesnotincludeotherpotential sourcesofsedimentation(e.g.,gullyerosion,landslides,andbank erosion),weexpectedoursedimentexportestimatestobelowerin magnitudethantheobservations.Thiswasconsistentlythecasefor ourlowerboundestimate(kb =1).
Wealsocomparedourvalueestimateswiththoseofprevious studiesonoverlanderosionrates. Ramos-SharronandFigueroaSanchez(2017) estimatedtheoverlandsedimentexportfromcoffee farmsintheLuchettiwatershedwhichrangedbetween14,000and
29,500Mgperyear(or15,432and32,518tonsperyear).By comparison,ourmodelestimatedarangeoftotaloverland sedimentexportsinthesamewatershedof40,789–130,599tons peryear,asshownin SupplementaryMaterialS2.Consideringthat coffeefarmscompriseonlyaportionoftheLuchettiwatershedarea, ourlowerboundestimates(k1)maybeconsideredtobewithin similarvalueranges.AnotherexamplecomesfromtheCanovanas watershed.Weestimatedittohaveanoverlandsedimentexport rangebetween38and220tons/km2/year(SupplementaryMaterial S2),whileanempiricalstudyforthissamewatershed(Larsen,2012) estimatedtheexporttobe41metrictons/km2/yearfromthe overlanderosioncomponentofthesedimentbudget(inthat studydefinedasslopewashandtreethrow).Wedeterminedfrom thesecomparisons,aswellasourvalidationanalysis,thatourlower boundestimates(kb =1,SM1)werethemostcrediblebasedon empiricalobservations.Therefore,ourdescriptiveanalyseswillfocus aroundthesevalues.However,fordetailsofthehigherboundvalue estimates,see SupplementaryMaterialS2
2.4Dollarvaluationofsedimentretention services
Weestimatedthepresentdollarvaluefortheavoidedsediment exportusingtheformuladescribedin Sudeetal.(2011) (Equation1):
ValueSRi SRi XMC, whereSRi isthesedimentpreventedfromenteringthewater systemperpixelandMCisthecostofsedimentremoval.We estimatedthevalueofsedimentremovalusingtheexistingestimates ofsedimentdredgingcosts.Whiletheactualcostsofsediment removalcanvarybasedonthesizeoftheproject,thedredging technique,andthesedimentdisposalapproach(Anchor,2019),we usedanestimateof$8m3,whichhasbeenappliedinprevious studiesforcalculatingreservoirsedimentmanagementintheUS (Smithetal.,2013).Weadjustedthevalueto$8.64/tonusinga conversionfactorof1.08ton/m3 basedonthebulkdensityestimates ofsedimentsinareservoirinPR(Soler-Lopezetal.,1997).
However,thisisalowerbound,asrecentvalueestimatesrange between$8and60perm3,consideringthatthecostsofsite preparation,management,andsedimentdisposalaretakeninto account(Anchor,2019).Inaddition,recentestimatesfroma reservoirdredgingprojectinPRsuggestacostofupto$26per ton(FEMA,2022a),soourcostpertonestimateisalowerbound, conservativevalue.Weextrapolatedthesecostsovera20-year period,applyingtheequationmentionedpreviouslyplusa discountrateof3%(0.03)peryear,basedontheOfficeof ManagementandBudgetguidelines(CEA,2017),andthoseused inothersimilarestimates,whichmayincluderatesof7%insome instances,althoughsomenewerrecommendationsaroundthesocial costsofcarbon,forexample,areusing2%–3%discountingrates (USEPA,2022).Wethenestimatedthenetpresentvalueofthe averagecostperyearafteradjustingforthediscountrate.Our analysisdoesnotincludeestimatesaboutratesofinflationfor infrastructureprojects,whichshouldbeconsideredinfuture studies,orwhenadoptingthe finalvaluationpolicies.
2.5Vulnerabilityassessmentofsediment retentionservices
Toestimatethevulnerabilityofthesedimentretentionservice, wecharacterizedourstudywatershedsintermsoffragmentation andlevelofprotection.Landscapefragmentationmayleadto alterationsinESsupplyanddemand flows(Mitchelletal.,2015). Inthecontextofwaterpurificationandrunoffreduction,landscape fragmentationcandisrupt flowpatterns,interruptingtheretention capacityofnaturalareaswhentheyareinterspersedwith anthropogeniclanduses(Mitchelletal.,2015).Inaddition,we arguethatoncealandscapeisfragmented,itbecomesmore vulnerabletourbanization.Thisisbecausefragmentationleadsto areductioninhabitatquality,biodiversity,andecologicalfunction (Mullu,2016),allofwhicharefactorsthataretakeninto considerationwhengrantingordenyingdevelopmentpermitsin PR(PuertoRicoLaw2411999; PuertoRicoLaw4162004).In addition,onceanaturalareaisfragmentedbyaroador infrastructure,itbecomesmoreconnectedtothelargerurban infrastructureandmoreamenableforfurtherdevelopment,an effecttermed “inducedgrowth” (Cervero,2003).Conversely,in protectedareas,wherethereareformallegalandplanning protections,therewouldbelessvulnerabilitytofragmentation andtothelossofES flows.
Toquantifyfragmentation,weusedthe2010NationalLand CoverDatabaseofUSGS.Weestimatedatthelandscapeandclass level,theedgedensity,numberofpatches,andpatchdensityusing the landscapemetrics packageinR(Hesselbarthetal.,2019).The landscapemetricswerecalculatedatthemicro-catchmentandthe watershedscale.Toquantifyvegetationfragmentation,theedge densityandpatchdensityvaluesofthelandcoverclassesassociated withvegetationweresummarizedusingtheweightedaverage method.Thegrassland,mixedforest,scrub,palustrineforested wetland,palustrinescrubwetland,palustrineemergentwetland, estuarineforestedwetland,estuarinescrubwetland,andestuarine emergentwetlandvalueswereweightedasafunctionofthe percentageoflandperclass (Equation2).
CMjw CMi p PLAND 100 ,
whereCMjw istheclassmetricweightedvalueforasitej,CMi is thevalueperclassmetric,and PLAND isthepercentageoftheland coverbytheclass.
Toestimatethelevelofprotection,weusedtheProtectedAreas DatabaseoftheUnitedStates(PAD-US)3.0(USGS&GAP,2022), AprotectedareaunderthePAD-USdatabaseisone: “Dedicatedto thepreservationofbiologicaldiversityandtoothernatural(including extraction),recreationandculturaluses,managedforthesepurposes throughlegalorothereffectivemeans” (USGS&GAP,2022).They includelandwithstateorfederalprotectionstatus(e.g.,wilderness areas,nationalmonuments,andareaofcriticalenvironmental concern)andlong-termeasementsandagreements(USGS& GAP,2022).
WeusedtheArcGISProAnalysistoolstoestimatethe percentageofprotectionperwatershedareaandmicrocatchment.Asummaryofthestepsfollowedtocharacterize servicesupply,protection,andfragmentationispresentedin Figure2
FIGURE2
Summaryofstepsfollowedanddatainputsusedforthecharacterizationofsedimentretentionservicesupplyandvulnerability.
2.6Estimatingsedimentretentionservice demandusinganSENframing
Acombinationofspatialandnon-spatialdatawasusedto delineatetheserviceareasandestimatethepopulationservedto measuretheESdemand.First,thewatershedareasandreservoirs weredefinedasthesupplynodes.Forthisstudy,thereservoir watershedareaswereacquiredfromtheNationalWater InformationSystemoftheUnitedStatesEcologicalSurvey (USGS,2023).Theserviceareasweredefinedasthedemand nodes,andthestreamsandpipenetworksweredefinedasedges connectingthedemandandsupplynodes.Furthermore, intermediatestructuressuchaswater filtrationplantsand pipelinepressurezoneswereusedtotracetheES flowalongthe network.
Toidentifytheserviceareasassociatedwiththewaterreservoirs, wejoinedthe2022waterqualityreportsprovidedbythePuertoRico AqueductandSewerAuthority(PRASA,2021)andtheSafe DrinkingWaterInformationSystem(SDWIS)datasetsfromthe UnitedStatesEnvironmentalProtectionAgency(USEPA,2023). Second,tomaptheserviceareas’ spatialextent,weusedtheArcGIS Pro3.0spatialanalysistoolstojointhe filterplants,pipelines,and pressurezonenetworklayersfromthePuertoRicoAqueductand SewerAuthority(Esri,2020).Wesummarizedthepopulationand numberofhouseholdswithineachserviceareausingtheESRIUSA Census2020RedistrictingBlockslayerthatjoinstheU.S.Census Bureaupopulationinformationandthe2020TIGERboundariesfor PuertoRico(ESRI,2022b).Furtherdetailsaboutthespecificprocess usedtoundertakethisanalysisareprovidedin Supplementary MaterialS3
Wecomparedourserviceareapopulationestimateswiththe estimatespublishedonlinebythePRAqueductandSewerAuthority
forthereservoirsthattheyadminister(PRASA,2023).Whilethe PRASAestimatescapturethedemandforthereservoirswithintheir supplysystem,thedatadonotprovideanestimateofdemandfor reservoirsnotadministeredbyPRASAbutthatalsoprovidewater forconsumption.Inaddition,thedatadonotincludelocation informationbeyondalistofmunicipalities,makingitdifficultto detailedcomparisonofuserdemand.Therefore,ourapproachis intendedto1)provideamoreaccuratelocationofservice characterizationforPRand2)testtheSENapproachfor estimatingwaterusedemandinlocationswherespecific consumerdataarenotreadilyavailable. Figure3 showsthe workflowfollowedfortheservicedemandestimates.
Toestimatetheactualwaterdemandperhousehold,weusedthe daily percapita domesticuseinPRestimatedat98gallons(0.37m3) (MolinaRiveraandIrrizary-Ortiz,2021).Wethenextrapolated thesevaluestoayear,foranestimatedannual percapita useof 135m3.SincetheaveragepopulationperhouseholdinPRis 2.74people(USCensus,2022),thisleadstoanestimatedwater useof370m3 perhousehold/yr.Wemultipliedthisnumberby PRASAclientsserved(whenavailable)orSENhouseholdestimates toestimatethehouseholdwaterdemand(Mm3/yr)foreachsystem. Forreference,wealsoincludethereservoirs’ currentcapacitybased ondataobtainedby Quiñones(2022)(SM1)forcomparisonwith ourdemandestimates.
3Results
Thewatershedscalemeanavoidedsedimentexportwas 5,318,661tons/yrandrangedfrom249,703tons/yrto 25,103,703tons/yr.Thewatershedwiththehighestsediment totalavoidedexportwasLaPlata,andtheonewiththelowest
FIGURE3
Summaryofstepsfollowedandthedatausedtoestimatesedimentretentionecosystemservicedemandbyusersofthereservoirsandwater systemsofthePRAqueductandSewerAuthority(PRASA).
wasGuineo.Thesevaluescorrespondtotherelativesizeofthese watersheds,asLaPlataisamongthelargestinareaandGuineo amongthesmallest(Table1).Correctedbywatershedsize,themean avoidedexportwas78,617tons/km2.Thewatershedwiththehighest perareaavoidedexportvaluewasLuchettiwith154,148tons/km2, followedbythe RAN watershedwith149,336tons/km2.Thelowest perareaavoidedexportwasobservedinCidra,with13,859tons/ km2,followedbyGuajataca,with14,010tons/km2.Thetotalavoided costsduetotheavoidedsedimentexportsrangedfrom$144,253to $39,387,024,withanaverage$4,887,743avoidedcostsperyear.
AccordingtoourSENestimates,theservicedemand (householdsconnected)toeachreservoirrangedfrom1,365to 250,775households,withanaverageof53,297householdsperyear (Table2).Ourestimatesoftheservicedemand(i.e.,household users)werecomparedagainstthepublishedvaluesbyPRASAofthe estimatedclientsservedbytheirreservoirs(Table2),andtherewasa positivecorrelationofthevalues(R2 =0.56).Whilethenumberof householdsservedonaveragebyeachreservoirwasnearlyidentical (PRASA=54,935,SEN=53,407),thevalueswerenotcomparable forsomereservoirs,suggestingadiscrepancythatwefurtheraddress inourDiscussionsection.Thelargestdiscrepancywasfoundwith
theCidrareservoir,whichaccordingtoourSENanalysisis connectedto170,873households,whilethePRASAestimates thatitserves14,537households.WespeculatethatPRASA estimateswerecorrectedbytherelativeproportionofwater extractedfromthisreservoirtoeachoftheseareasundernormal conditions,whileourstudyfocusedmainlyonthenumberof householdsconnectedtothereservoir’snetwork.
Intermsofwaterdemand,weestimatedthatatotalof 307.36Mm3 ofwaterisconsumedannuallyfromallthe reservoirsunderstudy,andanaverageof20.33Mm3 per reservoirperyear.Wevalidatedthesevaluesusingexistingdata onactualwaterwithdrawalsfromtheIsland.Accordingto MolinaRiveraandIrizarry-Ortiz,(2021),waterdeliveriesfor2020were 1.48Mm3/dayor540Mm3 peryear.Consideringthatsurfacewater accountsfor~89%ofwaterdeliveries(Molinaetal.,2019)and reservoirsaccountfor~70%ofsurfacewaterwithdrawals(OrtizZayasetal.,2004; Quiñones,2022),thenthetotalannualwater demandisapproximately336Mm3/year,whichissimilartoour estimateof307.36Mm3/yr.Thespecificvaluesofwaterdemandper reservoirandhowthatcomparestothecurrentcapacityforeachof thereservoirsareshownin Table2
TABLE2Sedimentretentiondemand,quantifiedasthenumberofpeopleconnectedtothereservoir(SENestimates)andcharacterizedbythewatersystemsbeing servedandthereservoircurrentcapacity.
Reservoirs Capacity (Mm3)
SEN-estimated households served
PRASA-estimated householdsserved Householdwater demand(Mm3/yr)
Serviceareas
Carite10.0330,88215,4315.71GuayamaUrbano;Farallon Cerrillos36.8455,72751,43019.03PonceUrbano Cidra5.43170,87314,5375.38Metropolitano,CidraUrbano Coamon/a34,725n/a12.85CoamoUrbano DosBocas13.4227,266n/a10.09Superacueducto,CorozalUrbano Fajardo5.4725,86431,51411.66FajardoCeiba Garzas4.8310,505n/a3.89Penuelas,Garzas Guajataca40.6866,31563,21823.39Isabela,QuebradillasUrbano,LaresUrbano, Aguadilla,LagoGuajataca
Guineo1.794,849n/a1.79Aceitunas LaPlata29.36151,621130,82848.41Metropolitano,AirbonitoLaPlata,CayeyUrbano, ComerioUrbano
Loco0.3620,011n/a7.40Lajas Loiza 13.15250,775179,38766.37Metropolitano,SanLorenzoUrbano Luchetti8.9620,011n/a7.40Lajas Matrullas2.921,365n/a0.51Matrulla Patillas12.9837,94714,3135.30GuayamaUrbano;PatillasUrbano Portuguez11.041,406n/a0.52Guaraguao,Tibes Prieto0.00225,683n/a9.50IndieraAlta,Duey,Yauco RioBlanco4.6817,71729,39110.87RioBlancoViequesCulebra
Retencion AcueductoNorte
n/a110,624n/a40.93SuperAcueductropolitano,BarcelonetaUrbano, VegaBajaUrbano,TierraNuevaRabanos,Manati East,Maguayo,DoradoUrbano ToaVaca61.9285,90219,3047.14PonceUrbano,CotoLaurel,RegionalVillalba Valenciano12.7517,979n/a6.65JuncosCeibaSur Vivin/a6,913n/a2.56UtuadoUrbano,LaPica Max61.92250,775179,38766.37 Min0.0021,36514,3135.30
Mean14.5653,40754,93520.33
Sum353.091,174,960549,353307.36
*Sourcesforcapacity: https://www.csagroup.com/markets/water/valenciano-dam-reservoir/; http://www.recursosaguapuertorico.com/embalsesprincipales.html.n/ameansnotapplicable,informationwasnotavailable. LoizareservoirisalsocalledCarraizo.EstimatesfromPRASAandourSEN correlatepositively(R2 =0.56)
Thepercentofnaturalareasinthewatershedsofthestudied reservoirsrangedfrom50%to98%,withanaverageof82%.The percentprotectionrangedfrom0%to70%,withanaverageof17%. Theedgedensityrangedfrom12to87m/ha,withanaverageof 53m/ha.Thenumberofpatchesrangedfrom18to19,082,withan averageof1,507patchesperwatershedarea.Thepatchdensity rangedfrom0to5patchesper100ha,withanaverageoftwo patchesper100ha.
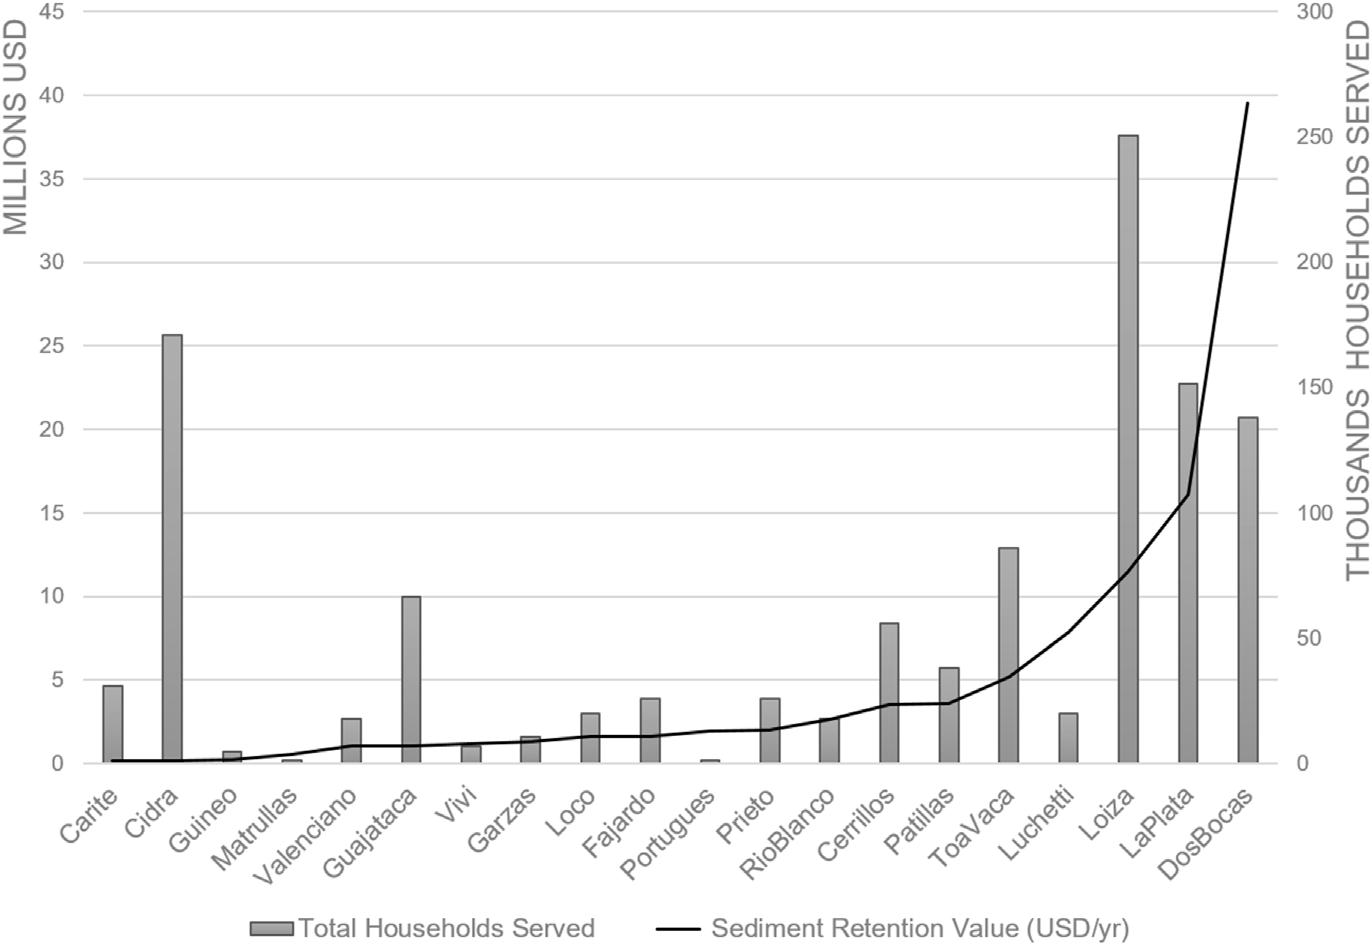
Thewatershedswithhigherthanaverageavoidedexports(service supply, Table1; Figure4)inorderofvalueareDosBocas,LaPlata, Loiza,Luchetti,andToaVaca.Whileallofthesewatershedshaveahigh percentageofnaturalareas(64%–86%),allhaverelativelylow percentageofareasunderthelegalconservationstatus(0%–6.6%) (Table2).Outofthese,ToaVacahadthehighestfragmentation(ED= 87.31m/ha,PD=4.19).Loiza,LaPlata,andToaVacaalsorankas higherthanaverageintermsofservicedemand(Table2; Figure4).
FIGURE4 Supplyvs.demandofsedimentretentionservices.Forthereservoir DosBocas,weusedtheestimatesofpopulationdemandfor Retencion AcueductoNorte and DosBocas combined(Table2),asthelatterdrainsandcontributeswatertotheformer.
Thewatershedswithhigherthanaverageservicedemand accordingtoourSENanalysis(inorderofdemand)areLoiza, Cidra,LaPlata,RAN,ToaVaca,Guajataca,andCerrillos.Outof these,CidraandGuajatacahadbelowaverageservicesupplyintotal andcorrectedbyarea(Table1; Figure4).Cidrastandsoutashaving thelowestnaturalarea(50%),lowconservationstatus(0%, Table3), andrelativelyhighfragmentation(ED=60.4,PD=4.08)(Table3). LoizaandLaPlatahavehightotalservicesupplyanddemand (Figure4),butwhencorrectingbyarea,theybothhavealowerthan averagesupply(Table1).Moreover,thepercentageofnaturalareas underlegalconservationstatusislowforthesewatersheds(2.79% and4.15%,respectively, Table3; Figure5).
DosBocascanbeconsideredtobehavingahighservicesupply (intotalandcorrectedbyarea)andalsoahighdemandifwetake intoaccountitspositionupstreamfromthe RAN watershed.These watershedswouldbenefitfromhavingbeenmoreformallyprotected fromfuturedevelopmentandlandusechange,asDosBocashas only6.62%ofitswatershedunderlegalconservationstatus(1.48% for RAN).ToaVacaalsohasahighservicesupplyandrelativelyhigh demand,buthighvulnerability,asitsnaturalareasareamongthe mostfragmentedrelativetootherwatershedsevaluated(ED=87.31, PD=4.19).
TheCidraandGuajatacareservoirsshouldbeconsideredtobe supplyanddemandmismatchedbecausetheyareinhighdemand withlowerthanaveragesupplyofsedimentretentionservice.These watershedshavenaturalareasof50%and67%(respectively), relativelyhighfragmentation(ED=60.40and70.65, respectively),andlowprotectionstatus(0%;4%).These watershedscanbeconsideredforrestorationpurposesto enhancetheirservicedeliverytothebeneficiarypopulations.
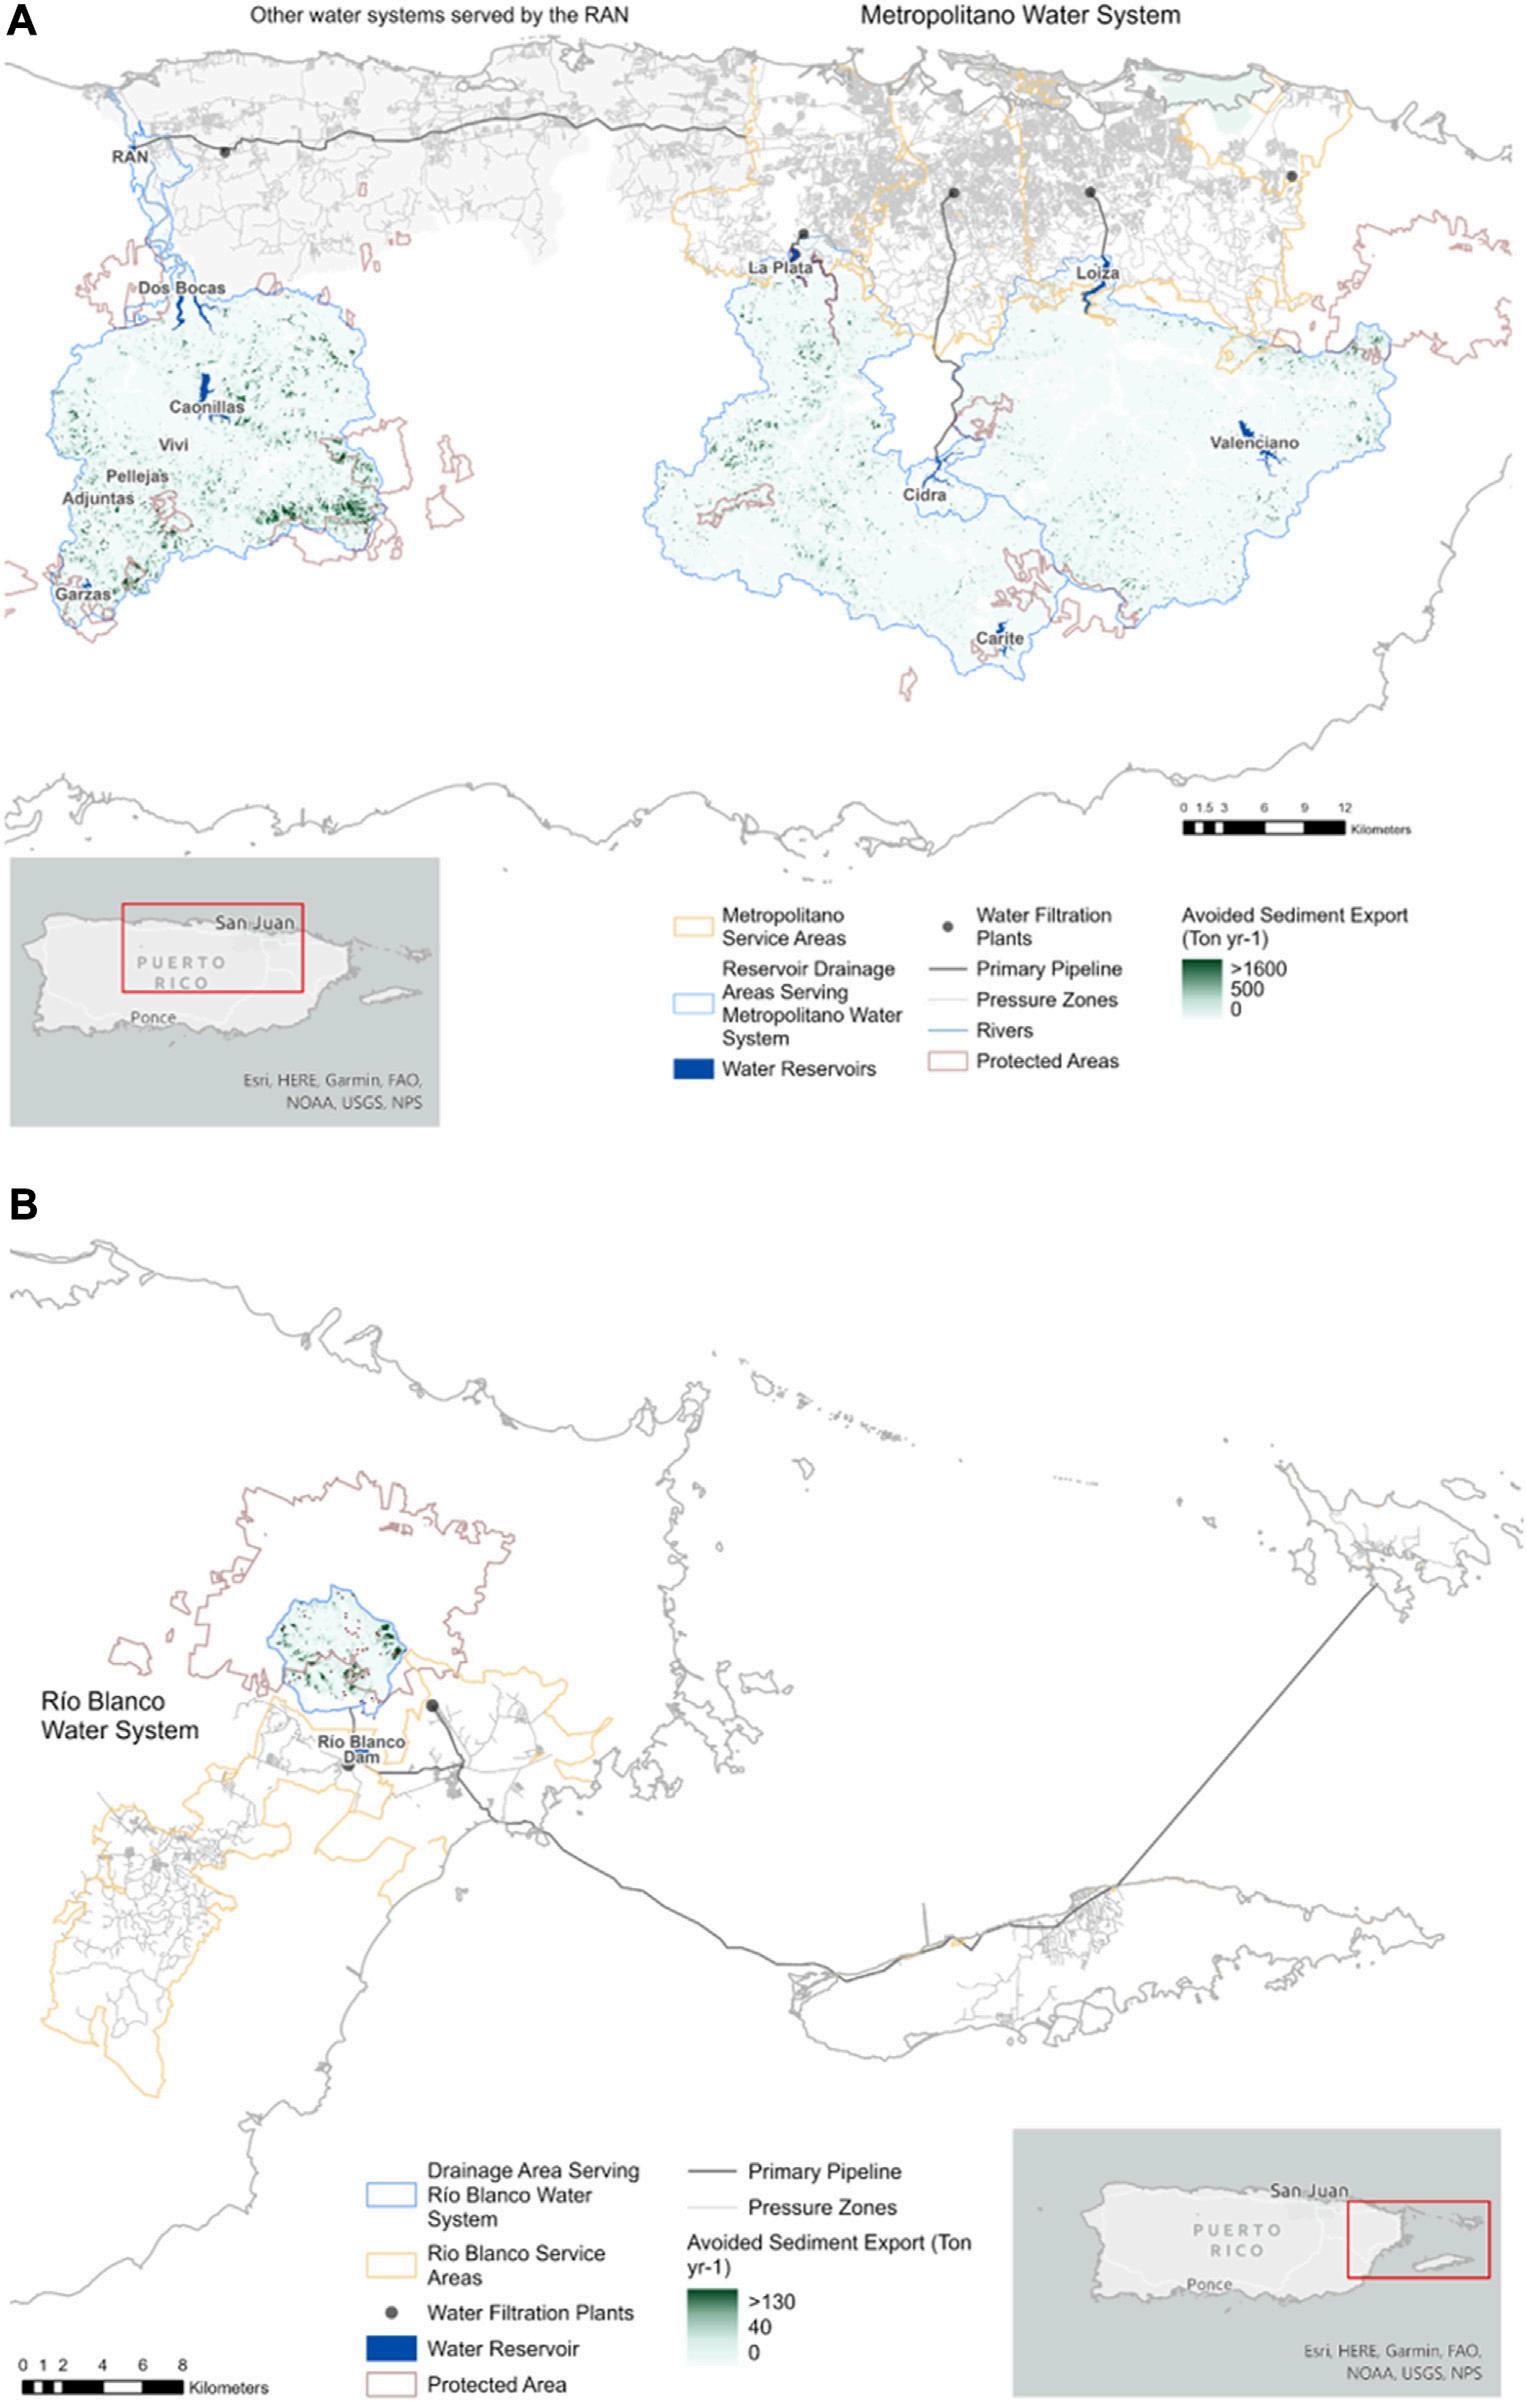
OurSENmapresultsareshownin Figure6 foraselected numberofillustrativeserviceareasandwatershedareas.Thesemaps
illustratehowdisparatelocationsacrosstheislandareconnectedto thenetworkofnaturalstreamfeatures,andpipelines,andhow landscapeconservationinthewatershedareaofdistantreservoirs benefitspopulationsoutsideoftheselandscapeunits.Theseislandwideconnectionsexistforotherreservoirsandserviceareasaswell, and Table2 liststheselinkages.Detailedmapsforadditional locationsareavailableuponrequest,butwerenotincludedfor thesakeofbrevity.
4Discussion
4.1Supplyanddemandanalysis
ThewatershedsthatsupplywaterforconsumptioninPRhavea relativelyhighpercentageofnaturalareas,butmosthavelittlelegal conservationandprotection,makingthemvulnerableto developmentandlandusechangeinthefuture.Byestimating theavoidedcostsofsedimentremovalprovidedbythesenatural areas,andthenumberandlocationofpeoplewhoarebenefitted,we candevelopconservationstrategiesforsafeguardingthisresource forfuturegenerationsoftheIslandsuchaspaymentforecosystem serviceschemesandtargetedconservationeasementprogramsthat accountforlandscapeprioritizationbymeansofESvaluation.
Ourestimatessuggestthatindividually,thewatershedsdraining toreservoirscontributeanestimated$4.9milliondollarsperyearin avoidedcosts. Sudeetal.,2011 followedasimilarapproachtostudy sedimentretentionservicesfortheErtanReservoirinYalongRiver, China(101km2),andestimated785.8×108 yuanofavoidedcostsin 1year(year2005),whichamountstoamuchlargervalueinUSD thanourestimates.Ontheotherhand,anotherstudyintheUmaOyawatershedinSriLanka(765km2)estimatedtheavoidedcostsof
TABLE3Vulnerabilityassessmentofsedimentretentionservice,quantifiedasthepercentageofprotection,andleveloffragmentationofthevegetationin reservoirs’ watershedareas.
Reservoirs VegetationprotectionVegetationfragmentation
%Vegetation
%ProtectedEdgedensity(m/ha)NumberofpatchesPatchdensity(#/100ha)
Carite85.5126.6142.891180.92
Cerrillos90.8210.0545.623670.78
Cidra50.090.0760.403624.08
DosBocas86.016.6259.5851021.25
Fajardo90.9442.8032.082751.89
Garzas85.9535.2641.17850.64
Guajataca67.074.5070.6513044.60
Guineo94.0154.4825.01180.49
LaPlata72.634.1573.6378393.55
Loco*92.0844.7556.192542.57
Loiza64.322.7960.3590823.67
Luchetti*85.842.0864.126442.03
Matrullas*84.6323.6440.121041.38
Patillas89.6418.0337.163190.89
Portuguez89.940.0057.613360.92
Prieto90.5814.1545.491490.72
RioBlanco97.9769.8812.05550.23
RAN64.631.4845.515865.34
ToaVaca84.740.0087.3113864.19
Valenciano*55.270.0064.327283.99
Vivi90.942.5167.142041.38
Max9870879,0825 Min50012180 Mean8217521,3962
$34,215USDannually,whichismuchlowerthanourestimates. Thesecomparisonshighlightthatvalueestimatescanvary dependingontheparametersusedandtheassumptions.Here, weassumedthatthereservoirswouldbedredgedintheevent thatthereservoir’scapacitybecamecompromised,andwealso madeassumptionsregardingthediscountrateoftheseavoidedcosts andthedredgingcoststhemselves.Therefore,theactualavoided costsaremeantheretoprovidearelativeestimate,withthesecriteria inmind.
Despitethesecaveats,wecancompareouravoidedcost estimatestotherecentLoiza(alsoknownasCarraizo)reservoir dredgingprojectinPRforfurthervalidation.In2022,theproject allocatedaninitial$88.7millionfordredging,afterthereservoirhad alreadybeendredgedintheyear1997(FEMA,2022a).Thisamounts toatleast~$3.5million/yrofcostaccruedin25years,whichisnot toofarfromourestimates,especiallywhenconsideringthatthe planneddredgingvolume2Mm3 (2.6millioncubicyards)islower
thanthatoftheactualsedimentationthatoccurredinthistime period(4.39Mm3, FEMA,2022b).Moreover,themeasureof avoidedsedimentremovalcostsfromdredgingdoesnotaccount forotherco-benefitsofsedimentretentionservices,including recreationaluses, fisheries,andbiodiversityconservation.In addition,previousstudieshavecalculatedotherESsprovidedby thesamenaturalareas,suchasnutrientretention,carbon sequestration,and floodriskreduction,whichhavebeen documentedasvaluedbyresidentsinPR(Smithetal.,2017), andtocontributeco-benefitsbeyondmonetaryvaluation,suchas increasesinhumanwellbeing(Yee,2020).
Whenextrapolatingthenumberofhouseholdsconnectedto reservoirsintotheestimatesofwaterdemand,weobservethatthe levelofannualwaterwithdrawals(i.e.,307.36Mm3)isveryclosein valuetothetotalcapacityofthereservoirsbeingwithdrawnfrom (353.09Mm3).Onaverage,theannualdemandforwaterfrom individualreservoirs(20.33Mm3)exceedstheexistingcapacity
FIGURE5
Avoidedsedimentexportatthemicro-catchmentscaleforthereservoirsunderstudy.Panel (A) depictsavoidedsedimentexportinrelationtothe percentofprotectedareas.Panel (B) depictsavoidedsedimentexportinrelationtoedgedensity,anindicatoroffragmentation.RAN, Retencion AcueductoNorte
(14.56Mm3).Whiletheseestimatesshouldbeconsideredcarefully, withallthelimitationsofourstudyinmind,theseestimatessupport aneedfordevelopingproactivestrategiestopreventfurthercapacity loss,animperativethatmaybecomemorecrucialinthefuture,if therearechangesintheprecipitationregime(droughtsand hurricanes)thatexacerbatethevulnerabilityofreservoirsinPR.
4.2Vulnerabilityanalysis
Ourstudycharacterizedtheleveloflegalprotectionofsediment retentionservicesacrosstheIsland.Themostimportantreservoirs intermsofservicedemandaccordingtoourstudy,Loiza,LaPlata, andDosBocas,haveahighpercentageofnaturalareasintheir watershedswhichprovidehighlevelsofsedimentretention. However,theyhavealowpercentageofprotectedareas,which makestheirwatershedsvulnerabletofuturedevelopment,which maydisruptthesystemsofnaturalfunctionsunderpinningthe ecosystemserviceprovision.Thisisrelevantintermsofrelating
ecosystemservice flowstostrategicwatershedconservation initiatives,whichhavebeenhighlightedascruciallyessentialfor post-hurricaneresilienceontheIsland(Prestonetal.,2020).Itis alsoimportantintermsofrelatingissuesofwaterprovisiontoland useregulationandplanningpolicy.Forexample,thisanalysiswould informPRASAwaterusersaboutthepotentialimpactofchangesto landuseclassificationsunderthePuertoRicoLandUsePlanand JointPermittingRegulation(PuertoRicoPlanningBoard,2022)to thereservoirsthatprovidewaterfortheirconsumption.
Areservoirsystemthatseemstobevulnerableaccordingtoour studyisCidra,whichservesalargepopulation,buthasalow percentageofnaturalareaandhigherthanaverage fragmentation.Cidra’shighdemandestimatescanbeattributed toitsconnectiontotheMetropolitanosystem,forwhichitmay contributeasmallproportionofthetotalamountofwater.However, thefactthatitisconnectedtoahighpopulationareaandthatitalso connectstodifferentserviceareasthatrelyonitsolely(Cidra Urbano)highlightthepotentialneedforitsmanagement. PrevioussedimentationsurveysontheCidrareservoirsuggest

FIGURE6 MapsdepictingexamplesofourSENresultsforthesupplyanddemandofsedimentretentionservicesofreservoirsinPR.Panel (A) isanalogousto panel (A) in Figure1,anddepictstheserviceareaof Metropolitano ,whichcorrespondstotheSanJuanmetropolitanarea,andallthereservoirsand watershedareasconnectedtoit.Panel (B) isanalogoustopanel (B) in Figure1 anddepictsthewatershedareaof RioBlanco reservoiranditslinkagesto multipleserviceareasincludingtheislandsofViequesandCulebra,andalsothemunicipalitiesofPR.RANrefersto RetencionAcueductoNorte Otherserviceareasandreservoirlinkagesareshownin Table2
thatthereisnoimmediateconcernforcapacitylossforthisreservoir duetosedimentationinthenearfuture(Soler-Lopez,2010). However,sedimentationhasbeenshowntoaffectthereservoir’ s operationalcapacity,aswaterintakestructuresandsediment dischargingstructures(sluicegates)havebeenburiedby8–9feet ofsediment(Ortiz-Zayasetal.,2004).Anotherhighlyfragmented watershedareaisthatofToaVaca,areservoirwithhighsESdemand andsupply,butwhichwouldbenefitfromconservationand restorationinitiatives,especiallygivenitscurrentcapacity,which ishighandsuggestsitspotentialtoserveanevenlargerpopulation inthefuture.WhilethisstudyshowedhighESsupply,theToaVaca drainageareaalsostandsoutashavingoneofthehighestperarea sedimentexportratesofallmajorreservoirsaccordingtoprevious studies,supportingtheneedforwatershedplanningtoavoidfurther increasingerosionandsedimentexportratesinthefuture(OrtizZayasetal.,2004).
4.3Applicationof findings
Our findingsmayhelpinformthedevelopmentofpaymentfor ecosystemserviceschemesthatusethesedollarvalueestimatesasa guideline.Forexample,amunicipalityinPRinterestedin community-basedconservationeffortscoulddesignateannual feestowaterconsumersfortheprotectionoftheservice provisioningunitsoftheirprimaryreservoirs.Foranaverage reservoirwith54,297householdsand$4.9milliondollarsin sedimentretentionservice,thiswouldimplya$90annualfeeor approximately$7permonthperhousehold,whichcouldthenbe usedincoordinationwithexistingNGOsandorganizationsonthe Islandtodevelopstrategicconservationprograms(e.g., ParaLa Naturaleza, FoundationforPuertoRico, Centroparala ConservaciondelPaisaje,and ProtectoresdeCuencas).Here,we mustnotethatinPuertoRico,utilityratesaremuchhigherthanin theUS(UnitedStatesEnvironmentalProtectionAgency,2023)and thepovertyleveldoublesthatofthepooreststate(ACS,2021). Addingevenasmallfeetoanalreadyexceedinglyexpensiveutility systemforthePRcitizensmaynotbethe firstapproachtoconsider. Alternatively,alreadyexistingprogramsandfeesmaybeused towardthesegoals.Forexample,PRASAalreadycharges residentstworelevantfees:1)environmentalandregulatory compliancecharge(CCAR)and2)awatersustainabilitycharge (PRASA,2022).Perhapsthestrategicuseofthesealreadycollected fundscouldbeconsideredforESmanagement,whichisan importantaspectofwatersustainabilityinPR.
Theselectionofthebestplacestofocusforconservation easementsandotherprotectionstrategiescouldthenbeinformed byour fine-scalemapofmicro-catchment(Figure5)withineach watershedarea,whichprovidesinformationregardingtotal sedimentretainedandcurrentlevelofprotectionand fragmentation.Theactualcostofacquiringandconserving propertiesforsedimentretentionserviceshasnotbeenfactored inthisstudyandcouldbethefocusoffuturestudiesthatcompletea moreexpansivecost–benefitanalysisofpaymentfortheecosystem serviceprogramontheIsland.Theseanalysesmayalsoincludeother co-benefitssuchas floodcontrol,recreationalopportunities,and biodiversityconservation,allofwhichwouldaddtothevalueof acquiringlandforconservation.
Ourstudyisthe firstonetoprovideaclearcharacterizationof thesupplyanddemandofsedimentretentionES flowsfortheisland ofPuertoRico.Byknowingwhichlandscapescontributetothewater qualityofwhichcitizens,wecandevelopmoretargetedconservation strategiesandcommunity-ledeffortsforESmanagement.For example,weshowedalinkbetweentheprotectedareasofthe LuquilloNationalForest,theonlytropicalfederalforestofthe Nation,andthewaterqualityoftheislandsofViequesandCulebra, whicharetheendusersoftheRioBlancoreservoir,anddirect beneficiariesoftheconservationofthesenaturalareas(Figure6). WealsoshowedhowtheresidentsoftheSanJuanmetropolitanarea benefitnotonlyfromthenearbyLaPlataandLoizareservoir watershedsbutalsofromthemoredistantDosBocas,whichis directlylinkedtothewatersupplyofthe RetencionAcueductoNorte ThisinformationprovidesthecitizensofPRwithabetter understandingofthevalueofvegetationconservationand managementacrosstheIsland,andat finescales,inordertosee whichlandscapesandmicro-catchmentstotargetinordertoprotect andenhancesedimentretention. Table2 showsotherlinkagesacross theIsland.
Ourstudyalsopresentsareplicableprocesstoapplyfor operationalizingthecharact erizationofsupplyanddemand fl owsofES.OursuggestedSENprocesscanbeappliedor customizedasneededforotherapplications.Thiscould includetheadditionofrelationaltiestoplansandlawsat differentscalesforgovernanceanalysis,moredetailed incorporationofnaturalfunc tionsandlandscapedatafor modeling,oradditionalconsume rinformationforfuturevalue estimationsbasedonservice –consumerlinkages.Thecontextof waterqualityservice fl owspresentsanopportunitytocreate concretemeasurementsofsocio-ecologicallinkages,asstream networksandpipelinesconnect landscapestoendusers,and thesedataarewidelyavailable,atleastintheUnitedStates,from utilities,andviaSafeDrinkingWaterActandCleanWaterAct (SDWAandCWA)reportingdatabases.PRwasanidealcase studyfortheapplicationofthesuggestedapproachbecausethe IslandisthesinglesourceofES,andPRASAservesmostofthe populationasaCommonwealthwideutility.Whiletheapproach couldbeusedinotherlocations,weshouldnotethatitwould requireacquiringthesystemservi cedataforthelinespotentially fromseveralutilitiesandjurisdictions.SDWAandCWAdata,for example,associatereservoirswithlocationsofdemand,butthese arejurisdictionalattributes,withoutspeci fi cspatialdataon serviceareasandserviceline s.Additionalstudiesareneeded todeterminehowfeasibleitistoreplicatethisprocessinother locationsandwhatarethedata gapsandchallengesthatneedto beovercometodoso.Additionallimitationsofourstudyare discussedasfollows.
4.4Studylimitations
Ourstudyhadseverallimitations.TheInVESTSRmodelisnot meanttoprovideacomprehensivesedimentbudgetforreservoirs,as theavoidedsedimentexportvaluesonlyaccountforoverland erosionanddoesnotincludeestimatesforgullyerosion,channel erosion,orlandslides(NaturalCapitalProject,2022).InPuerto Rico,landslidesmayconstitutethemajorityofthesedimentation
sourceforsurfacewaters(Larsen,2012);therefore,ourestimates onlycoveraportionofthesedimentationriskinsurfacewaterson theisland.Nevertheless,theprocessesthatleadtoavoidedsediment exportbyvegetationalsocontributetoreducinglandsliderisk.For example,astudyby Larsen(2012) comparedsedimentexportsand sourcesoffourwatershedsinPRandfoundahigherrateof landslidesinurbanizedvs.forestedwatersheds.Inaddition,the processoffragmentation,whichwesuggestherethatitcanaffectthe provisionofoverlandsedimentretention,canalsoincreasetherisk forotherformsoferosion.Forexample,ithasbeensuggestedthat roadconstruction,whichfragmentsforestedareas,isaleadingcause oflandslideoccurrenceinPR(LarsenandTorres-Sanchez,1992; HughesandShulz,2020).Therefore,themappingandprioritization datapresentedherecanbebeneficialforthemanagementoferosion issuesintheislandasawhole,andnotjustfromoverlanderosion. Previousstudieshavealsoconductedsimilarmapping characterizationsfortheriskoflandslidesthroughtheisland (HughesandSchulz,2020).Usingthisinformation,wedeveloped asupplementarymapshowinghowlandslideriskrelatestoour estimatesofavoidedexportsfromoverlanderosion(Supplementary MaterialS4).
Whilethenetworkofthereservoirto fi lterplanttopipeline allowsaroughestimationofthenumberofendusersforeach reservoir ’ swater,thefactthatpipelinesreceivewaterfrom multiplesourcesmakesitmorecomplicatedtodeterminethe relativeimportanceofeachrese rvoirsourcethatcontributesto thesamedistributionsystem.Therefore,ourestimatesof connectedhouseholdscouldbefurtherre fi nedinfuture studiestoincluderelativeweightsaccountingforthe proportionofwaterprovide dbyeachreservoirtoeach system.Here,wenotethatourestimatesofconsumerslinked totheselectedwatershedareasdonotfullymatchtheestimatesof clientsservedpublishedbyPRASAintheirwebsite.Wewerenot ableto fi ndthemethodsusedbyPRASAtoprovidetheir estimates,butitispossibletha ttheirmethodsaccountforthe relativeimportanceofeachrese rvoirtotheendusersconnected, aswellaspotentiallossesduringt hedistributionprocess.Despite thesediscrepancies,therelativeimportancetousersofthe reservoirsstudiedcorrelate dwiththePRASAnumbers,and thereforeouranalysisstillpro videsagoodestimateofrelative differencesinservicedemand,eveniftheabsolutenumberof usersrequiredfurthervalidation.
Ourassessmentofthevulnerabilityofservicesisbasedonthe assumptionthatthefragmentationofnaturalareaswouldlikely causeareductionintheESsupplyandthatnaturalareasunderany formofthelegalconservationstatusshouldbebetterprotected againstdevelopment.Theseassumptionsneedtobetestedingreater detailinthefuture.
Lastly,ourmodelestimatesarebasedonthebestavailable publiclyaccessibledatasets.Someofthesedata(e.g.,2010PR CCAPlanduseandlandcover)wouldneedtobeupdatedonce newinformationisavailabletobetterreflectthecurrentconditions ontheisland.However,sinceourmethodshavebeendocumentedin detailandarebasedonopensourcesoftwareanddata,webelieve ourresultscanbereplicatedfullytoupdatethemasneededandhelp informmanagementofreservoirsedimentation.
5Conclusion
WaterconsumersinPuertoRicobene fi tfromsediment retentionservicesfromnaturallandscapesacrosstheIsland. Theseservicescanamounttomi llionsofdollarsannuallyifwe considerthepotentialcostsofreservoirdredging.Ourstudy providesavaluationoftheseser vicesandacharacterizationof theservice fl owsfromwatershedareastoreservoirstoend users,whichshowhowpeopleinonesideoftheislandbene fi t fromdistantnaturallandscapesintheireverydaylives.This characterizationisusefulforraisingawarenessaboutthe importanceofecosystemser viceconservationandalsoa frameworkforfuturestudiestoevaluatesocio-ecological networksofwaterqualityecosystemservice fl ows.Despite thevalueofsedimentretentionservicesbynatural landscapesinPuertoRico,theselandscapesarevulnerable duetothelowleveloflegalconservation,fragmentation,and potentialchangestozoning regulationsthathavebeen proposedinPR.Theinformat ionweprovideherecanassist decisionmakersandcommuniti esinprioritizingareasfor conservationandmanagementtoaddressthese vulnerabilitiesinthefuture.
Dataavailabilitystatement
Theoriginalcontributionspresentedinthestudyareincludedin thearticle/SupplementaryMaterials;furtherinquiriescanbe directedtothecorrespondingauthor.
Authorcontributions
Conceptionanddesignofthework(RDandTD);acquisition, curation,andanalysisofdata(MV,VM,RD,andTD);designand formattingof figuresandtables(MV,RD,andTD);draftingofthe manuscript(RD,TD,MV,andVM);revisingthemanuscript criticallyforimportantintellectualcontent(RD,TD,MV,and VM).Allauthorscontributedtothearticleandapprovedthe submittedversion.
Funding
PuertoRicoSeaGrantprovidedfundsfortheexecutionof thisproject(grantno.NA22OAR4170097).Additionalfunds wereprovidedbytheNationalAcademyofSciencesGulf ResearchProgramEarlyCareerFellowship(grantno. 2000010755).
Acknowledgments
TheauthorswouldliketogiveaspecialthankstoFerdinand Quiñonesforprovidingbackgroundinformation,contextual awareness,andvalidationinformationforthisproject.
Conflictofinterest
Theauthorsdeclarethattheresearchwasconductedinthe absenceofanycommercialor financialrelationshipsthatcouldbe construedasapotentialconflictofinterest.
Publisher’snote
Allclaimsexpressedinthisarticlearesolelythoseoftheauthors anddonotnecessarilyrepresentthoseoftheiraffiliated
References
AdvancedSpaceborneThermalEmissionandReflectionRadiometer(ASTER) (2019).Globaldigitalelevationmodelversion3(GDEM003). https://asterweb.jpl. nasa.gov/gdem.asp
AmericanCommunitySurvey(ACS)(2021).Percentpopulationbelowthepovertyline (2016-2020). https://data.census.gov/table?q=S1701:+POVERTY+STATUS+IN+THE+ PAST+12+MONTHS&g=010XX00US$0400000,&tid=ACSST5Y2020.S1701
Anchor,Q.E.A.(2019). “Developmentofbasiccostmodelforremovalofsediment fromreservoirs,” in Preparedforthenationalreservoirsedimentationandsustainability team (Lakewood,CO,UnitedStates:AnchorQEA,LimitedLiabilityCompany).
Anjinho,P.D.S.,Barbosa,M.A.G.A.,andMauad,F.F.(2022).Evaluationof InVEST swaterecosystemservicemodelsinaBrazilianSubtropicalBasin. Water 14 (10),1559.doi:10.3390/w14101559
Atulley,J.A.,Kwaku,A.A.,Gyamfi,C.,Owusu-Ansah,E.D.,Adonadaga,M.A.,and Nii,O.S.(2022).Reservoirsedimentationandspatiotemporallandusechangesintheir watersheds:Thecaseoftwosub-catchmentsofthewhitevoltabasin. Environ.Monit. Assess. 194(11),809.doi:10.1007/s10661-022-10431-y
Berardo,R.,andLubell,M.(2016).Understandingwhatshapesapolycentric governancesystem. PublicAdm.Rev. 76(5),738–751.doi:10.1111/puar.12532
Bodin,Örjan,Alexander,StevenM.,Baggio,Jacopo,Barnes,MicheleL.,Berardo, Ramiro,Cumming,GraemeS.,etal.(2019).Improvingnetworkapproachestothestudy ofcomplexsocial–ecologicalinterdependencies. Nat.Sustain. 2(7),551–559.doi:10. 1038/s41893-019-0308-0
Borselli,L.,Cassi,P.,andTorri,D.(2008).Prolegomenatosedimentand flow connectivityinthelandscape:Agisand fieldnumericalassessment. Catena 75,268–277. doi:10.1016/j.catena.2008.07.006
Cervero,R.(2003).Roadexpansion,urbangrowth,andinducedtravel:Apath analysis. J.Am.Plan.Assoc. 69(2),145–163.doi:10.1080/01944360308976303
CouncilofEconomicAdvisors(CEA)(2017).DiscountingforPublicPolicy:Theory andrecentevidenceonthemeritsofupdatingthediscountrate. https:// obamawhitehouse.archives.gov/sites/default/ files/page/ files/201701_cea_discounting_ issue_brief.pdf.Accessed04/29/2023
DeGroot,R.S.,Alkemade,R.,Braat,L.,Hein,L.,andWillemen,L.(2010).Challenges inintegratingtheconceptofecosystemservicesandvaluesinlandscapeplanning, managementanddecisionmaking. Ecol.Complex. 7(3),260–272.doi:10.1016/j. ecocom.2009.10.006
Díaz-Garayúa,J.R.,andGuilbe-López,C.J.(2020). “Confrontingstylesandscalesin PuertoRico:Comprehensiveversusparticipativeplanningunderacolonialestate, in Urbanandregionalplanninganddevelopment:20thcenturyformsand21stcentury transformations (Berlin,Germany:Springer),347–360.
Esri(2022a).Filltool. https://pro.arcgis.com/en/pro-app/latest/tool-reference/ spatial-analyst/fill.htm
Esri(2020).PRASAfacilitiesinPR. https://www.arcgis.com/home/item.html?id= c189dd9e74c54981afcac8f923b10f35#overview
Esri(2022b).USACensus2020redistrictingBlocks. https://www.arcgis.com/home/ item.html?id=b3642e91b49548f5af772394b0537681
Felipe-Lucia,M.R.,Guerrero,A.M.,Alexander,S.M.,Ashander,J.,Baggio,J.A., Barnes,M.L.,etal.(2021).Conceptualizingecosystemservicesusingsocial–ecological networks. TrendsEcol.Evol. 37,211–222.doi:10.1016/j.tree.2021.11.012
FEMA(2022b).Environmentalassessmentcarraízoreservoirdredging. https:// recovery.pr.gov/documents/PA-DR-4339-169882-CarraizoDredging-EA-Appendix-AEnglish-20220705.pdf
FEMA(2022a).FEMAapproves$88milliontodredgethecarraízoreservoir. https:// www.fema.gov/press-release/20221212/fema-approves-88-million-dredge-carraizoreservoir#:~:text=San%20Juan%2C%20P uerto%20Rico%20%E2%80%93The,to% 20dredge%20the%20Carra%C3%ADzo%20Reservoir
organizations,orthoseofthepublisher,theeditors,andthe reviewers.Anyproductthatmaybeevaluatedinthisarticle,or claimthatmaybemadebyitsmanufacturer,isnotguaranteedor endorsedbythepublisher.
Supplementarymaterial
TheSupplementaryMaterialforthisarticlecanbefoundonline at: https://www.frontiersin.org/articles/10.3389/fenvs.2023.1214037/ full#supplementary-material
Gellis,A.C.,Webb,R.M.,McIntyre,S.C.,andWolfe,W.J.(2006).Land-useeffects onerosion,sedimentyields,andreservoirsedimentation:AcasestudyintheLagoLoiza basin,PuertoRico. Phys.Geogr. 27(1),39–69.doi:10.2747/0272-3646.27.1.39
Grill,G.,Lehner,B.,Thieme,M.,Geenen,B.,Tickner,D.,Antonelli,F.,etal.(2019). Mappingtheworld’sfree-flowingrivers. Nature 569(7755),215–221.doi:10.1038/ s41586-019-1111-9
Guerra,CarlosA.,Maes,Joachim,Geijzendorffer,Ilse,andMetzger,MarcJ.(2016). AnassessmentofsoilerosionpreventionbyvegetationinMediterraneanEurope: Currenttrendsofecosystemserviceprovision. Ecol.Indic. 60,213–222.doi:10.1016/j. ecolind.2015.06.043
Hamel,P.,Chaplin-Kramer,R.,Sim,S.,andMueller,C.(2015).Anewapproachto modelingthesedimentretentionservice(InVEST3.0):CasestudyoftheCapeFear catchment,NorthCarolina,USA. Sci.TotalEnviron. 524,166–177.doi:10.1016/j. scitotenv.2015.04.027
Hamel,P.,Falinski,K.,Sharp,R.,Auerbach,D.A.,Sánchez-Canales,M.,and Dennedy-Frank,P.J.(2017).Sedimentdeliverymodelinginpractice:Comparing theeffectsofwatershedcharacteristicsanddataresolutionacrosshydroclimatic regions. Sci.TotalEnviron. 580,1381–1388.doi:10.1016/j.scitotenv.2016.12.103
Hesselbarth,M.H.K.,Sciaini,M.,With,K.A.,Wiegand,K.,andNowosad,J.(2019). Landscapemetrics:Anopen-sourceRtooltocalculatelandscapemetrics. Ecography 42, 1648–1657.doi:10.1111/ecog.04617
Howell,B.(1952).TheplanningsystemofPuertoRico. TownPlan.Rev. 23(3), 211–222.doi:10.3828/tpr.23.3.b7310885ll37p5n8
Hughes,K.S.,andSchulz,W.H.(2020). Mapdepictingsusceptibilitytolandslides triggeredbyintenserainfall,PuertoRico:U.S,”.Open-FileReport2020–1022(Reston, VA,USA:UnitedStatesGeologicalSurvey).
Larsen,M.C.(2012).Landslidesandsedimentbudgetsinfourwatershedsineastern PuertoRico. WaterQual.Landsc.Process.fourwatershedsEast.P.R. 1789,153–178. doi:10.3133/pp1789
Larsen,M.C.,andTorres-Sanchez,A.J.(1992).Landslidestriggeredbyhurricane hugoineasternPuertoRico,september1989. Caribb.J.Sci. 28(3-4),113–125.
Mitchell,M.G.,Suarez-Castro,A.F.,Martinez-Harms,M.,Maron,M.,McAlpine,C., Gaston,K.J.,etal.(2015).Reframinglandscapefragmentation’seffectsonecosystem services. TrendsEcol.Evol. 30(4),190–198.doi:10.1016/j.tree.2015.01.011
Molina,W.L.,Irizarry-Ortiz,M.,Santiago,M.,Pazmino-Hernandez,M.,and Kahlid,S.(2019). Estimatedpublic-supplywaterwithdrawalsanddomesticwater useinPuertoRico(ver.2.0,March2023) .Reston,VA,USA:UnitedStates GeologicalSurvey.
Molina-Rivera,W.L.,andIrizarry-Ortiz,M.M.(2021). “Estimatedwaterwithdrawals anduseinPuertoRico,2015:U.S,”.Open-FileReport2021–1060(Reston,VA,USA: UnitedStatesGeologicalSurvey).
Mullu,D.(2016).Areviewontheeffectofhabitatfragmentationonecosystem. J.Nat. Sci.Res. 6(15),1–15.
NationalOceanicandAtmosfericAdministration(NOAA)(2023).Biden-Harris Administrationrecommendsfundingof$34.4millionforprojectsinPuertoRicoto strengthenClimate-ReadyCoastsaspartofInvestinginAmericaagenda. https://www. noaa.gov/news-release/noaa-bil-investments-2023-puerto-rico
NationalOceanicandAtmosphericAdministration(NOAA)CoastalServicesCenter (2014b).Therainfall-runofferosivityfactor(R-factor)forPuertoRico. https://coast. noaa.gov/digitalcoast/tools/opennspect.html
NationalOceanicandAtmosphericAdministration(NOAA)OfficeforCoastal Management(2022).2010coastalchangeanalysisprogram(C-cap)30meterland coverofPuertoRico. https://www.fisheries.noaa.gov/inport/item/48300 NaturalCapitalProject(2022). InVEST3.13.User’sGuide.Stanford,CA, UnitedStates:StanfordUniversity.
Ortiz-Zayas,J.,Quinones,F.,andSilvanaPalacios,P.E.,(2004).Caracteristicasy CondiciondeLosEmbalsesPrincipalesenPuertoRico. DepartamentodeRecurcosNat. yAmbientales,Commonw.P.R.,191.
Picó,R.(1953).PuertoRico:Itsproblemsanditsprogramme. TownPlan.Rev. 24(2), 85.doi:10.3828/tpr.24.2.x728tt231935536k
Podolak,C.J.,andDoyle,M.W.(2015).Reservoirsedimentationandstoragecapacity intheUnitedStates:Managementneedsforthe21stcentury. J.HydraulicEng. 141(4), 02515001.doi:10.1061/(asce)hy.1943-7900.0000999
Poff,N.L.,andZimmerman,J.K.(2009).Ecologicalresponsestoaltered flowregimes: Aliteraturereviewtoinformthescienceandmanagementofenvironmental flows. Freshw.Biol. 55,194–205.doi:10.1111/j.1365-2427.2009.02272.x
Preston,BenjaminLee,Miro,MichelleE.,Brenner,Paul,Gilmore,ChristopherK., Raffensperger,JohnF.,Madrigano,Jaime,etal.(2020).Beyondrecovery:Transforming PuertoRico’swatersectorinthewakeofhurricanesIrmaandMaria.Homelandsecurity operationalanalysiscenteroperatedbytheRANDcorporation. https://www.rand.org/ pubs/research_reports/RR2608.html
PuertoRicoDepartamentofNaturalandEnvironmentalResources(PRDNER) (2008a).PlanIntergaldeRecursosdeAguaenPuertoRico. https://www.drna.pr. gov/historico/o fi cinas/saux/secretaria-auxiliar-de-plani fi cacion-integral/planagua/ plan-integral-de-recursos-de-agua-de-puerto-rico/plan-integral-de-recursos-de-aguade-puerto-rico-2008/resumen-ejecutivo/RESUMEN_EJECUTIVO_PIRA_2008.pdf
PuertoRicoAqueductandSewerAuthority(PRASA)(2021).Lacalidaddelagua potable:InformeAnual. https://www.acueductospr.com/en/web/guest/informes-sobrela-calidad-del-agua.Accessed04/19/2023
PuertoRicoAqueductandSewerAuthority(PRASA)(2022).MemorialExplicativo: PropuestadeRevisiondelaEstructuraTarifariadelaAutoridaddeAcueductosy AlcantarilladosdePuertoRico. https://docs.pr.gov/files/AAA/Portada/Documentos/ MemorialExplicativoTarifas2022v7FINAL.pdf
PuertoRicoAqueductandSewerAuthority(PRASA)(2023).NivelesdelosEmbalses Principales. https://www.acueductospr.com/niveles-de-los-embalses
PuertoRicoDepartmentofEnvironmentalandNaturalResources(PRDNER)(2016). Informesobrelasequíade2014-2016enPuertoRico. https://www.drna.pr.gov/wpcontent/uploads/2017/01/Informe-Sequia-2014-2016.compressed.pdf
PuertoRicoDepartmentofNaturalandEnvironmentalResources(PRDNER) (2008b).IntegralplanforwaterresourcesinPuertoRico. https://acrobat.adobe.com/ link/review?uri=urn:aaid:scds:US:2f9276af-7401-33bd-a308-4a1fdf05cb75
PuertoRicoPlanningBoard(JuntaPlanificacióndePR)(2022).Nuevoreglamento conjunto(borrador). https://jp.pr.gov/wp-content/uploads/2022/10/Nuevo-RCBorrador-10-26-22.pdf
PuertoRico(PR)Law241(1999).NewPuertoRicowildlifelaw. https://www.fao.org/ faolex/results/details/es/c/LEX-FAOC076935/
PuertoRico(PR)Law416(2004).PuertoRicoenvironmentalpolicylaw. https:// www.lexjuris.com/lexlex/leyes2004/lexl2004416.htm.Accessed02/15/2023
Quinones,F.(2022).RecursosdeAguadePuertoRico:EmbalsesPrincipalesde PuertoRico. https://www.recursosaguapuertorico.com/Embalses-Principales.html
Ramos-Scharrón,C.E.,andFigueroa-Sánchez,Y.(2017).Plot-farm-andwatershedscaleeffectsofcoffeecultivationinrunoffandsedimentproductioninwesternPuerto Rico. J.Environ.Manag. 202,126–136.doi:10.1016/j.jenvman.2017.07.020
Rauf,A.U.,andGhumman,A.R.(2018).Impactassessmentofrainfall-runoff simulationsonthe flowdurationcurveoftheupperIndusRiver acomparisonofdatadrivenandhydrologicmodels. Water 10(7),876.doi:10.3390/w10070876
Renard,K.,Foster,G.,Weesies,G.,McCool,D.,andYoder,D.(1997). Predictingsoil erosionbywater:Aguidetoconservationplanningwiththerevisedsoillossequation Maryland,MA,UnitedStates:U.S.DepartmentofAgriculture,AgriculturalResearch Service.
Sayles,J.S.,andBaggio,J.A.(2017).Social–ecologicalnetworkanalysisofscale mismatchesinestuarywatershedrestoration. Proc.Natl.Acad.Sci. 114(10),E1776E1785–E1785.doi:10.1073/pnas.1604405114
Sayles,J.S.,MancillaGarcia,M.,Hamilton,M.,Alexander,S.M.,Baggio,J.A., Fischer,A.P.,etal.(2019).Social-ecologicalnetworkanalysisforsustainabilitysciences: Asystematicreviewandinnovativeresearchagendaforthefuture. Environ.Res.Lett. 14 (9),093003.doi:10.1088/1748-9326/ab2619
Schleiss,AntonJ.,Franca,MárioJ.,Juez,Carmelo,andDeCesare,Giovanni(2016). Reservoirsedimentation. J.HydraulicRes. 54(6),595–614.doi:10.1080/00221686.2016. 1225320
Sharp,R.,Douglass,J.,Wolny,S.,Arkema,K.,Bernhardt,J.,Bierbower,W.,etal. (2020).InVEST3.12.0.User’sguide.Thenaturalcapitalproject. https://storage. googleapis.com/releases.naturalcapitalproject.org/invest-userguide/latest/index.html
Smith,A.,Yee,S.H.,Russell,M.,Awkerman,J.,andFisher,W.S.(2017).Linking ecosystemservicesupplytostakeholderconcernsonbothlandandsea:Anexample fromGuánicaBaywatershed,PuertoRico. Ecol.Indic. 74,371–383.doi:10.1016/j. ecolind.2016.11.036
Smith,C.,Williams,J.,Nejadhashemi,A.P.,Woznicki,S.,andLeatherman,J. (2013).Croplandmanagementversusdre dging:Aneconomicanalysisofreservoir sedimentmanagement. LakeReserv.Manag. 29(3),151 –164.doi:10.1080/ 10402381.2013.814184
Soler-López,L.R.(2010).U.S.Geologicalsurveyscientificinvestigationsmap3118, 1plate.availableat https://pubs.usgs.gov/sim/3118/
Soler-López,L.R.,Pérez-Blair,F.,andWebb,R.M.T.(1997). Sedimentationsurveyof LagoYahuecas,PuertoRico.Reston,VA,USA:UnitedStatesGeologicalSurvey, 98–4259.
Stone,R.P.,andHilborn,D.(2012).Universalsoillossequation(USLE)factsheet. MinistryAgric.FoodRuralAff.order,12–051.
Sude,B.,Nan,W.,Ji-Xi,G.,Chen,Z.,Jing,G.,andDriss,E.(2011).Newapproachfor evaluationofawatershedecosystemserviceforavoidingreservoirsedimentationandits economicvalue:AcasestudyfromertanreservoirinYalongRiver,China. Appl. Environ.SoilSci.,2011,doi:10.1155/2011/576947
UnitedStatesDepartmentofAgriculture(USDA)NaturalResourcesConservation Service(NRCS)SoilSurveyStaff(2021a).Griddednationalsoilsurveygeographic (gNATSGO)databaseforPuertoRico.Availableonlineat https://nrcs.app.box.com/v/ soils
UnitedStatesEnvironmentalProtectionAgency(USEPA)(2023).SDWISfederal reportsSearch. https://sdwis.epa.gov/ords/sfdw_pub/r/sfdw/sdwis_fed_reports_ public/200
UnitedStatesEnvironmentalProtectionAgency(2022).Standardsof performancefornew,reconstructed,andmodi fi edsourcesandemissions guidelinesforexistingsources:Oil andnaturalgassectorclimatereview. https://www.federalregister.gov/doc uments/2022/12/06/2022-24675/standardsof-performance-for-new-reconstructed-and-modi fi ed-sources-and-emissionsguidelines-for UnitedStatesGeologicalSurvey(USGS)(2013).Chapter3ofsectionA,federal standardsbook11,collectionanddelineationofspatialdatatechniquesandmethods 11–A3fourthedition. https://pubs.usgs.gov/tm/11/a3/pdf/tm11-a3_4ed.pdf
USCensus(2022).QuickfactsPuertoRico. https://www.census.gov/quickfacts/PR USGS(2016).ClimateofPuertoRico. https://www.usgs.gov/centers/cfwsc/science/ climate-puerto-rico
USGS(2017).Nationalhydrographydataset. https://nhd.usgs.gov/ USGS(2019).SedimentationsurveysinPuertoRico. https://www.usgs.gov/centers/ cfwsc/science/sedimentation-surveys-puerto-rico
USGS(2023).Waterdataforthenation. http://waterdata.usgs.gov/nwis/ USGS(2018).WateruseinPuertoRico. https://www.usgs.gov/centers/cfwsc/science/ water-use-puerto-rico#:~:text=T he%20population%20served%20by% 20public,population%20of%20about%20102%2C000%20residents
USG;SGAP(2022). ProtectedareasdatabaseoftheUnitedStates(PAD-US)3.0 Reston,VA,USA:UnitedStatesGeologicalSurvey.doi:10.5066/P9Q9LQ4B Wischmeier,W.H.,andSmith,D.D.(1978). Predictingrainfallerosionlosses:Aguide toconservationplanning(No.537).Washington,D.C.,USA:DepartmentofAgriculture, ScienceandEducationAdministration.
Yee,S.H.(2020).Contributionsofecosystemservicestohumanwell-beinginPuerto Rico. Sustainability 12(22),9625.doi:10.3390/su12229625
Yuan,Y.,Jiang,Y.,Taguas,E.V.,Mbonimpa,E.G.,andHu,W.(2015).Sedimentloss anditscauseinPuertoRicowatersheds. Soil 1(2),595–602.doi:10.5194/soil-1-5952015


