Due Date: Sunday, 10 February 2019
Guidance for Annual Reports
Dates Annual Report Represents: The 2018/2019 Annual Report
I. Award Reporting
Institution/Grantee: University of the Virgin Islands/ Richard S. Nemeth, PhD
Award Number: 2018-2019-003
Time period: 1 February 2018 to 31 January 2019
Award Title: Are the two largest Marine protected Areas in the United States Virgin Islands working?
Accomplishments and outcomes from this award:
The initial time schedule to initiate field work was planned for September 2018 through July 2019. However, delays by UVI in completing the sub-award agreement (received 26 September 2018) and generating an account number for this project (received 29 November 2018) has caused some delays in field work. However, despite these delays we did initiate some surveys and have made progress on the project.
The objectives were to compare several factors inside and outside two large marine reserves in the US Virgin Islands: These MPA’s are the Marine Conservation District (MCD) south of St. Thomas and Virgin Islands Coral Reef National Monument (VICRNM) south of St. John: the four objectives include: 1) Determine if local MPAs are improving fish species abundance and diversity; 2) Obtain baseline data for top predator and key herbivore populations; 3) Evaluate extent of invasive lionfish in MPA’s and potential natural control of this species; 4) Document unknown fish spawning aggregations within mesophotic reef environments.
Objectives 1, 2 and 3)
i) Research permits have been received from NOAA Fisheries and are pending from USVI Department of Planning and Natural Resources and National Park Service.
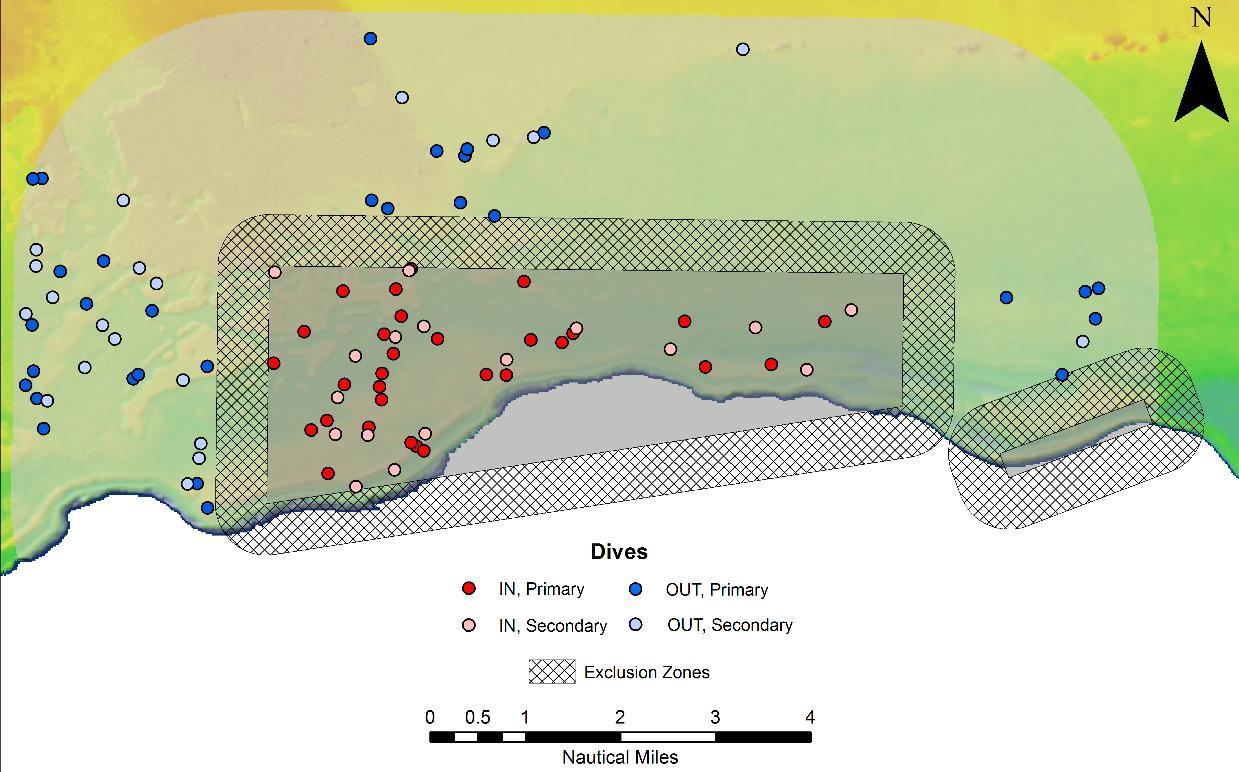
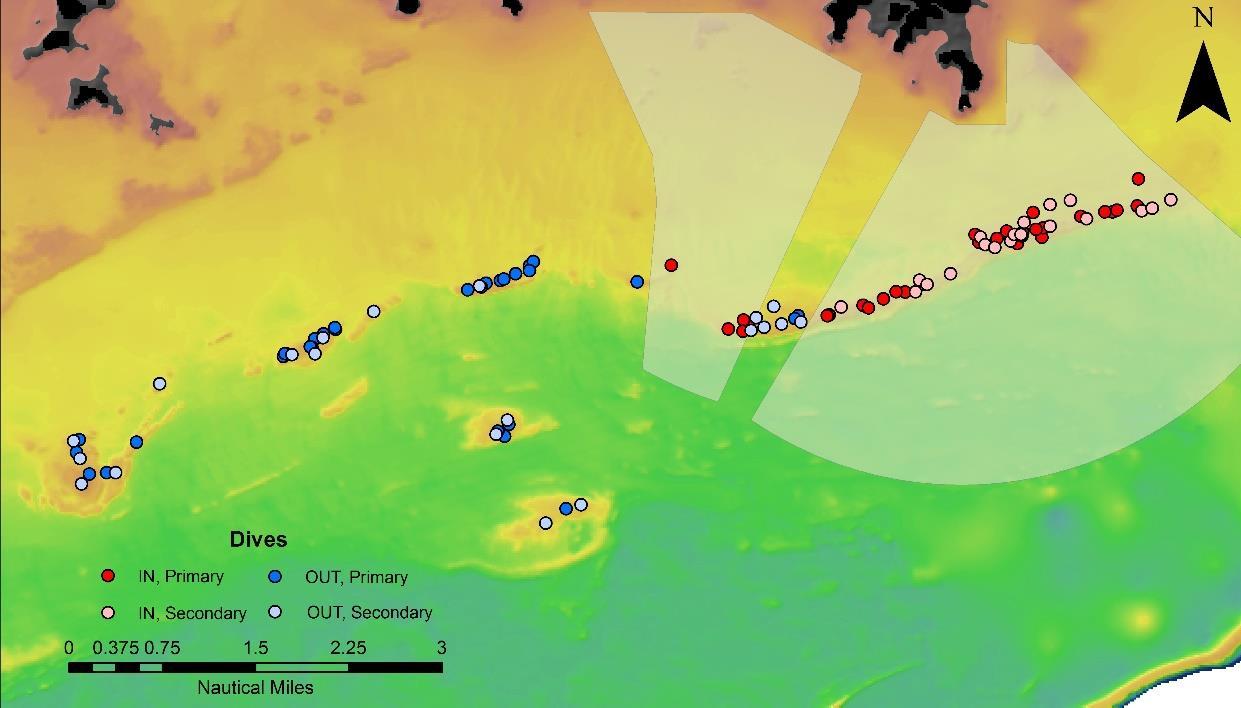
ii) Site selection utilized a stratified random approach, where strata consisted of targeted coral reef habitats, for selecting previously sampled historical sites in the MCD and new sites outside the MCD. We additionally randomly selected previously sampled historical sites inside and outside of the VICRNM. The sample size for this project targeted 20 sites both inside and outside each of these two MPA’s, but a total of 50 sites per location were identified in the event some sites are not suitable (Figures 1, 2 and 3). Initial comparison of MCD and VICRNM showed that depth ranges are comparable inside and outside the two MPA’s, but that the MCD sites were about 15m deeper than sites within VICRNM (Table 1). Percent coral cover inside the MCD averaged 25.6% and ranged from about 5% to 50% (Table 1). Average percent coral cover outside the VICRNM was four times higher than inside (Table 1), and ranged from 0% to 80% and 50%, respectively.
iii) Between August and December 2018 we have completed 23 sites within the VICRNM and 5 sites within MCD. More sites have been done within VICRNM because we took advantage of good weather days to travel the further distance to VICRNM. Poor weather during January and February has prohibited conducting anymore field work so far this year.
Table 1. Average depth (m) and percent coral cover of sample sites inside and outside two Marine Protected Areas (MPA), the Marine Conservation District (MCD) and the Virgin Islands Coral Reef National Monument (VICRNM). Sites outside the MCD have not been surveyed so % coral cover is unknown at this time.

1. Location of 50 randomly selected points inside (red and pink) and outside (blue) of the Red
Hind Bank Marine Conservation District (MCD) and the Virgin Islands Coral Reef National Monument (VICRNM). The MCD includes a 100m buffer exclusion zone to eliminate potential edge effects. Due to potential bias from the Grammanik Bank (GB) seasonal fishery closure a 100m buffer was also included.

2. Close up of 50 randomly selected points inside (red and pink) and outside (blue) of the Red Hind Bank Marine Conservation District. See figure 1 for details

Figure 3. Close up of 50 randomly selected points inside (red and pink) and outside (blue) of the Virgin Islands Coral Reef National Monument. See figure 1 for details
Objective 4) This objective was intended to start in year 2, however some progress has already been made. On June 3 and 4, 2018, scooter surveys were conducted on the Grammanik Bank to search for a potential mutton snapper (Lutjanus analis) spawning aggregation site. The area searched was selected based on preliminary acoustic telemetry data showing that a mutton snapper tagged in Brewers Bay, St. Thomas had been detected at the Grammanik Bank during the mutton snapper spawning season (April to July) and appropriate lunar cycle (the week after the full moon). June 3 and 4 represented 5 and 6 days after the full moon (dafm). During our surveys we encountered approximately 600 mutton snapper in a large aggregation on both days. We repeated these surveys July 2 (4 dafm) but only saw a few mutton snapper, possibly due to low visibility. The work on mutton snapper acoustic telemetry was originally funded by NOAA MARFIN and NSF VIEPSCoR.
On January 18 a team of divers conducted scooter surveys at four potential red hind spawning aggregation sites near the VICRNM on a mid-shelf reef and at several sites on the shelf edge reefs near the Grammanik Bank (Figure 4). These sites were selected based on data from the USVI fish and Wildlife SeaMap surveys and from a NOAA Saltonstall-Kennedy grant that used a wave glider mounted with hydrophone to identify potential spawning sites based on grouper vocalizations. Of the sites we surveyed, only one proved promising since about 20 red hind were seen and were showing signs of territorial defense similar to males on spawning grounds. This site was on the northern boundary of the Grammanik Bank seasonal closed area.

