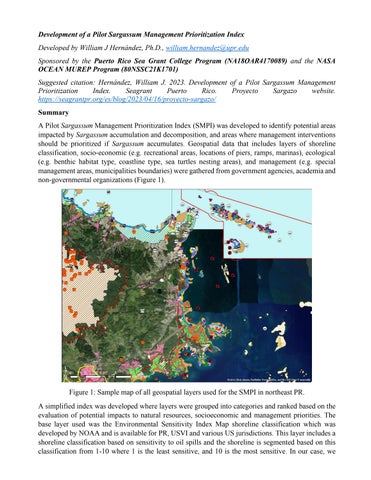
Development of a Pilot Sargassum Management Prioritization Index Developed by William J Hernández, Ph.D., william.hernandez@upr.edu Sponsored by the Puerto Rico Sea Grant College Program (NA18OAR4170089) and the NASA OCEAN MUREP Program (80NSSC21K1701) Suggested citation: Hernández, William J. 2023. Development of a Pilot Sargassum Management Prioritization Index. Seagrant Puerto Rico. Proyecto Sargazo website. https://seagrantpr.org/es/blog/2023/04/16/proyecto-sargazo/ Summary A Pilot Sargassum Management Prioritization Index (SMPI) was developed to identify potential areas impacted by Sargassum accumulation and decomposition, and areas where management interventions should be prioritized if Sargassum accumulates. Geospatial data that includes layers of shoreline classification, socio-economic (e.g. recreational areas, locations of piers, ramps, marinas), ecological (e.g. benthic habitat type, coastline type, sea turtles nesting areas), and management (e.g. special management areas, municipalities boundaries) were gathered from government agencies, academia and non-governmental organizations (Figure 1).
Figure 1: Sample map of all geospatial layers used for the SMPI in northeast PR. A simplified index was developed where layers were grouped into categories and ranked based on the evaluation of potential impacts to natural resources, socioeconomic and management priorities. The base layer used was the Environmental Sensitivity Index Map shoreline classification which was developed by NOAA and is available for PR, USVI and various US jurisdictions. This layer includes a shoreline classification based on sensitivity to oil spills and the shoreline is segmented based on this classification from 1-10 where 1 is the least sensitive, and 10 is the most sensitive. In our case, we