remote sensing
Article

Article
MeiYu*andQiongGao
Citation: Yu,M.;Gao,Q.Assessment ofSurfaceInundationMonitoringand DriversafterMajorStormsina TropicalIsland. RemoteSens. 2024, 16, 503. https://doi.org/10.3390/ rs16030503
AcademicEditor:YuriyKuleshov
Received:9December2023
Revised:16January2024
Accepted:23January2024
Published:28January2024

Copyright: © 2024bytheauthors. LicenseeMDPI,Basel,Switzerland. Thisarticleisanopenaccessarticle distributedunderthetermsand conditionsoftheCreativeCommons Attribution(CCBY)license(https:// creativecommons.org/licenses/by/ 4.0/).
DepartmentofEnvironmentalSciences,UniversityofPuertoRico,RioPiedras,SanJuan,PR00925,USA * Correspondence:meiyu@ites.upr.edu
Abstract: Extremeclimateeventssuchasstormsandseveredroughtsarebecomingmorefrequent underthewarmingclimate.Inthetropics,excessrainfallcarriedbyhurricanescausesmassive floodingandthreatensecosystemsandhumansociety.Weassessedrecentmajorfloodingsonthe tropicalislandofPuertoRicoafterHurricaneMariain2017andHurricaneFionain2022,bothof whichcostbillionsofdollarsdamagestotheisland.WeanalyzedtheSentinel-1syntheticaperture radar(SAR)imagesrightafterthehurricanesanddetectedsurfaceinundationextentbyapplying arandomforestclassifier.Wefurtherexploredhurricanerainfallpatterns,flowaccumulation,and otherpossibledriversofsurfaceinundationatwatershedscaleanddiscussedthelimitations.An independentvalidationdatasetonfloodingderivedfromhigh-resolutionaerialimagesindicated ahighclassificationaccuracywithaKappastatisticof0.83.Thetotaldetectedsurfaceinundation amountedto10,307haafterHurricaneMariaand7949haafterHurricaneFionaforareaswithSAR imagesavailable.Theinundationpatternsaredifferentiatedbythehurricanepathsandassociated rainfallpatterns.WefoundthatflowaccumulationestimatedfromtheinterpolatedFionarainfall highlycorrelatedwiththeground-observedstreamdischarges,withaPearson’scorrelationcoefficient of0.98.Thedetectedinundationextentwasfoundtodependstronglyonhurricanerainfalland topographyinlowlandswithinwatersheds.Normalclimate,whichconnectstomeansoilmoisture, alsocontributedtothedifferentiatedfloodingextentamongwatersheds.Thehighertheaccumulated Fionarainandthelowerthemeanelevationintheflatlowlands,thelargerthedetectedsurface floodingextentatthewatershedscale.Additionally,thedriertheclimate,whichmightindicate driersoils,thesmallerthesurfacefloodingareas.Theapproachusedinthisstudyislimitedby thepenetrationcapabilityofC-bandSAR;furtherapplicationofL-bandimageswouldexpandthe detectiontofloodingunderdensevegetation.Detectingfloodingbyapplyingmachinelearning techniquestoSARsatelliteimagesprovidesaneffective,efficient,andreliableapproachtoflood assessmentincoastalregionsonalargescale,hencehelpingtoguideemergencyresponsesandpolicy makingandtomitigatefloodingdisasters.
Keywords: coastalinundation;SAR;machinelearning;discharges;majorstorms;Bayesianregressionkriging
1.Introduction
Extremeclimateeventsarebecomingmorefrequentandsevereunderthewarming climate[1],andclimatemodelshavepredictedincreasedextremeElNiñoandextremeLa Niñaevents[2,3].Theincreaseintropicalcyclones,bothinfrequencyandinintensity,and thelengthydroughts,togetherwithheatwaves,areconnectedtolarge-scalemangrove mortalityglobally[4,5].Coastalregionssupportthehighestpopulationdensity,yetthey aremorepronethaninlandareastodamagebytropicalstorms,asthelowlandsinthe coastaremorelikelytobeinundated[6,7].Incoastalregions,destructivetropicalcyclones havebroughtdisastrousdamagetoecosystemsandthreateneddensecoastalcommunities througheventssuchaswidespreadfloodsresultingfromheavyrainfall,coastalstorm surge,andrisingsealevel[8–10].Theexacerbationofmorefrequentandintensetropical
cyclonesoncoastalcompoundfloodingraisesgreatconcernsforfloodingmonitoringand rapidresponses[11,12].
Hydrodynamicmodelingandremotesensingarethemaintoolstoassessandmonitor coastalflooding[13,14].Recentadvancesinremotesensinghavegreatlyimprovedflooding monitoringandassessmentinaccuracy,spatiotemporalresolution,andtiming[15,16].More frequentandopenhigh-resolutionimagessuchasSentinelandLandsatimages[17–19] makeitpossibletomonitorsurfaceinundationatgreaterspatialandtemporalresolutions. Comparedtoopticalsensors[14],thecapabilityofcloudpenetrationbysyntheticaperture radar(SAR)makesall-weathermonitoringpossible,thusgreatlyenhancingtheapplications ofSARindetectingsurfaceinundation[16,20].Furthermore,cloudcomputationplatforms suchasGoogleEarthEngine(GEE)[21]significantlyimprovetheefficiency,effectiveness, andtimelinessofsurfaceinundationmonitoringandassessment.
Inundatedpixelsareusuallydetectedfromremotesensingimagesbylocalorglobal thresholdofsignalsortheirstatistics[16,22],changedetectionbetweenfloodingand non-floodingperiods[23–26],andsupervisedorunsupervisedclassification[9,20].Due tolowsignalsfromthewatersurface,globalandlocalthresholdmethodsareeffective, efficient,andwidelyappliedtodetectwaterpixelsbyexamininghistogramsofsignals fromwaterandnon-watersurfaces[22].Comparedtoasimplebackscatterthreshold fromoneimage,timeseriesofmultitemporalimageshelpimprovetheaccuracyofwater detectionbycomparingthesignalagainsthistoricalZ-scoresduringreferenceperiods[16]. Machinelearningtechniquesarealsoappliedtoclassifyfloodingareasinrapidflood assessment[20,27].Tofullyautomatethedetectionoffloodingareas,Huangetal.used existingdatasetstoselecttrainingsamplesandappliedrandomforestsforsupervised classification[27].Unsupervisedclassificationusingdeeplearningmethodssuchasconvolutionalneuralnetwork(CNN)hasalsobeenappliedtoautomaticfloodingmappingwith asegmentationalgorithm[20].
Tounderstandmechanismsofsurfaceinundations,hydrodynamicmodelsandstatisticalmodelsweredevelopedtolinkthesurfaceinundationextentand/ordepthto potentialdriverssuchasstreamdischarges,rainfall,topography,etc.[15,28,29].MODISdetectedfloodingwasintegratedwithafloodroutingmodelandawaterbalancemodel, andriverflowsappearedasamaindrivertoflooding[28].Inanotherstudy,thedecadal MODIS-detectedpeakfloodingareasexhibitedastrongcorrelation(R2 of0.93)withgroundobservedriverflows[29].However,comprehensiveexplorationsoftherolesofwatershed stormrainfall,discharges,topography,andclimatesettinginsurfaceinundationarestill greatlyneededtounderstandhydrodynamicwatershedresponsestostormsinthetropics andtoplanforrapidresponsetofloodinghazard.
Inthispaper,weassessedthefloodingextentonthetropicalislandofPuertoRicoafter twohurricanesusingSARimagesandmachinelearningclassification.Wethenexplored therolesofstormrainfallandtheassociatedstreamdischarges,topography,andclimate settinginsurfaceinundation.Theresultswillfurtherourunderstandingoftheinundation mechanismsinthetropicsandinformemergencyresponsestohelpmitigatethedamage fromcoastalstorms.
2.Methods
2.1.StudyAreas
ThetropicalislandofPuertoRico,centeredat18◦15′N,66◦30′W,islocatedbetween theCaribbeanSeaandthemiddleNorthAtlanticOcean,anditispronetodisturbancesby tropicalstorms[30].Thelandareaamountstoalmost9000km2 with180kmfromeastto westand65kmfromnorthtosouth(Figure 1).Theprevailingeasterlytradewindbrings largeamountsofrainfalltothewindwardcentralmountains,e.g.,morethan4000mmin annualrainfallinrainforests,andthusresultsinlargealluvialplainsonthenortherncoast, whiletherainshadowleadstolessthan1000mmannualrainfallinsoutherndryforests.
mm in annual rainfall in rainforests, and thus results in large alluvial plains on the northern coast, while the rain shadow leads to less than 1000 mm annual rainfall in southern dry forests.
Figure 1. Topography and land cover in Puerto Rico. Hurricane paths of Maria (2017) and Fiona (2022) shown in red and blue lines, respectively. Created in ArcGIS Pro 3.2 (ESRI, Redlands, CA, USA).
Figure1. TopographyandlandcoverinPuertoRico.HurricanepathsofMaria(2017)andFiona(2022) showninredandbluelines,respectively.CreatedinArcGISPro3.2(ESRI,Redlands,CA,USA).
Recently,HurricaneMariaandHurricaneFionamadelandfallin2017and2022, respectively.HurricaneMariabroughttorrentialrainfallanddevastatinggustywindsto theislandon20September2017.Thehigh-endcategory-fourhurricanemadelandfallon thesoutheastoftheislandwithasustainingwindof249kmh 1 andtraversedtheisland fromthesoutheasttothenorthwest(Figure 1).Hurricanerainfallwasobservedashigh as965mm(38inches),andanestimationof1.8–2.7m(6–9feet)ofinundationalongthe eastcoastwasreportedduetostormsurgesandtides[31].Catastrophicfloodingandflash floodingoccurredduringandafterthestorm.In2022,HurricaneFiona,categoryone,made landfallonthesouthwesterncorneroftheislandon18Septemberwithasustainingwind speedof139kmh 1 (Figure 1).Thestormsurgeinundationwasestimatedtobe0.3–0.9m (1–3feet)[32].AlthoughthewindwasmuchlessintensethanthatofMaria,Fionabrought heavyrainstotheisland,especiallythesouthernandeasternparts.Thehigheststorm rainfallof823mm(32.4inches)wasobservednearPonceinthesouth.Thus,someriver gauges,e.g.,thoseinRioGrandedeLoizaandRioGrandedeManati,werereportedto crestabovemajorfloods[32].Flashfloodsandwidespreadriverfloodingwereobserved acrosstheisland.WhileHurricaneMariawasrecordedasthecostliesthurricaneinPuerto Ricowith$89.3billionindamage,HurricaneFionawaslistedasthethirdcostliestonewith adamageof$2.5billion[33].
Recently, Hurricane Maria and Hurricane Fiona made landfall in 2017 and 2022, respectively. Hurricane Maria brought torrential rainfall and devastating gusty winds to the island on 20 September 2017. The high-end category-four hurricane made landfall on the southeast of the island with a sustaining wind of 249 km h 1 and traversed the island from the southeast to the northwest (Figure 1). Hurricane rainfall was observed as high as 965 mm (38 inches), and an estimation of 1.8–2.7 m (6–9 feet) of inundation along the east coast was reported due to storm surges and tides [31]. Catastrophic flooding and flash flooding occurred during and after the storm. In 2022, Hurricane Fiona, category one, made landfall on the southwestern corner of the island on 18 September with a sustaining wind speed of 139 km h 1 (Figure 1). The storm surge inundation was estimated to be 0.3–0.9 m (1–3 feet) [32]. Although the wind was much less intense than that of Maria, Fiona brought heavy rains to the island, especially the southern and eastern parts. The highest storm rainfall of 823 mm (32.4 inches) was observed near Ponce in the south. Thus, some river gauges, e.g., those in Rio Grande de Loiza and Rio Grande de Manati, were reported to crest above major floods [32]. Flash floods and widespread river flooding were observed across the island. While Hurricane Maria was recorded as the costliest hurricane in Puerto Rico with $89.3 billion in damage, Hurricane Fiona was listed as the third costliest one with a damage of $2.5 billion [33].
WeusedtheGoogleEarthEngine(GEE)[21]platformtopreprocessthesatellite imagesandfurtherdetectthesurfaceinundationextent.TheSentinel-1syntheticapertureradar(SAR)images[19]takenaroundtwohurricanesandanothertwobigrainfall eventsinlateJuly2020andearlyNovember2022wereused.Thefloodingimagesused werethosetakenonthenextdayafterthehurricanesorthebigrainfalleventsaccordingtotheavailableSARimages.Foreacheventthereferenceimagesusedarethose takeninthemonthbeforeorafterhavingthesamedescendingorascendingorbit.These
We used the Google Earth Engine (GEE) [21] platform to preprocess the satellite images and further detect the surface inundation extent. The Sentinel-1 synthetic aperture radar (SAR) images [19] taken around two hurricanes and another two big rainfall events in late July 2020 and early November 2022 were used. The flooding images used were those taken on the next day after the hurricanes or the big rainfall events according to the
imagesarearchivedbyGEEandwerepreprocessedforthermalnoiseremoval,radiometriccalibration,andterraincorrectiontoalevel-1groundrangedetected(GRD)format (sentinel.esa.int/web/sentinel/toolboxes/sentinel-1).Backscatterintensitieswereconvertedtoabackscattercoefficient(σ◦)indecibels(dB)byGEE.Thevolumemodelofan angle-basedradiometricslopecorrection,bymeansofahigh-resolutiondigitalelevation model(DEM,10m)fortheisland,wasfurtherappliedtoimprovetheimages[34,35]. Theresultedimagescontainedthebackscatter γ0 indBforVV(verticaltransmittingwith verticalreceiving)andVH(verticaltransmittingwithhorizontalreceiving)bandsandthe layover/shadowmasks[35].
Wethenappliedarandomforestclassifier[36]toidentifysurfaceinundationsforeach floodingevent[9].Randomforestclassification/regressionisbasedontheCART(classificationandregressiontree)algorithm,whichclassifiesobjectsorregressesadependent variableoverattributes/covariatesbybuildingahierarchicaldecisiontree.CARTworks well,butitdependsheavilyontheselectionofthetrainingdatasetandiseasilyoverfitted withthetrainingdataset.Therandomforestalgorithmisdesignedtobuildmultipletrees bybootstrappingintothetrainingdataset.Thefinaldecisionofclassificationisbasedon themajorityofvotesfromalltreessothattheconsequenceofoverfitofanindividualtree isavoided.Foreachfloodingevent,wecreated200trees.
TheindependentvariablesoftheclassificationincludedthebandsofVV,VH,theratio ofVVandVH,normalizeddifferencefloodingindices(NDFI)[24]basedonVVandVH bandsrespectively,andthehigh-resolutionDEMandderivedslope.Backscattervaluesin dBwereconvertedtonaturalvaluesbeforecalculatingtheindices.Areferencecondition wasmarkedbythemedianofsignalsinthemonthbeforeorafterthefloodingevent.The NDFIvalueswerecalculatedaccordingtothefollowingequations:
where VV and VH arethesignalsfromthefloodingimages,and VVref and VHref arethose fromthereferencecondition.
Samplesofflooding,permanentwater,mangroves,herbaceouscover,forests,and urbancoverwerecreatedwithgroundtruthdata,identifiedfromhigh-resolutionaerial photographs(EnvironmentalResponseManagementApplication—Caribbean,ERMAby NOAAandEPA),imagesduringfloodingandreferenceperiods,andahigh-resolution (2m)C-CAPland-covermapfromNOAA[37].Foreachfloodingevent,70%ofsamples wereusedfortrainingtheclassifier,withtheremainingforvalidation.ForHurricane Maria,theclassifierwasfurtherrigorouslyvalidatedagainstaseparate,independent samplederivedfromavailableNOAAaerialphotos(0.15mresolution)takenrightafterthe event[9].Permanentwaterareaswerefurthercalibratedusingthewaterbodiesdelineated intheUSGSNationalMap,i.e.,theareasclassifiedaslake,pondorreservoirinthenational hydrographydatasets(NHDwaterbody, https://apps.nationalmap.gov/downloader/#/ accessedon10January2024).Theaccuracyoftheclassificationwasassessedwiththe overallaccuracy,produceranduseraccuracies,andtheKappastatisticderivedfroma confusionmatrix.Theoverallaccuracy A andtheKappastatistic K werecalculatedas thefollowing:
where n isthenumberofclasses, Cii isthenumberofsamplescorrectlyclassifiedinthe class i, C isthenumberoftotalsamples,and Ci and C i arethetotalnumberofsamples classifiedasclass i andlabeledasclass i,respectively.Comparedtotheoverallobserved accuracy,theKappastatisticfurtherconsidersacorrectclassificationfromrandomchance. Wedistributedthesurfaceinundationareastoeachcoastalwatershedusingthe watershedboundary(WBDHU10)delineatedinthenationalhydrographydatasets.To exploretherolesoftopographyinsurfaceinundation,wefurtheranalyzedtheprofilesof elevationaswellaslandcoverwithinthedetectedinundationextentbasedontheDEM andtheNOAAC-CAPland-covermap[37].
Tofurtherunderstandthedriversofsurfaceinundation,weanalyzedthehurricane rainfallpatternandthecorrespondingstreamdischargesobservedduringthehurricane events.ManyraingaugesweredamagedbythefiercewindofHurricaneMaria,andrecords wereincomplete;thus,wechosetherelativelycompleterainfallrecordsfromHurricane Fionatoconductthisanalysis.Cumulativehurricanerainfallfromtheweatherstationsof NOAA(https://www.ncei.noaa.gov/cdo-web/ accessedon21September2023)during the3-dayperiodpriortothatshowninthefloodingmapwasobtainedandinterpolated withtheBayesianregressionkrigingmethod(GeostatisticalAnalystModuleofArcGISPro, version3.0,ESRI,Redlands,CA,USA).TheDEMandthedistancefromthehurricanepath wereincorporatedintotheregressionascovariablestoaddresstheirimportantrolesin rainfalldistribution[38].Asstreamdischargeisakeysourceoffloodwater,weobtained streamdischargeincorrespondingwatershedsduringthesameperiodforeachUSGS watergauge(https://waterwatch.usgs.gov/ accessedon10January2024).
AfterremovingsinksfromtheDEM,wecomputedtheflowaccumulationusingthe Hydrologytoolsetforsurfacewater(ArcGISPro,version3.0,ESRI,Redlands,CA,USA). Theaboveinterpolatedrainfallwasusedastheweightduringthecalculationtocountthe effectsofthespatialheterogeneouspatternofrainfallonflowaccumulation.Theestimated flowaccumulationswerethencomparedtotheground-observedstreamdischargesto analyzetheirrelationshipsusingPearson’scorrelationcoefficient.Thecorrelationcoefficient wascalculatedas r =
,where xi and yi arethestreamdischarge observedandtheflowaccumulationestimatedatthecorrespondinggauge,respectively, withthemeanas x and y.Consideringtheheavyrainfallinashorttime,thetimingofthe wetseason,andthecloudyweather,weassumedthatthesurfacestreamdischargeswere thedominantcomponentcomparedtootherfluxessuchasrechargingsoils/groundwater, evapotranspiration,andcanopyinterception.
Finally,weexploredthepotentialdriversofsurfaceinundationincoastalwatersheds. Weassumedthathurricanerainfall;topography,especiallythatoflowlands;andsoil moisturestatuswereimportantindeterminingsurfaceinundation.Wethuscalculatedthe hurricanerainfallaccumulationineachwatershedbysumminguptheinterpolatedrainfall. Toquantifytheeffectoftopographyinlowlands,wefirstchoseanelevationthreshold correspondingtothe70thpercentileofelevationofthedetectedinundationpixelsand defined flatlowlands asthoseareaswithelevation ≤ theelevationthresholdand slope ≤ 5◦ Then,themeanelevationofflatlowlandswascalculatedforeachwatershedasatopography index.Toincorporatethesharpmoisturegradientfromthenorthtothesouthoftheisland, weassumedthatthelong-termmeanannualrainfallhighlycorrelatedwithsoilmoisture andcouldbeasubstituteformoistureindex.Thus,weinterpolatedthe30-yearnormal annualrainfallfromtheNOAAweatherstation[38]andcalculatedthewatershedmean ofnormalannualrainfall.Weexploredtherelationshipbetweenthedetectedsurface inundationextentandthecovariates,includingthewatershedaccumulatedrainfall,the watershedtopographyindex,andthelong-termnormalrainfall,byregressionusing R4.2[39].
detected surface inundation extent and the covariates, including the watershed accumulated rainfall, the watershed topography index, and the long-term normal rainfall, by regression using R 4.2 [39].
3.1. Detection of Surface Inundation Extent
3.1.DetectionofSurfaceInundationExtent
The Sentinel-1 SAR images clearly showed low backscatter signals during flooding when compared to those in the reference period. The image from 19 September 2022 (Figure 2) showed a mean ± std of −14.3 ± 3.3 and −22.3 ± 2.9 for VV and VH, respectively, for flooding pixels, in comparison to −9.5 ± 2.5 and −15.9 ± 2.7, respectively, for them during the reference period.
TheSentinel-1SARimagesclearlyshowedlowbackscattersignalsduringflooding whencomparedtothoseinthereferenceperiod.Theimagefrom19September2022 (Figure 2)showedamean ± stdof 14.3 ± 3.3and 22.3 ± 2.9forVVandVH,respectively, forfloodingpixels,incomparisonto 9.5 ± 2.5and 15.9 ± 2.7,respectively,forthem duringthereferenceperiod.
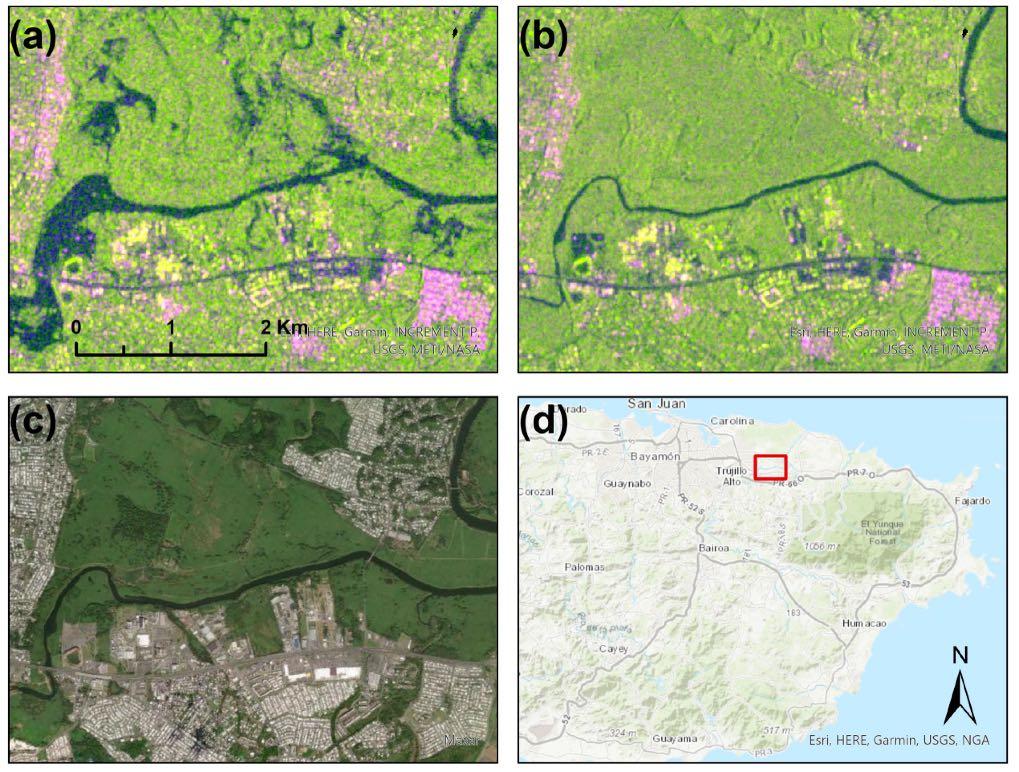
Figure 2. RGB composition of VV, VH, and their ratio from Sentinel-1 SAR on 19 September 2022 after Hurricane Fiona (a) and in the reference period of August 2022 (b). Dark blue represents water with low backscattering. High-resolution Maxar image from 8 November 2022 (c) and the location of the sample area (the red frame) in northeastern Puerto Rico (d). Created in ArcGIS Pro 3.2 (ESRI, Redlands, CA, USA).
Figure2. RGBcompositionofVV,VH,andtheirratiofromSentinel-1SARon19September2022 afterHurricaneFiona(a)andinthereferenceperiodofAugust2022(b).Darkbluerepresentswater withlowbackscattering.High-resolutionMaxarimagefrom8November2022(c)andthelocation ofthesamplearea(theredframe)innortheasternPuertoRico(d).CreatedinArcGISPro3.2(ESRI, Redlands,CA,USA).
Thevalidationofinundationclassificationagainsttheindependentdataset,derived fromtheNOAAaerialphotos(0.15mresolution)rightafterHurricaneMaria,showedan overallaccuracyof0.86andaKappastatisticof0.83.Weadjustedtheparameterofthe volumecorrectionbufferintheradiometricslopecorrection[35],whichcontributedtoan improvedclassificationaccuracycomparedtothatofapreviousapplication[9].Thelimited canopypenetrationcapabilityofC-SARmadeitdifficulttodetectfloodsunderdense vegetation.Bothuserandproduceraccuraciesforinundation(withoutdensevegetation cover)were1,aswellasthoseforpermanentwater.Theuserandproduceraccuracies are78%and85%formangroves,87%and83%forherbaceouscover,45%and64%for uplandforests,and100%and75%forurbancovers,respectively.Theaccuracyfordetecting
The validation of inundation classification against the independent dataset, derived from the NOAA aerial photos (0.15 m resolution) right after Hurricane Maria, showed an overall accuracy of 0.86 and a Kappa statistic of 0.83. We adjusted the parameter of the volume correction buffer in the radiometric slope correction [35], which contributed to an improved classification accuracy compared to that of a previous application [9]. The limited canopy penetration capability of C-SAR made it difficult to detect floods under dense vegetation. Both user and producer accuracies for inundation (without dense vegetation cover) were 1, as well as those for permanent water. The user and producer accuracies are 78% and 85% for mangroves, 87% and 83% for herbaceous cover, 45% and 64% for upland forests, and 100% and 75% for urban covers, respectively. The accuracy for detecting surface flooding pixels was high for each flooding event studied (Appendix A Classification Accuracies for Surface Inundation).
surfacefloodingpixelswashighforeachfloodingeventstudied(Appendix A Classification AccuraciesforSurfaceInundation).
ThedetectedsurfaceinundationextentafterHurricaneMariain2017amountedto 10,307ha,whichwasthegreatest,followedby7949haafterHurricaneFionain2022.The detectedinundationsweremuchlesson6November2022(2338ha)andon31July2020 (2205ha).Theimagecoveragesonthesedateswerethesame(Appendix A).Additionally, thespatialpatternoftheinundationwasdifferentbetweenHurricaneMariaandHurricane Fiona(Figures 3, 4 and A1).AlthoughsomewatershedssuchastheCanoTiburonesCoastal watershed,theRioCibucowatershed,andtheRioCoamotoRioSecowatershedshowed moreinundationareasduringMariathanduringFiona;thewatershedsofRioGrandede Manati,RioMaunabotoRioHumacao,andRioGrandedeLoizaexhibitedmoreinundated areasduringFionaduetothedifferenceinthehurricanepathandassociatedrainfall patterns(Figure 4 andrainfallinterpolationinthefollowingsection).
The detected surface inundation extent after Hurricane Maria in 2017 amounted to 10,307 ha, which was the greatest, followed by 7949 ha after Hurricane Fiona in 2022. The detected inundations were much less on 6 November 2022 (2338 ha) and on 31 July 2020 (2205 ha). The image coverages on these dates were the same (Appendix A). Additionally, the spatial pattern of the inundation was different between Hurricane Maria and Hurricane Fiona (Figures 3, A1 and 4). Although some watersheds such as the Cano Tiburones Coastal watershed, the Rio Cibuco watershed, and the Rio Coamo to Rio Seco watershed showed more inundation areas during Maria than during Fiona; the watersheds of Rio Grande de Manati, Rio Maunabo to Rio Humacao, and Rio Grande de Loiza exhibited more inundated areas during Fiona due to the difference in the hurricane path and associated rainfall patterns (Figure 4 and rainfall interpolation in the following section).
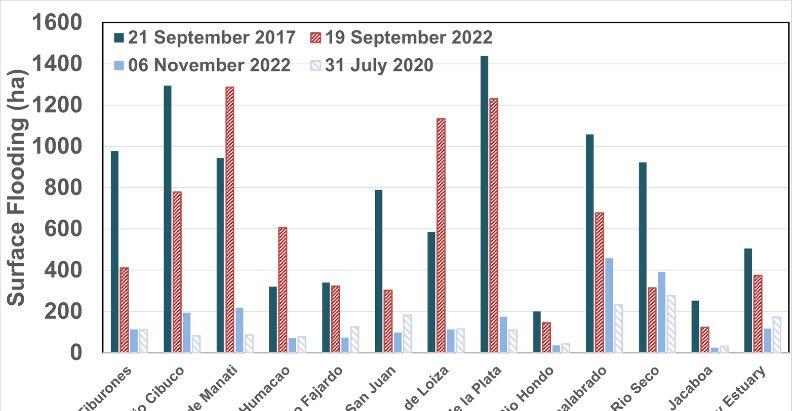
Figure3. Surfaceinundationareasdetectedalongcoastalwatersheds.Theeventson21September21 2017and19September2022correspondtothefloodingafterHurricaneMaria(20September2017) andHurricaneFiona(18September2022),respectively.
Figure 3. Surface inundation areas detected along coastal watersheds. The events on 21 September 21 2017 and 19 September 2022 correspond to the flooding after Hurricane Maria (20 September 2017) and Hurricane Fiona (18 September 2022), respectively.
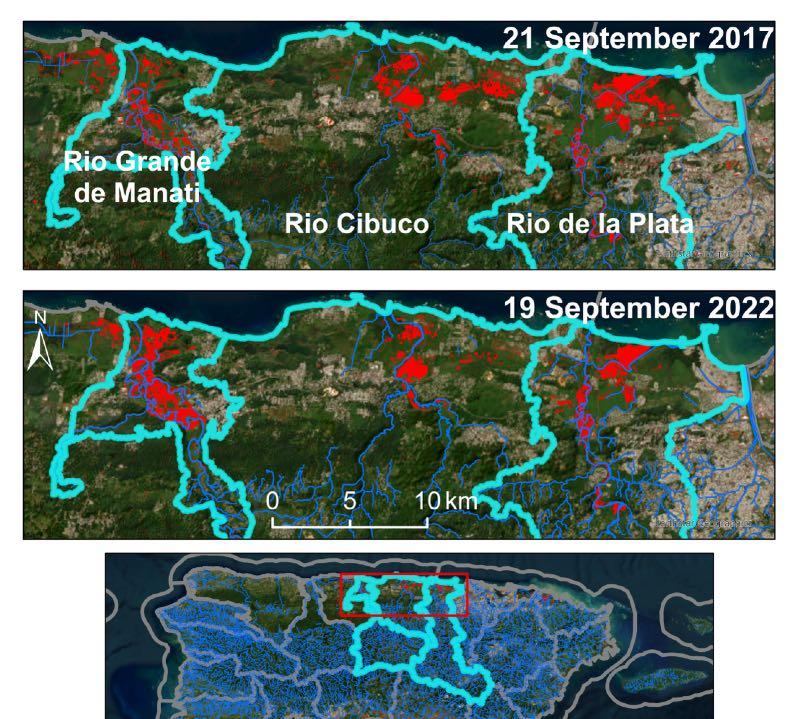
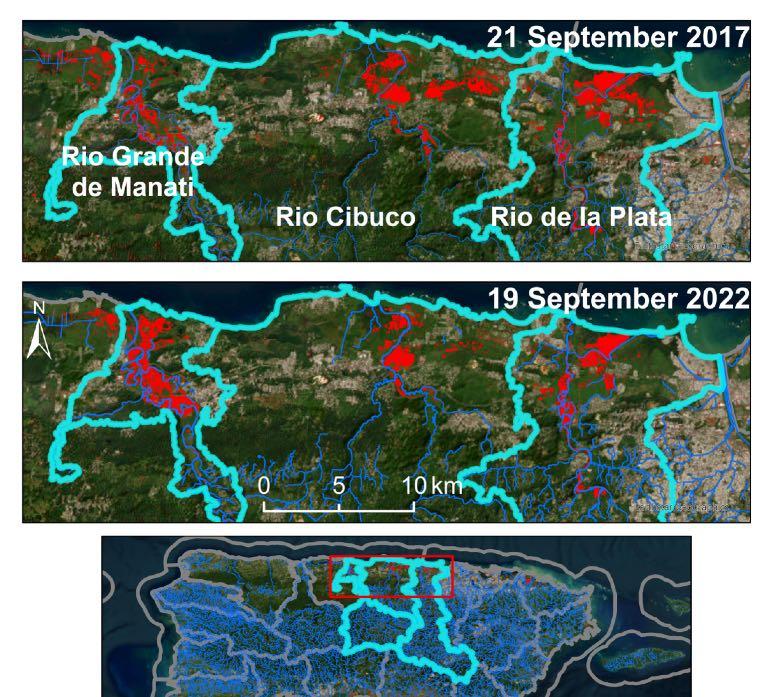
Figure 4. Detected surface inundation (red patches) on the central northern coast on 21 September 2017, right after Hurricane Maria (path shown in red), and on 19 September 2022, right after Hurricane Fiona (path shown in light blue). Blue lines are streams. Created in ArcGIS Pro 3.2 (ESRI, Redlands, CA, USA).
Figure4. Detectedsurfaceinundation(redpatches)onthecentralnortherncoaston21September 2017,rightafterHurricaneMaria(pathshowninred),andon19September2022,rightafterHurricane Fiona(pathshowninlightblue).Bluelinesarestreams.CreatedinArcGISPro3.2(ESRI,Redlands, CA,USA).
3.2. Topography and Land Cover in Detected Surface Inundation Areas
3.2.TopographyandLandCoverinDetectedSurfaceInundationAreas
The profile of topography in flooded areas showed a median elevation of 8.1 m during Maria, 7.2 m during Fiona, 6.9 m on 6 November 2022, and 3.9 m on 31 July 2020. The 70th percentile of the elevation in flooded areas was 55 m during Maria and 33 m during Fiona. Both upland land covers, e.g., urban, upland herbaceous, or forest cover, and wetlands encountered large inundations during the two hurricanes (Figure 5). For most of the land-cover types, the inundation areas were larger during Maria than during Fiona, except the upland herbaceous cover, for which inundated areas represented 2897 ha during Fiona versus 2523 ha during Maria.
Theprofileoftopographyinfloodedareasshowedamedianelevationof8.1mduring Maria,7.2mduringFiona,6.9mon6November2022,and3.9mon31July2020.The70th percentileoftheelevationinfloodedareaswas55mduringMariaand33mduringFiona. Bothuplandlandcovers,e.g.,urban,uplandherbaceous,orforestcover,andwetlands encounteredlargeinundationsduringthetwohurricanes(Figure 5).Formostofthelandcovertypes,theinundationareaswerelargerduringMariathanduringFiona,exceptthe uplandherbaceouscover,forwhichinundatedareasrepresented2897haduringFiona versus2523haduringMaria.
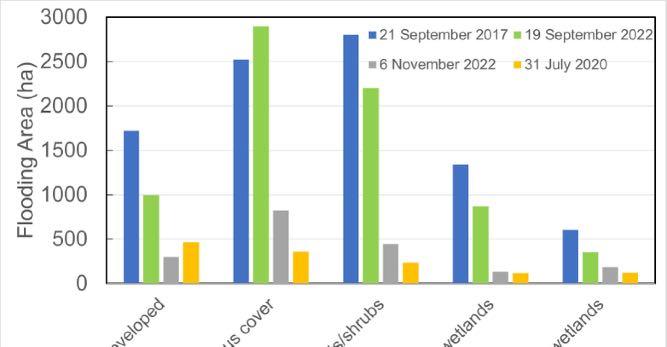
Figure 5. Detected surface inundation extent within upland and wetland land-cover zones. The events on 21 September 2017 and 19 September 2022 correspond to the flooding after Hurricane Maria and Hurricane Fiona, respectively.
Figure5. Detectedsurfaceinundationextentwithinuplandandwetlandland-coverzones.The eventson21September2017and19September2022correspondtothefloodingafterHurricane MariaandHurricaneFiona,respectively.
3.3. Fiona Rainfall Interpolation and Flow Accumulation Compared to Observed Stream Discharge
The spatial interpolation of 3-day rainfall from Hurricane Fiona (Figure 6) resulted in a root-mean-square error (RMSE) of 78 mm, a mean standardized value of 0.005, an average standard error of 81 mm, and a root-mean-square standardized error (0.97) approaching 1. In comparison, without covariates of elevation and distance from the hurri-
Figure 5. Detected surface inundation extent within upland and wetland land-cover zones. The events on 21 September 2017 and 19 September 2022 correspond to the flooding after Hurricane Maria and Hurricane Fiona, respectively.
3.3.FionaRainfallInterpolationandFlowAccumulationComparedtoObservedStreamDischarge
3.3. Fiona Rainfall Interpolation and Flow Accumulation Compared to Observed Stream Discharge
Thespatialinterpolationof3-dayrainfallfromHurricaneFiona(Figure 6)resultedin aroot-mean-squareerror(RMSE)of78mm,ameanstandardizedvalueof0.005,anaverage standarderrorof81mm,andaroot-mean-squarestandardizederror(0.97)approaching1. Incomparison,withoutcovariatesofelevationanddistancefromthehurricanepaththe BayesiankriginggeneratedaninterpolatedrainfallpatternwithanRMSEof101mmand anaveragestandarderrorof104mm.
The spatial interpolation of 3-day rainfall from Hurricane Fiona (Figure 6) resulted in a root-mean-square error (RMSE) of 78 mm, a mean standardized value of 0.005, an average standard error of 81 mm, and a root-mean-square standardized error (0.97) approaching 1. In comparison, without covariates of elevation and distance from the hurricane path the Bayesian kriging generated an interpolated rainfall pattern with an RMSE of 101 mm and an average standard error of 104 mm.
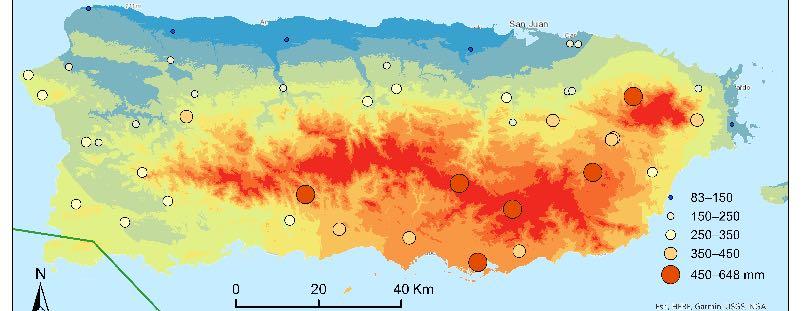
Figure6. FionarainfallinterpolationusingBayesianregressionkrigingwiththecovariatesofDEM anddistancefromthehurricanepath(blueline).CreatedinArcGISPro3.2(ESRI,Redlands,CA,USA).
Figure 6. Fiona rainfall interpolation using Bayesian regression kriging with the covariates of DEM and distance from the hurricane path (blue line). Created in ArcGIS Pro 3.2 (ESRI, Redlands, CA, USA).
The weighted flow accumulation from the interpolated Fiona rainfall revealed a very high correlation with the ground-observed stream discharge (Figure 7). In general, the weighted flow accumulation was higher than and increased with the corresponding observation of stream discharge, and the Pearson correlation coefficient between the two was 0.98. The discharge observed at the Rio Guanajibo NR Hormigueros in the southwest was high, i.e., 160.6 Mton (Figure 7, the largest dot in the southwest on the map and the orange dot on the lower right in the plot). However, the available observations of Fiona rainfall in this area were not very high, i.e., in the range of 250–350 mm (Figure 6). Therefore, the estimated flow accumulation weighted by the rainfall was lower when compared to the observed discharge at this location (Figure 7 plot). The upstream areas of Rio Grande de Manati, Rio de la Plata, and Rio Grande de Loiza (A–C in Figure 7 Map) received huge amounts of hurricane rainfall, and the observations from downstream gauges showed large stream discharges (Figure 7, the biggest dots on the map, except the one in the southwest).
TheweightedflowaccumulationfromtheinterpolatedFionarainfallrevealeda veryhighcorrelationwiththeground-observedstreamdischarge(Figure 7).Ingeneral, theweightedflowaccumulationwashigherthanandincreasedwiththecorresponding observationofstreamdischarge,andthePearsoncorrelationcoefficientbetweenthetwo was0.98.ThedischargeobservedattheRioGuanajiboNRHormiguerosinthesouthwest washigh,i.e.,160.6Mton(Figure 7,thelargestdotinthesouthwestonthemapandthe orangedotonthelowerrightintheplot).However,theavailableobservationsofFiona rainfallinthisareawerenotveryhigh,i.e.,intherangeof250–350mm(Figure 6).Therefore, theestimatedflowaccumulationweightedbytherainfallwaslowerwhencomparedto theobserveddischargeatthislocation(Figure 7 plot).TheupstreamareasofRioGrande deManati,RiodelaPlata,andRioGrandedeLoiza(A–CinFigure 7 Map)receivedhuge amountsofhurricanerainfall,andtheobservationsfromdownstreamgaugesshowedlarge streamdischarges(Figure 7,thebiggestdotsonthemap,excepttheoneinthesouthwest).
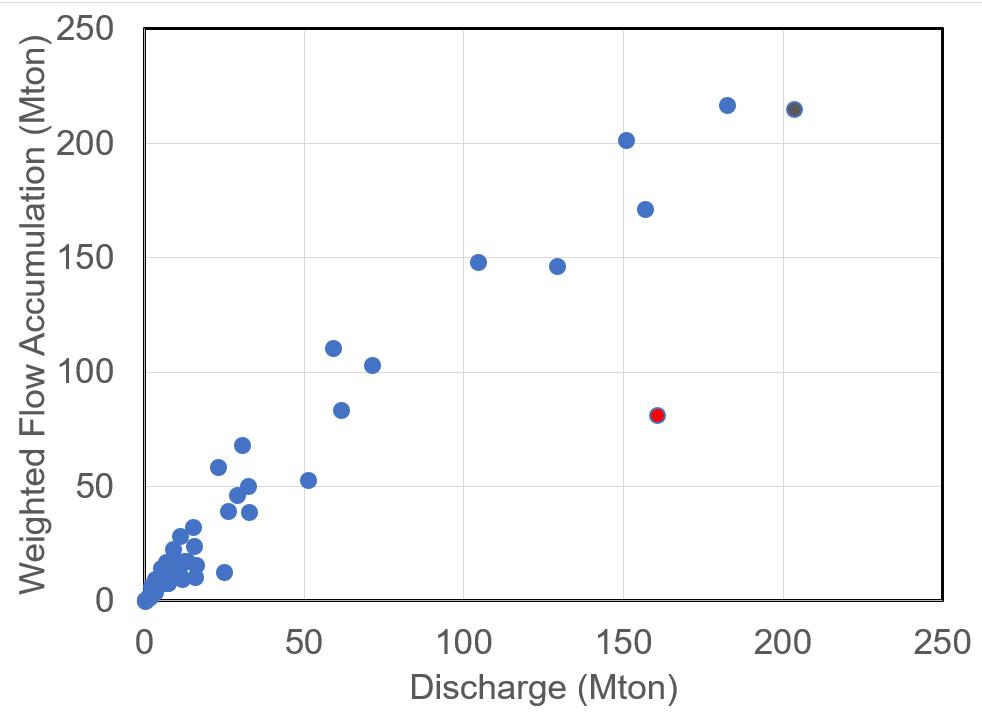
Figure7. Cont

Figure7. Ground-observedstreamdischargeduringHurricaneFionaversustheflowaccumulation estimationweightedbyFionarainfall(upperpanel);spatialdistributionoftheobservedstream discharges(dots)duringHurricaneFiona,shownontheinterpolatedFionarainfallmap(lower panel).ThedashedpolygonsshowthewatershedboundariesfromUSGS.A.RioGrandedeManati watershed,B.RiodelaPlatawatershed,andC.RioGrandedeLoizawatershed.Mapcreatedin ArcGISPro3.2(ESRI,Redlands,CA,USA).
3.4.ExplorationofPotentialDriverstoSurfaceInundation
Thedetectedsurfacefloodingextentswerehighlyandsignificantlycorrelatedwith theaccumulatedFionarainreceivedinthewatersheds(Pearson’scorrelationcoefficient 0.59, p =0.04).Accordingtothetopographyofdetectedfloodingpixels,theelevationof 33mcorrespondsto70thpercentileofthatinfloodingpixelsduringFiona.Regardingthe flatlowlandsineachwatershed,i.e.,areaswithelevation ≤ 33mandslope ≤ 5◦,larger flatlowlandscorrespondedtolowermeanslope(Pearson’scorrelationcoefficient 0.72, p =0.008)andlowermeanelevation(Pearson’scorrelationcoefficient 0.44, p =0.15). Themeanelevationoftheflatlowlandswassignificantlycorrelatedwiththemeanslope (Pearson’scorrelationcoefficient0.57, p =0.05).
TheFionarainaccumulatedineachwatershedalonecouldexplain35%ofthevariation inthesurfacefloodingextentdetectedineachwatershed.Whenitwascombinedwiththe topographyindex,i.e.,themeanelevationofflatlowlands(DEM ≤ 33mand slope ≤ 5◦), togethertheycouldexplain50%ofthevariationinthesurfacefloodingextentwitha p valueof0.04fortheregression.ThehighertheaccumulatedFionarainandthelowerthe flatlowlands,thelargerthesurfacefloodingextentdetected(Equation(5)).
where Flooding isthesurfaceinundationextentinhectare, RainAccum istheFionarain accumulationineachwatershedinmilliontons,and DEMLowland isthemeanelevationof flatlowlandsinm.Allthevariablesarestandardized.The p valueforthecoefficientbefore RainAccum and DEMLowland is0.04and0.14,respectively.
Thetwosouthernwatersheds,i.e.,RioMatildetoRioDescalabradoandRioCoamo toRioSeco,areclosetotheFionapathandencounteredhighFionarain;however,both watershedsshowedrelativelysmallinundationextents(Figure 8 upperpanel).Climate inthesouthoftheislandisusuallymuchdrierthanthatintheeastandthenorthdueto therainshadoweffectofnortheasterlytradewinds[40].Whenweappliednormalannual rainfallinthepast30years[38]asanadditionalexplanatoryvariable,thethreeindependent variablesaltogetherexplained54.5%ofthevariationinsurfacefloodingextent,witha p valueof0.08fortheregression(Equation(6)).Additionally,thelowerthenormalrainfall, thatis,thedriertheregion,thesmallerthesurfacefloodingextent(Equation(6)).
Rain mulation in each watershed in million tons, and DEMLowland is the mean elevation of flat lowlands in m. All the variables are standardized. The p value for the coefficient before RainAccum and DEMLowland is 0.04 and 0.14, respectively.
The two southern watersheds, i.e., Rio Matilde to Rio Descalabrado and Rio Coamo to Rio Seco, are close to the Fiona path and encountered high Fiona rain; however, both watersheds showed relatively small inundation extents (Figure 8 upper panel). Climate in the south of the island is usually much drier than that in the east and the north due to the rain shadow effect of northeasterly trade winds [40]. When we applied normal annual rainfall in the past 30 years [38] as an additional explanatory variable, the three independent variables altogether explained 54.5% of the variation in surface flooding extent, with a p value of 0.08 for the regression (Equation (6)). Additionally, the lower the normal rainfall, that is, the drier the region, the smaller the surface flooding extent (Equation (6)).
where RainNormal isstandardizedmeannormalannualrainfallinmmforthewatersheds. The p valueforthecoefficientbefore RainAccum, DEMLowland,and RainNormal is0.04,0.22, and0.40,respectively.Thecoefficientsinfrontoftheindependentvariablesindicatethe rankofimpacts,i.e.,thewatershedaccumulatedFionarainfallhadthelargestimpact (positive),followedbythemeanelevationofflatlowlands(negative)andthenormal annualrainfall(positive).
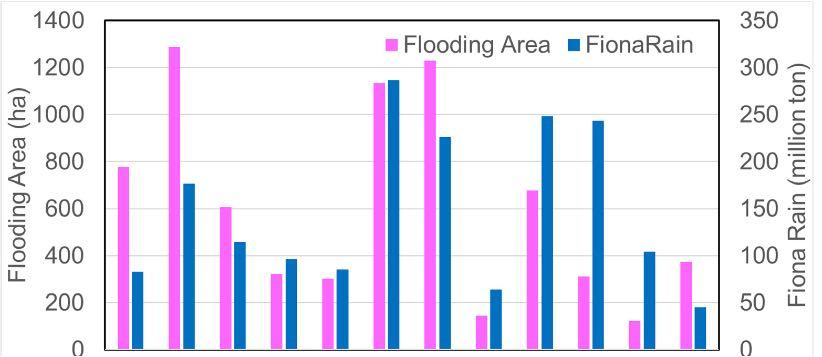

Figure 8. Detected flooding area and watershed accumulated Fiona rainfall (upper panel); mean elevation of flat lowlands (DEM ≤ 33 m and slope ≤ 5°) and normal annual rainfall (lower panel) in the coastal watersheds.
Figure8. DetectedfloodingareaandwatershedaccumulatedFionarainfall(upperpanel);mean elevationofflatlowlands(DEM ≤ 33mandslope ≤ 5◦ )andnormalannualrainfall(lowerpanel)in thecoastalwatersheds.
4.Discussion
ThesurfaceinundationextentaftertropicalstormscouldbedetectedwithhighaccuracywhenapplyingamachinelearningalgorithmtoSARimages.Thesupervisedrandom forestclassifierappliedinthisstudyshowedaKappastatisticof0.83afterHurricaneMaria, andtheproducerandtheuseraccuraciesforfloodingpixelswerehigherthan95%.Based onaconvolutionalneuralnetwork(CNN)andasegmentationalgorithm,Jiangetal.ap-
(6) where RainNormal is standardized mean normal annual rainfall in mm for the watersheds. The p value for the coefficient before RainAccum, DEMLowland, and RainNormal is 0.04, 0.22, and 0.40, respectively. The coefficients in front of the independent variables indicate the rank of impacts, i.e., the watershed accumulated Fiona rainfall had the largest impact (positive), followed by the mean elevation of flat lowlands (negative) and the normal annual rainfall (positive).
4. Discussion
The surface inundation extent after tropical storms could be detected with high ac-
pliedanunsupervisedmachinelearningapproachtoassesslarge-scalefloodingduringthe YangtzeRiverfloodin2020.Andtheresultsshowed93%and94%forproduceranduser accuracy,respectively[20],similartothevaluesinthisstudy.Underthefastdevelopment ofdeeplearningalgorithms,moreapplicationsofdeeplearningwithSARimageshave appearedforterrainsurfaceclassification,aswellasotherfieldssuchasobjectdetection, SAR-opticaldatafusion,etc.[41].
TheC-BandSARonboardSentinel-1haslimitedcapabilitytodetectfloodsunder canopies[24,42].Wetriedtoestimatetheomissionoffloodingunderdensevegetationby exploringthedepressionswithforestsandthenearbydetectedfloodingpixels.However, theapproachcamewithlargeuncertaintiessincehalfofthesedepressionsonlyhadone ortwofloodingpixelsdetected,whichmadeitdifficulttosetupareliableelevation thresholdforpotentialflooding.AnalternativewouldbeapplicationsofL-bandimages fromPALSAR(phasedarrayL-bandsyntheticapertureradar)andto-be-launchedNISAR (NASA-ISROsyntheticapertureradar),whichwilllargelycompensateforC-bandimages tomonitorsurfacefloodingsundercanopies.
Torrentialrainbroughtbymajorhurricanes,oneofthemajorconcernsofhurricane impactotherthanfiercewind,oftenleadstopluvialaswellasfluvialfloods.TheinterpolationofhurricanerainfallbyBayesianregressionkriginginthisstudyresultedina lowRMSEwhenelevationanddistancefromthehurricanepathwereincorporatedas covariates.Ingeneral,thehighertheelevationandtheclosertothehurricanepath,the greatertherainfall.Therainfall-derivedflowaccumulationsareexpectedtobehigherthan theobservedstreamdischargessinceotherfluxessuchasrechargingsoils/groundwater, evapotranspiration,andcanopyinterceptionarenotconsideredintheflowaccumulation estimation.Consideringtherapidheavyrainfallandcloudyweatherduringhurricane events,streamdischargemightbecomethedominantcomponentandexhibitaclosecorrelationwiththerainfall-derivedflowaccumulation.Inthisstudy,theflowaccumulation washighlycorrelatedwiththeground-observedstreamdischargeduringFiona(0.98), implyingnotonlyareliableinterpolationofFionarainfallbutalsothepossibilityofusing theinterpolatedrainfallinexploringdriversofsurfaceinundation.
Remote-sensedsurfaceinundationextentshavebeenreportedtobecorrelatedwith streamgaugeddischargesinexistingstudies[14,15,43].Forexample,FrazierandPage[44] triedtorelatewetlandinundationextenttoriverflowsusingLandsatETMimagesbefore andafterafloodingevent.Inthisstudy,theaccumulatedwatershedFionarainfallplayeda significantroleindeterminingthedetectedsurfaceinundationextentandaloneexplained 35%ofthevariationindetectedsurfaceinundation.Heimhuberetal.[15]modeledLandsatderivedsurfacewaterinundationandtriedtoconnectittothelaggedsurfacewater inundation,streamdischarge,localprecipitation,evapotranspiration,andsoilmoisture. Theyfoundanaverager2 valueof0.65forfloodplainunitsthatconnectedtorivergauges, andstreamflowsdominatedintheexplanationofsurfacewaterinundationdynamics.
Inundationpatternsarerelatedtothedistancefromthehurricanepathandthedirectionsincetheypartlydeterminetheconsequentrainfalldistribution.Hurricanewindsare usuallyhigherinareasontherightsideofthepathinthenorthernhemisphere[38,45].As showninFigures 3 and 4,thewatershedofRioCibucoismostlyonthenearrightsideof theMariapathandthusexperiencedmoreimpactsfromMariaand,consequently,more inundatedareascomparedtothoseduringFiona.RegardingthewatershedofRioGrande deManati,mostofitsupstreamareaisontheleftsideoftheMariapath,butontheright sideoftheFionapath,andconsequentlyitexperiencedsevererinundationduringFiona thanduringMaria.ThewatershedofRiodelaPlataisamongthebiggestwatershedsin PuertoRico,withanareaof62,472ha,andwasapproximatelycutdownthemiddleby thepathofMaria.Therefore,thewatershedexperiencedsevereinundationduringboth hurricanes(Figure 3,thehighestduringMariaandthesecondhighestduringFiona).
Topographyalsoplaysanimportantroleininundation.Themedianelevationofthe detectedinundationareasincreasedwiththeseverityofthefloodingevent,e.g.,8.1m duringMariaversus7.2mduringFiona.Althoughherbaceouswetlandsonlyoccupy1.5%
ofthestudyarea,thedetectedinundationintheherbaceouswetlandsoccupied13%ofthe totalinundationextentduringMariaand11%duringFionaduetotheirlowlandsettings.In thewatershedofRioCibuco,althoughtheaccumulatedFionarainwaslow,agreatamount ofinundatedareawasstillobservedduetoitslowelevationsetting(Figure 8).Anopposite caseisthewatershedofRiodeBayamontoRioHondowitharelativelysmallinundation extentduetohighermeanlowlandelevation(Figure 8).Theincorporationofthelowland elevationasanexplanatoryvariableintotheregressionincreasedtheexplanatorycapability ofsurfaceinundationextentfrom35%,whenconsideringFionarainfallalone,to50%.The casehereimpliesthatthelowertheflatlowland,whichmightalsocomewithanincrease inarea,thelargerthedetectedsurfaceinundationextent.
Interactionsbetweensurfacewaterandgroundwaterandpre-floodingsoilmoisture statusareimportantindeterminingfloodingextentanddepth;however,theseareless studiedintheliteratureonfloodingmonitoringandmodeling[13].Ourresultsforthe potentialdriversoffloodingextentindirectlyaddressedthelatterbyincorporatingthe normalclimateindex.Thedrierthesite,whichmightcomewithlessantecedentsoil moisturebeforethefloodingevent,thesmallerthedetectedinundationareas.Ingeneral, thesoilmoistureislesssaturatedatdriersitesinthesouthoftheisland,whichmaybe areasonforthelowinundationdetectedinthewatershedofRioCoamotoRioSecoin thesouth.ThiswatershedreceivedveryhighamountsofFionarainfall(Figure 8),but sinceitisthedriestsite,therechargeofdrysoilsmighthavegreatlyreducedtheflooding potential.Furtherstudiesincorporatingtheinteractionsbetweensurfaceandgroundwater areneeded,especiallyintheKarstregions.
Ourstudyonthehurricaneimpactonatropicalmountainousislandthushighlights thataccumulatedwatershedrainfallamountandtopography,especiallythatinthelowland, dominateoverotherfactorsaffectingthefloodingrisk;soilmoistureandstormsurgemay alsocontributetopotentialinundation[15,28].Thepredictionofmorefrequentandseverer tropicalstormstogetherwiththetrendsofrapidintensification[46]raisegreatconcerns regardingcoastalfloodingriskandrapidresponse[12].Theintegrationofmachinelearning algorithmsandSARimagesfromcloud-computingplatformssuchasGoogleEarthEngine thereforeprovidesanefficient,effectiveapproachtorapidfloodmonitoringandresponse, post-disasterassessment,andthecalibration/validationofhydrodynamicmodelsfor futureprediction.
Coastalfloodingisamajorthreattothedensepopulationslivingonthecoast.Under thewarmingclimate,therisingsealevelduetooceanthermalexpansionandthemelting ofglaciersandseaiceandtheincreasingextremeclimateevents,especiallythemore frequentandintensetropicalcyclones,exacerbatethecoastalcompoundfloodingfrom heavyrainfall,stormsurges,andhightides.Therapidassessmentandmonitoringof coastalfloodingareimperativesforemergencyresponseandcoastalhazardmitigation.
Advancesinremotesensing,machinelearning,andcloudcomputationgreatlyimprovefloodingassessmentintermsofall-weathermonitoring,accuracy,andefficiency. Usingthecloud-computingplatformGoogleEarthEngine,weassessedthesurfaceflooding patternsonthetropicalislandofPuertoRicoafterthehigh-endcategory4HurricaneMaria in2017andthecategory1HurricaneFionain2022.Weappliedarandomforestclassifier toSentinel-1SARimages,forwhichthesignalscouldpenetratecloudsduringhurricanes. Toadvanceourmechanisticunderstandingofsurfaceinundation,weinterpolatedtheobservedFionarainfallbyBayesianregressionkrigingandcomparedtherainfall-derivedflow accumulationagainsttheground-observedstreamdischarge.Furthermore,weexplored thepotentialdriversofsurfaceinundationsuchashurricanerainfall,streamdischarge, topography,andclimatesetting.
Inareaswithoutdensevegetationcover,thisapproachcouldachievehighaccuracy indistinguishingfloodingpixelsfromnon-floodingones.Thespatialpatternsofthesurfaceinundationafterthetwohurricanesaredifferentiatedbythehurricanepathsandthe
associatedrainfallpatterns.Afterelevationanddistancefromthehurricanepathwere incorporatedascovariatesintheBayesianregressionkriging,theinterpolatedFionarainfall showedalowRMSE.Andtherainfall-derivedflowaccumulationsexhibitedhighcorrelationswiththeground-observedstreamdischarges,whichindicatesareliableinterpolation approachandapossibilityofusingrainfalldirectlyinexploringthedriversofsurface inundation.ThewatershedaccumulatedFionarainfallandthewatershedtopography inlowlandsplayedimportantrolesindeterminingthesurfacefloodingdetected.The highertheaccumulatedFionarainandthelowertheflatlowlands,thegreaterthedetectedsurfaceinundation.Additionally,thedrierthewatershed,thelowerthedetected surfaceinundation.
ThecanopypenetrationcapabilityofC-bandSARlimitsthedetectionofflooding underdensevegetations.FutureapplicationsofL-bandSARimageswouldlargelycompensateforC-SARinmonitoringthefloodingwithorwithoutdensevegetationcover.The surfacefloodingassessmentandtheexplorationofdriversinthisstudywouldcontribute tothefutureintegrationofremote-sensedinundationwithhydrologicalmodelstopredict floodriskunderintensifiedstormscenarios.
AuthorContributions: Conceptualization,M.Y.andQ.G.;methodology,M.Y.;formalanalysis,M.Y. andQ.G.;writing—originaldraftpreparation,M.Y.;writing—reviewandediting,M.Y.andQ.G.All authorshavereadandagreedtothepublishedversionofthemanuscript.
Funding: ThisresearchwasfundedbytheNOAAPuertoRicoSeaGrantNA18OAR4170089.
DataAvailabilityStatement: ThedatasetsusedarepubliclyavailableattheNOAAdataportalat https://www.ncei.noaa.gov/cdo-web/ (accessedon10January2024)andat https://coast.noaa.gov/ dataviewer/#/ (accessedon10January2024)andtheUSGSdataportalat https://waterwatch.usgs. gov/ (accessedon10January2024).SatelliteImagesarepubliclyavailableatGoogleEarthEngine. ConflictsofInterest: Theauthorsdeclarenoconflictsofinterest.Thefundershadnoroleinthedesign ofthestudy;inthecollection,analyses,orinterpretationofdata;inthewritingofthemanuscript;or inthedecisiontopublishtheresults.
AppendixAClassificationAccuraciesforSurfaceInundation
TableA1. Confusionmatrixfortheclassificationon21September2017usinganindependent validationsample.
A2. Classification results for the storms studied.
TableA2. Classificationresultsforthestormsstudied.
Cont.


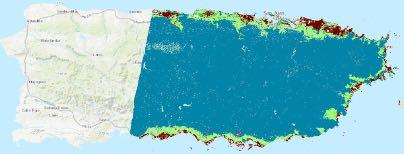


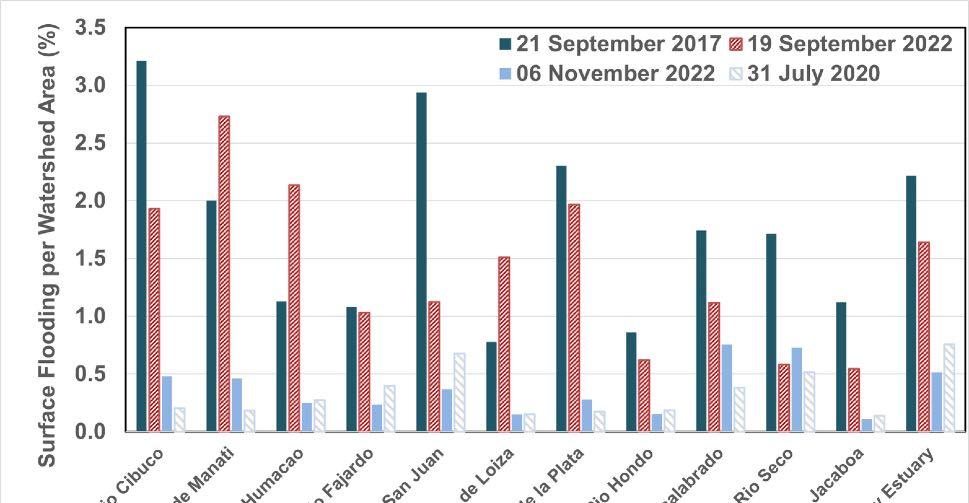
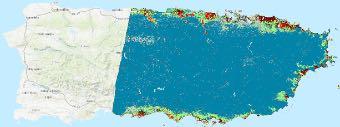
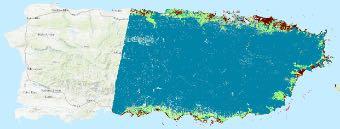
Figure A1. Surface inundation per watershed area (%) detected along coastal watersheds. The events on 21 September 2017 and 19 September 2022 correspond to the flooding after Hurricane Maria (20 September 2017) and Hurricane Fiona (18 September 2022), respectively.
FigureA1. Surfaceinundationperwatershedarea(%)detectedalongcoastalwatersheds.Theevents on21September2017and19September2022correspondtothefloodingafterHurricaneMaria (20September2017)andHurricaneFiona(18September2022),respectively.
Fifth National Climate Assessment; U.S. Global Change Research Program: Washington, DC, USA, 2023. Wang, G.J.; Santoso, A.; McPhaden, M.J.; Wu, L.X.; Jin, F.F.; Timmermann, A.; Collins, M.; Vecchi, G.; Lengaigne, M.; Increased frequency of extreme La Nina events under greenhouse warming. Nat. Clim. Chang. 2015, 5, 132–137.
References
1. USGCRP. FifthNationalClimateAssessment;U.S.GlobalChangeResearchProgram:Washington,DC,USA,2023.
2. Cai,W.J.;Wang,G.J.;Santoso,A.;McPhaden,M.J.;Wu,L.X.;Jin,F.F.;Timmermann,A.;Collins,M.;Vecchi,G.;Lengaigne,M.; etal.IncreasedfrequencyofextremeLaNinaeventsundergreenhousewarming. Nat.Clim.Chang. 2015, 5,132–137.[CrossRef]
3. Cai,W.J.;Borlace,S.;Lengaigne,M.;vanRensch,P.;Collins,M.;Vecchi,G.;Timmermann,A.;Santoso,A.;McPhaden,M.J.;Wu, L.X.;etal.IncreasingfrequencyofextremeElNinoeventsduetogreenhousewarming. Nat.Clim.Chang. 2014, 4,111–116. [CrossRef]
4. Sippo,J.Z.;Lovelock,C.E.;Santos,I.R.;Sanders,C.J.;Maher,D.T.Mangrovemortalityinachangingclimate:Anoverview. Estuar. Coast.ShelfSci. 2018, 215,241–249.[CrossRef]
5. Duke,N.C.;Kovacs,J.M.;Griffiths,A.D.;Preece,L.;Hill,D.J.E.;vanOosterzee,P.;Mackenzie,J.;Morning,H.S.;Burrows,D. Large-scalediebackofmangrovesinAustralia’sGulfofCarpentaria:Asevereecosystemresponse,coincidentalwithanunusually extremeweatherevent. Mar.Freshw.Res. 2017, 68,1816–1829.[CrossRef]
6. Hauer,M.E.;Fussell,E.;Mueller,V.;Burkett,M.;Call,M.;Abel,K.;McLeman,R.;Wrathall,D.Sea-levelriseandhumanmigration. Nat.Rev.EarthEnviron. 2020, 1,28–39.[CrossRef]
7. Neumann,B.;Vafeidis,A.T.;Zimmermann,J.;Nicholls,R.J.FutureCoastalPopulationGrowthandExposuretoSea-LevelRise andCoastalFlooding—AGlobalAssessment. PLoSONE 2015, 10,e0118571.[CrossRef][PubMed]
8. Uriarte,M.;Thompson,J.;Zimmerman,J.K.HurricaneMaríatripledstembreaksanddoubledtreemortalityrelativetoother majorstorms. Nat.Commun. 2019, 10,1362.[CrossRef]
9. Yu,M.;Gao,Q.Prolongedcoastalinundationdetectedwithsyntheticapertureradarsignificantlyretardedfunctionalrecoveryof mangrovesaftermajorhurricanes. Landsc.Ecol. 2023, 38,169–183.[CrossRef]
10. Patrick,C.J.;Yeager,L.;Armitage,A.R.;Carvallo,F.;Congdon,V.M.;Dunton,K.H.;Fisher,M.;Hardison,A.K.;Hogan,J.D.; Hosen,J.;etal.ASystemLevelAnalysisofCoastalEcosystemResponsestoHurricaneImpacts. EstuariesCoasts 2020, 43,943–959. [CrossRef]
11. Ye,F.;Huang,W.;Zhang,Y.J.;Moghimi,S.;Myers,E.;Pe’eri,S.;Yu,H.C.Across-scalestudyforcompoundfloodingprocesses duringHurricaneFlorence. Nat.HazardsEarthSyst.Sci. 2021, 21,1703–1719.[CrossRef]
12. Gori,A.;Lin,N.;Xi,D.;Emanuel,K.TropicalcycloneclimatologychangegreatlyexacerbatesUSextremerainfall–surgehazard. Nat.Clim.Chang. 2022, 12,171–178.[CrossRef]
13. Teng,J.;Jakeman,A.J.;Vaze,J.;Croke,B.F.W.;Dutta,D.;Kim,S.Floodinundationmodelling:Areviewofmethods,recent advancesanduncertaintyanalysis. Environ.Model.Softw. 2017, 90,201–216.[CrossRef]
14. Huang,C.;Chen,Y.;Zhang,S.;Wu,J.Detecting,Extracting,andMonitoringSurfaceWaterfromSpaceUsingOpticalSensors:A Review. Rev.Geophys. 2018, 56,333–360.[CrossRef]
15. Heimhuber,V.;Tulbure,M.G.;Broich,M.Modelingmultidecadalsurfacewaterinundationdynamicsandkeydriversonlarge riverbasinscaleusingmultipletimeseriesofEarth-observationandriverflowdata. WaterResour.Res. 2017, 53,1251–1269. [CrossRef]
16. DeVries,B.;Huang,C.;Armston,J.;Huang,W.;Jones,J.W.;Lang,M.W.Rapidandrobustmonitoringoffloodeventsusing Sentinel-1andLandsatdataontheGoogleEarthEngine. RemoteSens.Environ. 2020, 240,111664.[CrossRef]
17. Wulder,M.A.;Loveland,T.R.;Roy,D.P.;Crawford,C.J.;Masek,J.G.;Woodcock,C.E.;Allen,R.G.;Anderson,M.C.;Belward, A.S.;Cohen,W.B.;etal.CurrentstatusofLandsatprogram,science,andapplications. RemoteSens.Environ. 2019, 225,127–147. [CrossRef]
18. Pahlevan,N.;Chittimalli,S.K.;Balasubramanian,S.V.;Vellucci,V.Sentinel-2/Landsat-8productconsistencyandimplicationsfor monitoringaquaticsystems. RemoteSens.Environ. 2019, 220,19–29.[CrossRef]
19. Torres,R.;Snoeij,P.;Geudtner,D.;Bibby,D.;Davidson,M.;Attema,E.;Potin,P.;Rommen,B.;Floury,N.;Brown,M.;etal.GMES Sentinel-1mission. RemoteSens.Environ. 2012, 120,9–24.[CrossRef]
20. Jiang,X.;Liang,S.;He,X.;Ziegler,A.D.;Lin,P.;Pan,M.;Wang,D.;Zou,J.;Hao,D.;Mao,G.;etal.Rapidandlarge-scalemapping offloodinundationviaintegratingspacebornesyntheticapertureradarimagerywithunsuperviseddeeplearning. ISPRSJ. Photogramm.RemoteSens. 2021, 178,36–50.[CrossRef]
21. Gorelick,N.;Hancher,M.;Dixon,M.;Ilyushchenko,S.;Thau,D.;Moore,R.GoogleEarthEngine:Planetary-scalegeospatial analysisforeveryone. RemoteSens.Environ. 2017, 202,18–27.[CrossRef]
22. Liang,J.;Liu,D.AlocalthresholdingapproachtofloodwaterdelineationusingSentinel-1SARimagery. ISPRSJ.Photogramm. RemoteSens. 2020, 159,53–62.[CrossRef]
23. Shen,X.;Wang,D.;Mao,K.;Anagnostou,E.;Hong,Y.InundationExtentMappingbySyntheticApertureRadar:AReview. RemoteSens. 2019, 11,879.[CrossRef]
24. Cian,F.;Marconcini,M.;Ceccato,P.NormalizedDifferenceFloodIndexforrapidfloodmapping:TakingadvantageofEObig data. RemoteSens.Environ. 2018, 209,712–730.[CrossRef]
25. Clement,M.A.;Kilsby,C.G.;Moore,P.Multi-temporalsyntheticapertureradarfloodmappingusingchangedetection. J.Flood RiskManag. 2018, 11,152–168.[CrossRef]
26. Zhan,P.;Zhu,W.;Li,N.Anautomatedricemappingmethodbasedonfloodingsignalsinsyntheticapertureradartimeseries. RemoteSens.Environ. 2021, 252,112112.[CrossRef]
27. Huang,W.;DeVries,B.;Huang,C.;Lang,M.W.;Jones,J.W.;Creed,I.F.;Carroll,M.L.AutomatedExtractionofSurfaceWater ExtentfromSentinel-1Data. RemoteSens. 2018, 10,797.[CrossRef]
28. Leauthaud,C.;Belaud,G.;Duvail,S.;Moussa,R.;Grünberger,O.;Albergel,J.Characterizingfloodsinthepoorlygaugedwetlands oftheTanaRiverDelta,Kenya,usingawaterbalancemodelandsatellitedata. Hydrol.EarthSyst.Sci. 2013, 17,3059–3075. [CrossRef]
29. Ogilvie,A.;Belaud,G.;Delenne,C.;Bailly,J.-S.;Bader,J.-C.;Oleksiak,A.;Ferry,L.;Martin,D.DecadalmonitoringoftheNiger InnerDeltaflooddynamicsusingMODISopticaldata. J.Hydrol. 2015, 523,368–383.[CrossRef]
30. López-Marrero,T.;Heartsill-Scalley,T.;Rivera-López,C.F.;Escalera-García,I.A.;Echevarría-Ramos,M.BroadeningOurUnderstandingofHurricanesandForestsontheCaribbeanIslandofPuertoRico:WhereandWhatShouldWeStudyNow? Forests 2019, 10,710.[CrossRef]
31. Pasch,R.J.;Penny,A.B.;Berg,R. NationalHurricaneCenterTropicalCycloneReport:HurricaneMaria;(AL152017);NationalHurricane Center:Miami,FL,USA,2019;pp.1–48.
32. Pasch,R.J.;Reinhart,B.J.;Alaka,L. NationalHurricaneCenterTropicalCycloneReportHurricaneFiona;(AL072022);National HurricaneCenter:Miami,FL,USA,2023;p.60.
33. NOAANationalCentersforEnvironmentalInformation(NCEI).U.S.Billion-DollarWeatherandClimateDisasters.2023. Availableonline: https://www.ncei.noaa.gov/access/metadata/landing-page/bin/iso?id=gov.noaa.nodc:0209268 (accessedon 10January2024).
34. Hoekman,D.H.;Reiche,J.Multi-modelradiometricslopecorrectionofSARimagesofcomplexterrainusingatwo-stage semi-empiricalapproach. RemoteSens.Environ. 2015, 156,1–10.[CrossRef]
35. Vollrath,A.;Mullissa,A.;Reiche,J.Angular-BasedRadiometricSlopeCorrectionforSentinel-1onGoogleEarthEngine. Remote Sens. 2020, 12,1867.[CrossRef]
36. Breiman,L.RandomForests. Mach.Learn. 2001, 45,5–32.[CrossRef]
37. OfficeforCoastalManagement. C-CAPLandCover,PuertoRico,2010;NOAAOfficeforCoastalManagement:NorthCharleston, SC,USA,2020.
38. Yu,M.;Gao,Q.Topography,drainagecapability,andlegacyofdroughtdifferentiatetropicalecosystemresponsetoandrecovery frommajorhurricanes. Environ.Res.Lett. 2020, 15,104046.[CrossRef]
39. RCoreTeam. R:ALanguageandEnvironmentforStatisticalComputing;RCoreTeam:Vienna,Austria,2020.
40. Yu,M.;Gao,Q.;Gao,C.;Wang,C.ExtentofNightWarmingandSpatiallyHeterogeneousCloudinessDifferentiateTemporal TrendofGreennessinMountainousTropicsintheNewCentury. Sci.Rep. 2017, 7,41256.[CrossRef][PubMed]
41. Zhu,X.X.;Montazeri,S.;Ali,M.;Hua,Y.;Wang,Y.;Mou,L.;Shi,Y.;Xu,F.;Bamler,R.DeepLearningMeetsSAR:Concepts, models,pitfalls,andperspectives. IEEEGeosci.RemoteSens.Mag. 2021, 9,143–172.[CrossRef]
42. Kim,J.-W.;Lu,Z.;Jones,J.W.;Shum,C.K.;Lee,H.;Jia,Y.MonitoringEvergladesfreshwatermarshwaterlevelusingL-band syntheticapertureradarbackscatter. RemoteSens.Environ. 2014, 150,66–81.[CrossRef]
43. Sagin,J.;Sizo,A.;Wheater,H.;Jardine,T.D.;Lindenschmidt,K.-E.Awatercoverageextractionapproachtotrackinundationin theSaskatchewanRiverDelta,Canada. Int.J.RemoteSens. 2015, 36,764–781.[CrossRef]
44. Frazier,P.;Page,K.Areach-scaleremotesensingtechniquetorelatewetlandinundationtoriverflow. RiverRes.Appl. 2009, 25,836–849.[CrossRef]
45. Gao,Q.;Yu,M.CanopyDensityandRoughnessDifferentiateResistanceofaTropicalDryForesttoMajorHurricaneDamage. RemoteSens. 2021, 13,2262.[CrossRef]
46. Garner,A.J.ObservedincreasesinNorthAtlantictropicalcyclonepeakintensificationrates. Sci.Rep. 2023, 13,16299.[CrossRef]
Disclaimer/Publisher’sNote: Thestatements,opinionsanddatacontainedinallpublicationsaresolelythoseoftheindividual author(s)andcontributor(s)andnotofMDPIand/ortheeditor(s).MDPIand/ortheeditor(s)disclaimresponsibilityforanyinjuryto peopleorpropertyresultingfromanyideas,methods,instructionsorproductsreferredtointhecontent.