Addition of Wave Runup/Overtopping to the Puerto Rico Storm Surge Atlas
Aurelio Mercado-Irizarry Department of Marine Sciences, University of Puerto Rico, Mayaguez, PR 00680
BACKGROUND AND PROJECT RELEVANCE
Recently the Puerto Rico Storm Surge Atlas was finalized under a study titled Storm Surge Modeling in Puerto Rico in Support of Emergency Response, Risk Assessment, Coastal Planning and Climate Change Analysis, sponsored by the Caribbean Coastal Ocean Observing System (CariCOOS; http://www.caricoos.org/) and the Puerto Rico Coastal Zone Management Program (PRCZMP) of the Department of Natural and Environmental Resources of Puerto Rico. Both programs themselves are funded by NOAA. The following is a very brief summary of what has been done, and for a more detailed explanation please go to the accompanying Technical Report, whose link to download can be found at http://coastalhazardspe wordpress.com
The Atlas was prepared by running the coupled ADCIRC+SWAN models. ADCIRC is an advanced circulation model widely used for storm surge modeling, which has been coupled with another widely used spectral wind wave model, SWAN, so that between the two models the three storm surge factors, pressure + wind + wave setups, are calculated. Hurricanes with headings along four different trajectories (60°, 270°, 290°, and 330°, all relative to True North) were used to populate the Atlas. It should be stated that the hurricane heading of 60° (SW to NE) was included, but being such a rare event – it has never happened in Puerto Rico’s hurricane history – its results were not added to the results from the other headings in order to compute the so-called Maximum of the Maximums (MOMs – to be explained below) and SuperMOMs (MOM of the MOMs). This track was run in order to have an idea of what to expect, especially along the west coast of the island, in case it becomes a reality sometime. The Climate Change part of the work done comes from the fact that three sea level scenarios were contemplated: present (circa 2002), +0.5 and +1.0 meters of sea level rise above present (2002; this should be emphasized since sea level has been raising around Puerto Rico at a rate 1 cm/year since approximately 2010 – see http://coastalhazardspr.wordpress.com). Many studies have discussed, and documented, how sea level rise increases the risk of coastal flooding due to storm surges (Kleinosky et al. 2007; Smith et al. 2010; Lin et al. 2012; Woodruff et al. 2013; Bilskie et al. 2016).
A total of 82x3x5 = 1,230 runs were made, where the 5 comes from the 5 Saffir-Simpson categories, the 3 from the three sea level scenarios, and the 82 from the total number of hurricane tracks used per hurricane category The way it goes is that each individual hurricane track outputs a Maximum Envelope of Waters (MEOW). The collection of all the individual MEOWs
for a given hurricane category, and for each of the four hurricane headings used, produces a Maximum of the Maximums (MOMs) for each of the four headings (these are the maximum storm surge elevations for the set of tracks with a given heading). Then, for a given hurricane category we collect all three MOMs (one for each of the headings 270°, 290°, and 330°; recall that we are setting aside the tracks with a 60° heading) into another output I called the SuperMOMs (which is the MOM of the MOMs), now one for each hurricane category.
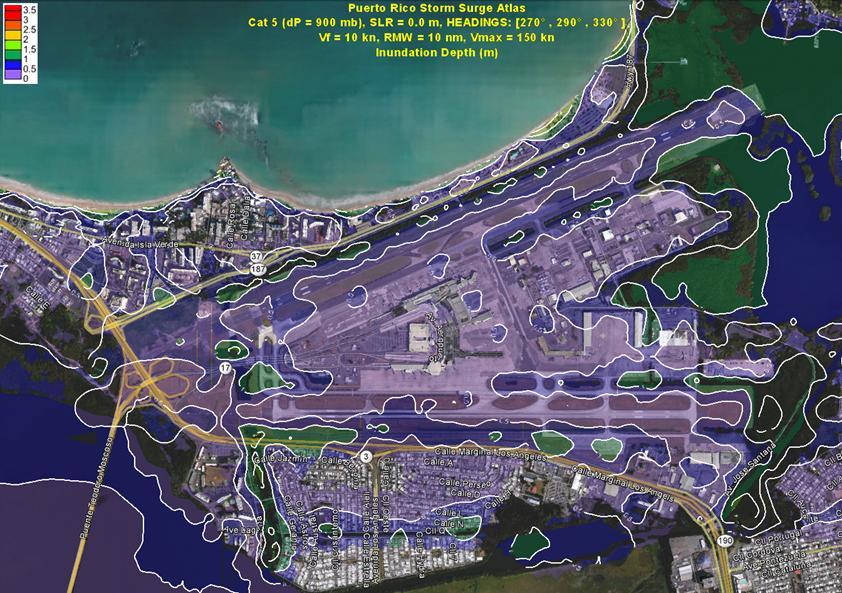
At present the storm surge maps (the Atlas) show only the SuperMOMs for each of the three sea level scenarios mentioned above. These maps can be seen in the CariCOOS (http://www.caricoos.org/map/storm-surge), on the PRCZMP page, and in http://coastalhazardspr.wordpress.com, a page which is under renovation. Therefore, at present there are only 3X5 = 15 storm surge maps, covering the whole island, in KMZ format, three for each of the hurricane categories. The listed storm surge maps in the page are given in two flavors for the stillwater elevations (SS): maximum sea surface elevation relative to Mean Sea Level (MSL), and relative to the local terrain elevation (Local Water Depth, or Inundation Depth). We also list the KMZs of the corresponding Significant Wave Heights as determined by SWAN (the Peak Wave Periods (Tp) is under preparation). This page is under renovation, and we plan to include the KMZs for the individual MOMs, including the one for the 60° tracks. We also have KMZs for each individual track (1,230 tracks), and how to make them publicly available is presently under evaluation. As an example, Figure 1 shows the potential sea water flooding at the Luis Muñoz Marin International Airport in San Juan due to a category 4 hurricane. This is one of several critical sites that have been evaluated as to their potential storm surge flooding, and they all can be seen at http://coastalhazards.uprm.edu. This figure shows only the stillwater.
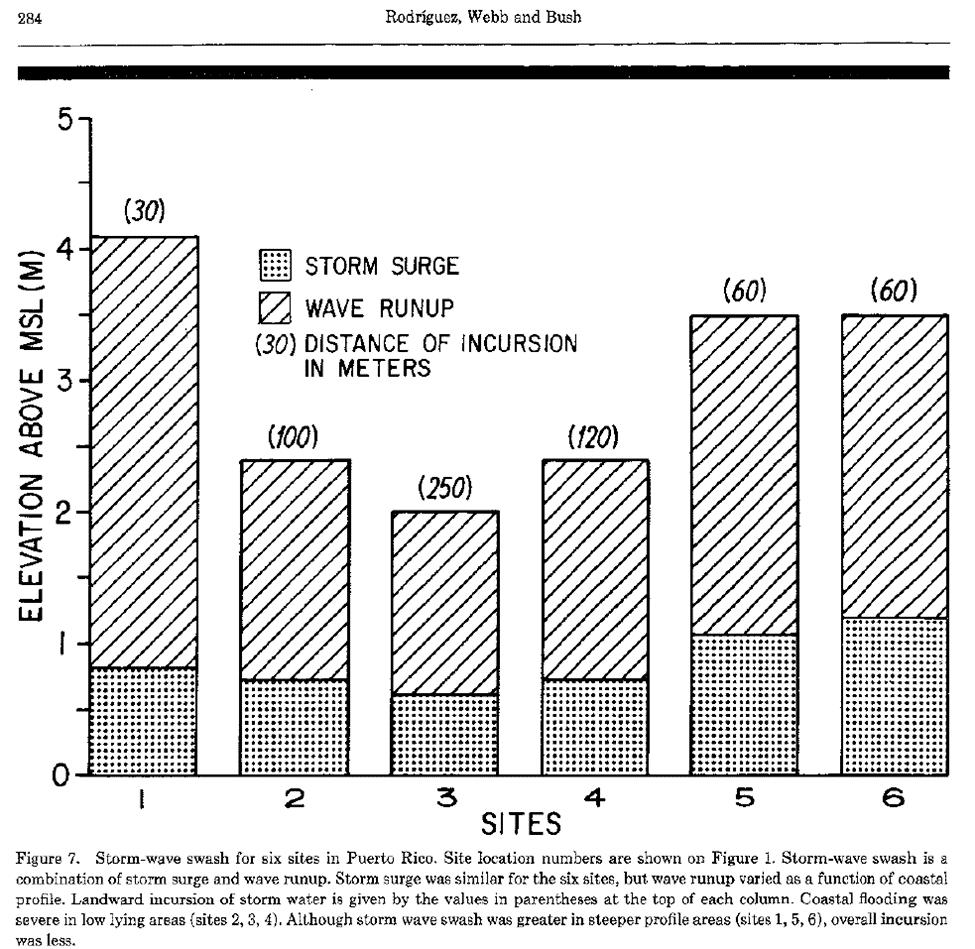
The issue is that these maps only show the stillwater elevations (pressure+wind+wave setups = storm surge, or SS), and in islands like Puerto Rico it is a fact that wave runup/overtopping plays a very important (if not the most important) role in producing inland coastal flooding. As an example, Figure 2 shows the contribution of wave runup to the overall inundation for the case of Hurricane Hugo (Storm-tide Elevations Caused by Hurricane Hugo on the U.S. Virgin Islands and on Puerto Rico, September 18, 1989 (Rodriguez et al. 1994). It is wave runup/overtopping that does most of the damage from the sea in islands like Puerto Rico. Therefore, the maps as they are, underestimate the overall storm surge hazard. The same holds in other tropical islands elsewhere, and in some locations in the USA (Kim et al. 2010; Li et al. 2014; Bertin et al. 2015; Kennedy et al. 2012).
At present the PRCZMP is funding the addition of runup/overtopping to the maps prepared under present sea level conditions. This is being done by running the non-linear, non-hydrostatic, shallow water model XBeach (https://oss.deltares.nl/web/xbeach/) on top of the computed storm surges (SS), in its phase-resolving, nonhydrostatic, 2-dimensional version. The reason why it is being done only for present sea level conditions is due to the fact that it is estimated that there will be no time to do the whole island (plus Vieques and Culebra) for all three sea level rise scenarios by the deadline of December 2017 imposed by the PRCZMP. It is the purpose of this proposal to get the funding, and release time, to add wave runup/overtopping to the remaining maps (with +0.5 and +1.0 m in sea level rise). Phase-resolving models are very computationally intensive, and we are running XBeach in its two-dimensional form due to the very complex bathymetry around the island. For this we will make use of its parallel computation capacities.
PROJECT DESCRIPTION AND OBJECTIVES
As stated above, the main objective is to include wave runup/overtopping to the Puerto Rico Storm Surge Atlas that has recently been finalized. That is, to show more realistic storm surge flood maps, especially since storm surge still water elevations in tropical islands tend to be relatively small. At the moment of writing this proposal we have results of wave runup/overtopping for parts of Puerto Rico under present sea level conditions. It is the objective of this proposal to include runup for the other two sets of maps prepared for sea level elevations of +0.5 and +1.0 meters above present (actually, the years 2000 to 2002, which is when the Lidar data was obtained that was used in the preparation of the present storm surge maps). The maps with sea level rise should show more extensive inland flooding relative to the case of no sea level rise since the freeboard decreases as sea level increases. And the protective effects of natural coastal barriers (like fringing reefs) is also reduced.
It should be stated that the approach we have taken is as follows. The storm surge maps we have developed, specifically what we have called the SuperMOMs (MOM of the MOMs, one for each hurricane category) gives us estimates of the potential storm surge flooding (SS - stillwater elevation above MHW), and also of the expected Significant Wave Height (Hs) and Peak Wave Period (Tp) in the near shore and inland where there is flooding. Hs and Tp come from the (unstructured) SWAN model. With the three (spatially varying) values of SS, Hs, and Tp, we can prepare input boundary conditions for the phase resolving wave model, XBeach, using the option of assuming a spectral shape (Parameterized Spectrum option described in the XBeach manual). This methodology is already in use in the presently ongoing runs under present sea level conditions. In a nutshell, we are using XBeach to extend the coastal flooding inland due to wave runup and overtopping. It is a more sophisticated way of doing what FEMA does when they run WHAFIS and RUNUP for the same purpose. Although in the FEMA analysis dune erosion is considered where it merits to do so. Kennedy et al. (2012) did something similar in the Hawaiian Islands, but using the 1-D version of Bouss-2D. As for the reliability of SWAN in shallow water onshore of complex bathymetry, I refer to Gorrell et al., (2011). They conclude that although mean wave properties observed in shallow water are predicted accurately, nonlinear energy transfers from near-resonant triads are not modeled well, and the observed and predicted wave energy spectra can differ significantly at frequencies greater than the spectral peak, especially for narrow-band swell. As mentioned below, we will not be using SWAN-derived spectra. All we
are attempting here is to add, in a reasonable way, a very important component to the coastal flooding maps we have recently prepared.
METHODOLOGY
At present we have available storm surge maps (stillwater) for all of the island of Puerto Rico, including its two island municipalities of Vieques and Culebra, for all five Saffir-Simpson scales (see http://coastalhazardspr.wordpress.com, STORM SURGES IN PUERTO RICO_THE PUERTO RICO STORM SURGE ATLAS_Intro.pdf). The maps are available for three different initial baseline sea surface elevations, with the intention of simulating the effect of sea level rise as predicted for at some moment during this century. These maps were prepared using bare-earth, Lidar-derived, Digital Elevation Models prepared by the National Geophysical Data Center of NOAA for the preparation of tsunami inundation maps. They have a resolution of 10 meters all around the island, and the storm surge maps were prepared for present, and +0.5 and +1.0 meters, initial sea surface elevations. Recently, new bare-earth, Lidar-derived, DEMs prepared by the US Corps of Engineers (2016) and NOAA (2015) were made available, with 1 meter resolution. These new sets of DEMs cover almost all of the island (see Figures 3 and 4). [ftp://coast.noaa.gov/tmp/rmataosky/puerto_rico/2016_usace_pr_topobathy_1m_dems/2016_NC MP_PuertoRico_PRVD02_BareEarth_1mGrid.zip;
ftp://coast.noaa.gov/tmp/rmataosky/puerto_rico/2015_ngs_pr_topobathy_1m_dems/2015_ngs_pr _dems.zip]
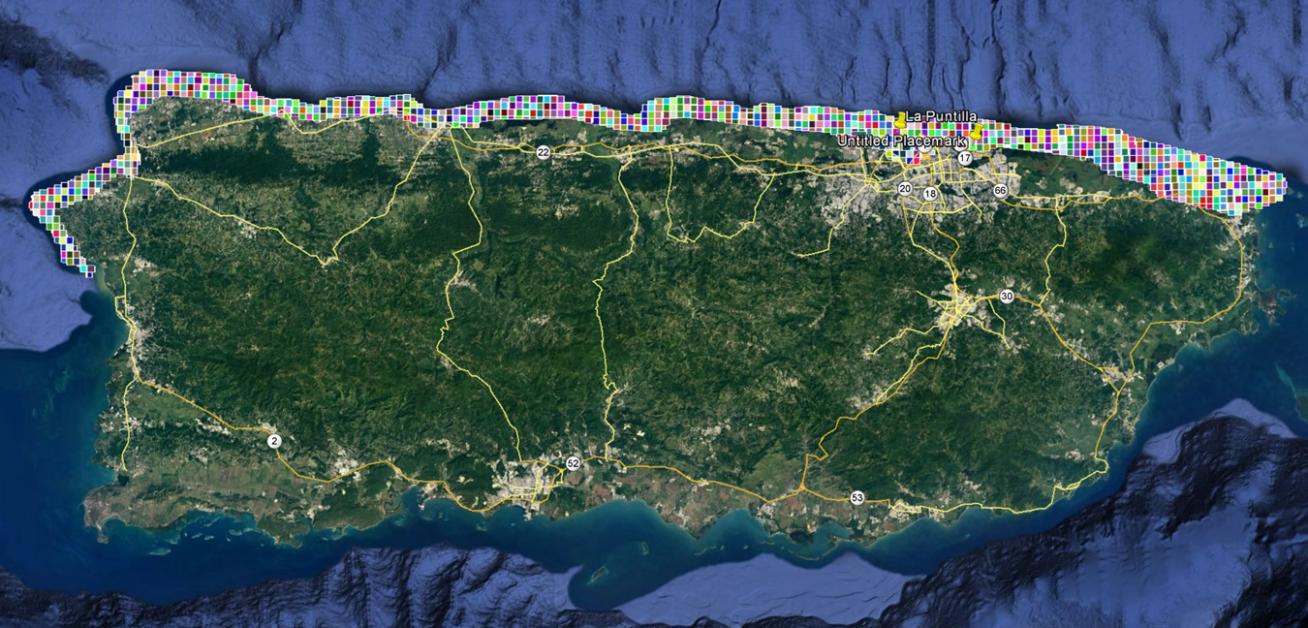
The resolution being used right now for the runup study under present sea level conditions is 2.5 m x 2.5 m, and we plan to use the same computational grids. We are using the 1 m resolution DEMs mentioned above. A Matlab script has been prepared in which one supplies the desired geographic limits of the computational grid, the depth limit beyond which the topography is assumed constant (as typically required for phase resolving models due to the kh upper limit,where k = wavenumber, and h = local water depth), and the angle of the grid relative to the North. With this information the script searches all of the DEMs for (x,y,z) values falling inside the chosen geographic region and prepares the computational grid at the desired grid resolution.
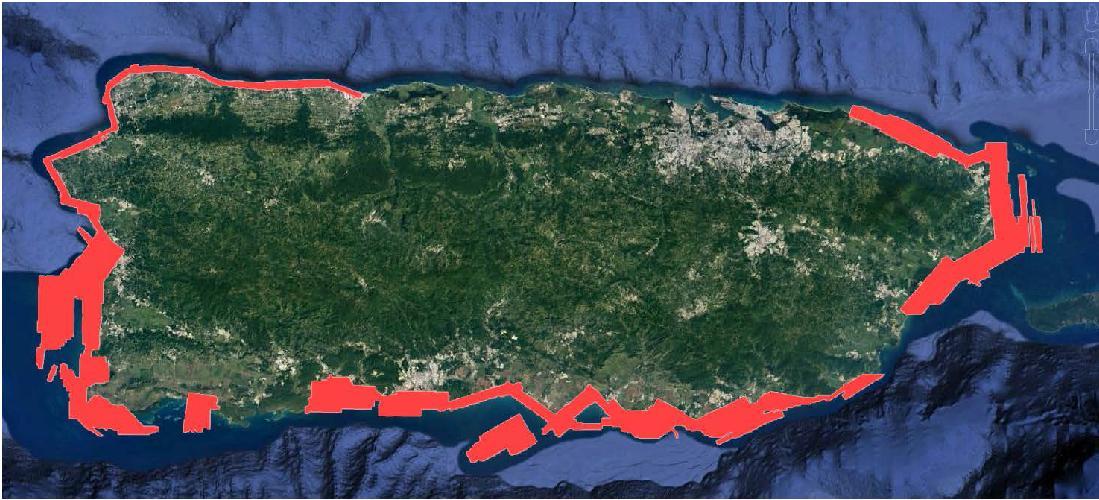
Since typically the DEMs contain gaps in data coverage, at the location of these gaps the model uses the 10 m resolution NGDC values to help in the interpolation.
As stated above, we are using XBeach, the Kingsday Release (Roelvink et al., 2015). As such, a clarification is in order based on a comment from a reviewer of the Letter of Intent previously submitted to Sea Grant. The comment was that “XBeach only provides an estimate of infragravity, not incident, waves”. That’s no longer true in the Kingsday Release. This was one of three additional details being requested. The others are:
1. How the model is being applied (1D/2D). Answer: 2D
2. How MOMs are being translated into time series inputs required by XBeach which should include the ramp up and ramp down of a storm. Answer: As mentioned above, we are using the XBeach option of supplying input boundary conditions using the Parameterized Spectrum option in XBeach (see Manual, page 44).
3. Whether tides are being included and what phase. Answer: As described at the beginning, the waves are to be propagated on top of the previously computed (by ADCIRC+SWAN) stillwater elevations. These elevations were obtained using NOAA’s tsunami, 10 m resolution, DEMs which are given relative to MHW. That is, we assume that the MHW elevation remains fixed in time.
4. Acknowledgment that XBeach only provides an estimate of infragravity, not incident, wave runup. Answer: This was answered above, and it can be verified in the manual (Roelvink et al., 2015), page 14, Section 2.2.3. Non-hydrostatic mode (wave resolving), 4th paragraph.
It should be stated that we will not be implementing the option for changing geomorphology, nor sediment transport, which is possible in XBeach. The capability of XBeach on this issue (impact on dunes) has been documented in many papers. This is done for the purpose of expediting the process. For now what we want to do is to have more realistic coastal flooding maps due to hurricanes, by the inclusion of wave runup/overtopping. Storm surges in islands like Puerto Rico (by this it is meant stillwater elevations) tend to be relatively small, and the inland flooding due
to wave runup/overtopping plays a more important role than elsewhere. Papers in which XBeach runup/overtopping capabilities have been tested are: McCall et al. (2014), Vousdoukas et al. (2012), Stockdon et al. (2014), Barnard et al. (2012), Pinyol et al. (2015), Souza et al. (2013), Damlamian and Kruger (2013), Williams et al. (2015), Gallien (2016), Barnard et al. (2014), Gracia et al. (2014), Quataert et al. (2015), Van Rooijen (2015), Damlamian et al. (2013), Valchev et al. (2014), Wiiliams et al. (2014), Cohn and Ruggiero (2016), and many others. It should be emphasized that it is being used in the design of coastal defenses, and in storm coastal impact forecasting systems. And that in many of the references XBeach is forced by SWAN.
At present we are running XBeach in a 640 Processing Elements (PE) cluster at our Physical Oceanography Laboratory, and a computational grid like the one shown in Figure 5, with cells of 2.5 by 2.5 m resolution, takes on the order of one (1) day of wall clock time. This is being repeated for the whole island for the five SuperMOMs of hurricane categories we have computed. Figure 5 shows the SS due to a Cat 1, but no wave runup yet. Figure 6 shows after wave runup. As expected, the extent of inland flooding increases.
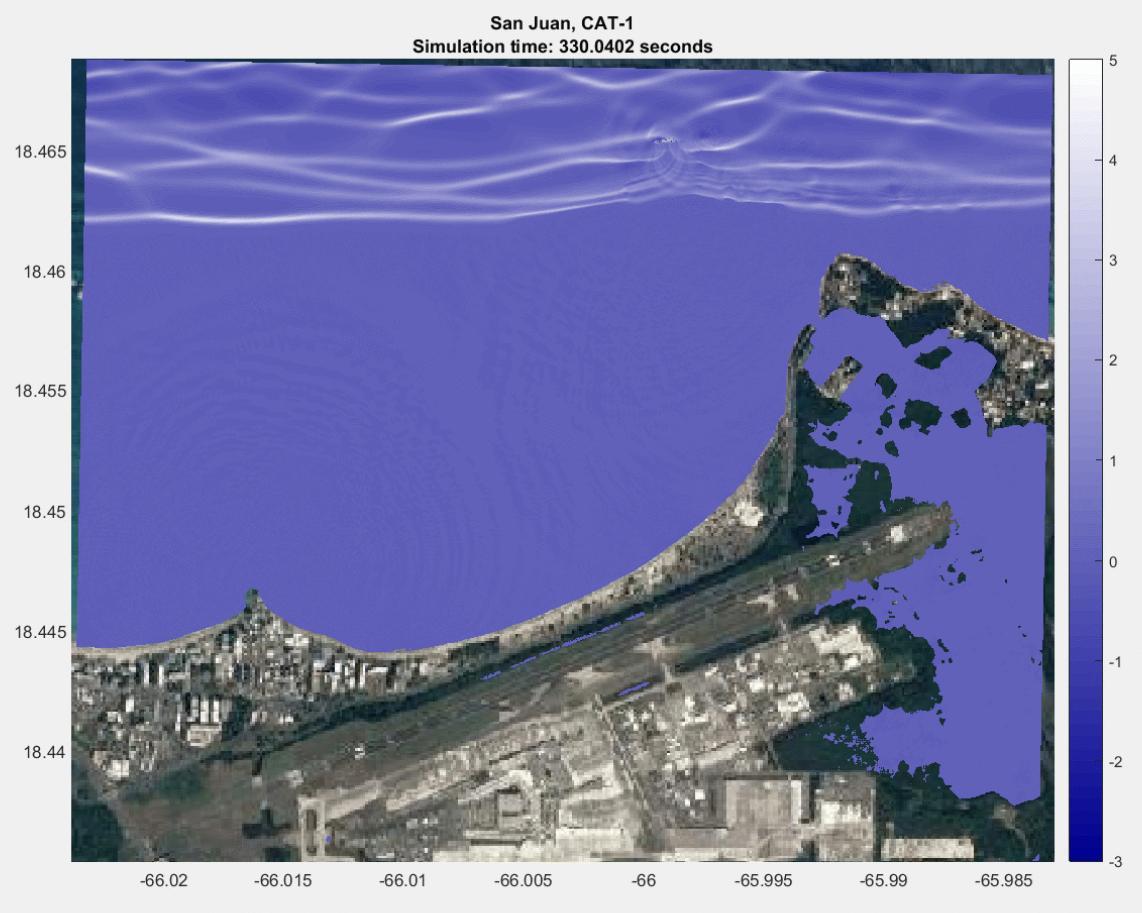
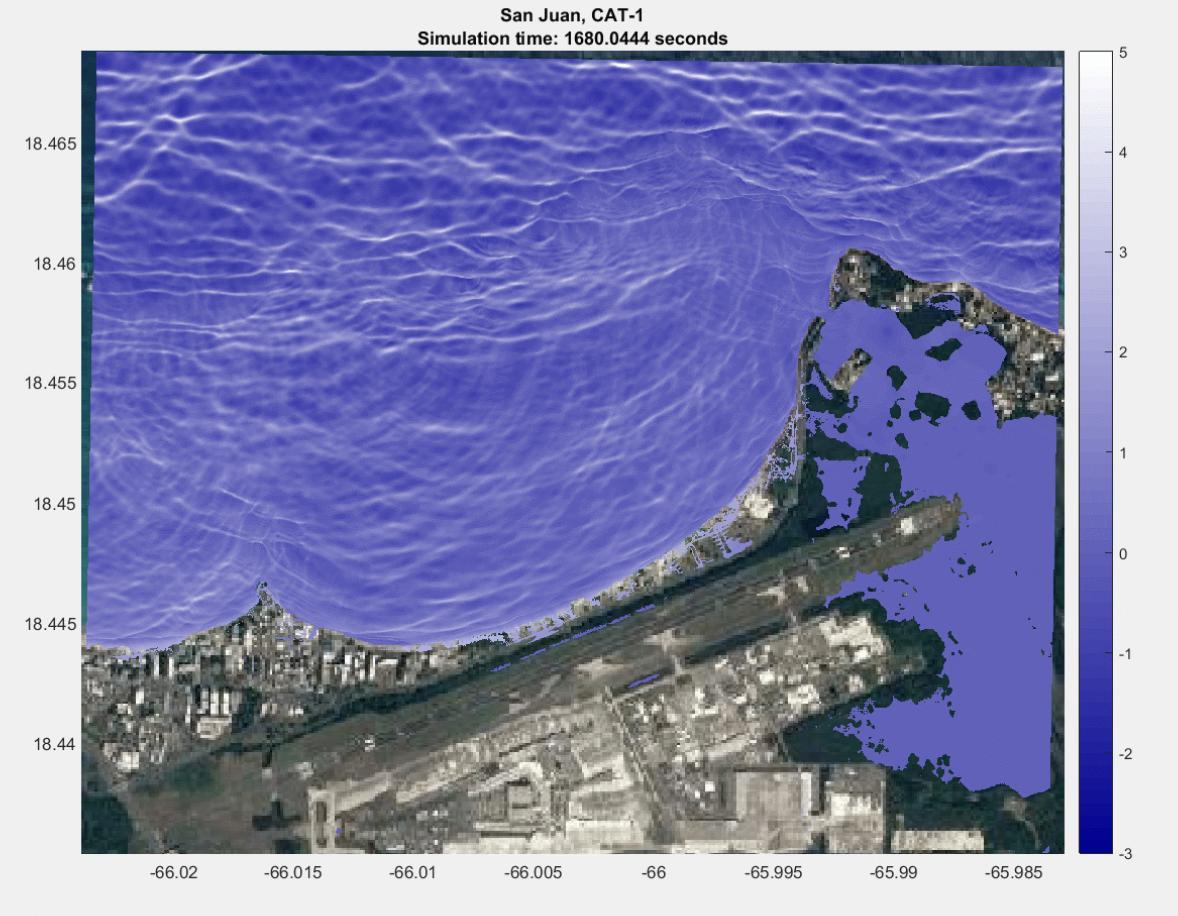
Therefore, the whole island will be broken into parts and XBeach run in each part. For each part we will use the DEMs mentioned above. And for each part we will use as initial base flood elevations over which the waves are propagated, the data from the SuperMOMs mentioned above. This will include the storm surge elevations, and also a typical calculated (by SWAN) Significant Wave Height (Hs) and Peak Wave Period (Tp), for that coastal section as output by ADCIRC+SWAN. Hs and Tp will be used to estimate a wave 2-D spectrum used to force the model. The model will then internally compute time series to force the wave generator. To simplify things we will assume, as much as possible, a normal to the coastline propagation direction. This should give maximum runups and overtoppings. Results similar to Figure 5 will be produced all around the island, and an island wide full mosaic of the results will be prepared from which we will extract Shapefiles and KMZ files showing the inland penetration of the runup/overtopping. These results will be made available through the page http://coastalhazardspr.wordpress.com.
FACILITIES
As mentioned above, at our computing facilities we have a new cluster, consisting of 10 blades with 64 PEs per blade, running Linux (a total of 640 PEs; it was used to run ADCIRC+SWAN in a matter of 2 hours per hurricane track. And as part of the just started PRCZMP project (the one
which produced Figure 5) we will acquire at least one additional blade, so by the start of this project we will have at least 11 blades (704 PEs).
We also have a 48 PEs Linux workstation, and two smaller Linux workstations for data pre- and post-processing. And also a Windows PC with 8 i7 PEs dedicated just for program executions and pre- and post-processing.
All computers run Portland Graphics Fortran compilers (including MPI and OpenMP), and all have Matlab licenses. We have several Network Attached Storage (NAS) hard drives (tens of TBs; recall that we do tsunami simulations for the Puerto Rico Seismic Network). These facilities will be upgraded if we are awarded this proposal.
ANTICIPATED BENEFITS
What we are trying to do in this project is simply to be able to supply to the relevant authorities in the island more realistic coastal flooding maps due to storm surges. Mercado (1994) presented storm surge maps that only included the potential flooding due to stillwater, with (static) wave setup included by intelligent guessing. Nowadays, advances in software, and better hardware, has allowed for the inclusion of (static) wave setup. But at least in Puerto Rico, no dynamic (infragravity waves, and wind waves propagating on top) wave setup has been included, and all of the coastal planning and management community, and emergency management efforts, will benefit from the inclusion of wave runup and overtopping.
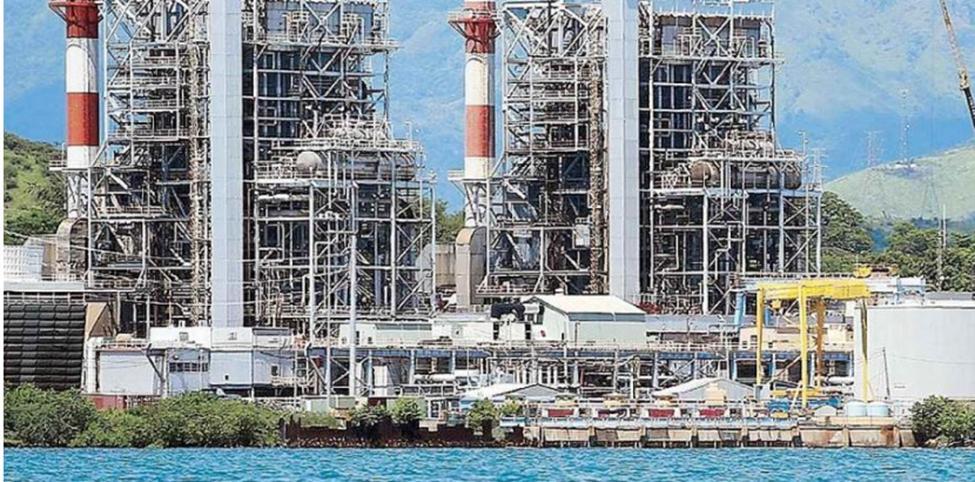
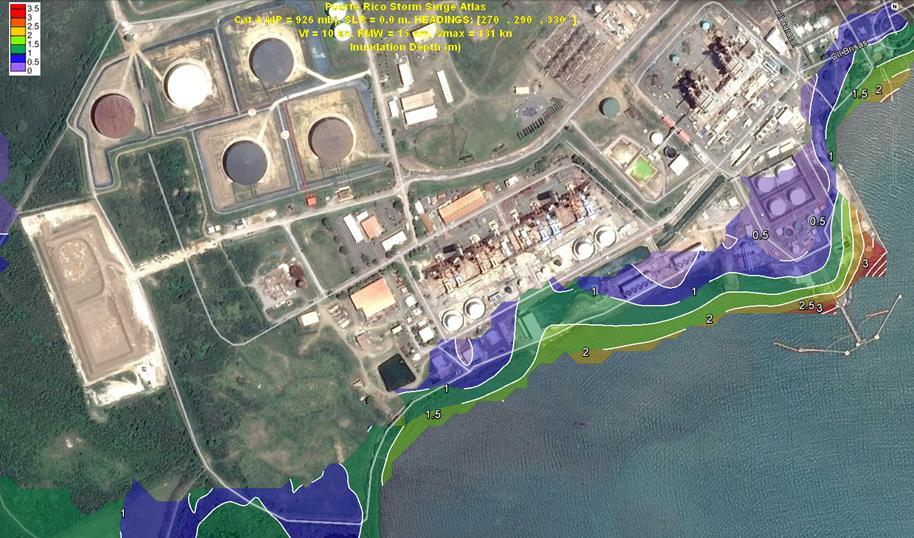
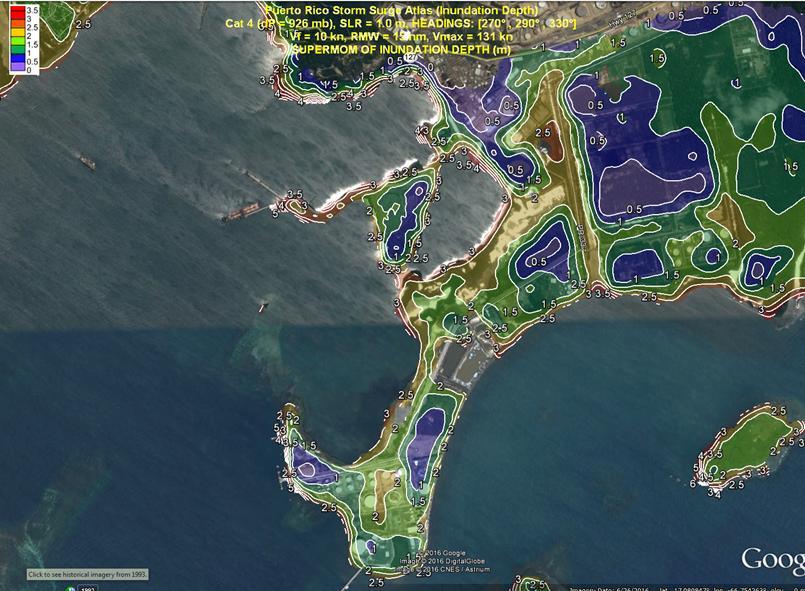
Storm surges are one of the main threats to Puerto Rico. And it is an annual threat. The potential impact of this threat grows every year because of sea level rise, now at a pace of 1 cm/year since 2010 (see http://coastalhazardspr.wordpress.com). Aside from the critical facility which is our International Airport (which is being threatened already by sea level rise), all of our electric power plants are on the coast and, thus, exposed to storm surge flooding (see Figures 7, 8 and 9). Figure 1 above shows the exposure of the international airport. It is of utmost importance to include wave runup/overtopping in these flood maps in order to have a more precise estimate of what can be expected for the forecasted sea level rise conditions by the end of this century. The same holds for other critical facilities located near the coast. It is well known that the FEMA maps underestimate the hazard due to storm surges (CoreLogic Storm Surge Risk Reporthttp://www.corelogic.com/about-us/researchtrends/storm-surge-report.aspx#.WCjEC2frtaQ), and in an island for which it has been shown that wave runup plays a very important role in the overall coastal flooding, estimating the stillwater elevations alone could underestimate the risk.
The present SS maps are being widely used based on the amount of petitions to download them. Personnel from the Sea Grant Program in Puerto Rico are using them for their talks to the communities. Both federal and state agencies will benefit from the finalized product. Actually, right now they are the only guidance available for the case of an intense hurricane threatening the
island. As part of a team of a Southeastern Universities Research Association (SURA) benchmark project, I am aware of the problems the National Weather Service is having in including wave modeling (and thus, static wave setup) in their SLOSH storm surge model, not to say wave runup and overtopping.
The original SS maps (Atlas) were presented to the Puerto Rico Emergency Management Agency in a training workshop, sponsored by CariCOOS. Once finalized with the inclusion of wave runup the PRCZMP will ask FEMA to adopt them as non-regulatory coastal flood maps (Ernesto Diaz, PRCZMP Administrator, personal communication).
See http:/coastalhazards.uprm.edu.
The results from this work will serve to increase public safety, promote environmental sustainability, improve public policy and management decisions, and supply another tool for coastal planning under the scenario of sea level rise (including present conditions). Recent reports (Sweet et al., 2017; Mercado, 2017) suggest that the +1.0 m barrier of sea level rise is quite probable to be broken sometime before the end of this century, and now the new “High” scenario for +2100 is 2.0 – 2.5 m rise. Mercado (2017) shows evidence not only of a long-term continuous acceleration in sea level rise (starting approximately in 2001), but also of a more recent acceleration starting approximately in 2010 – 2011. This data can be found at web page listed above. Having more realistic coastal flood maps will help in the planning of our very crucial coastal infrastructure.
Finally, having the local capabilities of forecasting areas in the island more prone to coastal inundation not necessarily associated with the passage of a hurricane, like winter storms, due to wave runup and overtopping is something that local National Weather Service personnel is highly interested (E. Rodriguez, personal communication).
PROJECT LEADERSHIP AND PERSONNEL
Principal Investigator:
Aurelio Mercado-Irizarry, MS, Full Professor, Department of Marine Sciences, University of Puerto Rico, Mayaguez, PR Telephone: 787-265-5461 (direct office line); 787-429-4506 (cellular)
A clarification is warranted based on a reviewer’s comment. The PI will ask for the equivalent of 3 credits release time (1/4th of his full load), which is standard practice. And is considered as matching funds. This means that the PI, and his assistant, will be involved from day one in the project, something which has been done for more than 37 years.
Assistant and Support Personnel:
Harry Justiniano, IT Technician and Programmer (works full time for me), Department of Marine Sciences, University of Puerto Rico, Mayaguez, PR; Telephone: 787-832-4040 x 3201
Graduate Student
I have a Ph.D. student, Mr. Jaime Reniel Calzada) who lives and work in Maryland for a NOAA private contractor, ERT Co., who I will contracting for help in the modeling.
DATA SHARING PLAN
There will be no environmental data output from this project. Just computer values that will be expressed via maps. These maps, as presently done for the present storm surge maps, and the tsunami maps produced in this laboratory, will be made accessible to the public by just connecting to http://coastalhazards.uprm.edu. And also via the Sea Grant web page.
REFERENCES
Barnard, P. L., B. O’Reilly, M. van Ormondt, E. Elias, P. Ruggiero, L H. Erikson, C. Hapke, B. D. Collins, R. T. Guza, P. N. Adams and Julie Thomas, 2009. The Framework of a Coastal Hazards Model A Tool for Predicting the Impact of Severe Storms. Coastal Hazards Task of the USGS Multi-Hazards Demonstration Project in Southern California. Open File Report 2009–1073. USGS.
Barnard, P., M. van Ormondt, L. H. Erikson, J. Eshleman, C. Hapke, P. Ruggiero, P. N. Adams, A. C. Foxgrover, 2014. Development of the Coastal Storm Modeling System (CoSMoS) for predicting the impact of storms on high-energy, active-margin coasts. Natural Hazards. 74(2):1095-1125.
Bertin, X., K. Li, A. Roland, and J. R. Bidlot, 2015. The contribution of short waves in storm surges: Two case studies in the Bay of Biscay. Cont. Shelf Res., 96:1-15.
Bilskie, M. V., S. C. Hagen, K. Alizad, S. C. Medeiros, D. L. Passeri, H. F. Needham, and A. Cox, 2016. Dynamic simulation and numerical analysis of hurricane storm surge under sea level rise with geomorphologic changes along the northern Gulf of Mexico. Earth’s Future, 4:177-193.
Bolle, A., P Mercelis, D Roelvink, P Haerens, and K Trouw, 2010. Application and validation of XBeach for three different field sites. Proc. Coastal Eng. Conf, 32.
Cheung, K. F., A. C. Phadke, Y. Wei, R. Rojas, Y. J. M. Douyere, C. D. Martino. S. H. Houston, P. L.-F. Liu, P. J. Lynett, N. Dodd, S. Liao, and E. Nakazaki, 2003. Modeling of storm-induced coastal flooding for emergency management. Ocean Eng., 30:1353-1386.
Cohn, N. and P. Ruggiero, 2016. The influence of seasonal to interannual nearshore profile variability on extreme water levels: Modeling wave runup on dissipative beaches. Coastal Engineering, 115:79-92.
Damlamian, H. and J. Kruger, 2013. 2D Coupled Hydrodynamic Spectral Wave Model of Rangiroa.The 1983 Orama–Nisha Tropical Cyclone. SPC SOPAC technical REPORT (PR166).
Damlamian, H., J Kruger, M Turagabeci and Salesh Kumar, 2013. Cyclone Wave Inundation Models for Apataki, Arutua, Kauehi, Manihi and Rangiroa Atolls, French Polynesia. SPC SOPAC Technical REPORT (PR176).
Gallien, T., W., 2016. Validated coastal flood modeling at Imperial Beach, California: Comparing total water level, empirical and numerical overtopping methodologies. Coastal Engineering, 111:95-104.
Gorrell, L., B. Raubenheimer, S. Elgar, and R. T. Guza, 2011. SWAN predictions of waves observed in shallow water onshore of complex bathymetry. Coastal Enginnering, 58:510-516.
Gracia, V., M. García-León, A. Sánchez-Arcilla, J. Gault, P. Oller, J. Fernández, A. Sairouní, E. Cristofori, R. Toldrà, 2014. A new generation of early warning systems for coastal risk. The icoast project. Proc. Coastal Engineering, No. 34.
Kennedy, A. B., J. J. Westerink, J. M. Smith, M. E. Hope, M. Hartman, A. A. Taflanidis, S. Tanaka, H. Westerink, K. F. Cheung, T. smith, M. Hamann, M. Minamide, A. Ota, and C. Dawson, 2012. Tropical cyclone inundation potential on the Hawaiian Islands of Oahu and Kauai. 52-53:54-68.
Kim S. Y., T. Yasuda, H. Mase, 2010. Wave set-up in the storm surge along open coasts during Typhoon Anita. Coastal Eng. 57:631-642.
Kleinosky, L. R., B. Yarnal, and A. Fisher, 2007. Vulnerability of Hampton Roads, Virginia, to storm surge flooding and sea level rise. Natural Hazards, 40:43-70.
Li, N., V. Roeber, Y. Yamazaki, T. W. Heitmann, Y. Bai, and K. F. Cheung, 2014. Integration of coastal inundation modeling from storm tides to individual waves. Ocean Modelling, 83:26-42.
Lin, N., K. Emanuel, M. Oppenheimer, and E. Vanmarcie, 2012. Physically based assessment of hurricane surge threat under climate change. Nature Clim. Change, 2:462-467.
McCall, R. T., G. Masselink, T.G. Poate, J.A. Roelvink, L.P. Almeida, M. Davidsona, P.E. Russell, 2014. Modelling storm hydrodynamics on gravel beaches with XBeach-G. Coastal Engineering. 91:231-250.
Mercado, A., 1994. On the use of NOAA’s storm surge model, SLOSH, in managing coastal hazards: the experience in Puerto Rico., Natural Hazards, 10:235-246.
Mercado, A., 2017. Sea level rise around Puerto Rico: A projection. Report submitted to the Puerto Rico Climate Change Council and to the 4th National Climate Assessment, Caribbean Region, US Global Change Research Program.
Pinyol, J., M. Garcia Leon, M. Gonzalez, J. Lin Ye, P. Oller, V. Gracia Garcia, A. SánchezArcilla, 2015. Metodología para la delimitación de la zona de inundación del oleaje en el mapa para la prevención de riesgos geológicos de Cataluña Universitat Politecnica de Catalunya.
Quataert, E., C. Storlazzi, A. van Rooijen, O. Cheriton, and A. van Dongeren, 2015. The influence of coral reefs and climate change on wave-driven flooding of tropical coastlines. Geophys. Res. Lett.,
Roelvink, D. J. A., A. van Dongeren, R. T. McCall, and A. van Rooijen, 2015. XBeach Technical Reference: Kingsday Release. Deltares.
Rodriguez, R. W., R. M. T. Webb, and D. M. Bush, 1994. Another look at the Impact of Hurricane Hugo on the Shelf and Coastal Resources of Puerto Rico, U.S.A. J. Coast. Res., 10(2):278-296.
Smith, J. M., M. A. Cialone, T. V. Wamsley, and T. O. McAlpin, 2010. Potential impact of sea level rise on coastal surges in southeast Louisiana. Ocean Eng., 37:37-47.
Souza, A. J., M. Brown, J. J. Williams, and G. Lymbery, 2013 Application of an operational storm coastal impact forecasting system. Journal of Operational Oceanography. 6(1):23-26
Stockdon, H. F., D.M. Thompson, N.G. Plant, J.W. Long, 2014. Evaluation of wave runup predictions from numerical and parametric models. Coastal Engineering. 92:1-11.
Sweet, W. V., R. E. Kopp, C. P. Weaver, J. Obeysekera, R. M. Horton, E. R. Thieler, C. Zervas, 2017. Global and Regional Sea Level Rise Scenarios for the United States. NOAA Tech. Rep. NOS CO-OPS 083.
Van Rooijen, A. A., J. S. van Thiel de Vries, R. T. McCall, A. van Dongeren, J. A. Roelvink, and A. J. Reniers, 2015. Modeling of wave attenuation by vegetation with XBeach. Proc. 36th IAHR World Congress, The Hague.
Williams, J. J., L. S. Esteves, T. Conduche, P. Barber, and A. Tindle, 2014. Using Combined Modelling Approaches to Improve Coastal Defence Design: a case study at Hopton, UK. J. Coastal Res., Special Issue No. 70:18-23.
Williams, J. J., L. S. Esteves, and L. A. Rochford, 2015. Modelling storm responses on a highenergy coastline with XBeach. Modeling Earth Systems and Environment, 1:3.
Valchev, N., N. Andreeva, P Eftimova, E Trifonova, 2014. Prototype of early warning systemfor coastal storm hazard (bulgarian black sea coast). C R Acad Bulgaria.
Vousdoukas, M. I., Ó. Ferreira, L. P. Almeida, A. Pacheco, 2012. Toward reliable storm-hazard forecasts: XBeach calibration and its potential application in an operational early-warning system. Ocean Dynamics, 62(7):1001-1015.
