















This work is licensed under a CC BY-NC-ND 4.0 International License. This license enables reusers to copy and distribute the material in any medium or format in unadapted form only, for noncommercial purposes only, and only if attribution is given to the creator.
Dear Carbon-based Lifeform,
Welcome to the curious and complex world of carbon. It forms the backbone of our DNA, is key to life-maintaining processes like photosynthesis and respiration and drives our industries. Our ability to control and manipulate carbon, whether as charcoal, oil, or plastic, has revolutionised every aspect of the way we live. From medicine and machinery to architecture and art, the sooty fingerprints of carbon are visible on almost everything humanity has built.
This activity handbook is a learning resource designed to engage you with the many forms of carbon found in our everyday lives. Inside, you’ll find a variety of experiments, projects, and even recipes that you can try both in the classroom and outdoors. Dive into the science of carbonation by experimenting with fizzy drinks, or find out how much carbon is stored in trees on a nature walk. Explore the unique properties of the carbon found in pencils. Get creative with valency and chemical bonds by making your own element embroidery art!
Create, experiment and observe carbon in the world around you through these activities that we have put together for you. Don’t forget to share your findings and creations with us at: learning@bengaluru.sciencegallery.com
Warmly, Science Gallery Bengaluru
CARBON was an exhibition by Science Gallery Bengaluru. You can explore the digital version of the exhibition at: https://bengaluru.sciencegallery.com/carbon-archive
v








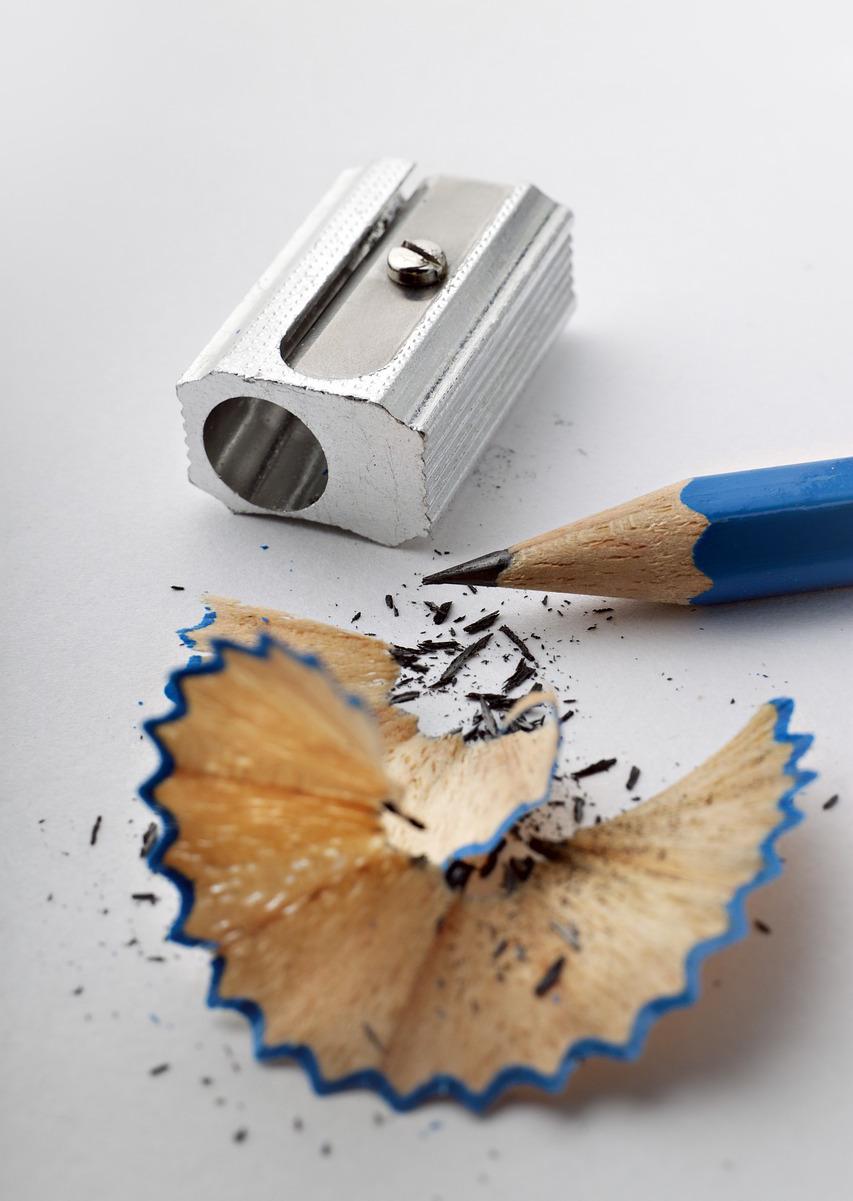
It is 100 times stronger than ordinary steel. It is a better electrical conductor than copper. It is only as thick as a single layer of atoms. And you can find it in pencils. Yes, you heard that right! This fantastical material is none other than graphene. Pencils contain graphite, which is made of many stacked layers of graphene.1
In 2010, physicists Andre Geim and Konstantin Novoselov won the Nobel Prize in Physics for their work on graphene. Using commonly available tape, they peeled off layer after layer from a piece of graphite until the strip was as thin as a single atom. That single-layer material was graphene.2 For comparison, a single strand of hair is around as thick as 7,00,000 atoms.
The potential applications of graphene are vast and span a diversity of fields, from biomedical to electronics. Its exceptional conductivity could greatly enhance computing power in electronic devices. Graphene-based transistors show improved sensitivity and conductivity compared to traditional silicon-based ones, thanks in part to their ultra-thin design.3
It doesn’t stop there. Roll up a sheet of graphene into a tube, and you have a carbon nanotube. These strong fibres can strengthen textiles, be used to make vascular stents, and be used to create conductive plastic.4 Carbon nanotubes have been used to produce the blackest substance we know: a shade of paint called Vantablack, a coveted and controversial material.5
In this activity, explore the properties of graphene, and imagine the world at the nanoscale with the help of a simple circuit.
1 Science and Industry Museum, 2021.
2 Ed Gerstner, 2010.
3 Wassei and Kaner, 2010.
4 Nguyen and Nguyen, 2016.
5 Rogers, 2017.
MATERIALS REQUIRED:
1. Pencil (preferably 9B pencil)
2. Paper
3. Insulated copper wires
4. 9V Battery
5. LED
6. Switch (optional)
Step 1: Create a simple test circuit by connecting a battery to an LED with wires.


Step 2: Use a pencil to scribble two lines on a paper. Make sure they are thick and even. Thicker pencil shading contains more graphite and therefore conducts electricity better.
How to use a switch in a circuit?
A switch typically consists of three terminals. The middle terminal is the input and the other two are outputs. The wire coming from the positive terminal of the battery should be connected to the middle terminal and the wire going to the negative terminal of the battery can be connected to any one of the side terminals.
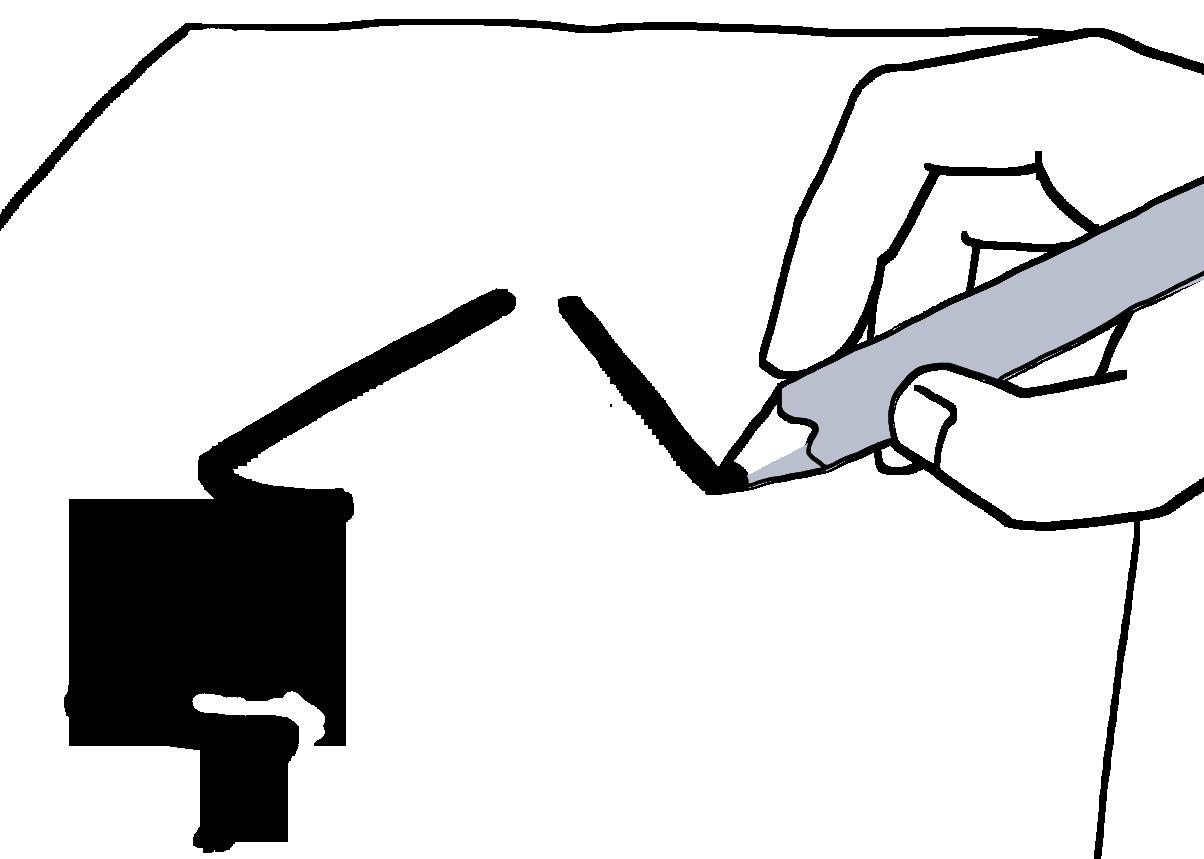
Step 3: Connect one end of the lines on the paper to the LED. Connect the other end of the lines to the two wires. Then, connect the wires to the battery to complete the circuit. Observe what happens.
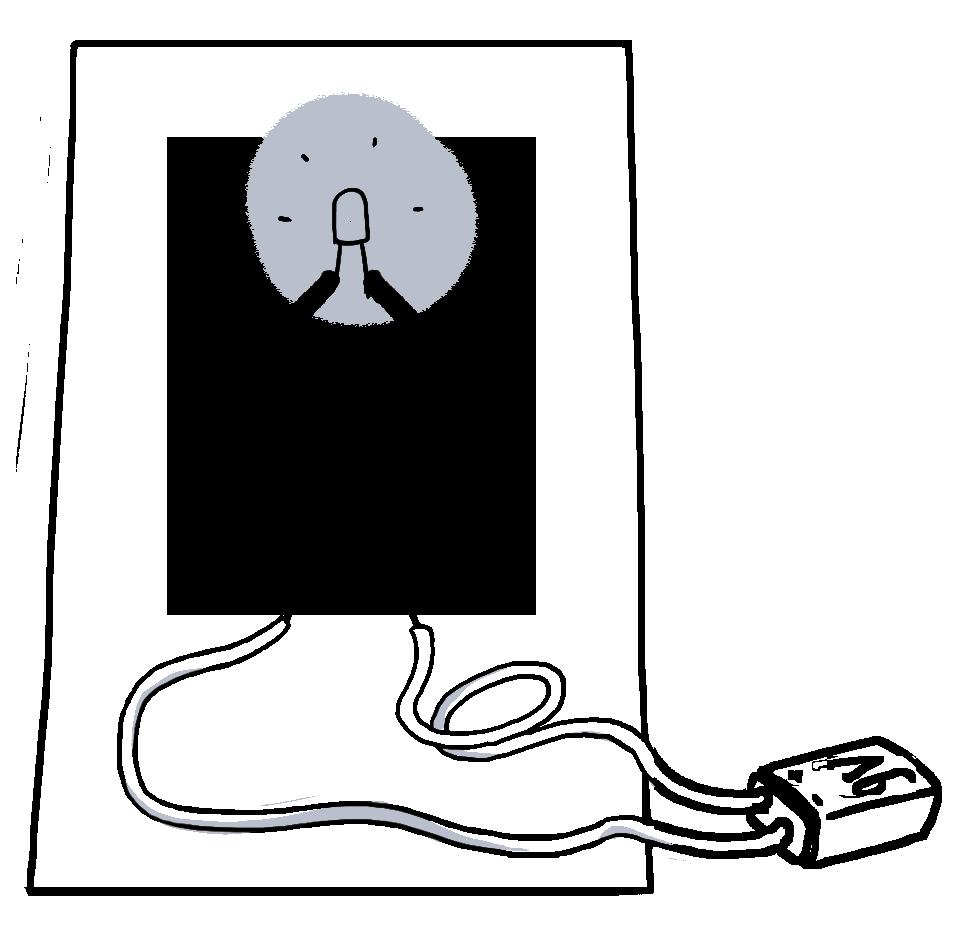
Try using different pencil types (HB, 2B, 8B, etc.). Does the LED light up with each type? What differences do you notice and why might that be?
1. Tools built to visualise the nanoscale can give us an unprecedented look into a world imperceptible to human senses. A Scanning Electron Microscope (SEM) is one such tool used to visualise the surface of objects at a nanoscale resolution. You can use this online tool to view common objects under a SEM: http://www.dartmouth.edu/~emlab/ gallery. Does this imaging tell you anything new about the objects?
2. Let’s become an Atomic Force Microscope (AFM) for a moment! An AFM also enables us to visualise surfaces on a nanoscale level. Find an object near you, close your eyes, and use a pencil or a stick to trace the shape of the object by moving in straight lines along its surface. When you’re done, draw what you imagine the object looks like on a piece of paper. This exercise mirrors how an AFM operates.
Graphene and diamonds are made entirely of carbon atoms. But carbon doesn’t stop there. it shows up in a varied range of everyday substances, from sugar to petrol. When you eat bread, you’re eating carbohydrates. When you fill up a plastic water bottle, you are drinking from a container made of hydrocarbons.6 Carbon is, quite literally, everywhere.
So why does carbon turn up in so many different molecules? The answer comes down to a property called tetravalence. Here is a quick refresher: atoms form bonds with other atoms in order to end up with eight electrons in their outermost shell. This is called the octet rule.7 Carbon starts with only four electrons in its outer shell, which means it needs four more. This makes it an excellent “connector”. It can bond with many types of atoms, and even with other carbon atoms. This gives rise to around 10 million different carbon-based compounds, plus a variety of pure carbon structures called allotropes (like graphene and diamond).
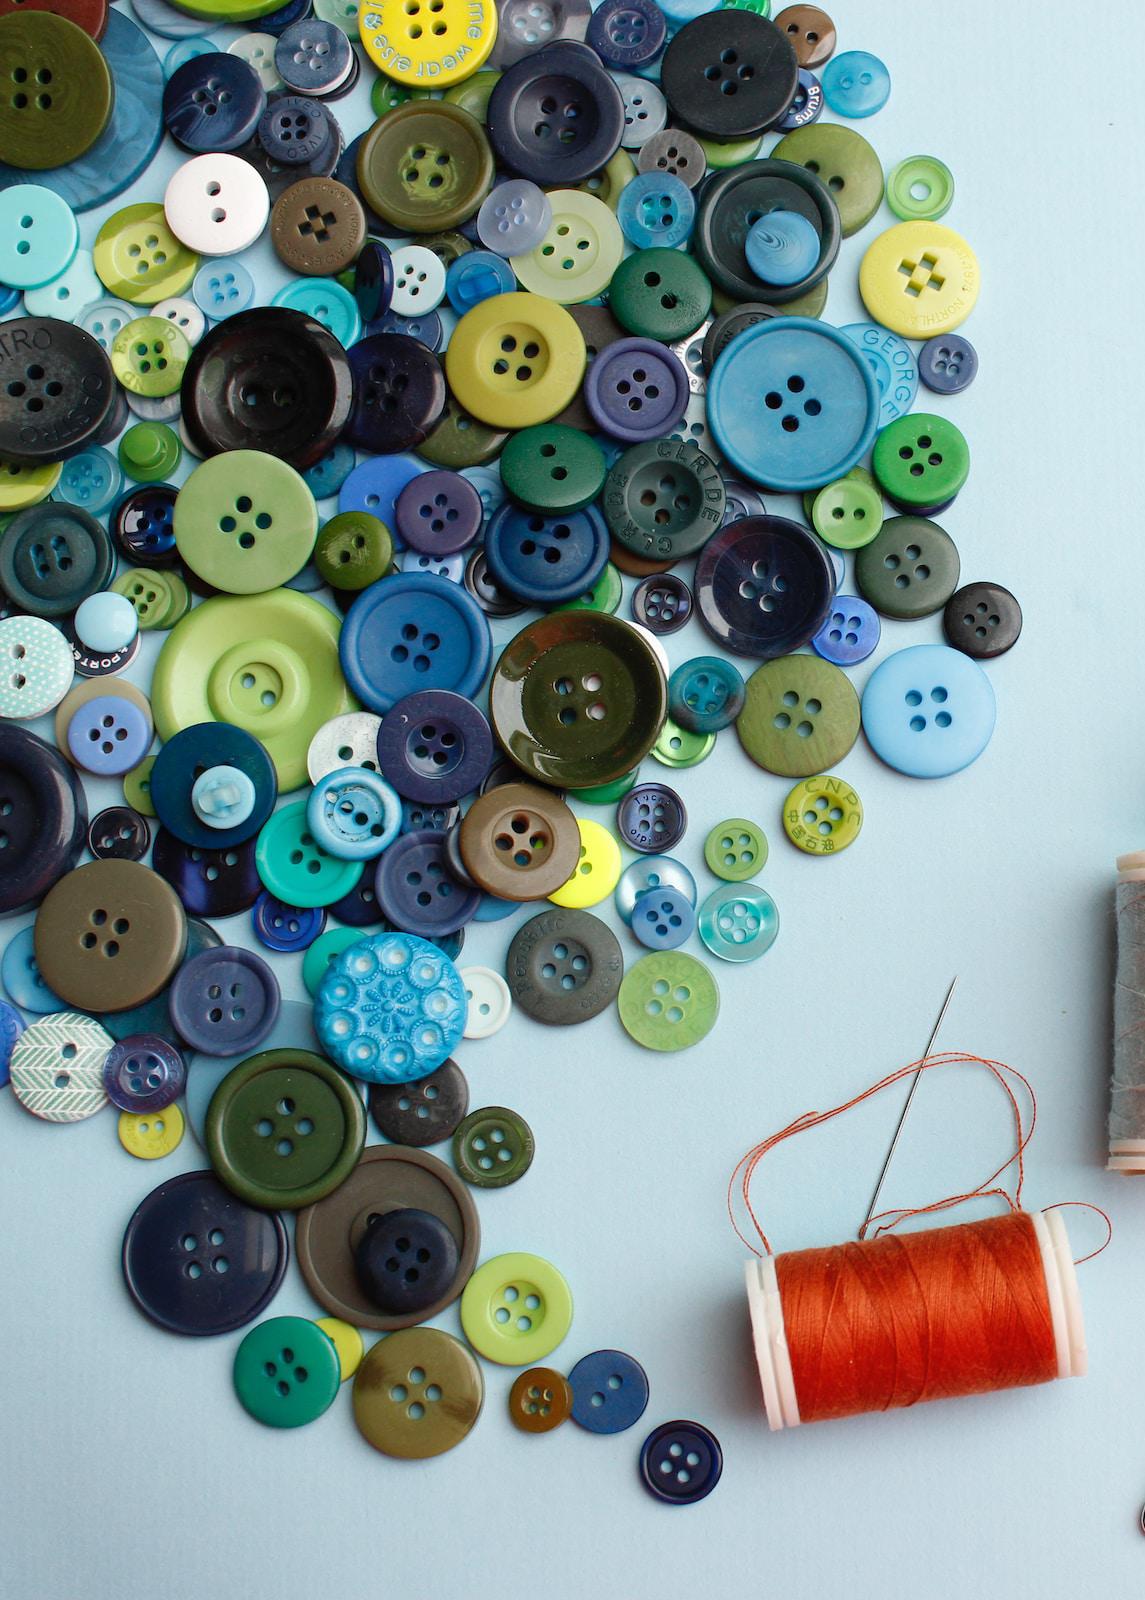
In chemistry class, we usually draw these molecules as flat, two-dimensional diagrams, with lines for bonds and letters for elements. In this activity, we take them off paper and onto cloth. We will use buttons and thread rather than letters and lines to bring these diagrams to life.
6 Hazen, 2019.
7 Pauling, 1948.
MATERIALS REQUIRED:
1. Different sized buttons (4 hole, 2 hole and 1 hole buttons, preferably of different colours)
2. Thread of any colour
3. Needle
4. Handkerchief or a plain piece of cloth
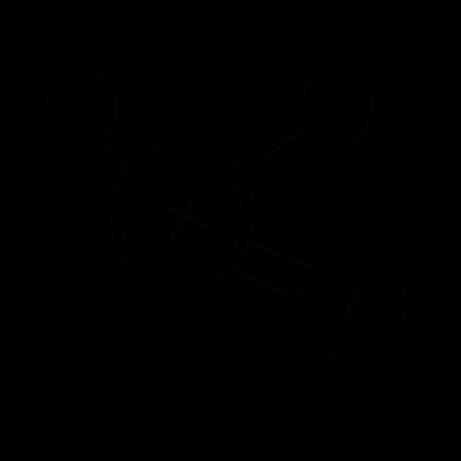
Each button type represents an element, based on the number of holes, which corresponds to that element’s valency:
4-hole button
2-hole button
1-hole button
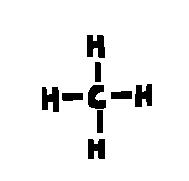
For visual reference, you may draw simple line diagrams of the molecule you want to create on a piece of paper. Here is methane:
Carbon
Oxygen
Hydrogen
Let’s build methane! Methane has one carbon atom bonded to four hydrogen atoms. So you’ll need one 4-hole button and four 1-hole buttons.
Step 1: Thread the needle with at least 20 inches of thread and tie a knot on one end.
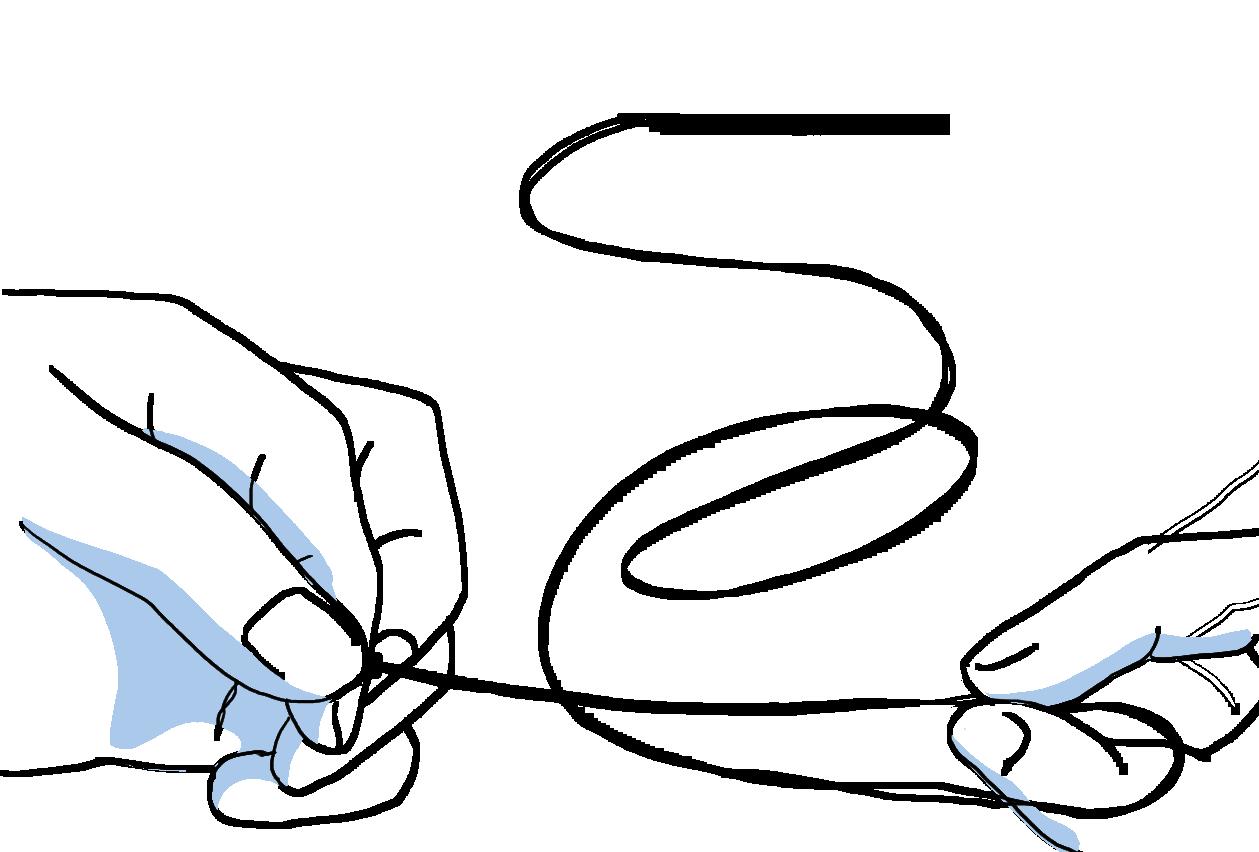
Step 2: Place the 4-hole button (carbon) on the cloth, leaving enough space around it for the four hydrogen buttons.
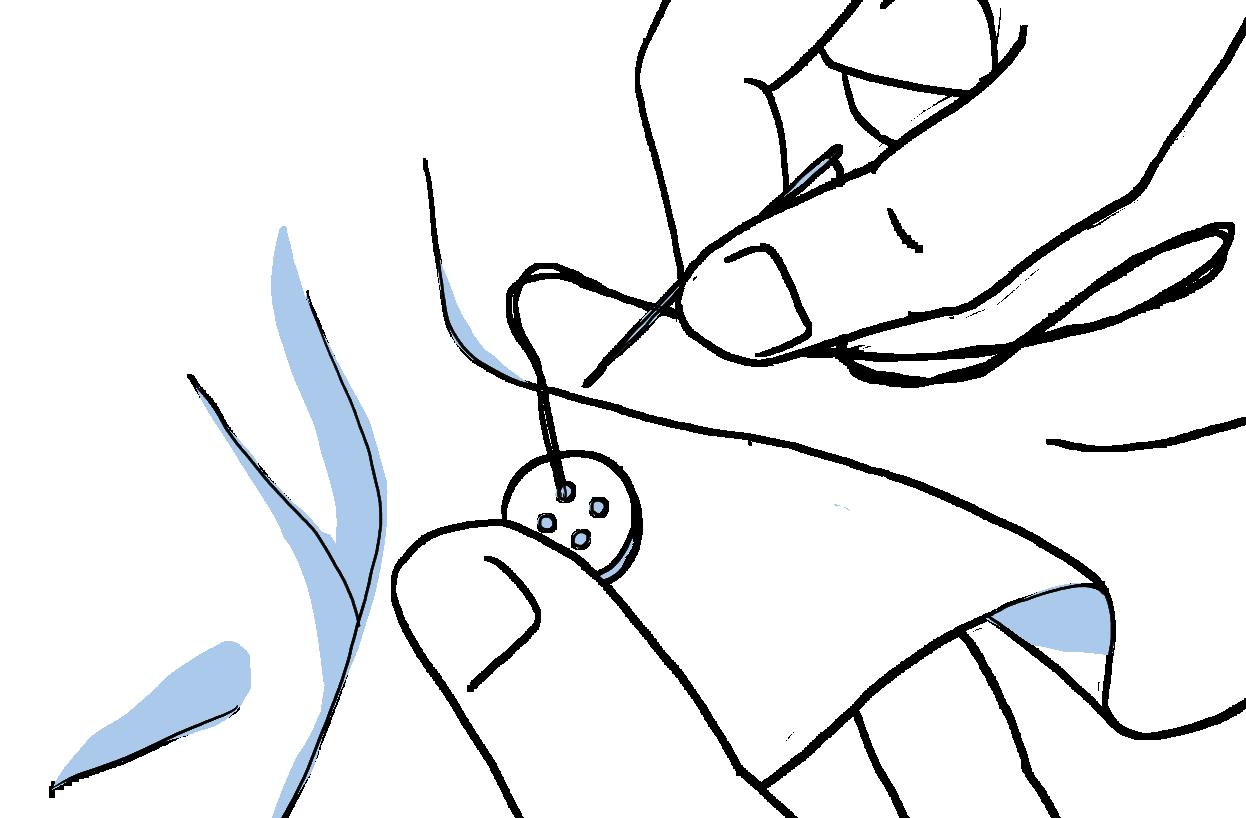
Step 3: Insert the needle up through the back of the cloth and through one hole of the carbon button, then back down through another hole. Repeat this action to secure the button firmly in place.


Step 4: Using the same stitching method, attach four 1-hole buttons (hydrogen) around the carbon button.

Step 5: Making the bonds
Bring the needle up through the cloth right next to the carbon button. Run the thread across to one of the hydrogen buttons and push the needle back down right next to it. This thread is your bond!
To make it more visible, bring the needle back up next to the hydrogen button, then run it along the same path to the carbon button.
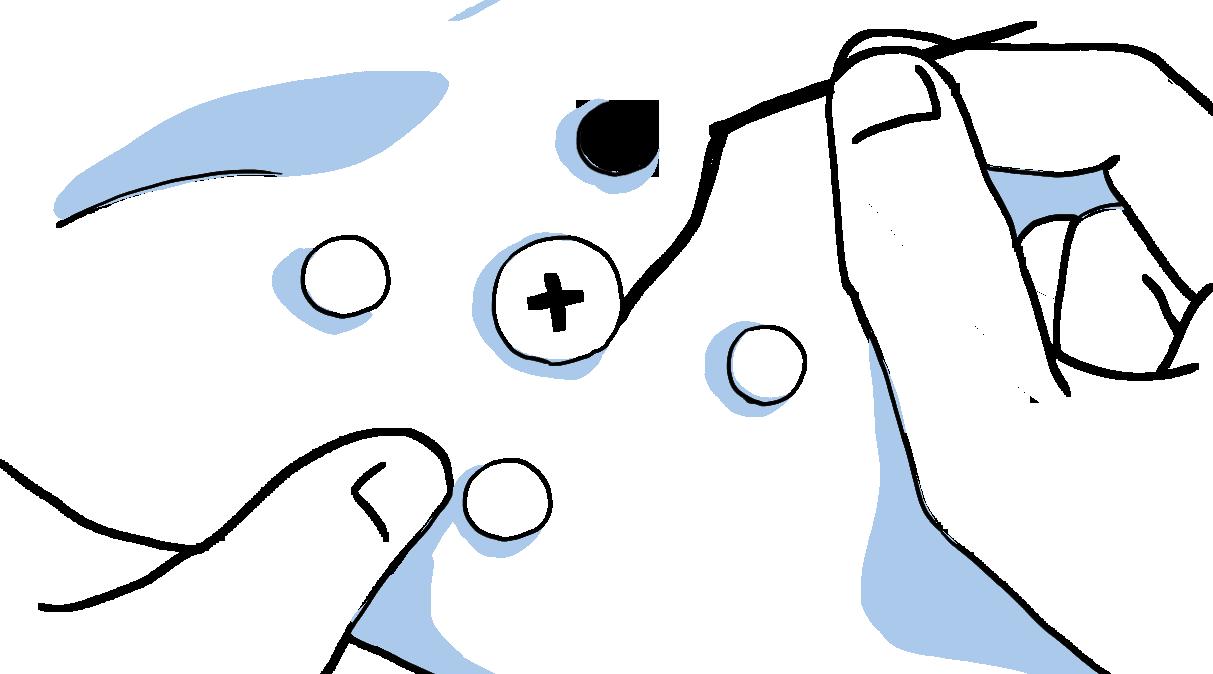

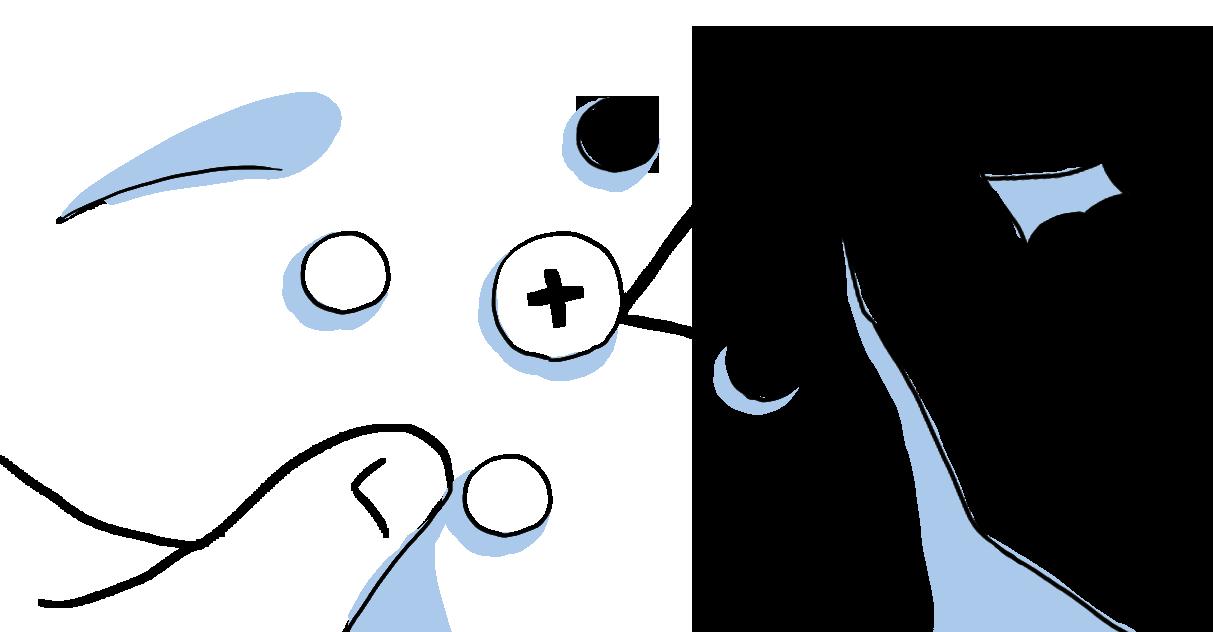
Step 6: Repeat Step 5 for each hydrogen button until all four bonds are complete.
Your methane molecule is now ready!

1. Draw the line diagram of any molecule with atoms of valency 4, 2 and 1 and create your own element embroidery! Here are some examples:
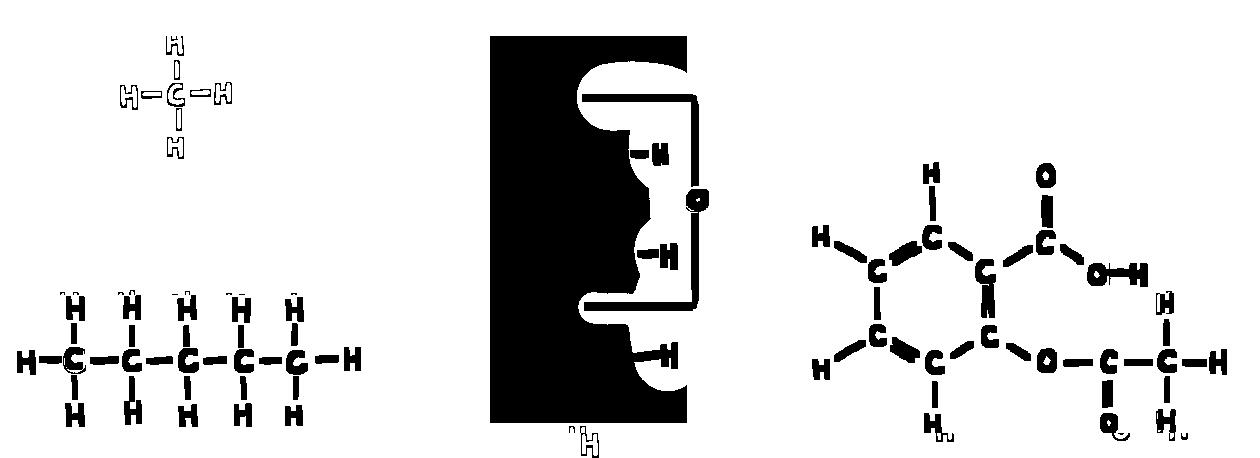
2. Scatter a few 4-hole buttons on a piece of cloth randomly and try to connect them to each other, following the rules of valency. Do you think such unstructured forms of carbon could exist in nature? If so, how are they different from the structured forms of carbon that you created in this activity?

Have you ever enjoyed a spicy meal and suddenly found yourself craving a sweet fizzy drink? Or maybe you longed for a chilled lemon soda on a hot summer day? Fizzy drinks are beloved by people of all ages around the world. They come in various flavours but are always known for their bubbly and refreshing texture. If you drink soda too quickly, you might even feel a slight sting. Interestingly, research shows that soda activates our pain receptors, which is partly why we find it enjoyable, much like the thrill of spicy food. 8
The key to the fizzy drink experience is carbon. These “carbonated” beverages are named for the bubbles created by carbon dioxide. When carbon dioxide is dissolved in water, it doesn’t fully mix and forms bubbles as it escapes.9 While carbonation in factories involves pumping carbon dioxide into water under high pressure, there are also natural carbonation processes that have long been used in culinary traditions.
Alcoholic fizzy drinks like beer have been around for centuries, but non-alcoholic options started becoming popular only in the late 1700s. India, too, has its own local fizzy drinks.10 However, as international bottling brands have flooded the market, many local brands have begun to vanish. You can almost trace the history of our country’s changing economic policies through the variations of sodas found on store shelves over the decades.
Let’s explore the science and history of fizzy drinks by trying to make our own. Fuljar soda, a street-style fizzy drink from Kerala, is known for its unique preparation and has become quite popular.
8 Wang, Chang and Liman, 2010.
9 Baguley and McDonald, 2015.
10 Gangopadhyay, 2023.
PREPARATION TIME: 5-7 minutes
MATERIALS REQUIRED:
1. Mortar and pestle or mixer
2. 1 shot glass
3. 1 big glass
INGREDIENTS: (for one serving)
1. Club soda - 500–750 mL
2. Ginger - 1 inch
3. Lemon juice - 1 tablespoon
4. Chaat masala - 1/4 tablespoon
5. Green chilli - 1/2 (adjust the quantity according to your preference)
6. Mint leaves - 8
7. Sugar - 1/2 teaspoon
8. Black salt/rock salt - 2 pinches
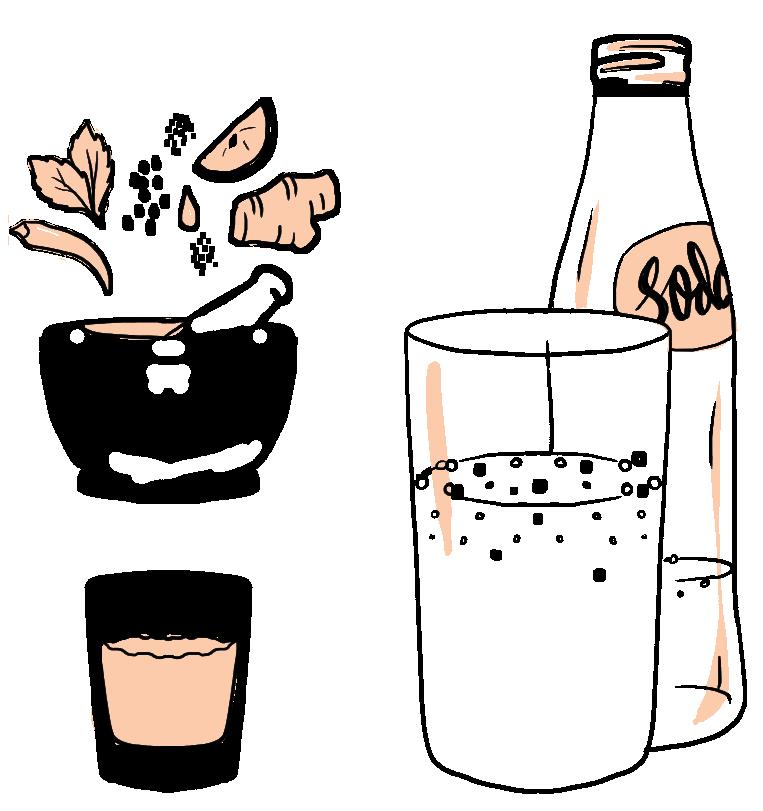
Step 1: Prepare the shot
Add mint leaves, lime juice, sugar, chaat masala, black salt, green chilli and ginger to a mortar. Use a pestle to grind the ingredients until they form a smooth paste. Transfer the paste into a shot glass. You can also blend the ingredients in a mixer grinder.
Step 2: Get the soda ready
Fill a larger glass halfway or three-quarters full with club soda. Leave some space at the top, as the soda will fizz when you add the shot.
Step 3: Let the fizzing begin!
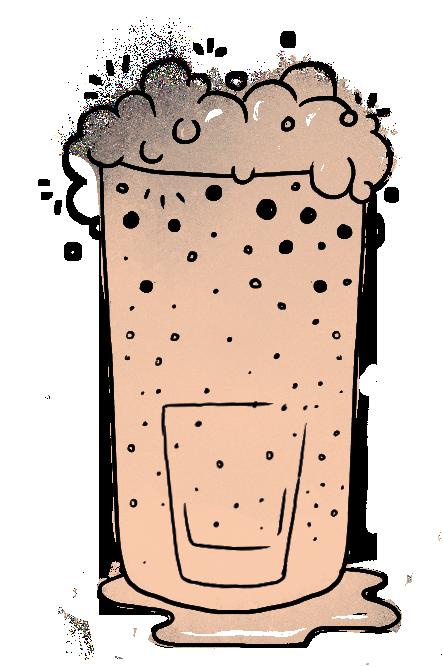
Do this in an open area since it can get a bit messy. Quickly drop the shot into the glass of soda and drink as it starts to fizz. The bubbles will rise rapidly and may overflow. Your Fuljar soda is now ready!
1
Here’s a video to help you through the process.
2
3
This fizzing reaction is similar to the popular mentos-cola experiment. When you drop something porous and rough, like mentos, into a carbonated drink, it breaks the weak bonds between the dissolved carbon dioxide and water molecules, leading to a rapid release of carbon dioxide gas or even a volcano-like eruption. Try this fun activity with various ingredients you find around you and see how they react when dropped into your favourite fizzy drink!
List the objects that you drop
Stone
Marble Salt Raisins
Did it fizz up like a volcano?
Did it simply cause more bubbles to form?
space to note your observations
Why did some objects result in a simple bubble formation while some fizzed up like a volcano? Do you think this changes with different types of fizzy drinks? Explore!
1. Fuljar soda spread all over Kerala as a refreshing summer drink. Are there similar local fizzy drinks in your area? Look for them in your local store or juice shop!
2. Are there any packaged fizzy drinks made in India? Are these brands sold only in specific regions or are they available nationwide? Based on your research, what effects do you think large global bottling companies might have on local foods and drinks?
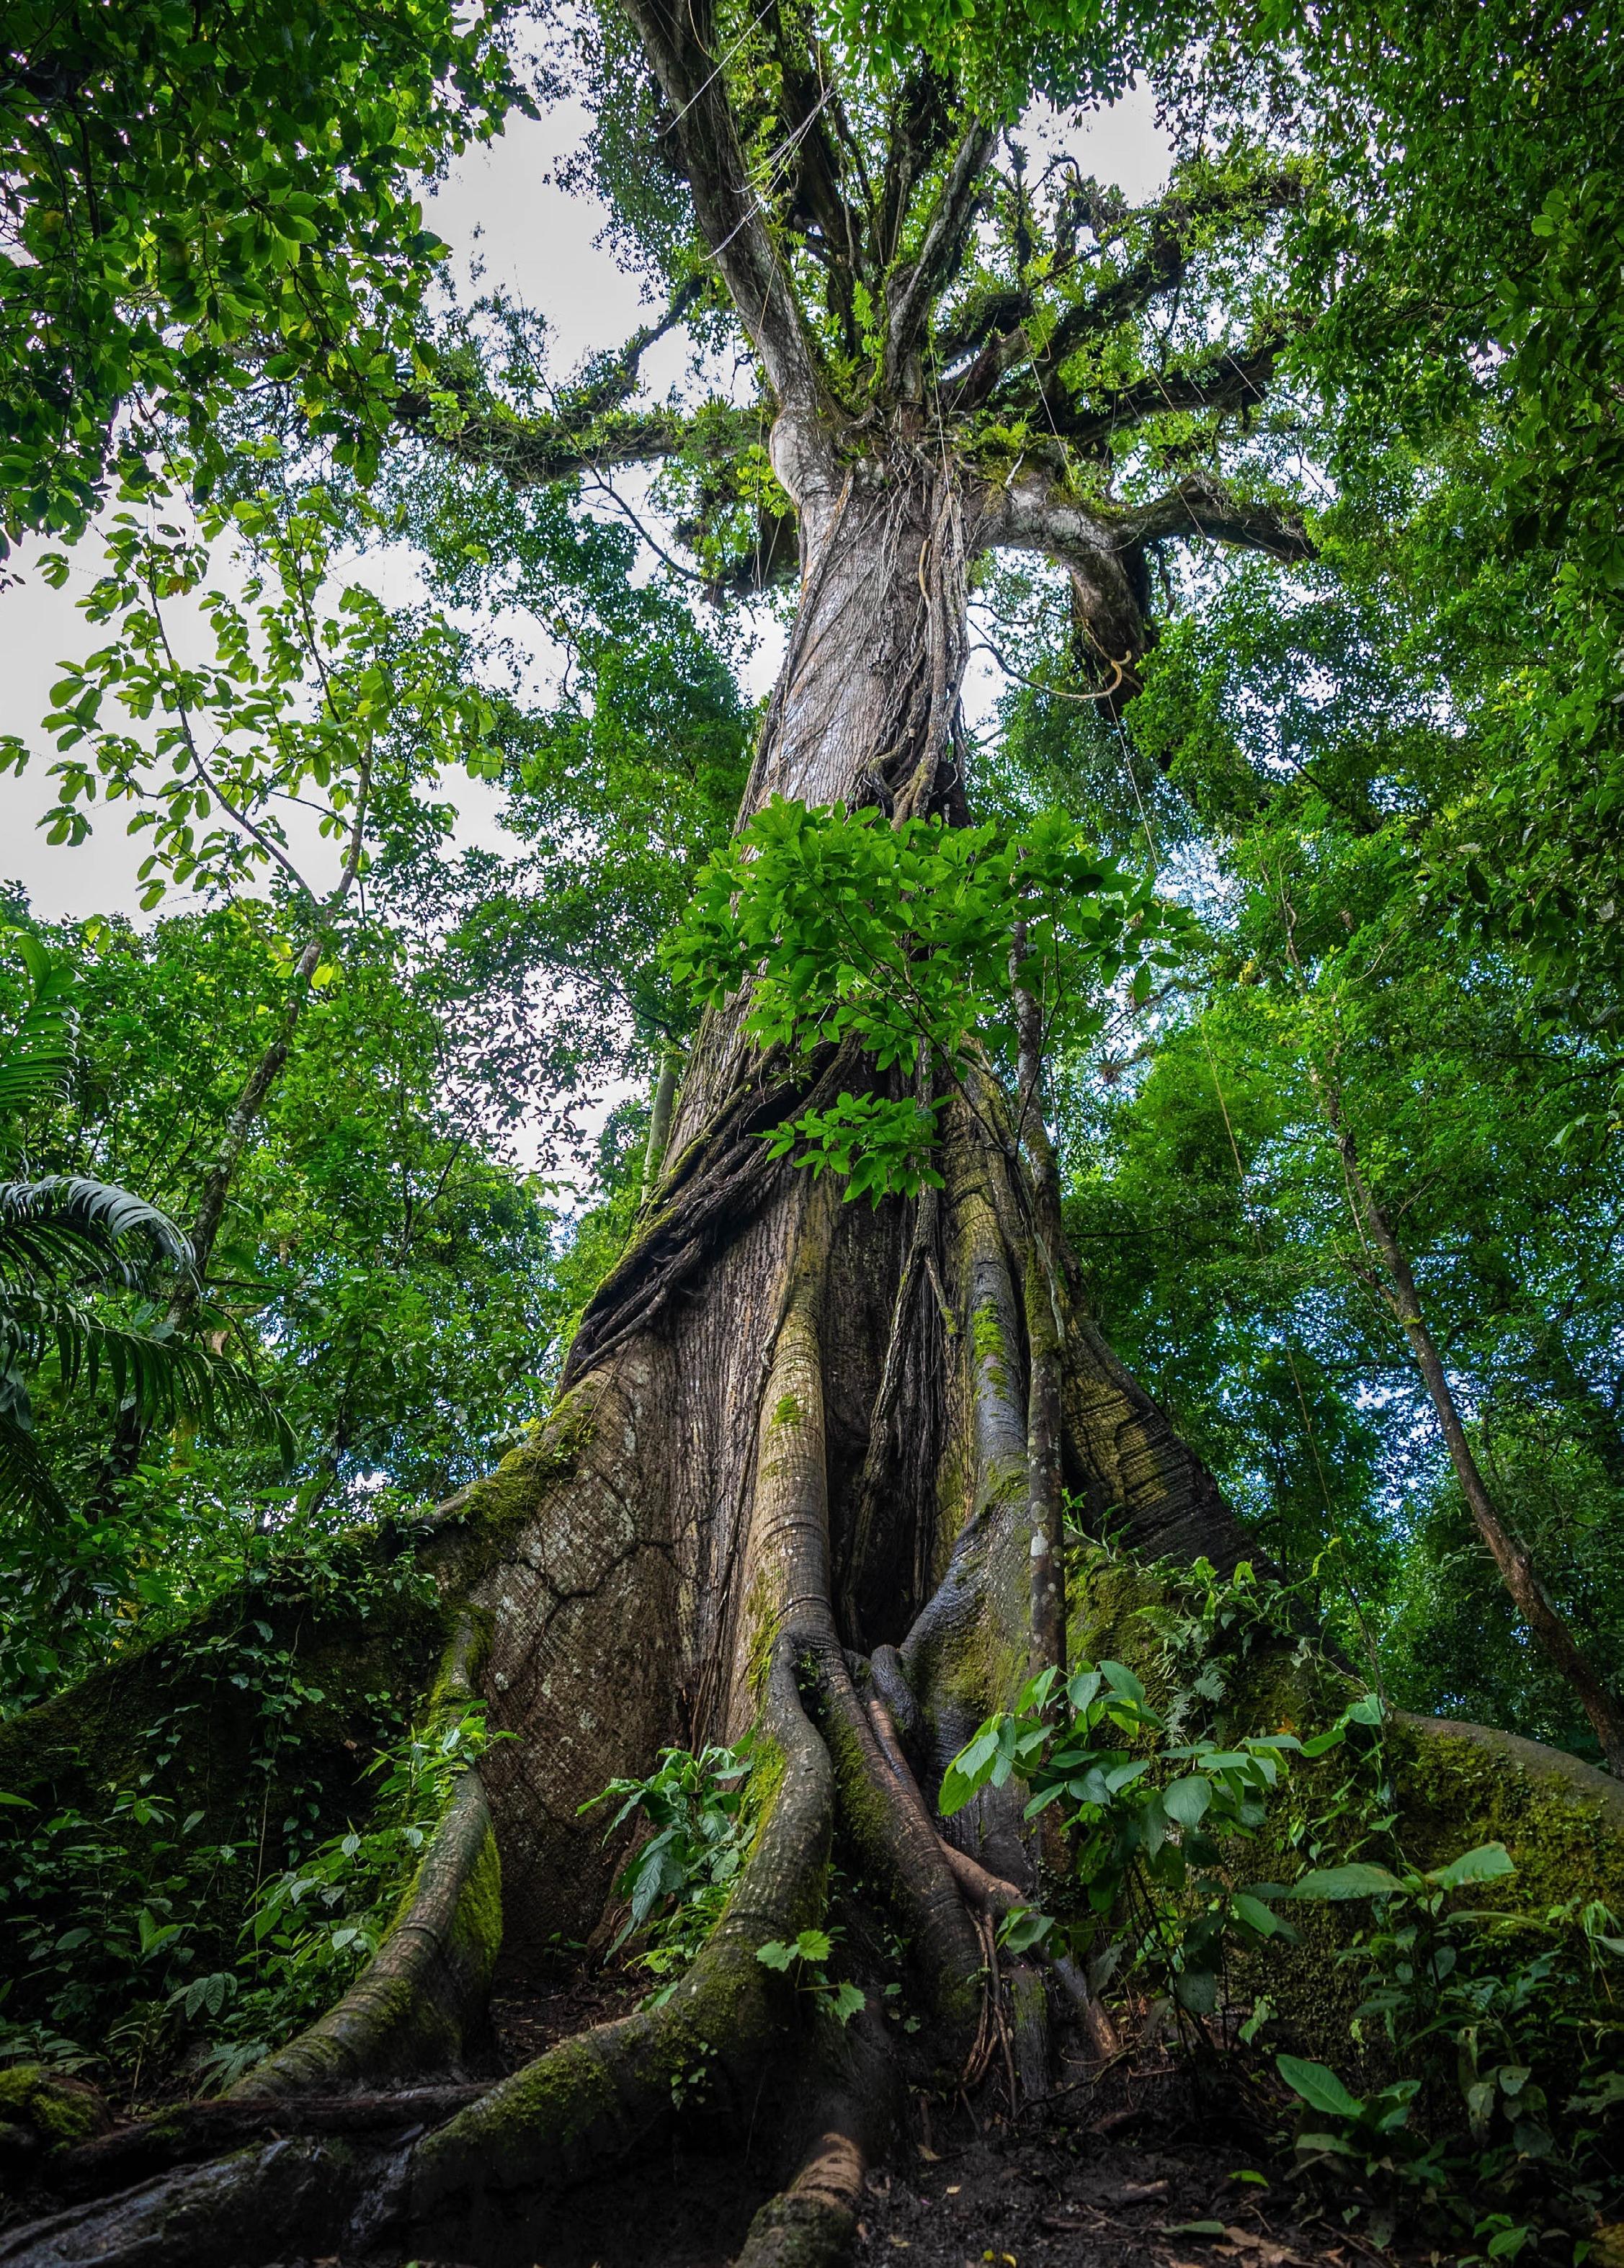
One of the things we learn quite early into our time at school is the importance of trees. By taking in carbon dioxide (CO2) and giving out oxygen (O2) via photosynthesis, they regulate the composition of the atmosphere and make it hospitable for humans to live in. They provide us with food and other raw materials. Our very survival is dependent on the ecosystem services provided by trees, and the rest of the natural world. Disrupting these environments is like cutting off our own lifeline. As the climate crisis progresses and affects life and livelihood, the conversation around conservation is gaining a sense of urgency.
While understanding the necessity of natural resources for our survival is important, some dimensions of the conservation discourse urge one to value the natural world in and of itself.11 While we have read a lot about trees in textbooks, we have also experienced them. Perhaps we have climbed their branches, played with fallen leaves and fruit, or rested in their shade. Maybe we have gathered around them for community meetings and discussions. From being sacred landmarks to ornamental entities in the urban fabric, it is not surprising that trees have also inspired art and can be found at the centre of many stories, songs, and paintings.
From the heart and from the head—let us explore different ways of looking at trees! In the first part of the activity, we will approximate the amount of carbon stored in trees and learn about the role of trees as carbon sinks. In the second part, we will get a bit closer and observe the small details around trees that may seem stationary, but are actually buzzing with activity. And maybe, we will let them inspire some poetry.
11 Luque-Lora, 2023.
MATERIALS REQUIRED:
1. Measuring tape
2. Notebook and pen to note down your readings
3. Calculator
4. A few trees!
1. Identify a tree around you that you can safely measure.
2. Measure the diameter (D) of the tree in inches with a measuring tape.
3. Measure the height (H) of the tree in feet.
You can refer to this link to see how to measure a tree.
Diameter (D): inches
Height (H): feet
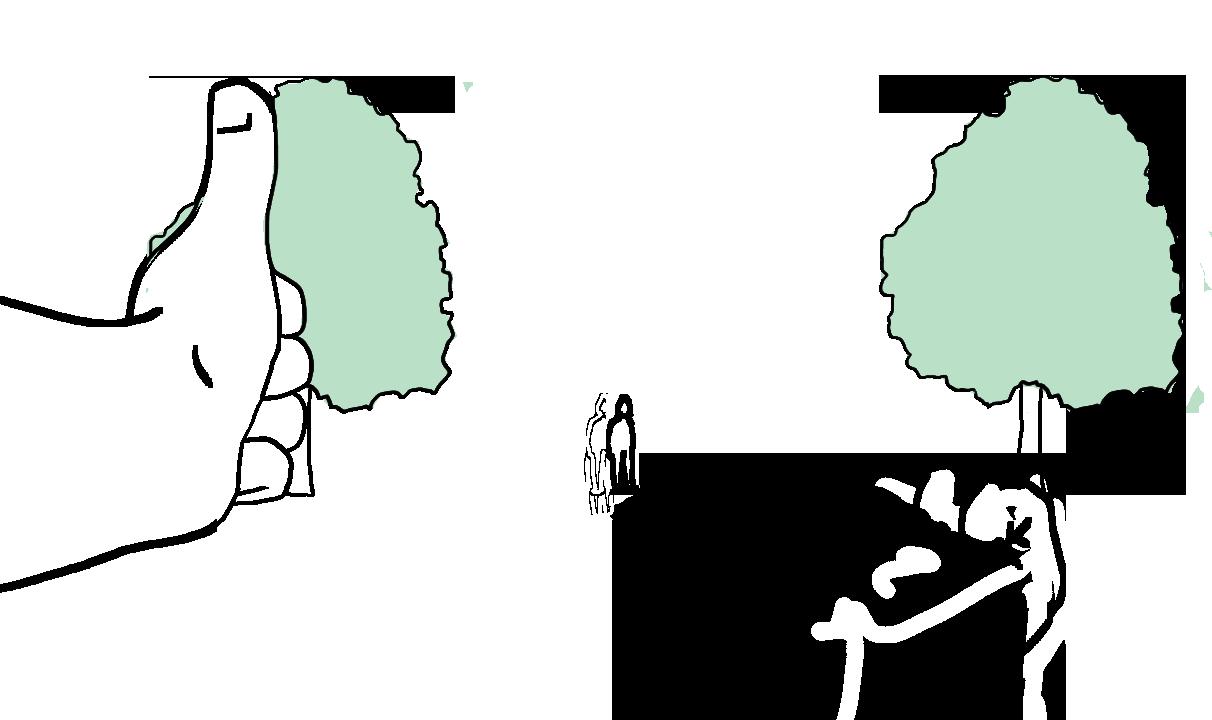
Simple thumb method for measuring the height of a tree:
Stand facing the tree and stretch out your arm fully in front of you. Close one eye.
Hold your thumb upright and align the bottom of your thumb with the base of the tree. Walk backward until the tip of your thumb lines up with the top of the tree.
Without moving your arm, rotate your thumb sideways by 90°.
Ask a friend to mark the point on the ground where the tip of your thumb points. Measure the distance from the base of the tree to that marked point. This distance is approximately equal to the height of the tree.
Calculate the following, and note them down below:
A. The total green weight of the tree
B. The dry weight of the tree
C. The weight of the carbon in the tree
Determine the green weight (or the tree’s weight when it is alive) of the tree above the ground. Use the following formulae, where D is in inches and H is in feet:
For trees with D<11 : Wabove ground = 0.11 x D2 x H
For trees with D>11 : Wabove ground = 0.07 x D2 x H
Wabove ground = _________________ kg
Since the roots of a tree are approximately 20% of the tree’s weight above ground, you get the total green weight of the tree by multiplying 1.2 with its above ground weight. The formula is:
Wtotal green weight = 1.2 x Wabove ground
Wtotal green weight = ______________ kg
The calculations are done based on the assumption that trees are roughly cylindrical.
B. CALCULATE THE DRY WEIGHT OF THE TREE
Since the average tree is 72.5% dry matter and 27.5% moisture,
Wdry weight = 0.725 x Wtotal green weight
Wdry weight = ______________ kg
C. CALCULATE THE WEIGHT OF THE CARBON IN THE TREE
The carbon content of a tree is approximately 50% of the tree’s total dry weight.
Wcarbon = 0.5 x Wdry weight
Wcarbon = ______________ kg
space for calculations
Repeat the exercise for two or more trees of different species and note your calculations in the table below:
Trees Carbon sequestered in trees (in kg)
Do you think the carbon sequestered by different species of trees is the same?
Tree bark peeling off
Trees are not just crucial carbon sinks, they also play a central role in providing sustenance and resources to the organisms around them. It is important to recognize the intricate interactions and smaller details that contribute to their dynamic nature, which often go overlooked.
Observe a tree in your locality and its immediate surroundings. Strike the things you see from the Bingo card given below. The goal is to hit BINGO by striking out any 5 in a row or column.
Fallen seeds or seed-pods
Large canopy providing shade
Carvings on the tree bark Humans (other than youself)
Can hug the entire tree trunk
Crawling creatures
Non-green leaves
Presence of water
space to write your poem
REFLECT:
1. Based on the BINGO, write a poem about your tree. How would it be experiencing the world around it?
2. Are trees shy? When you look up at tree tops, you may observe that the tree crowns form an intricate pattern of gaps almost like they’re avoiding each other! This phenomenon is called Crown Shyness. Why do you think trees display this?
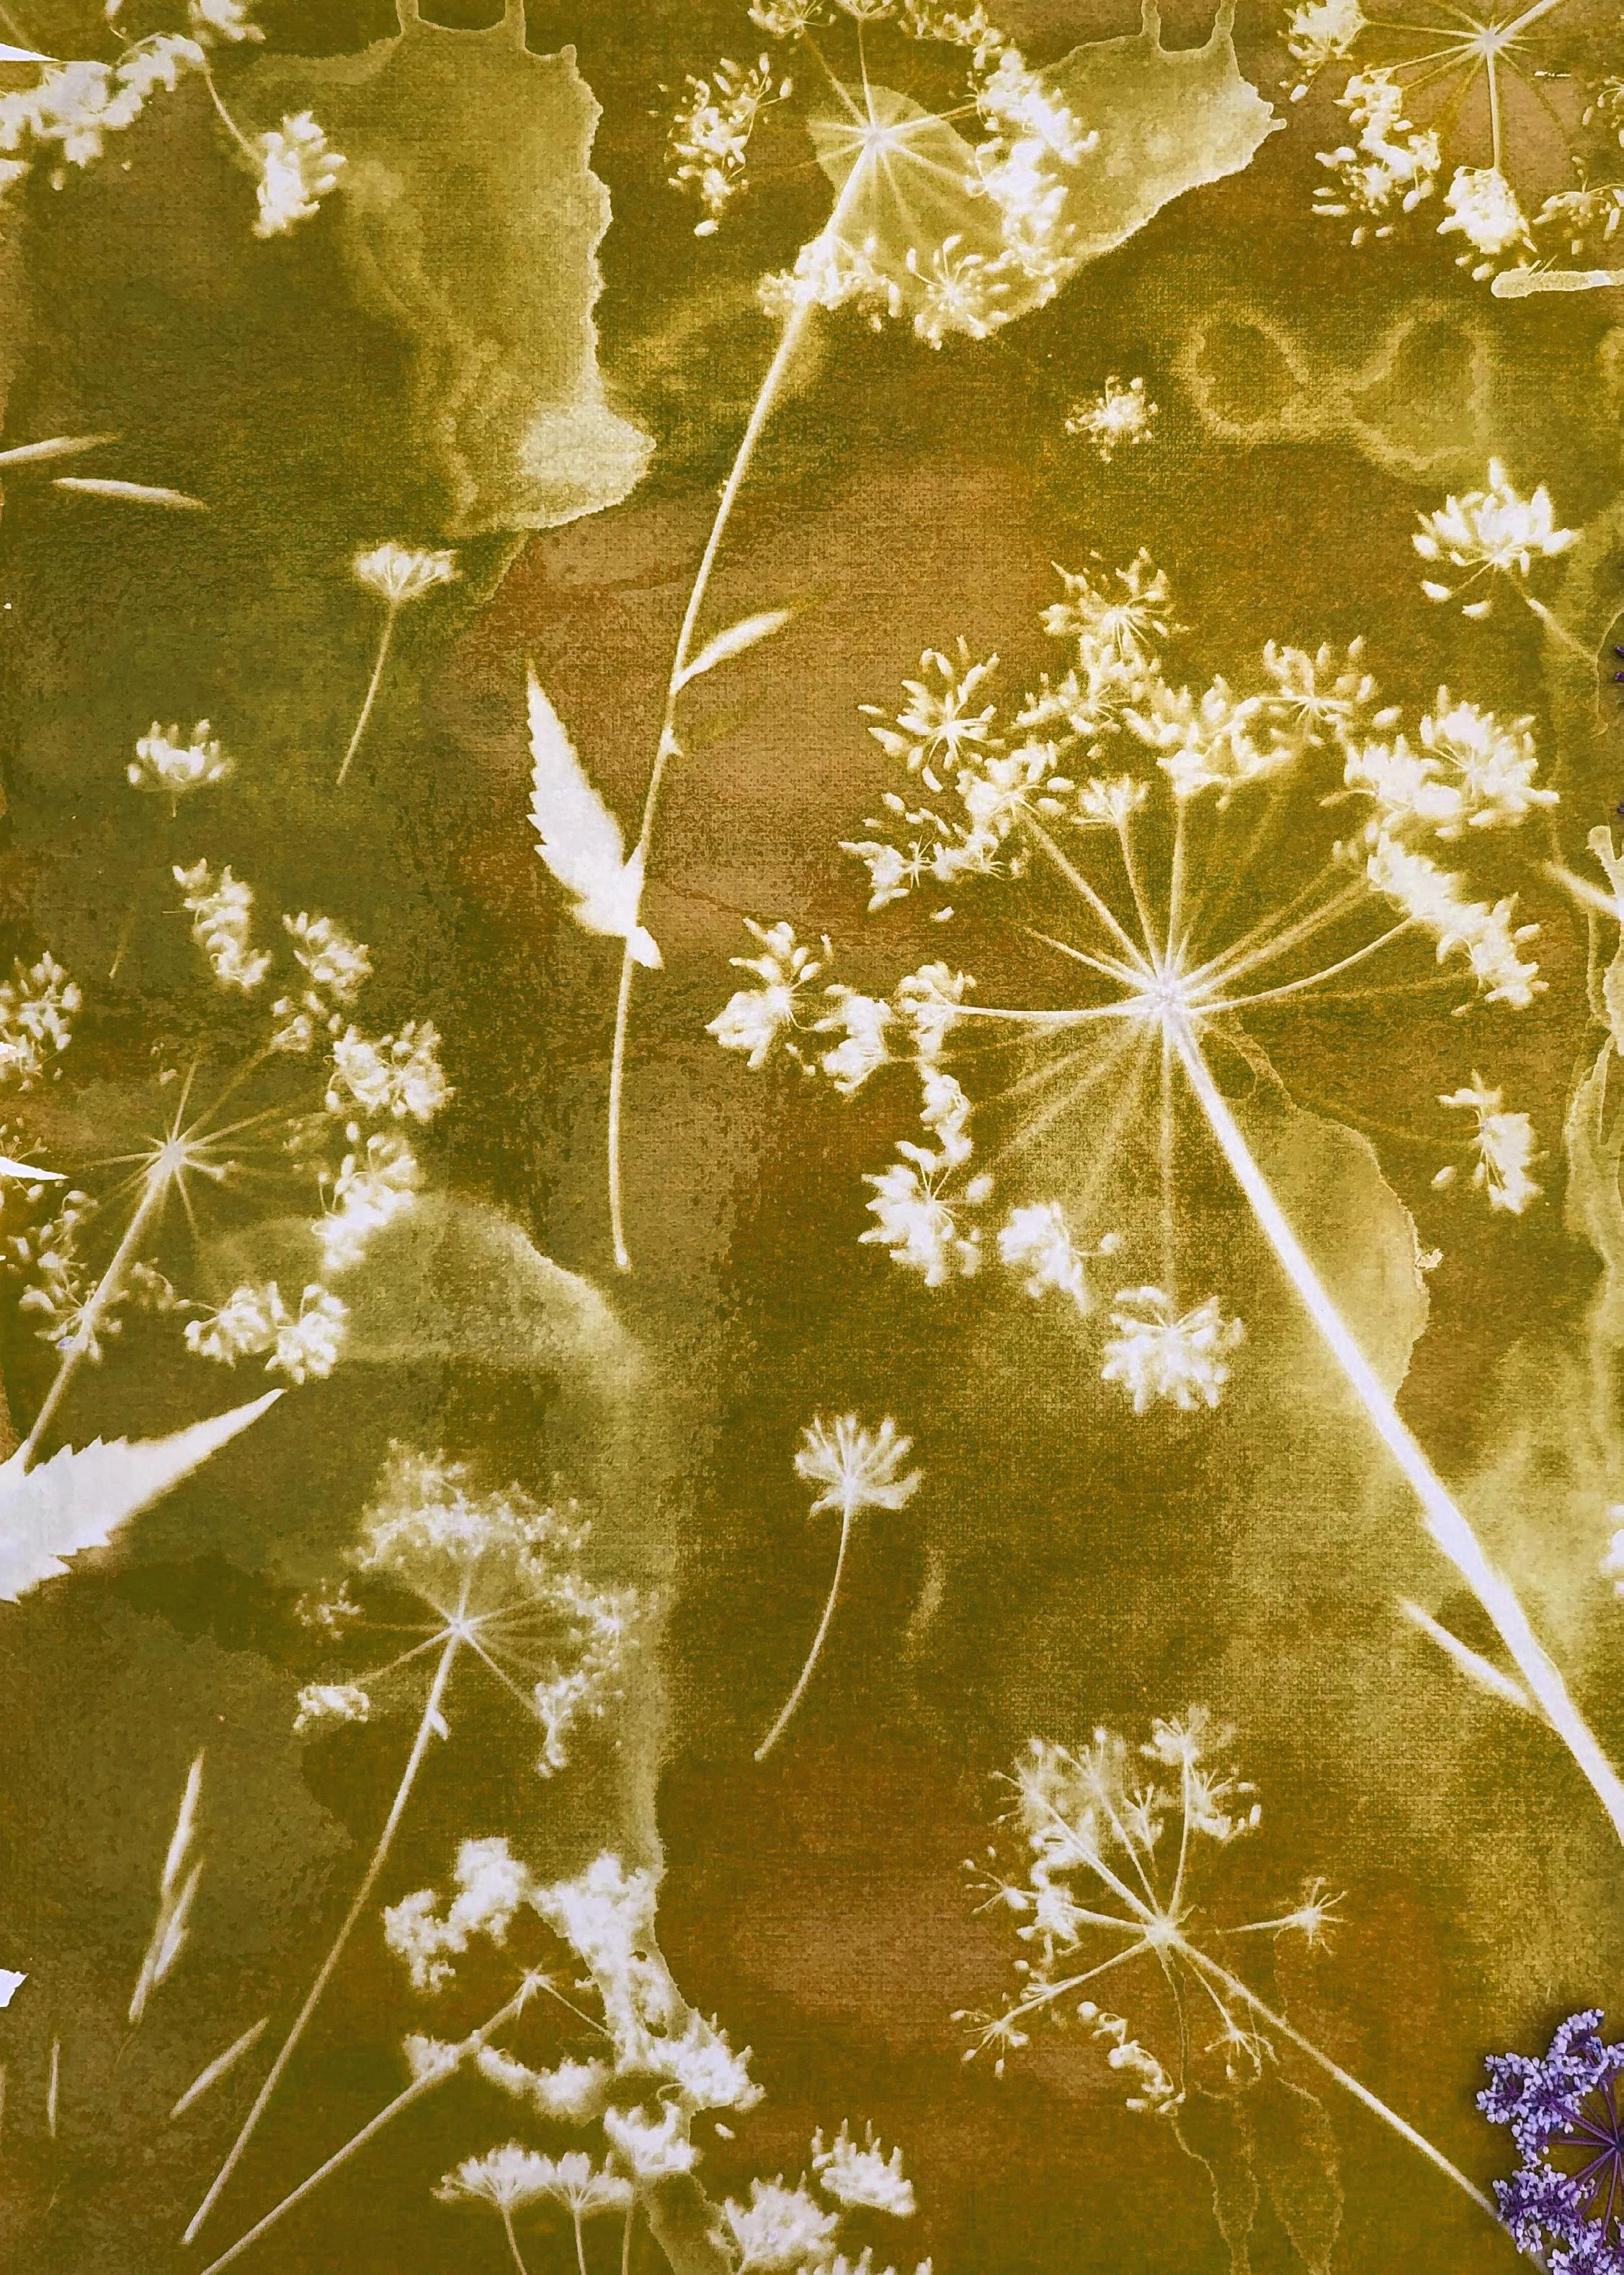
Say cheeeeese! Click, click, click. Taking photos today is effortless. With camera-equipped devices in our pockets, capturing sunsets, delicious food, or selfies is a snap. But it hasn’t always been this easy! Camera technology has evolved significantly over the years. The earliest camera, called the camera obscura, could only project an image onto a surface for tracing.
About 200 years ago, the first photograph was taken by Joseph Niépce, who exposed light from a window through a camera obscura onto a plate coated with a light-sensitive, carbon-based material known as bitumen of Judea. After an eight-hour exposure, he revealed an image of the landscape outside by washing the plate with petrol and lavender oil.12 Even as camera technology improved, from silver salts to digital formats, carbon remained a key element in photography. Carbon prints are still cherished for their detail and longevity compared to silver salt images.13
Around the same time as Niépce’s groundbreaking work, photographers began using plant extracts. This led to the development of the anthotype, a method that utilises lightsensitive pigments derived from plants, often containing carbon-based molecules, to create prints. Anthotypes have emerged as a fascinating area of alternative photography.14
In this activity, we’ll explore the basics of photography by creating our own anthotypes using a common kitchen ingredient—turmeric! The bright yellow colour of turmeric comes from curcumin, a light-sensitive, carbon-based molecule.15 Let’s use sunlight and curcumin to make our own photos!
12 Brown, 2002.
13 King, 2018.
14 Fabbri 2021.
15 PubChem, 2004.
MATERIALS REQUIRED:
1. Turmeric powder
2. Alcohol (rubbing alcohol/ vodka/ hand sanitizer)
3. 2 small glass containers
4. A spoon
5. Cotton cloth/tissue paper
6. Paint brush
7. Inkjet paper/watercolour paper
8. Baking powder/borax
9. A broad tub
10. A plant leaf
11. Sunlight
:
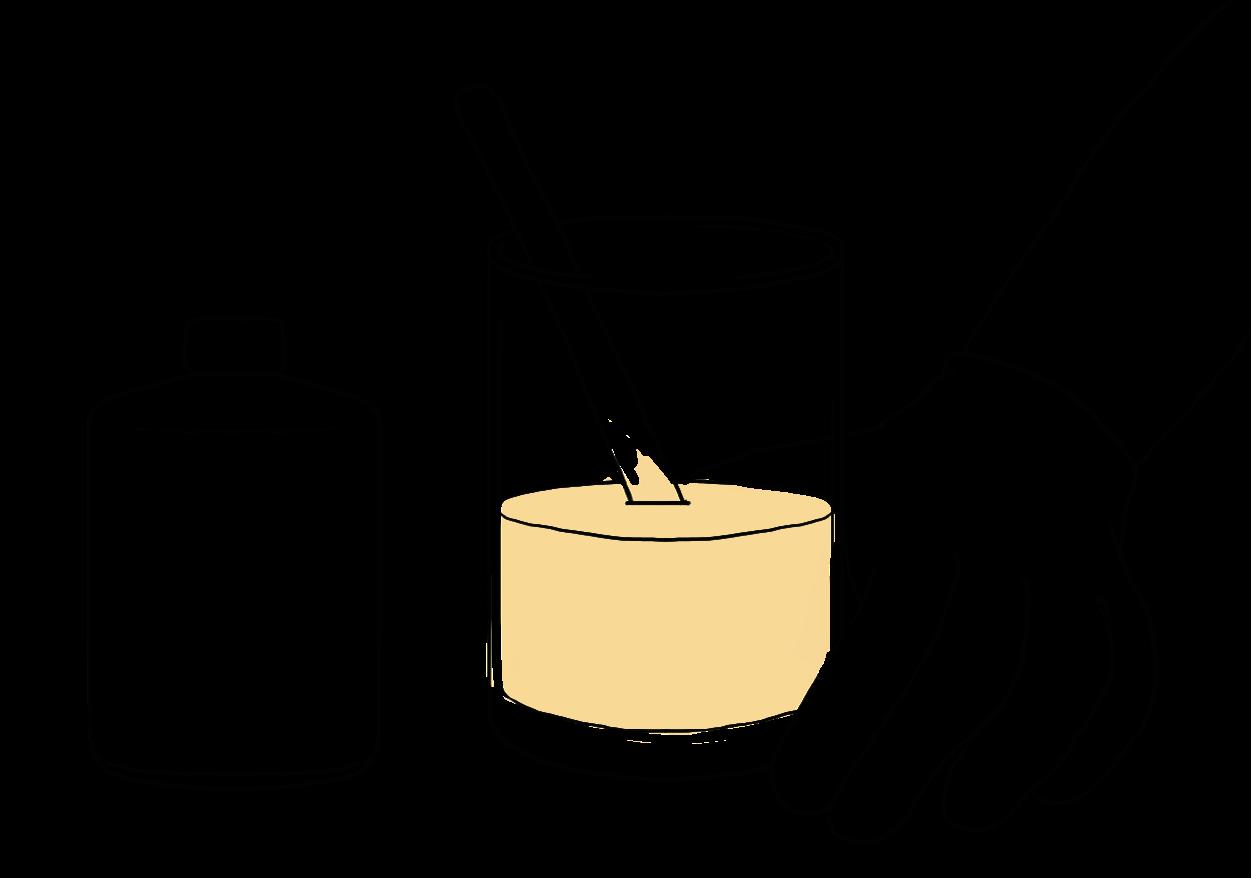
Step 1: Mix 1-2 tablespoons of turmeric with 4-6 tablespoons of alcohol in a glass jar to create a paste. Make sure the mixture is not too grainy, as curcumin, the compound responsible for the yellow colour of turmeric, dissolves well in alcohol.
Be careful. Turmeric will stain hands, clothes and surfaces yellow!
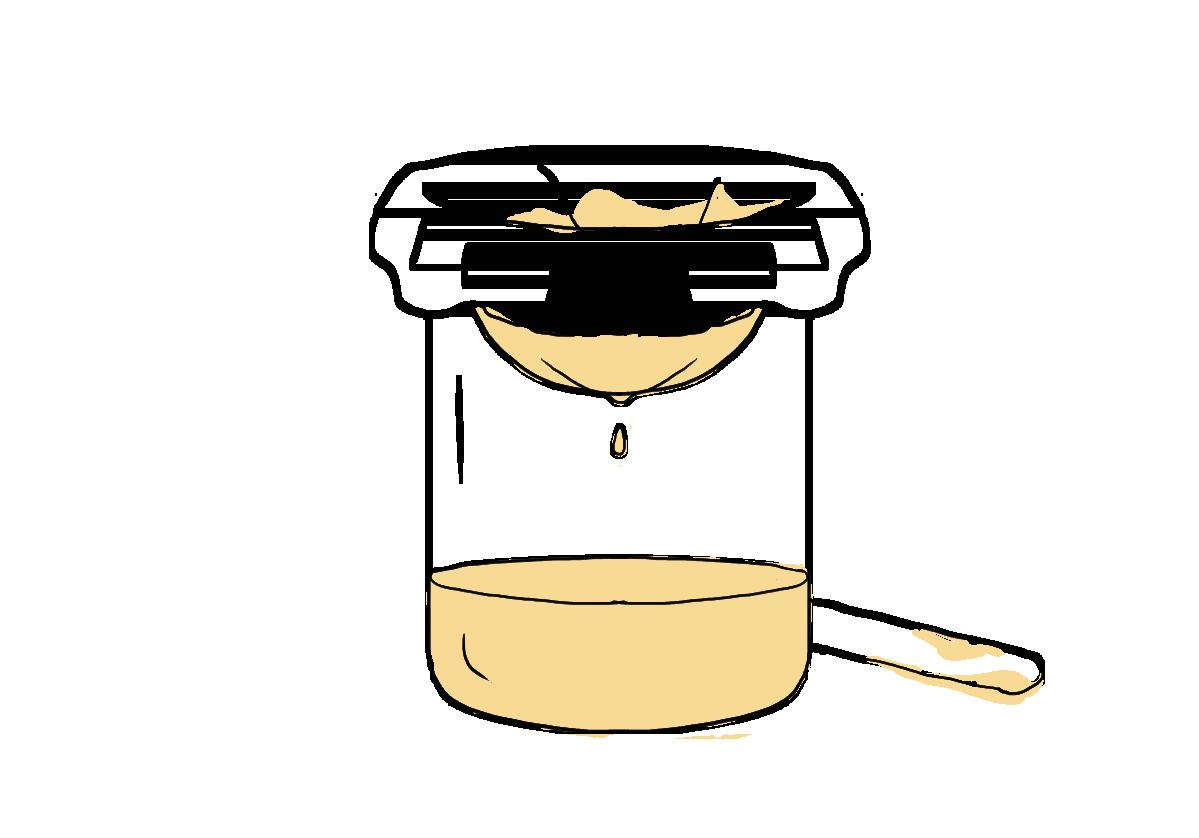
Step 2: Filter the mixture by passing it through a cotton cloth placed over a glass container. Be careful to avoid letting any grainy particles pass through. Squeeze out any remaining liquid from the cloth into the glass container.
Step 3: Your dye is ready! Use a paintbrush to paint over the paper with the dye.
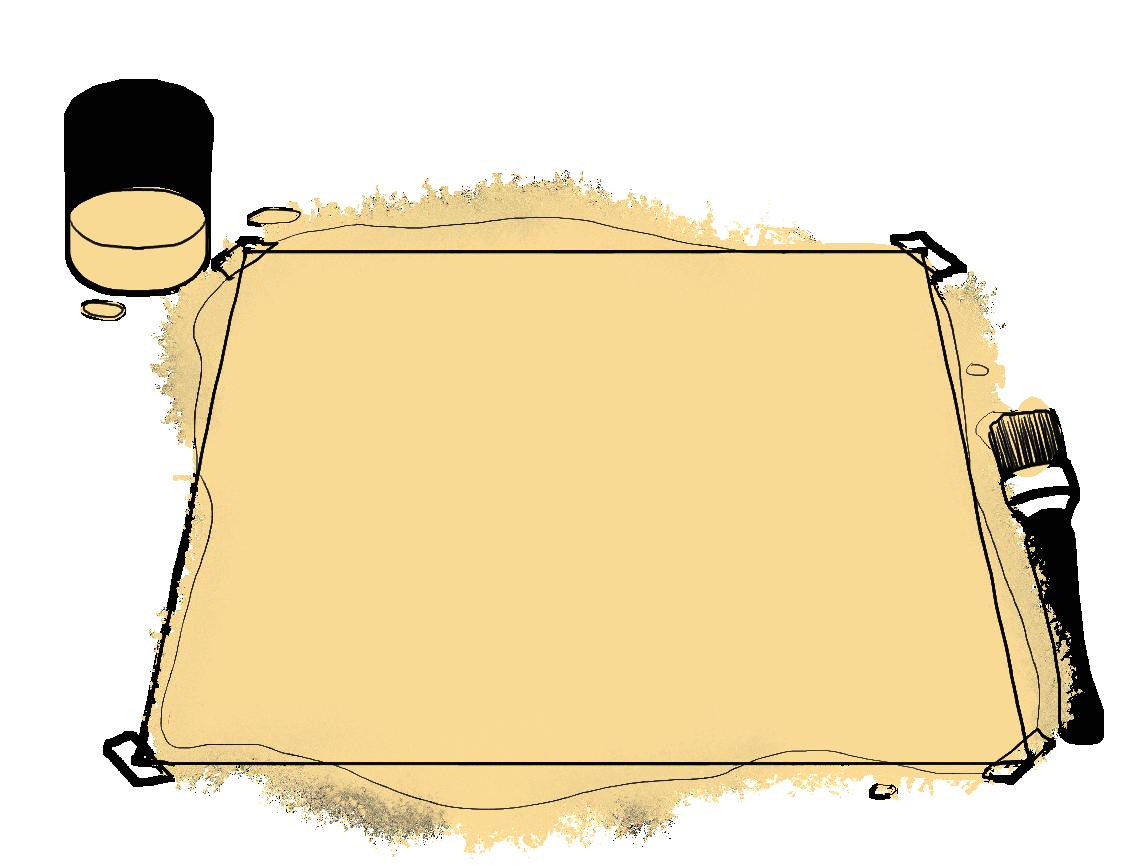
Step 4: Place the leaf over the painted paper and leave it out in direct sunlight. If you are lucky and it’s a sunny day, you can leave it out for 4–5 hours. Else, you may leave it out for an entire day!
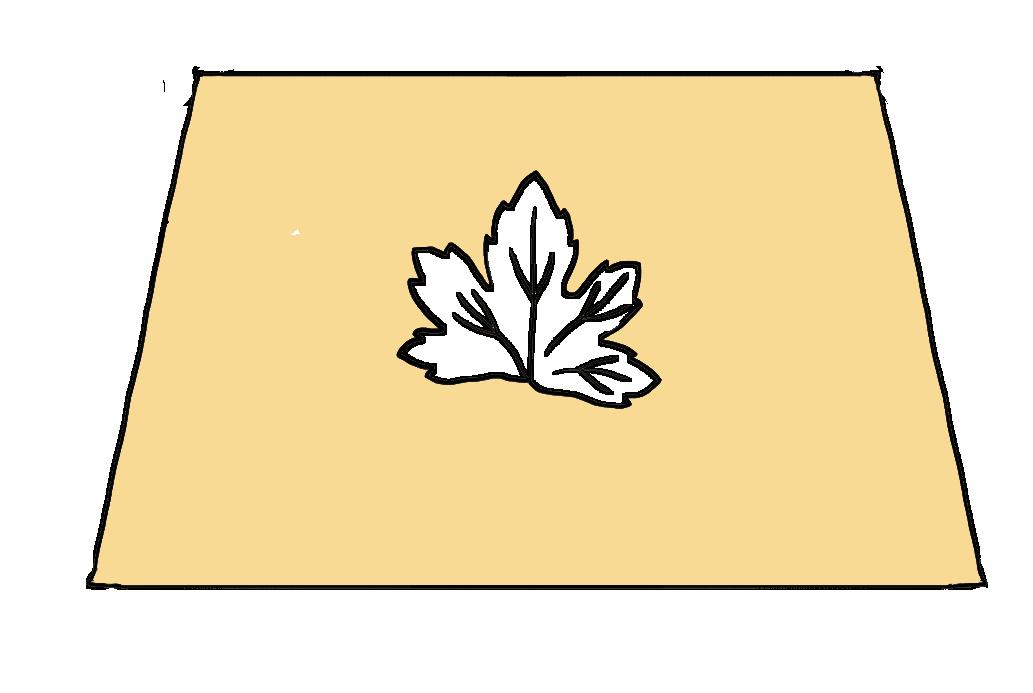
You would notice that the yellow colour fades slightly. If it doesn’t, you can always leave it out in the sun for longer.
Step 5: Peel the leaf off. You will notice that the area covered by the leaf remains bright yellow.
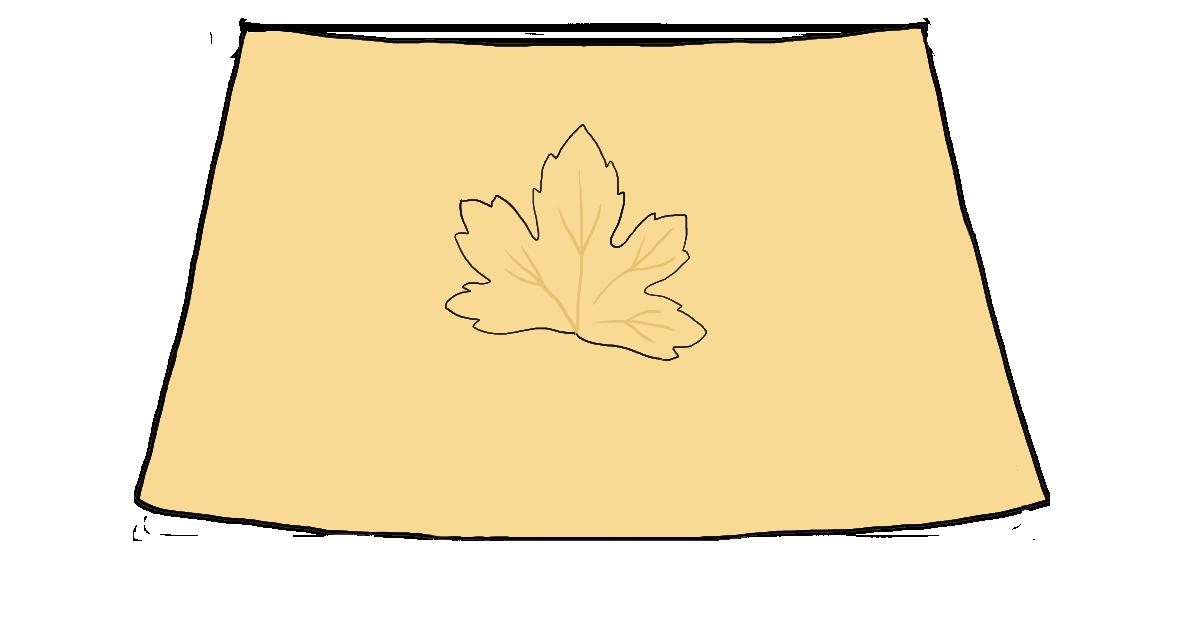
Step 6: Next, mix 2 spoons of baking powder in lukewarm water. This solution will enhance the curcumin.
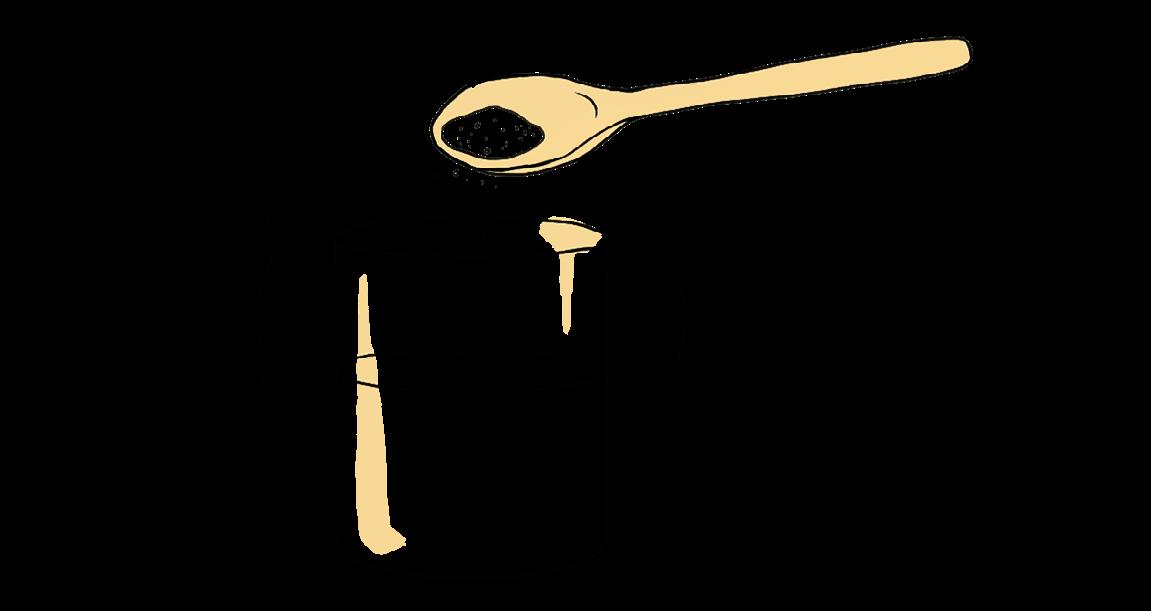
Step 7: Finally to develop your anthotype, place the paper in the tub and slowly pour the baking powder solution over it.
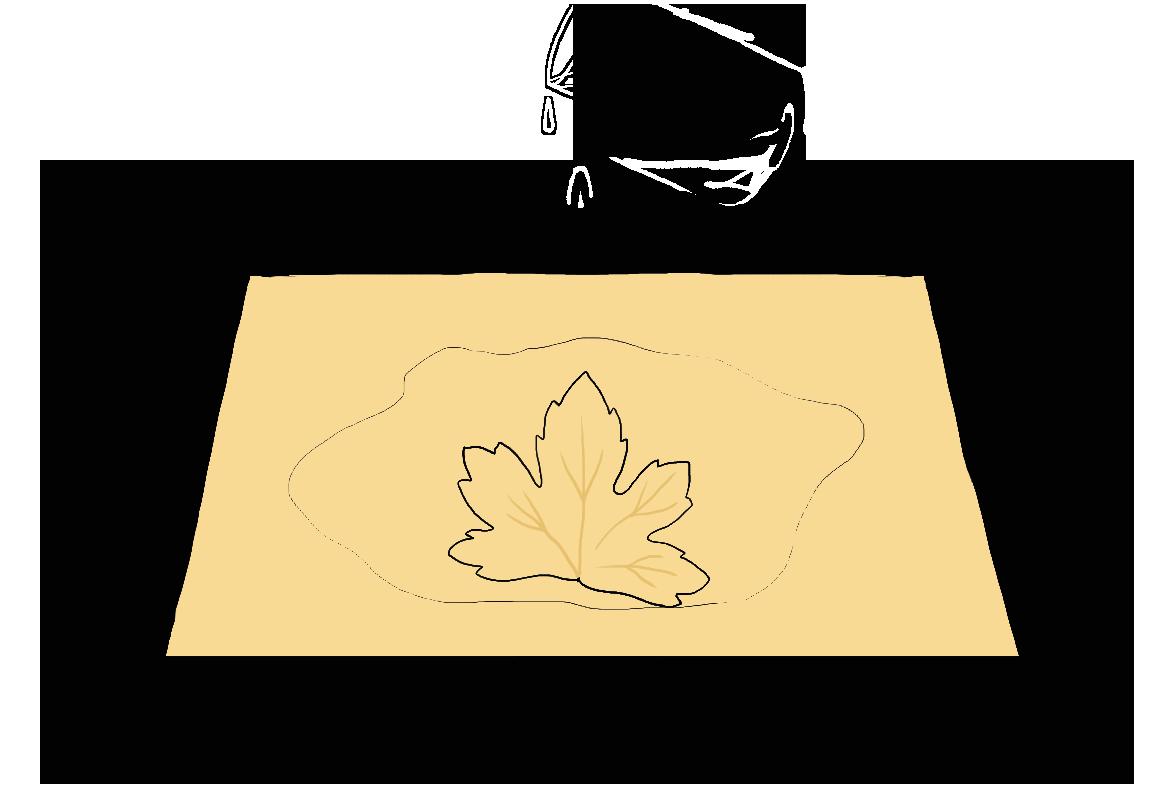
Step 8: Take the paper out and let it dry in a dark place. Your anthotype photograph is now ready!
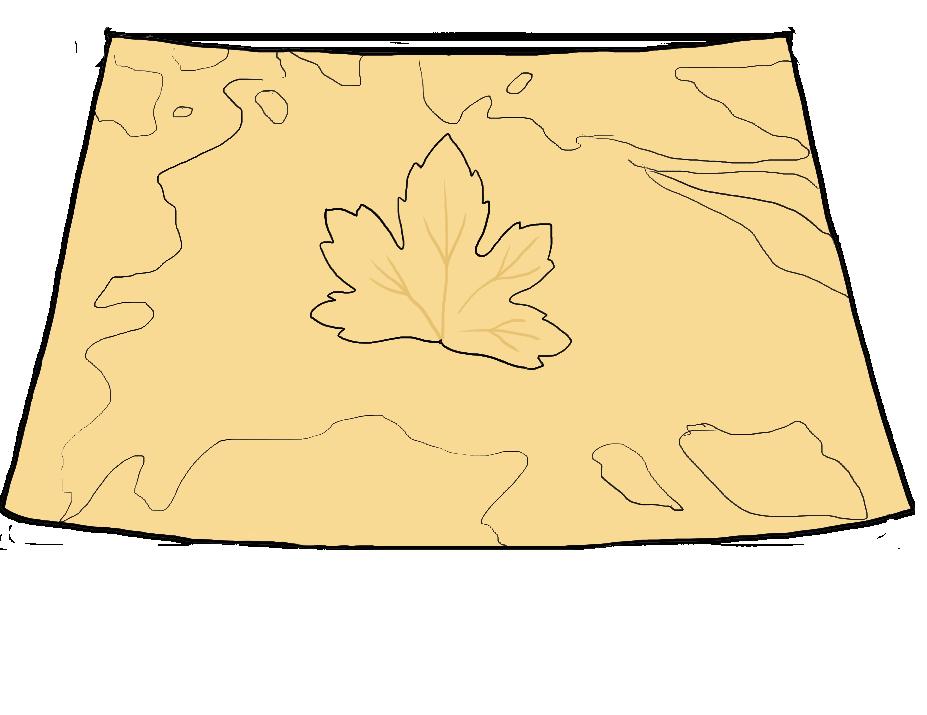
You can try using different kinds of leaves, flowers or grass to create anthotypes with a variety of patterns!
1. What other flower or fruit extracts could you use to create similar anthotypes?
2. Have you ever used CC in an email? CC stands for Carbon Copy. Before photocopiers existed, people used carbon paper to make copies of written documents by placing it underneath the original paper. You can find carbon paper at your local stationery store to see how it works!
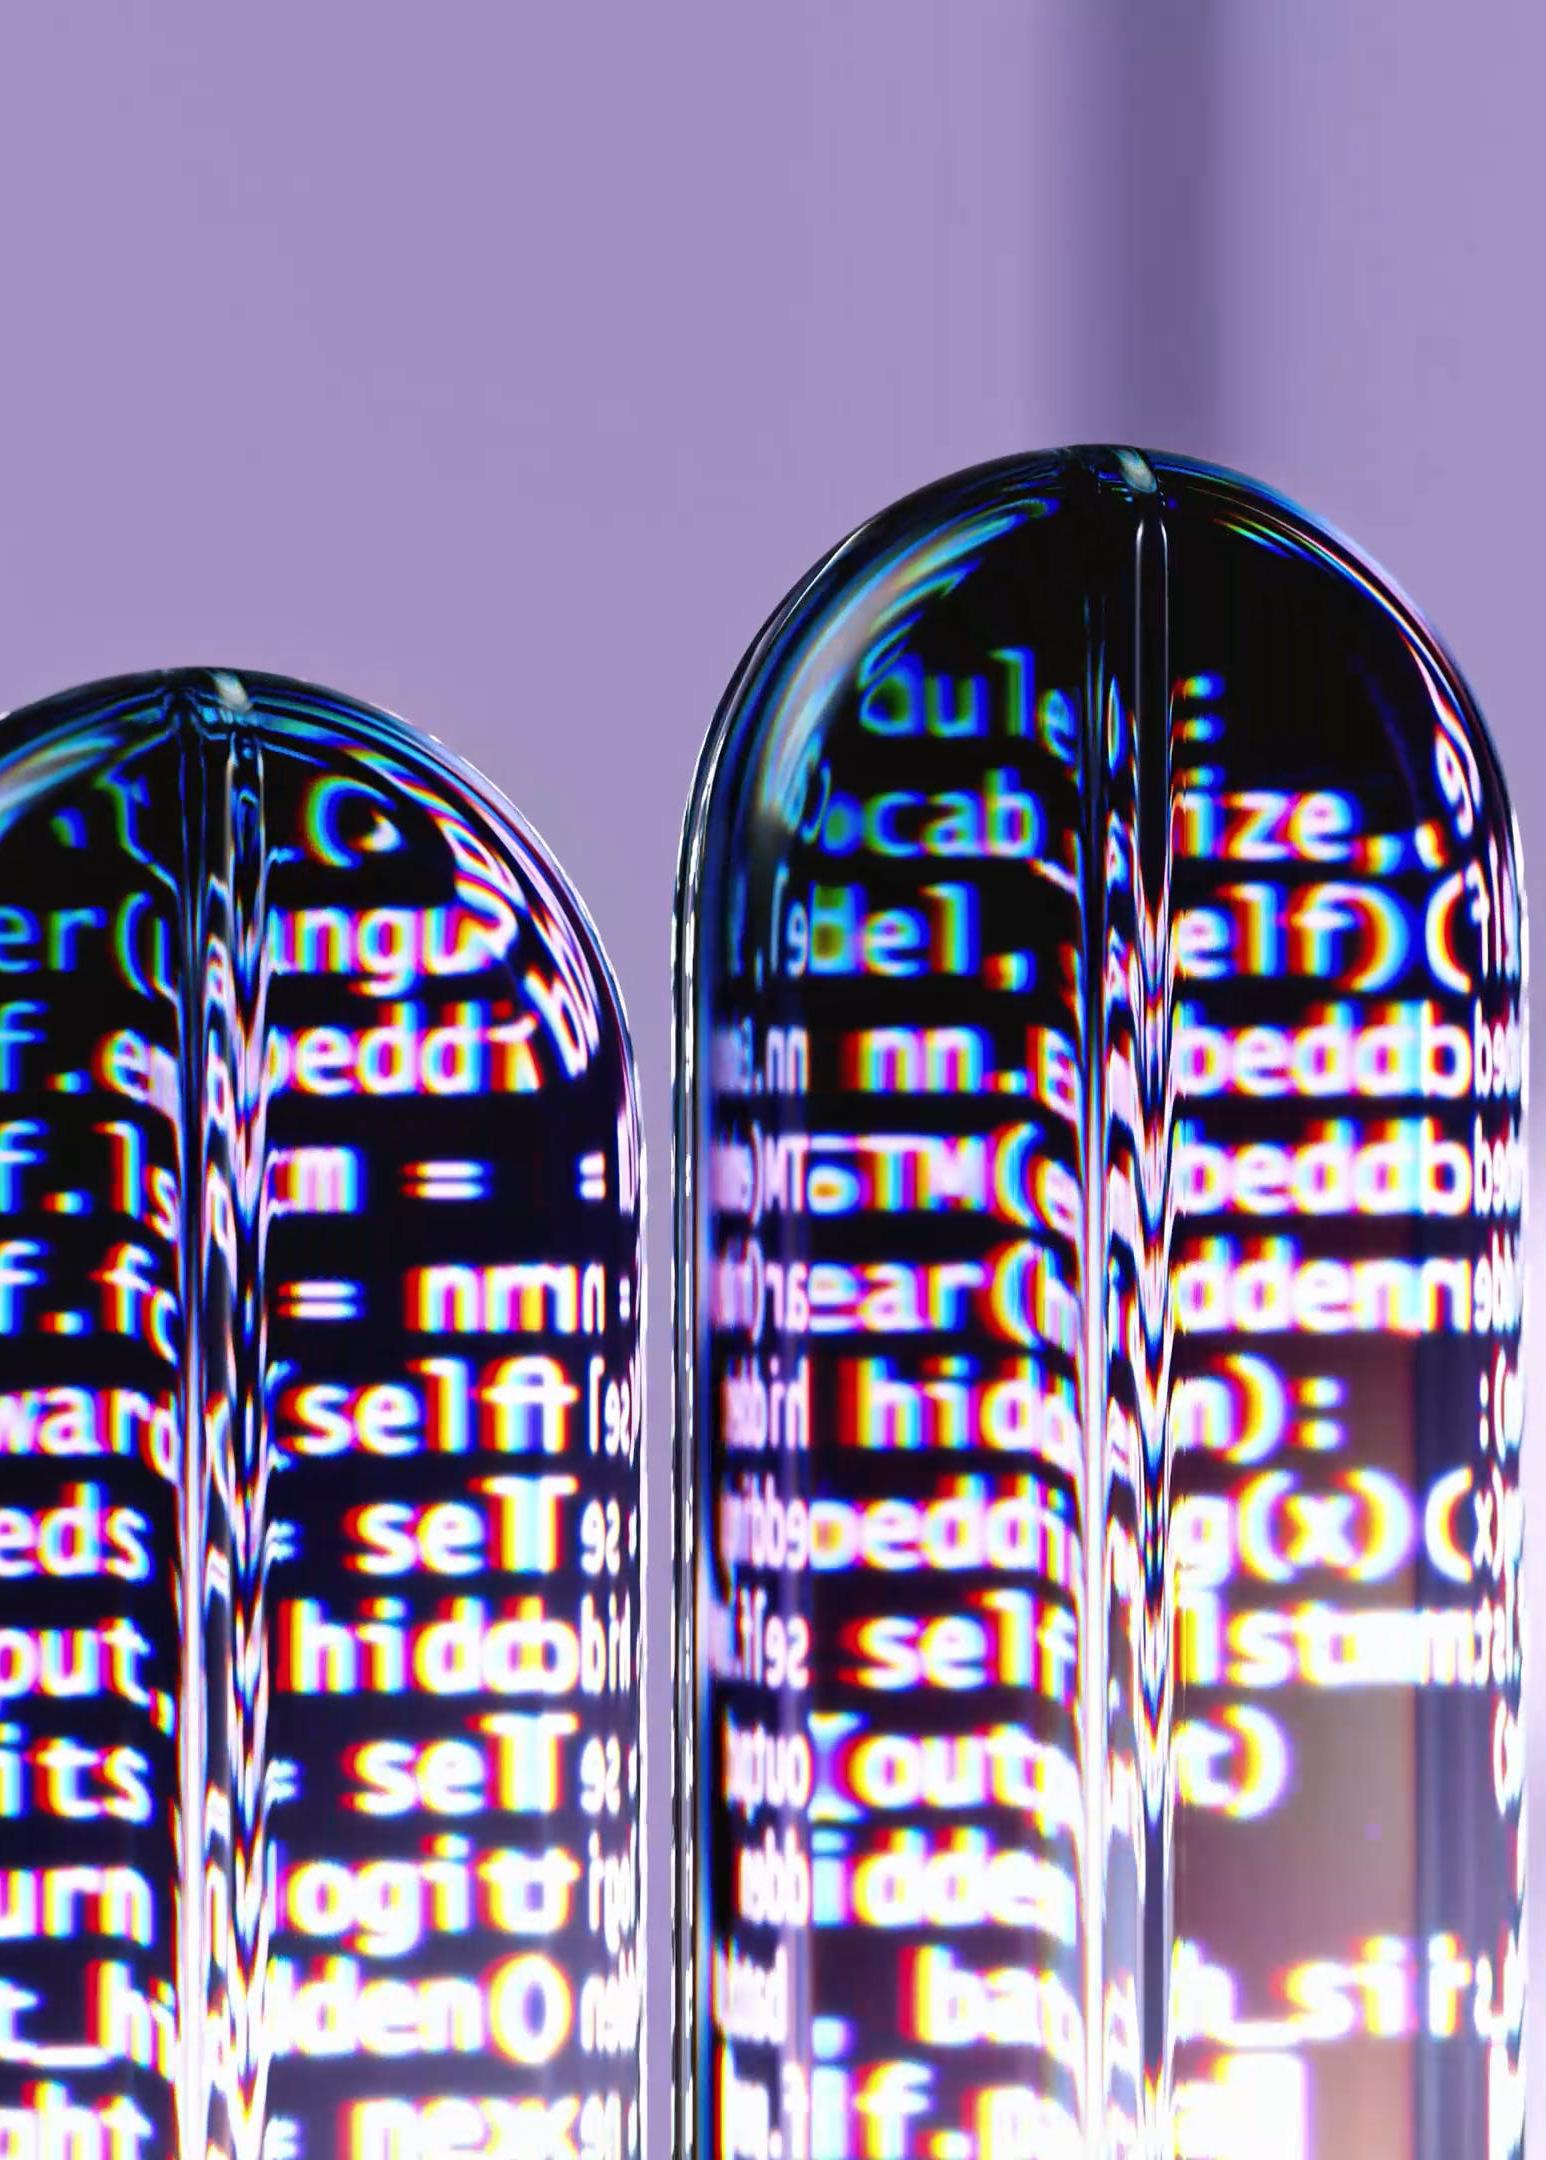
The footprints we leave on beach sand are washed away by water and wind. However, on the shores of the digital world, there are no natural elements to erase our traces. As our use of the internet and digital devices grows rapidly, we face a significant challenge: our digital carbon footprint. This term refers to the carbon dioxide emissions created during the production, use, maintenance, and disposal of our devices.16
While it is easy to imagine the environmental impact of manufacturing and disposing of devices, the carbon cost of our internet activities is less obvious. Sending a text, liking a social media post, or visiting a website may seem effortless, but these actions have a hidden carbon footprint. Behind every click and like, there are data centres and networks that require energy to operate. In fact, it was reported that the internet consumes 416.2 terawatt-hours of energy each year.17 That is nearly seven times the energy usage of Karnataka.18
That being said, it is difficult to live without the internet today. We rely on it to find directions to a place, discover new research, or even video call a loved one. The very same network that is contributing to the ongoing crisis also helps us learn more about how we can potentially prevent it, or creates a space to express our fear about it. How do we navigate the complexities of the internet in the context of climate change? Perhaps we can begin by being more aware. Seemingly seamless streaming takes place at such speeds that it is easy to lose track of how much time we spend online. And the invisibility of wires and waves makes us disconnected from the internet providers that keep us connected.
In this activity, let’s take a moment to look at the internet: how much we use, how we use it, and how it works.
16 Sharma and Dash, 2022
17 Bawden, 2016.
18 CEIC, 2023.
Use the following template to track your digital activities in a day.
Assign a colour to your activity’s polygon below and use it to fill and record your digital activities in a day.
for every hour spent for every 30 min spent for every hour spent for every 5 songs listenened to
19 Griffiths 2020.
20 Obringer et al. 2021.
21 Worldfavor, n.d.
22 Google Sustainability, 2023.
Now that you have tracked your digital activities, let us unravel their impact on the climate.
Sending a single email generates about 4 grams of carbon dioxide (CO2e), and a text on messenger platforms is only slightly less. If you add a picture attachment, that number jumps to 50 grams. While sending digital messages is more environmentally friendly than mailing a physical letter, the sheer volume of emails and texts we send worldwide produces as much CO2 as adding 7 million cars to the roads.19
There are other examples as well. For instance, video calling uses significantly more energy than voice calls. Researchers at Purdue University found that by turning off video during 15 hours of conference calls in a week, one could cut carbon emissions by 9 kilograms.20 That is equivalent to charging a smartphone overnight for three years. Similarly, streaming videos for an hour or two each day for a year consumes as much energy as running a refrigerator for six months.21
While this is a useful exercise to learn about your own digital activities, the contribution of individual actions is still a fraction of that of larger corporations and industries. For instance, in its yearly environmental report, Google reported its energy usage for 2022 at 22.28 TWh.22 That is enough energy to power an air conditioner continuously for 847 years. It can be challenging to strike a balance in a world where participating in everyday life seems to contribute to global emissions. So, where does the real responsibility lie? With consumers, producers, or both?
Digital activities have a high carbon footprint, but unfortunately are not easy to avoid in today’s world. From your digital tracker, what activities do you feel are possible to cut down on? What are some alternative activities that can meet the same purpose but have a lower carbon footprint?
space to write or doodle your thoughts
1. What steps can be taken to make a website more sustainable? Check the carbon footprint of different websites by using this online tool: https://www.websitecarbon.com/
2. Should you make the switch? Digital note-taking is gaining popularity over traditional pen and paper. Based on raw materials, production and energy consumption considerations, which do you think is more sustainable in the long-run?
There’s no doubt about it: the mining and use of fossil fuels like coal and oil have dramatically changed our lives. From air conditioners that keep us cool to industries that process and package our food, and vehicles that transport us, fossil fuels play a crucial role. In 2022, fossil fuels were responsible for 77% of India’s total electricity generation.23
The growth of cities and industries above ground has been powered by the wealth of resources beneath it. However, in our drive for rapid growth, we often act as if these resources are limitless. As production and consumption increase, though, these resources start to deplete, forcing us to dig deeper to find them. Unlike a car that runs steadily until its tank is empty, resource extraction typically starts off strong, peaks, and then declines, forming a bell curve known as the Hubbert curve, named after geologist M. King Hubbert.24 The height of this curve represents peak oil—the moment when oil production in a given area reaches its maximum before it begins to fall.
The decline in resources poses serious risks of geopolitical tensions and economic strain. While we may not know exactly when this peak will occur, it’s clear that our planet’s resources are finite, and the impacts of fossil fuel use are already becoming evident. How will we manage the oil that remains? Can we afford to keep emitting greenhouse gases? And what might life be like if we moved away from fossil fuels?
23 Kemp and Kemp, 2023.
24 Stuart McMillen, 2015.
REQUIRED:
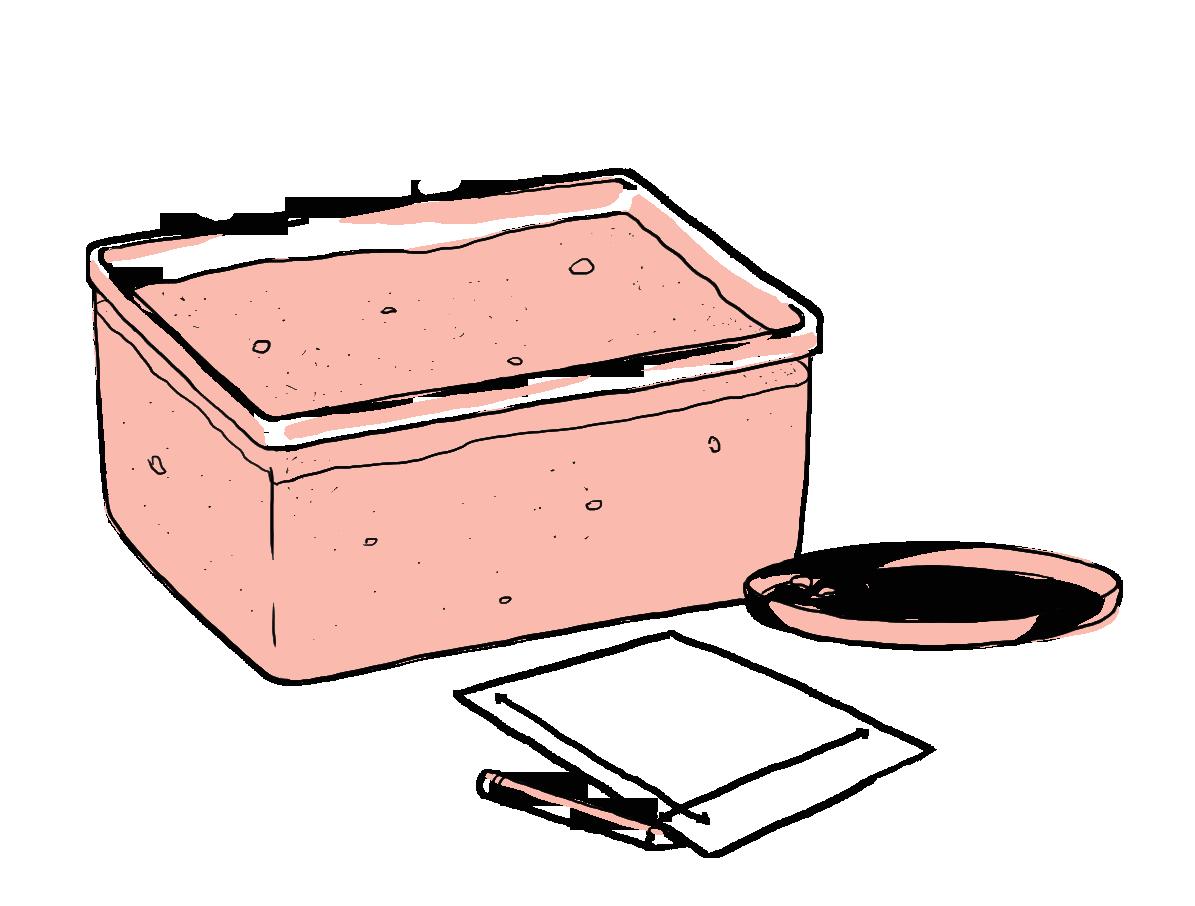
1. A large tub (approximate dimensions: 30cm x 30cm x 15cm or roughly the size of a shoebox)
2. Sand or rice: enough to fill the large tub
3. Beans or gram dal (about 100 grams)
4. Plate for collecting
5. Timer/stopwatch
6. Graph paper or a plotting software
7. 3 friends to participate!
This activity helps you experience the extraction patterns of limited, non-renewable resources.
Setup: Fill a large tub with sand or rice, leaving a 5-6 cm gap at the top. Disperse the beans evenly within the material, mixing them so some are buried and some are visible.
Objective: Experience the role of mineworkers by recovering as many beans (resources) as possible in each ‘working day’, while keeping the sand in the tub (mine).

Duration: Each ‘working day’ is set for 30 seconds. One person will keep track of the time and signal when to start and stop.
Mining Method: Use only your thumb and index finger to pick one bean at a time and place it onto a plate.
Data Collection: For each round, count the beans collected and record the number on the provided data sheet. Once beans are extracted, they cannot be returned to the mine.
Rounds of Extraction:
• Round 1-5: One person mines
• Round 6-10: Two people mine together
• Round 10-15: Three people mine together
This simulates how more companies join in resource extraction as new reserves are discovered.
Graph Your Results: Use the data collected to create a graph using graph paper or any plotting software like Excel or Sheets. Does the graph resemble a bell curve?
You may notice that after a point, it becomes increasingly difficult to find beans. Keep noting down data until you’ve run out of beans.
space to write your thoughts
1. What thoughts and feelings came to mind while mining throughout the activity?
2. Every country follows its own Hubbert Curve based on the availability of resources and technological advancements in that area. Where do you think India lies on the Hubbert Curve? Have we reached our “peak oil”?
3. Around 2010, the US peak oil curve diverged from Hubbert’s Theory, as the curve began to rise again. What do you think caused this change in trend?
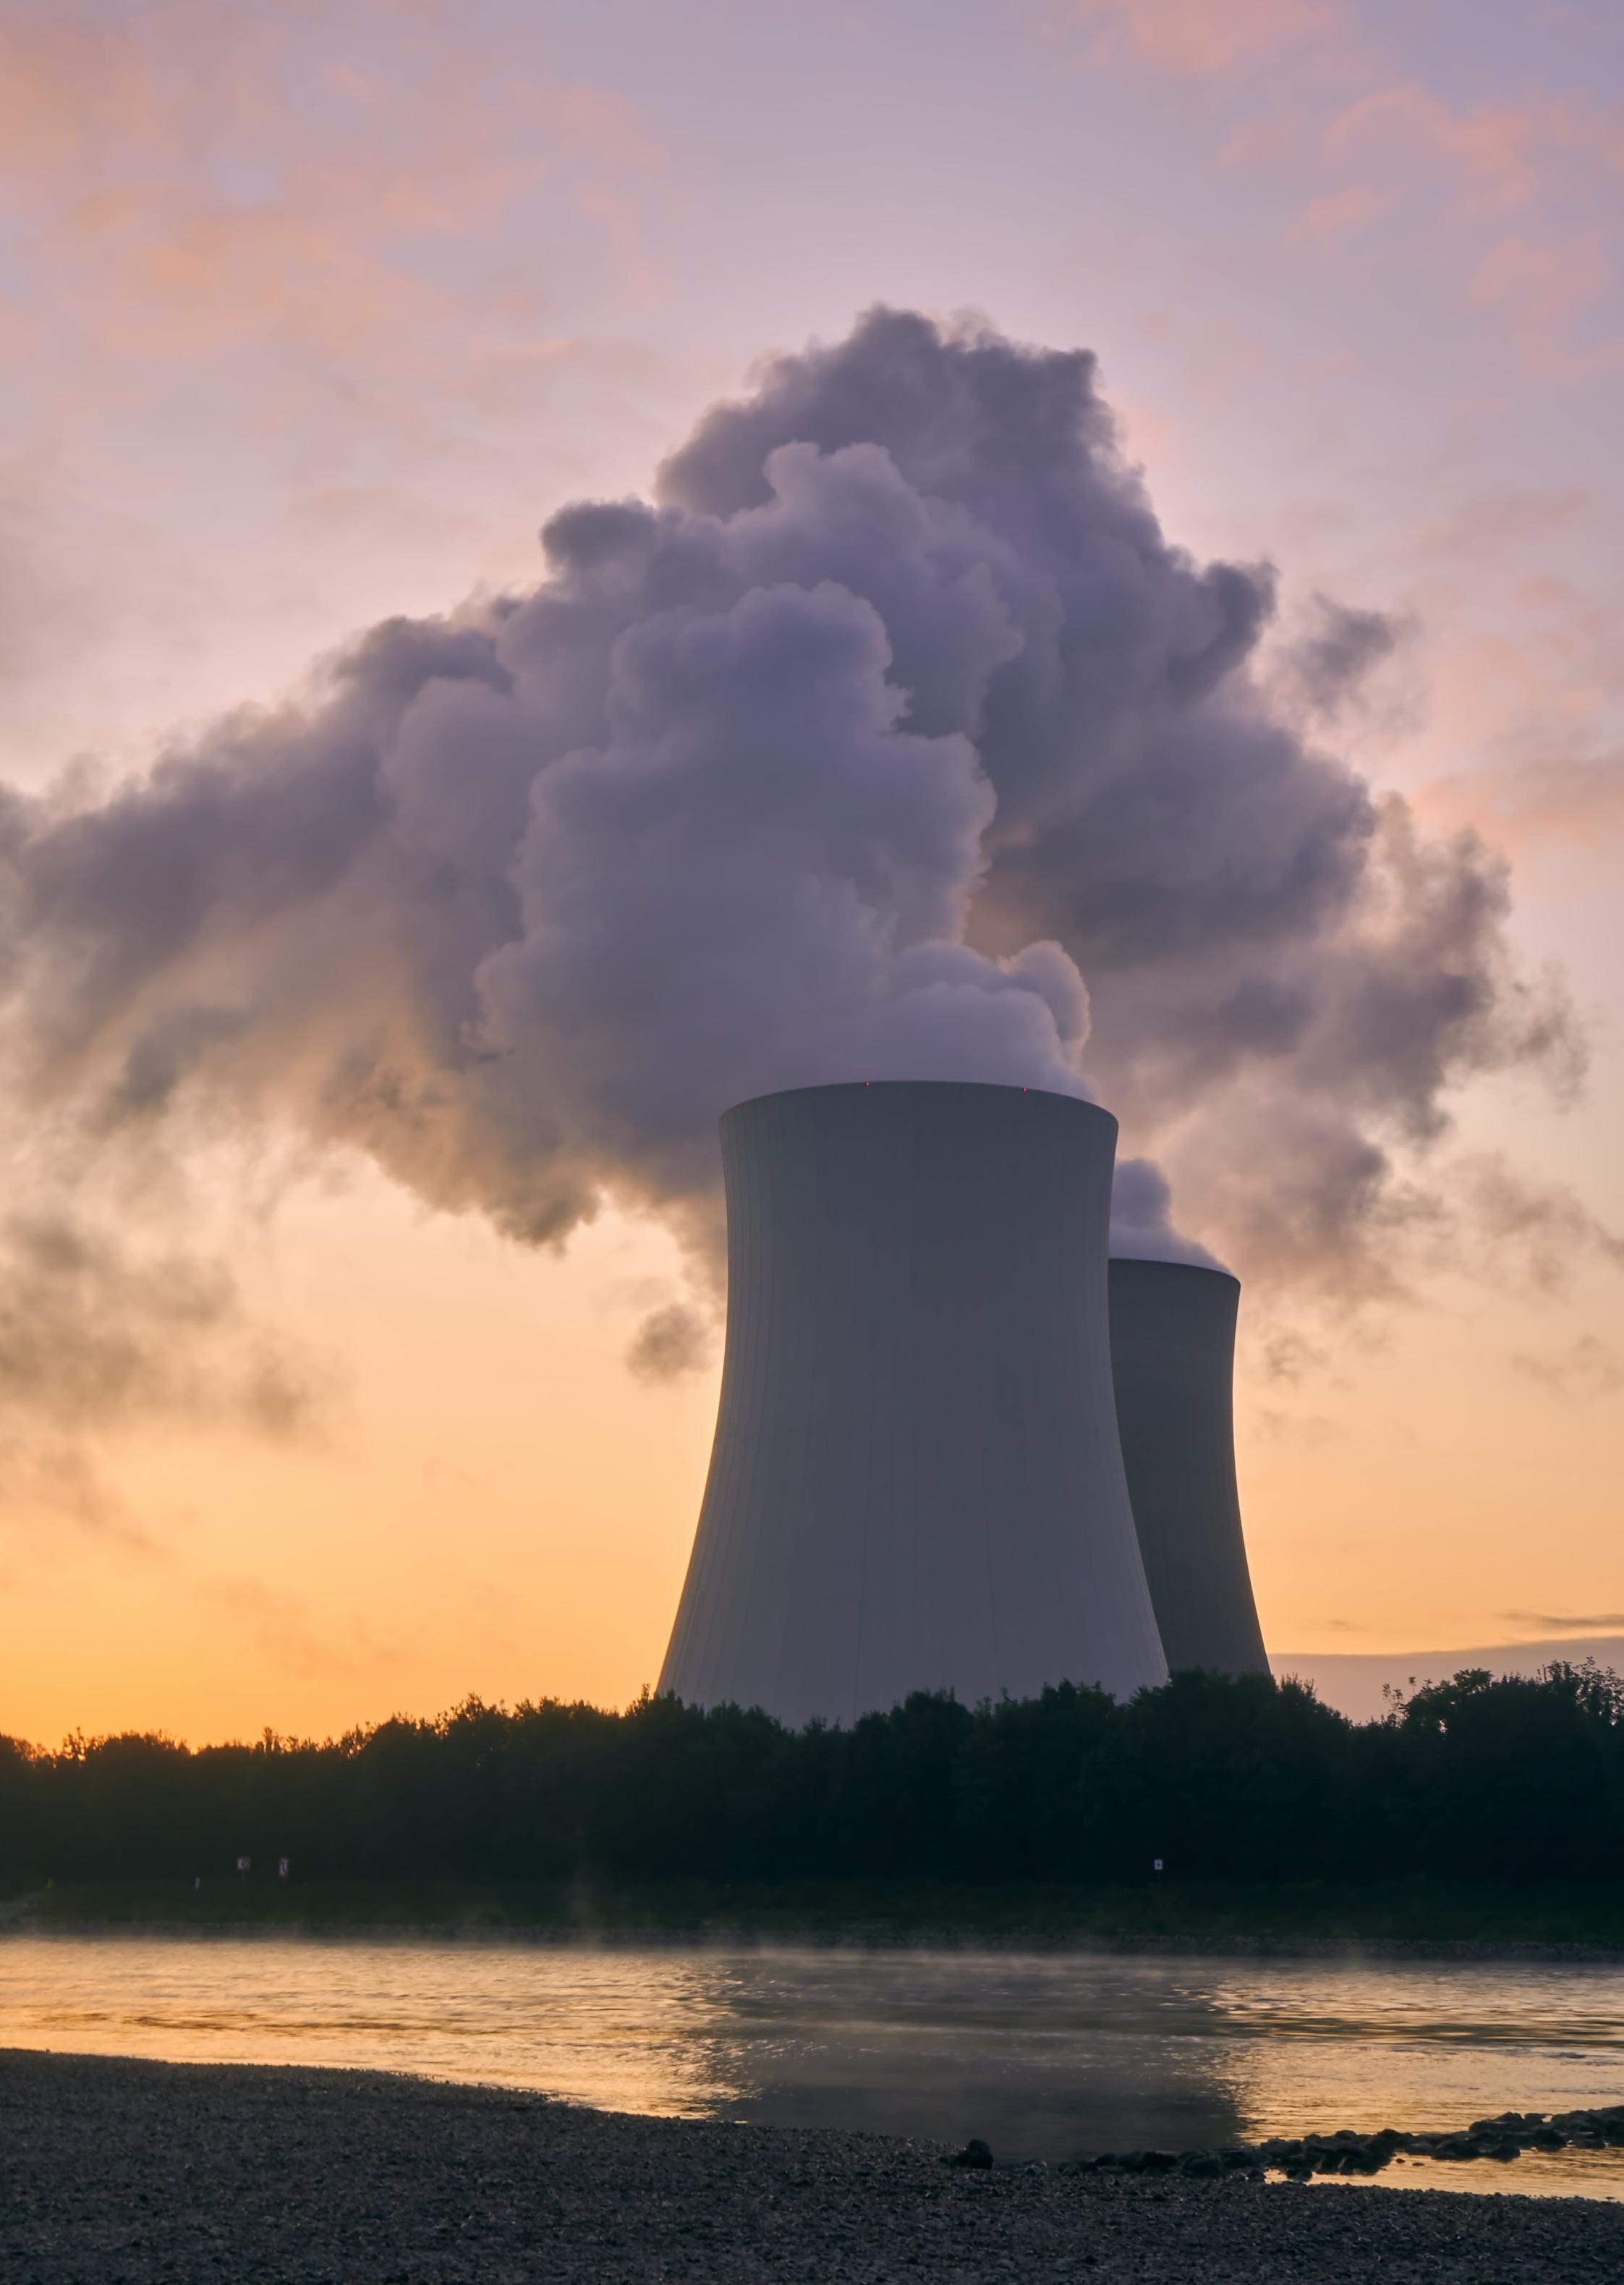
Human-driven climate change is a topic of ongoing discussion and research. Around the world, there is a growing movement urging governments, industries, and individuals to take action to reduce the impact of climate change on people’s lives and livelihoods. In 1972, the United Nations (UN) held its first environmental conference: the First Earth Summit.25 This meeting marked the first time that the UN addressed climate change, recommending that governments implement policies to limit greenhouse gas emissions and other pollutants.
However, one of the earliest warnings about climate change came over 100 years earlier, in 1856, from scientist Eunice Newton Foote. In her research, she studied how different gases in glass tubes responded to sunlight. She discovered that tubes containing water vapour and CO2 retained significant amounts of heat. Foote famously noted that “an atmosphere of that gas would give to our earth a high temperature,” highlighting concerns about rising CO2 levels. Eunice Foote was not only a pioneer in recognising the greenhouse effect but also the first published female physicist in America.
What might have changed if we had listened to Foote and other early warnings? Let’s take a moment to reflect on the history of climate action and honour Eunice Foote’s contributions through blackout poetry. This activity can symbolise both the early alerts about climate change and the often-overlooked voices of female scientists.26
25 United Nations, n.d.
26 Arnold, 1984.
MATERIALS REQUIRED:
All you need is a bold black pen or marker to black out text.
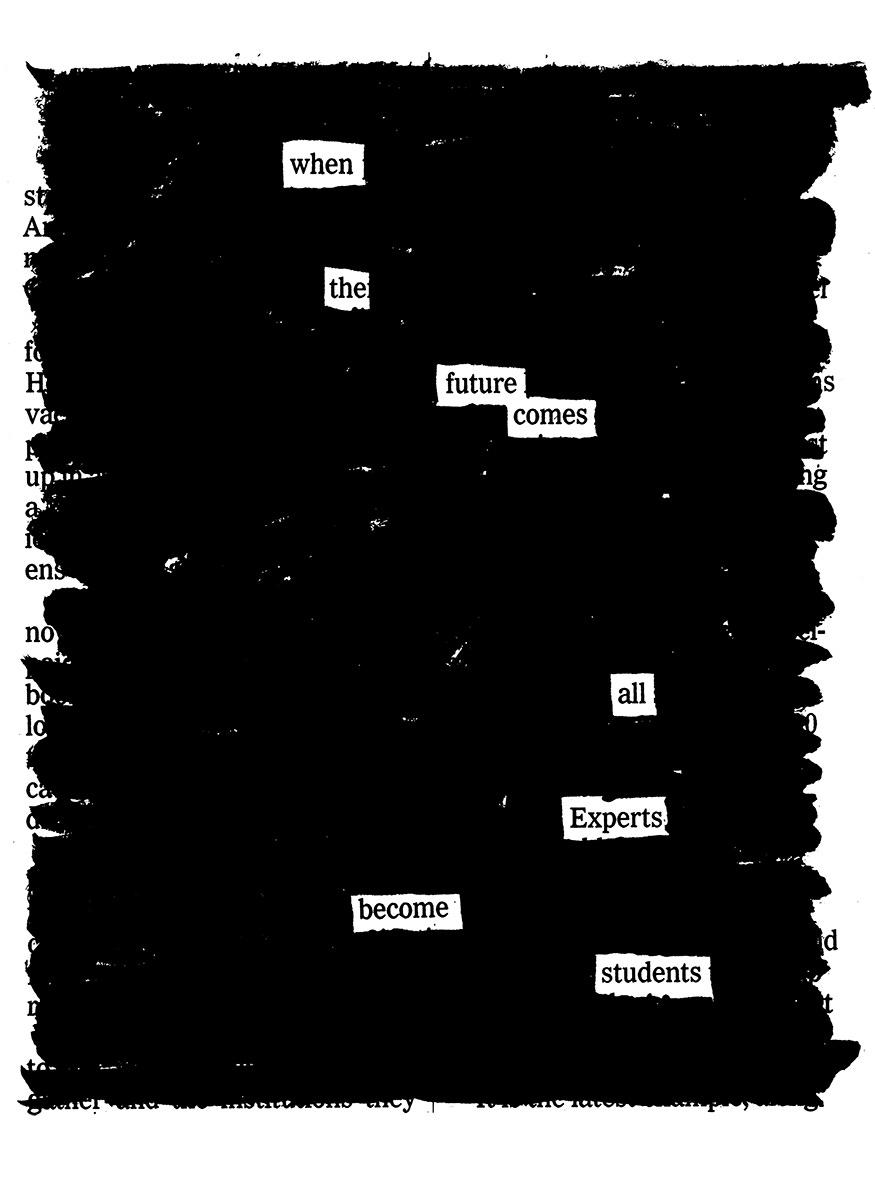
Redaction poetry or Blackout poetry involves using a marker to obscure certain words in an existing text, leaving behind a sequence of words that form a new poem. This kind of poetry is almost like an act of rebellion, in which a piece of writing is transformed to reveal new perspectives.
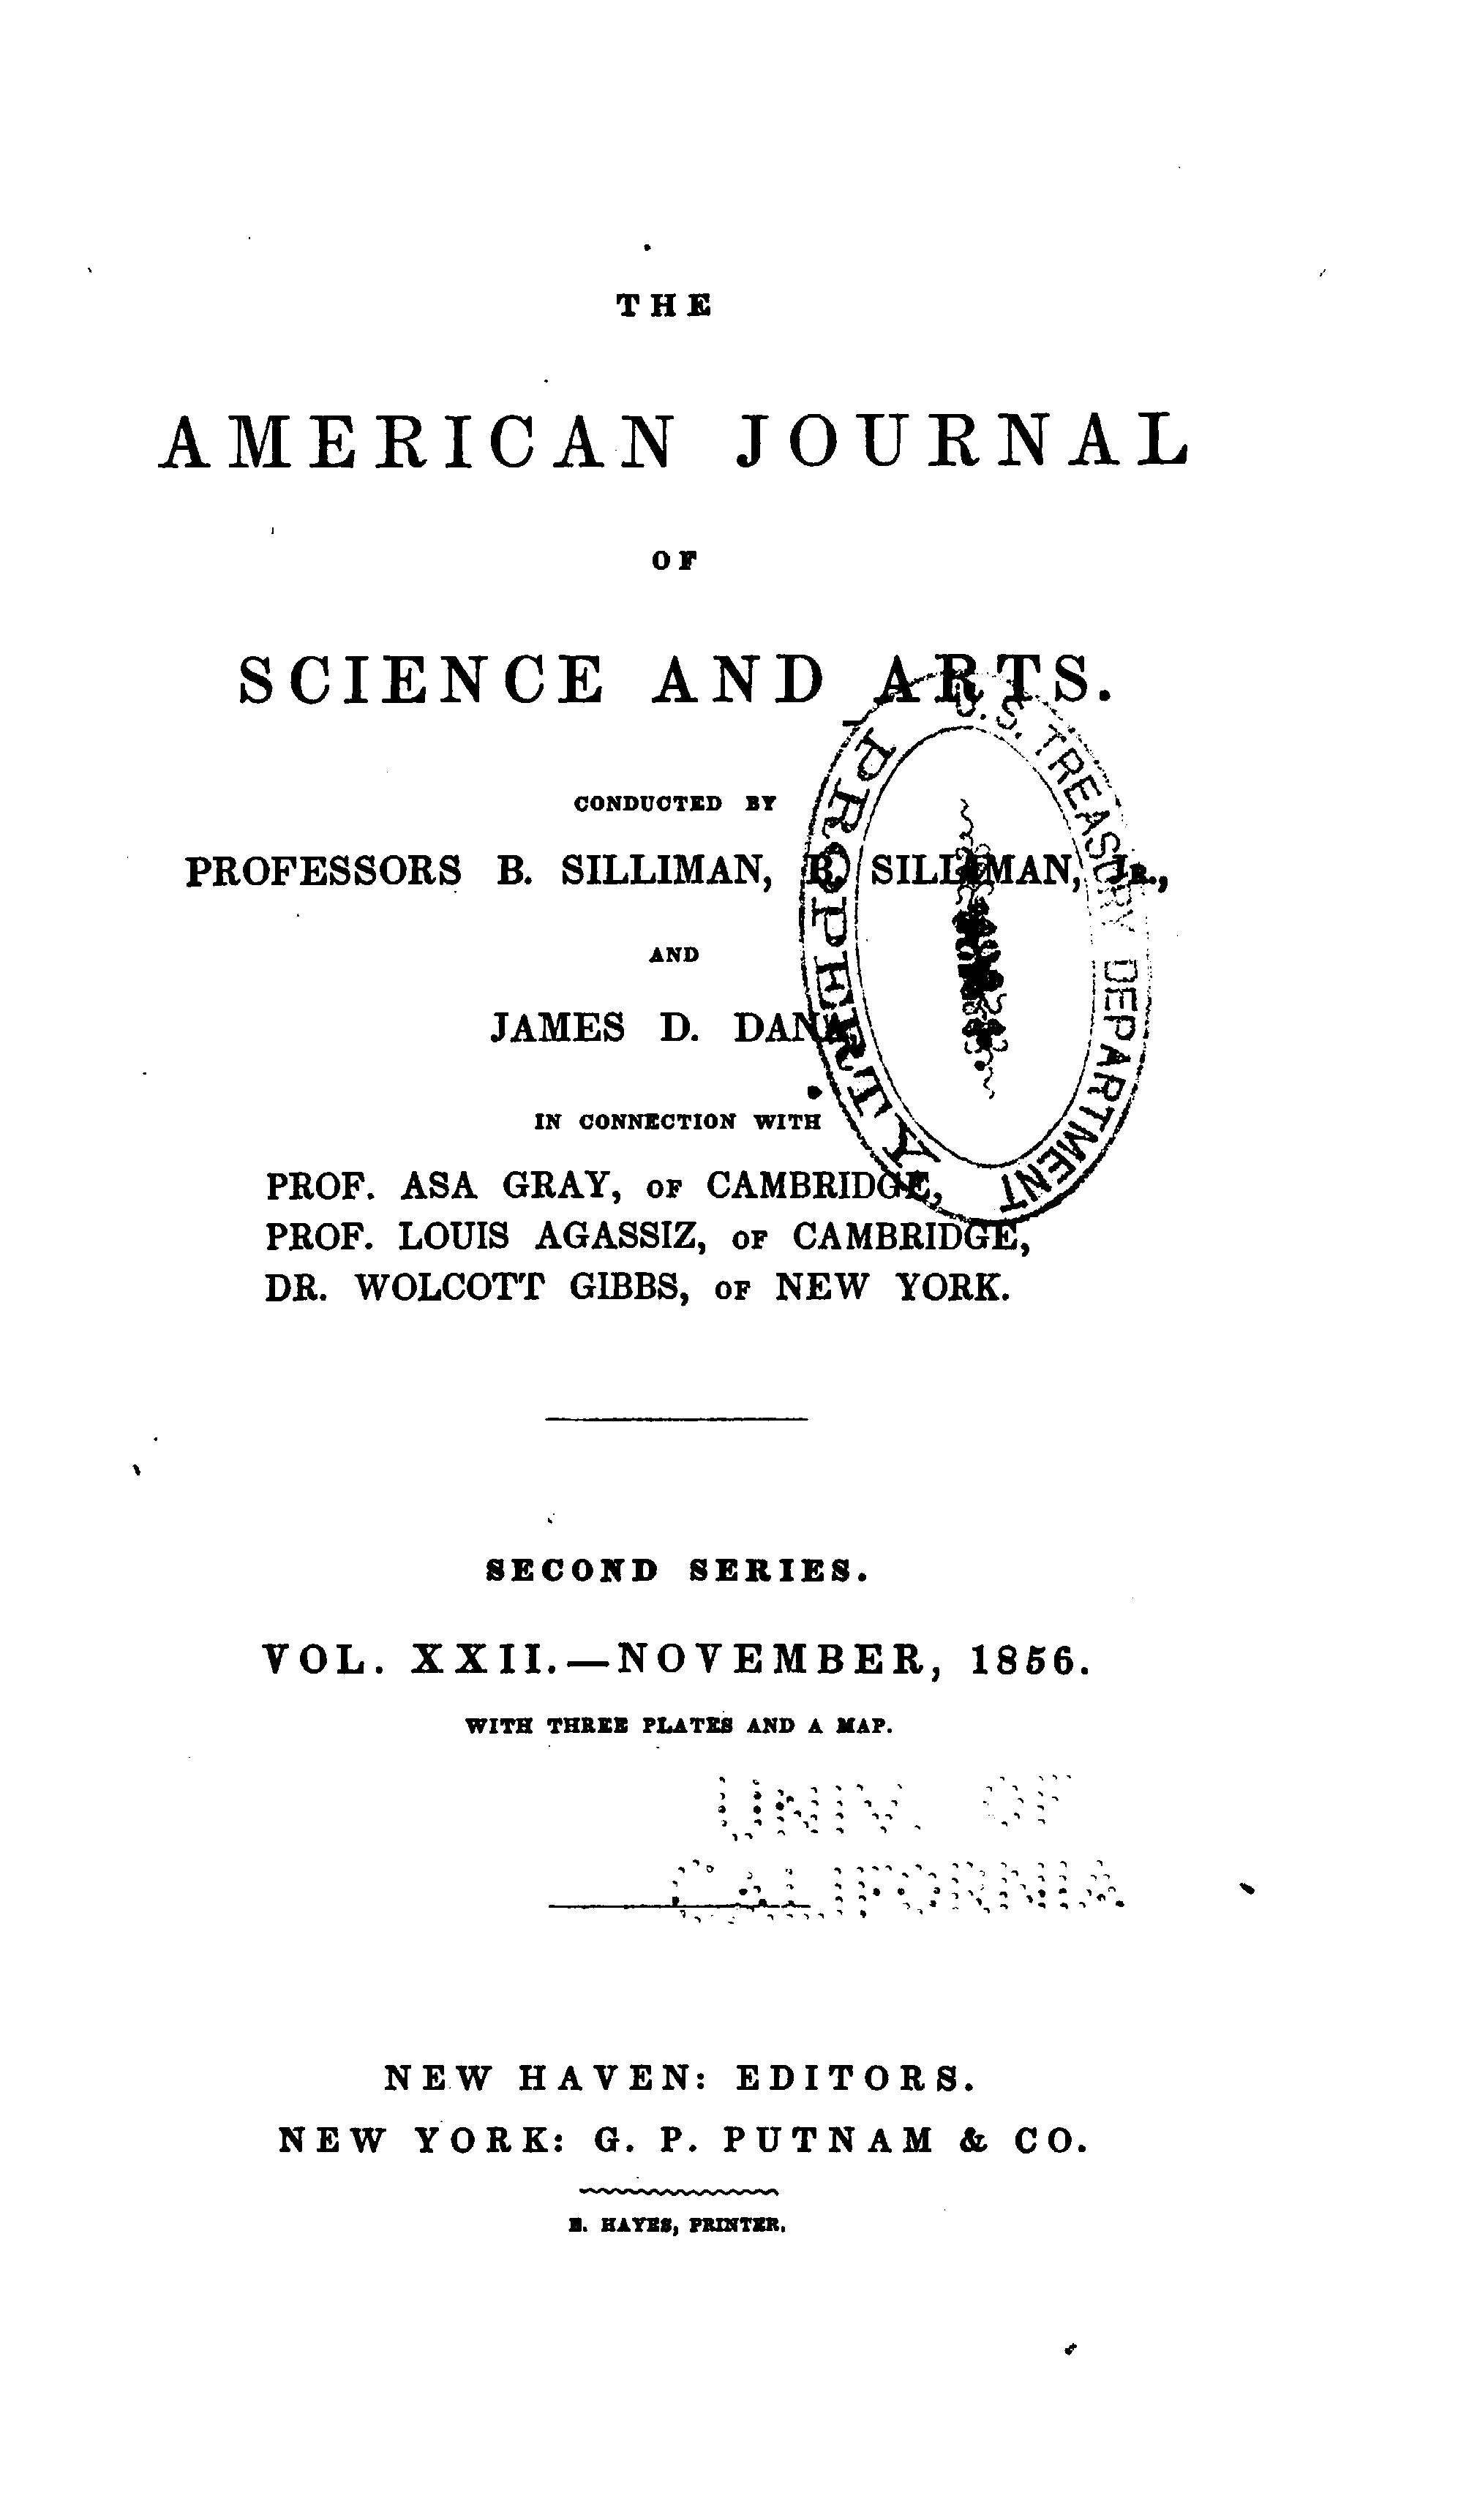
Eunice Foote’s paper “Circumstances affecting the heat of the sun’s rays” (1856)27 is reproduced in the next few pages. Use the research paper itself as the piece of existing text for your blackout poetry.
Below is an example of blackout poetry by Austin Kleon. Let your creative juices flow!
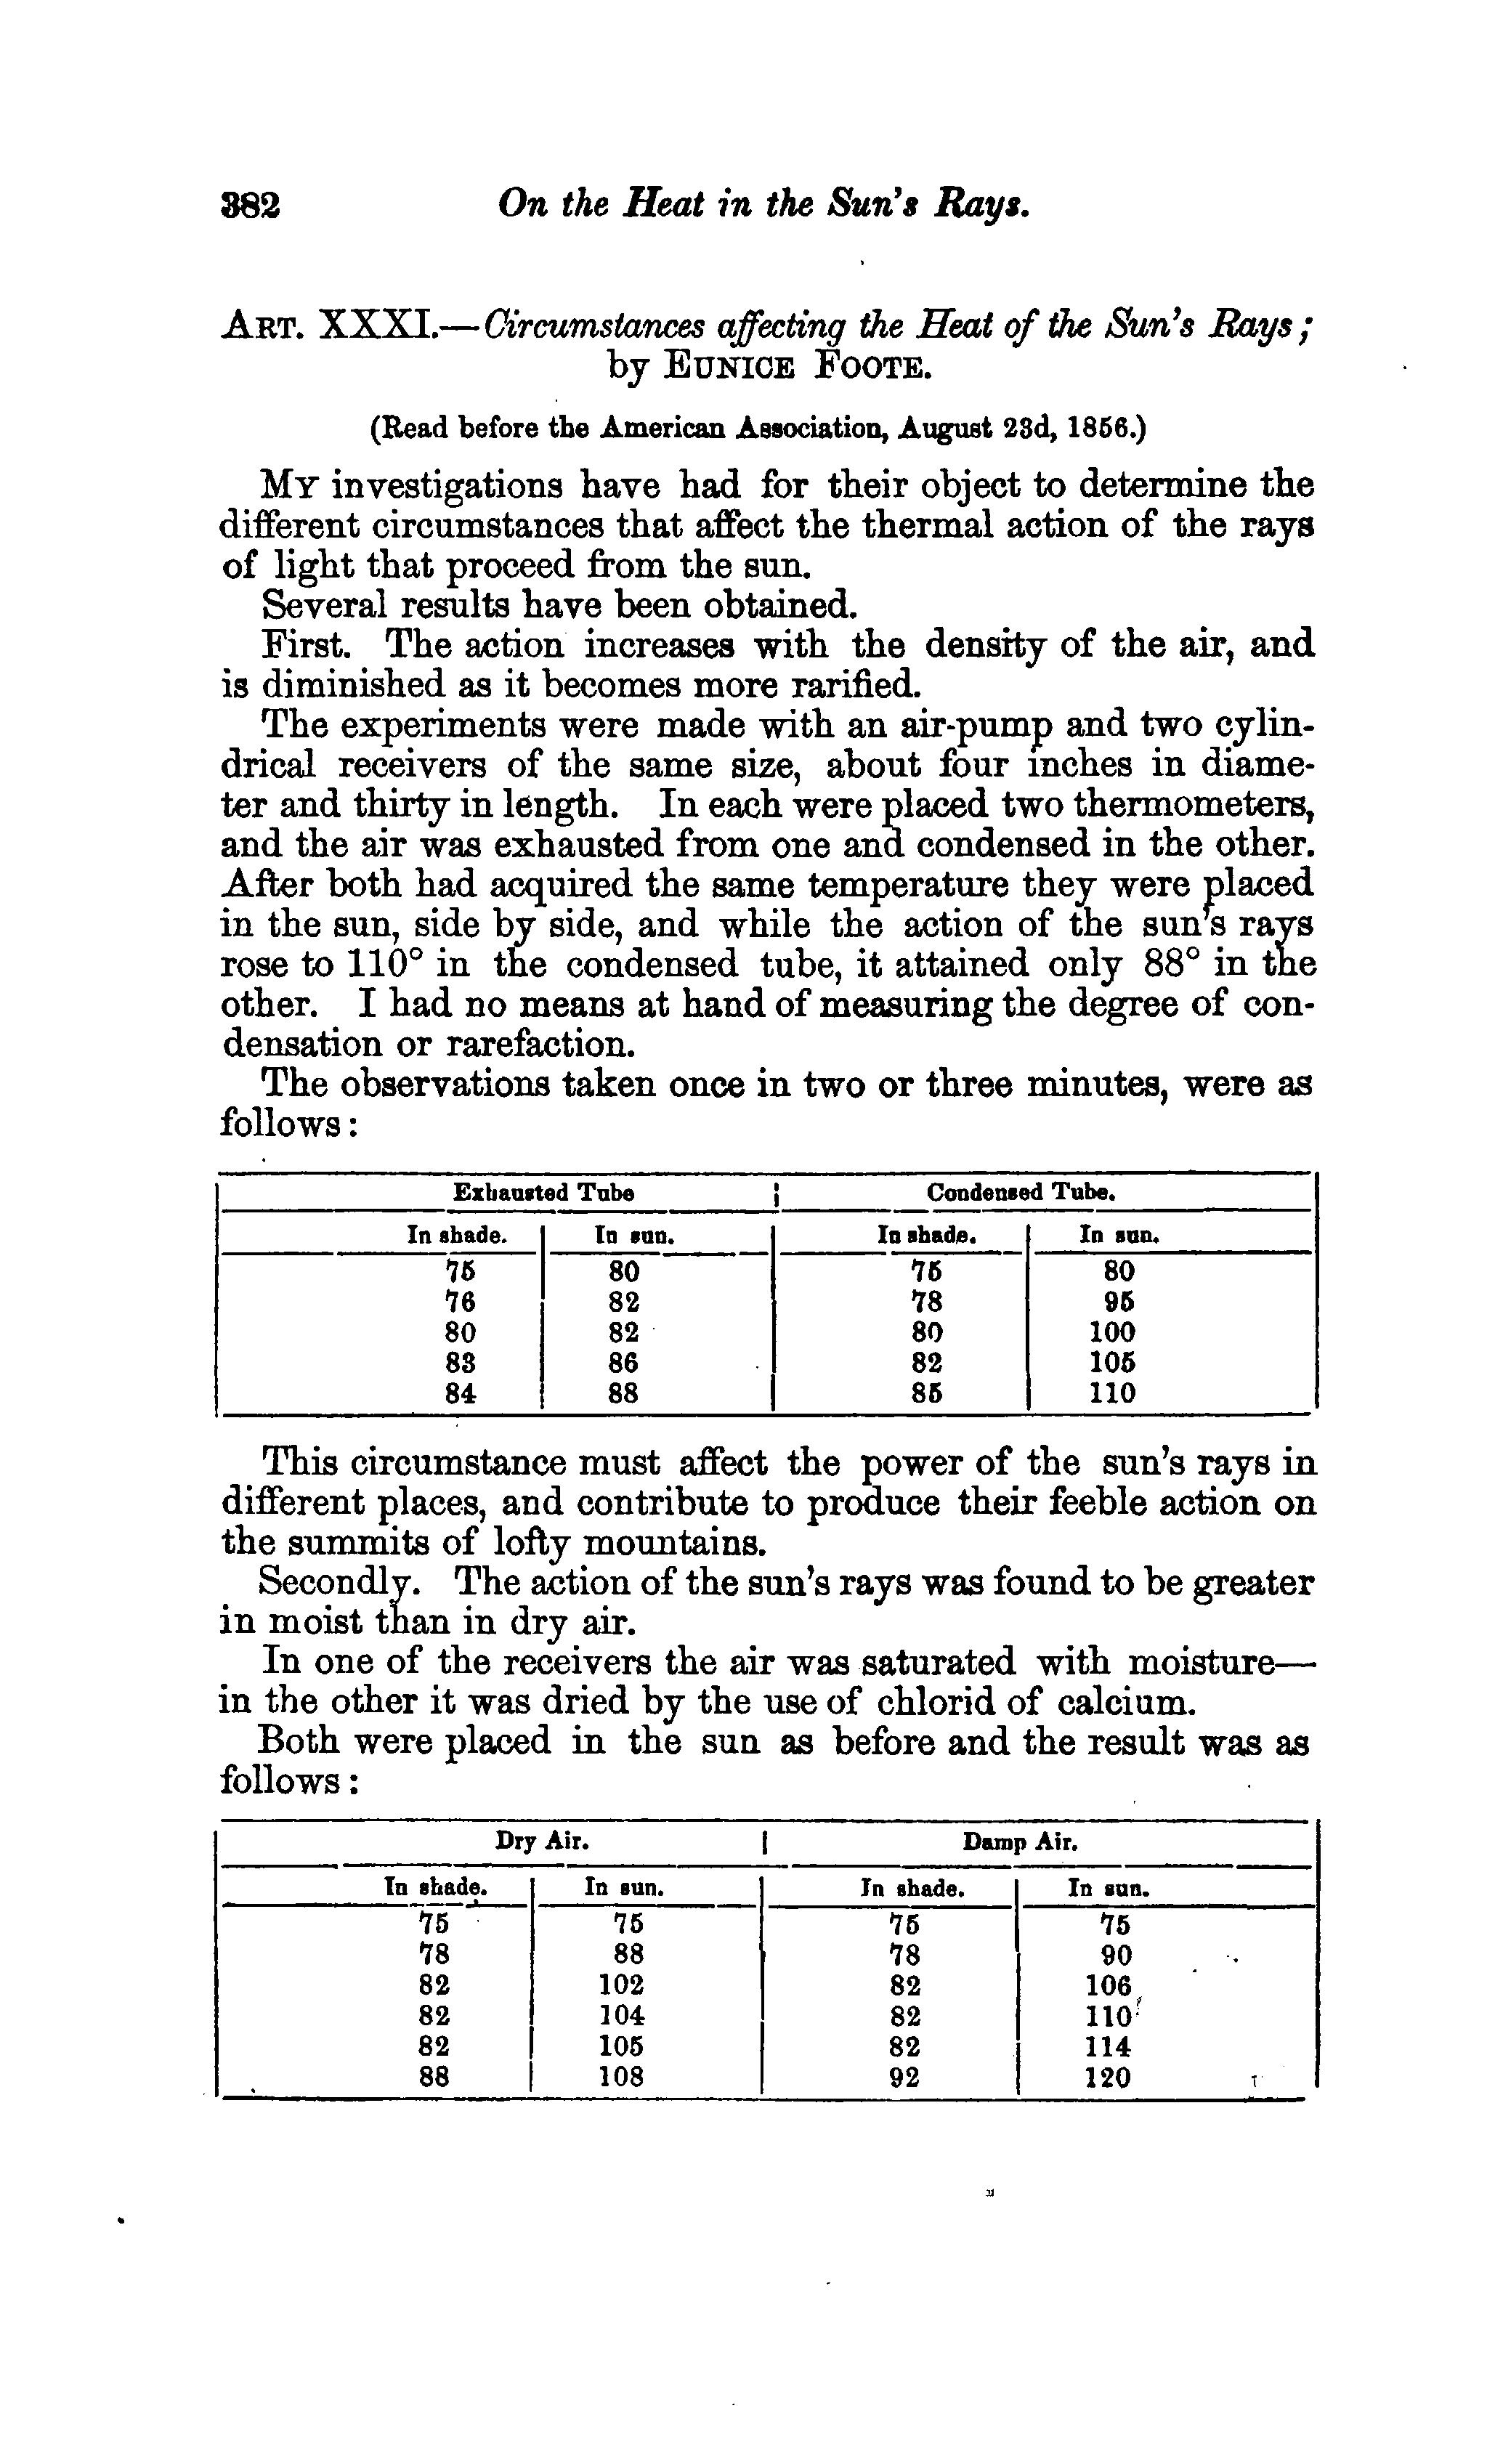
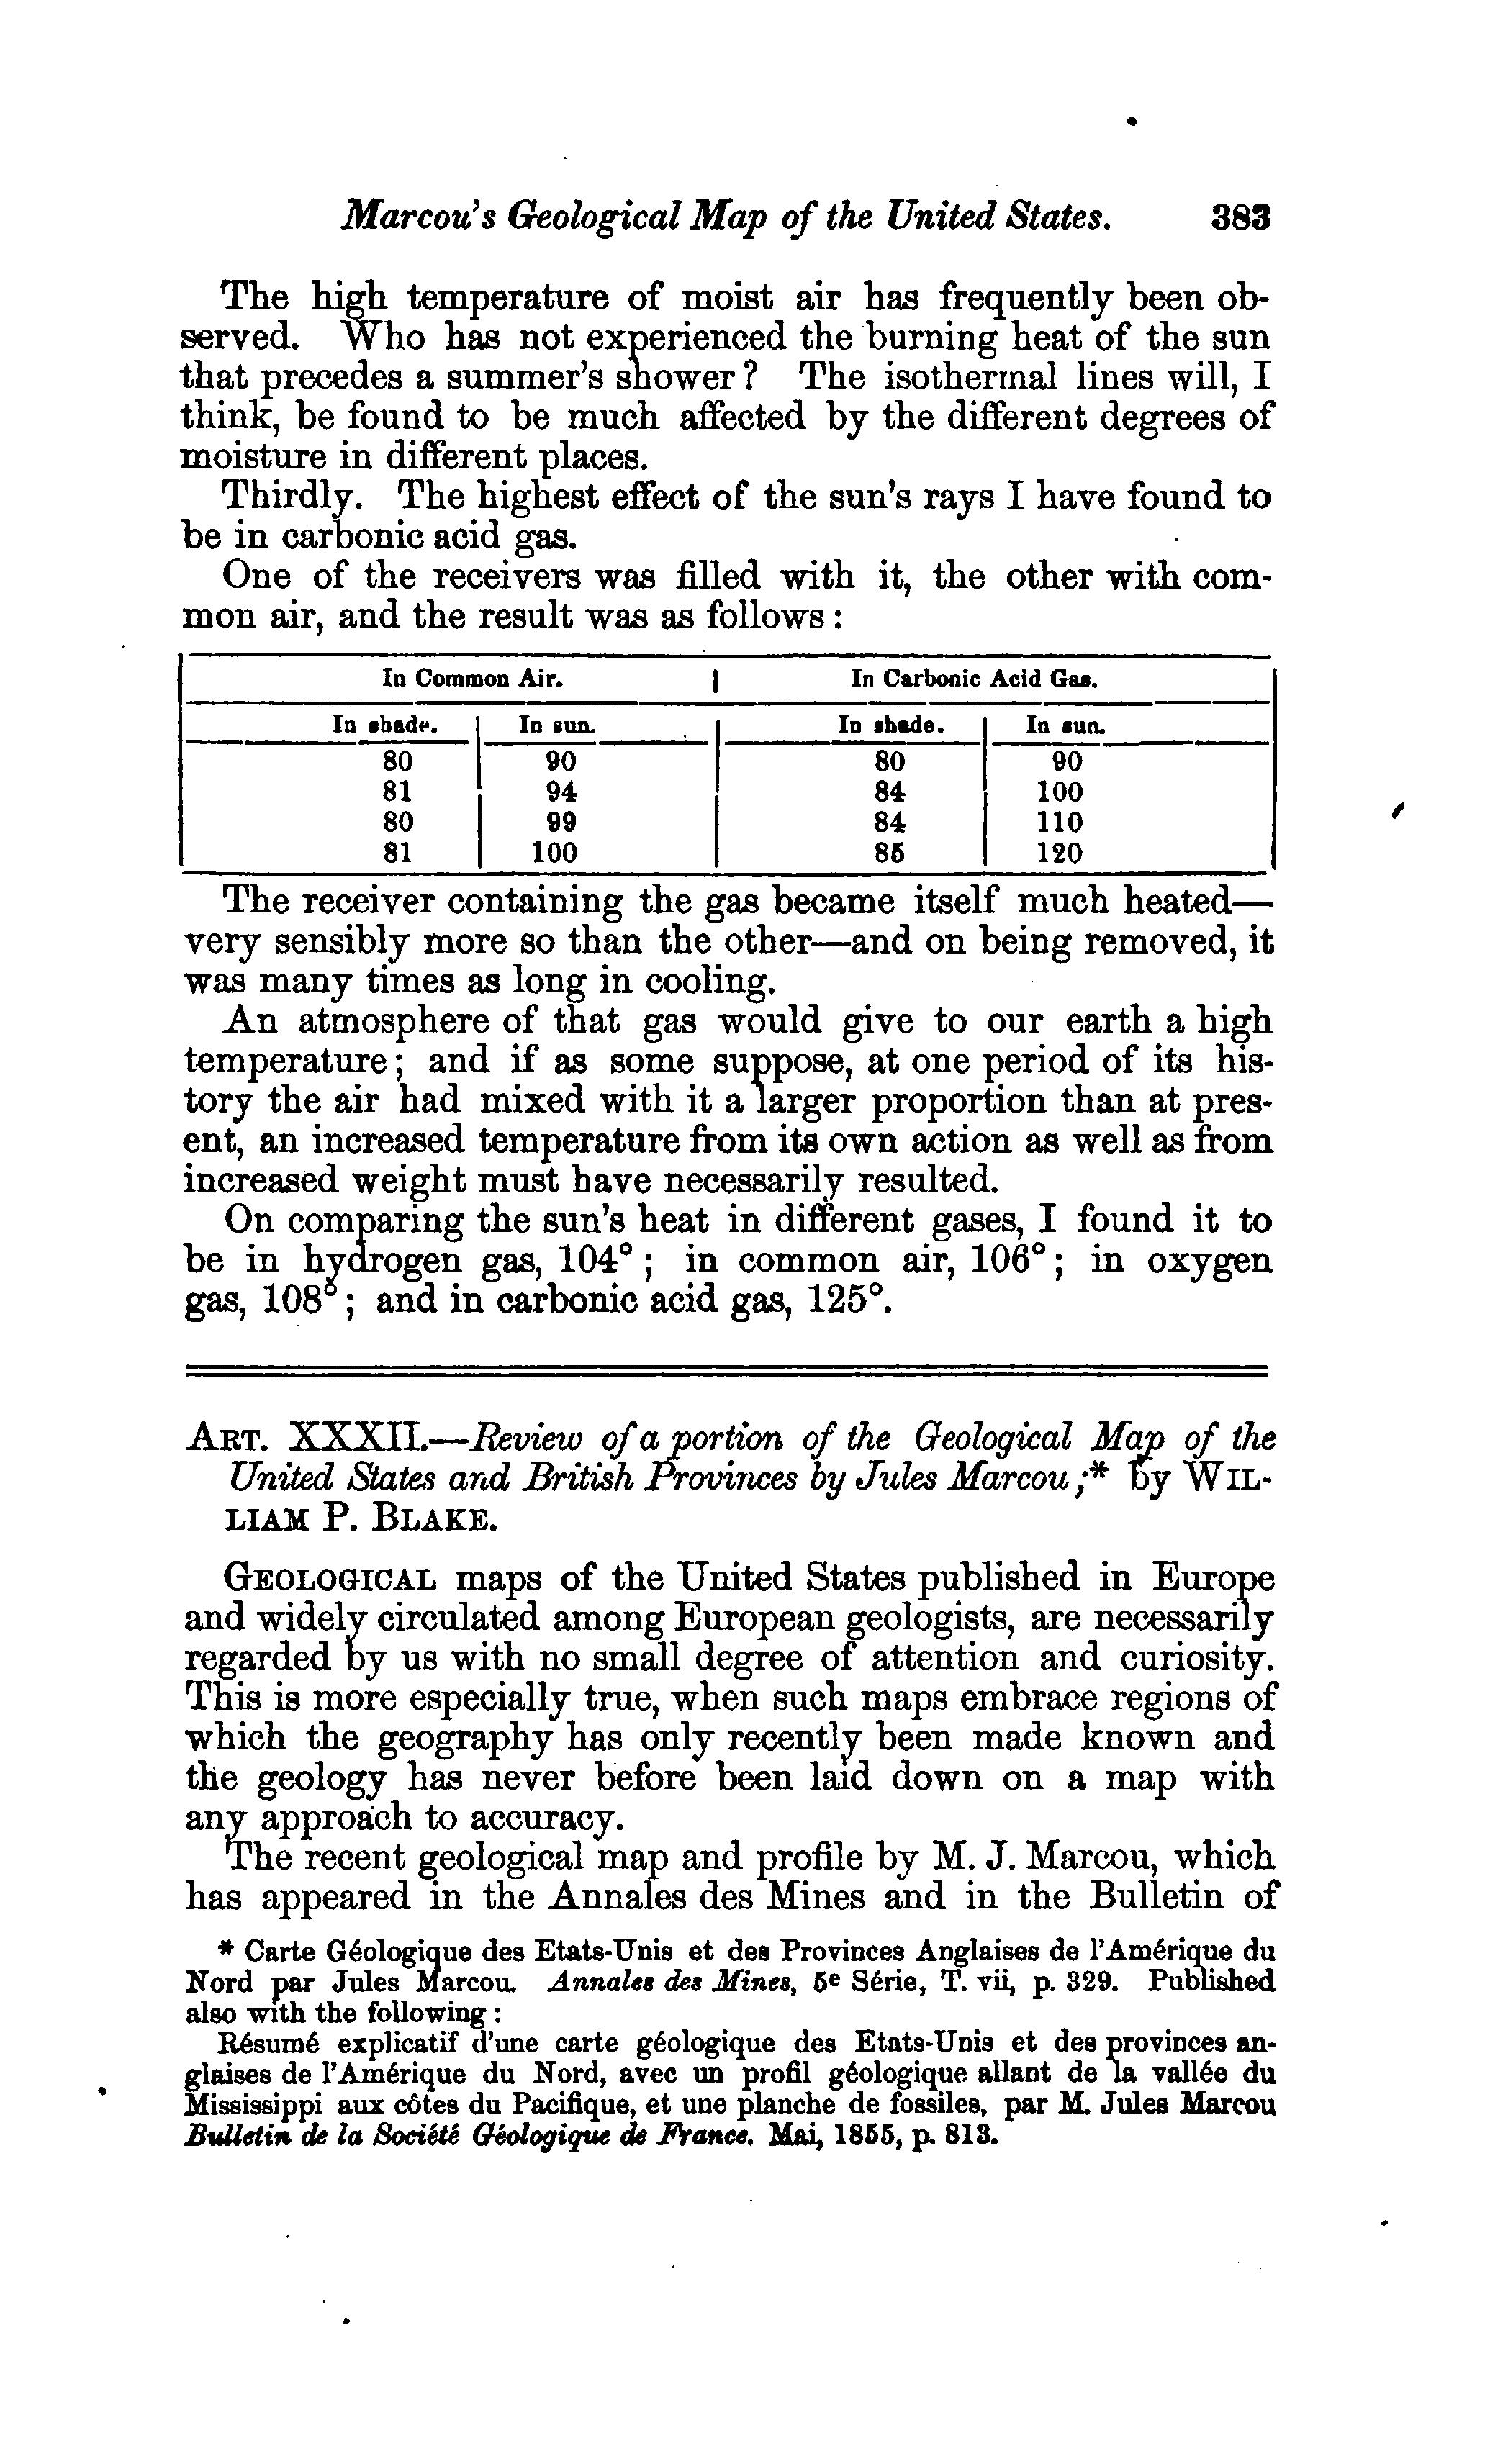
REFLECT:
1.In 1856, Eunice Foote conducted experiments using glass cylinders, thermometers, sunlight, and various gases (like ordinary air and carbon dioxide). She placed the gases in sunlight and measured how hot they became. She discovered that cylinders filled with carbon dioxide heated up more and stayed warm longer than those filled with regular air. This led her to conclude that an atmosphere with more carbon dioxide would make the Earth warmer. The experiments did not require any complex instruments or advanced technology, yet had far-reaching consequences.
Considering the simplicity of her methods, what do you think her findings reveal about the importance of innovative thinking and experimentation in science? How can we apply this to modern challenges related to climate change?
2. What is your climate story? All of us have different instances or experiences in our life when the effects of climate change really hit us. When was the first time that you noticed some effect of climate change?

As the climate crisis deepens, we are witnessing its effects worldwide. Environmental destruction, natural disasters, and loss of biodiversity impact our lives today and will shape our future. The complexity of these issues and the various players involved can make individual efforts seem insignificant. Despite increasing calls for action and ongoing initiatives, global CO2 emissions continue to rise.
In the face of these challenges, it’s common to feel helpless or hopeless. Many young people are grappling with feelings of climate grief and ecological anxiety. A recent survey revealed that 40% of participants aged 16 to 25 from diverse backgrounds are hesitant to have children because of their concerns about climate change.28
Art and storytelling can be powerful tools for processing and coping with these overwhelming feelings. Whether through singing, dancing, writing poetry, or creating simple sketches, we often turn to art for comfort during tough times.
In this activity, we will explore dance and movement as a way to share our stories. From bharatanatyam and kathak to hip-hop and ballet, movement has long been a form of storytelling. You don’t need to be a dancer to join in! Our everyday movements carry the potential to express ideas and emotions. Let’s harness this instinct to tell our own stories about carbon and the climate together as a community.
28 Hickman et al., 2021.
29 Terry, 1942.
30 Aldis, 2018.
As dance critic Walter Terry once said, “No paints nor brushes, marbles nor chisels, pianos or violins are needed to make this art, for we are the stuff that dance is made of. It is born in our body, exists in our body, and dies in our body. Dance, then, is the most personal of all the arts... it springs from the very breath of life”.29
Let’s perform a movement-based exercise! Gather your friends and follow through!
Step 1: Each person should come up with a word related to CARBON. It can be anything that comes to your mind. Collect 5 words like this.
Here is a guide to help you understand the BASTE framework.
In modern movement-based practices, the BASTE framework is the vocabulary that guides artists in developing movement skills and stitching together movements to form an artistic piece.30 It stands for: Body, Action, Space, Time, Energy
Step 2: Using the BASTE framework, connect movements to each of the five words. Choose one way to perform the movement from the options below:
• Use only your fingers (Body)
• Sway side to side (Action)
• Move across the room (Space)
• Perform the movement slowly (Time)
• Execute the movement with power (Energy)
Step 3: Form a circle and share your movements for each word with the group. Discuss whether the movements vary for the same word and reflect on your experiences. space to write your words
Step 4: Using the 5 words, write your own carbon story in 100-150 words.
space to write your story
Final Dance: Stitch together all your 5 moves to narrate your own carbon story through movements.
1. Can you create different stories using the same 5 words? How can you rearrange your movements to tell a new story?
2. In India, storytelling through actions, like dance or drama, has a rich history. What storytelling traditions exist in your area or language? Are any of these focused on climate change or environmental issues?
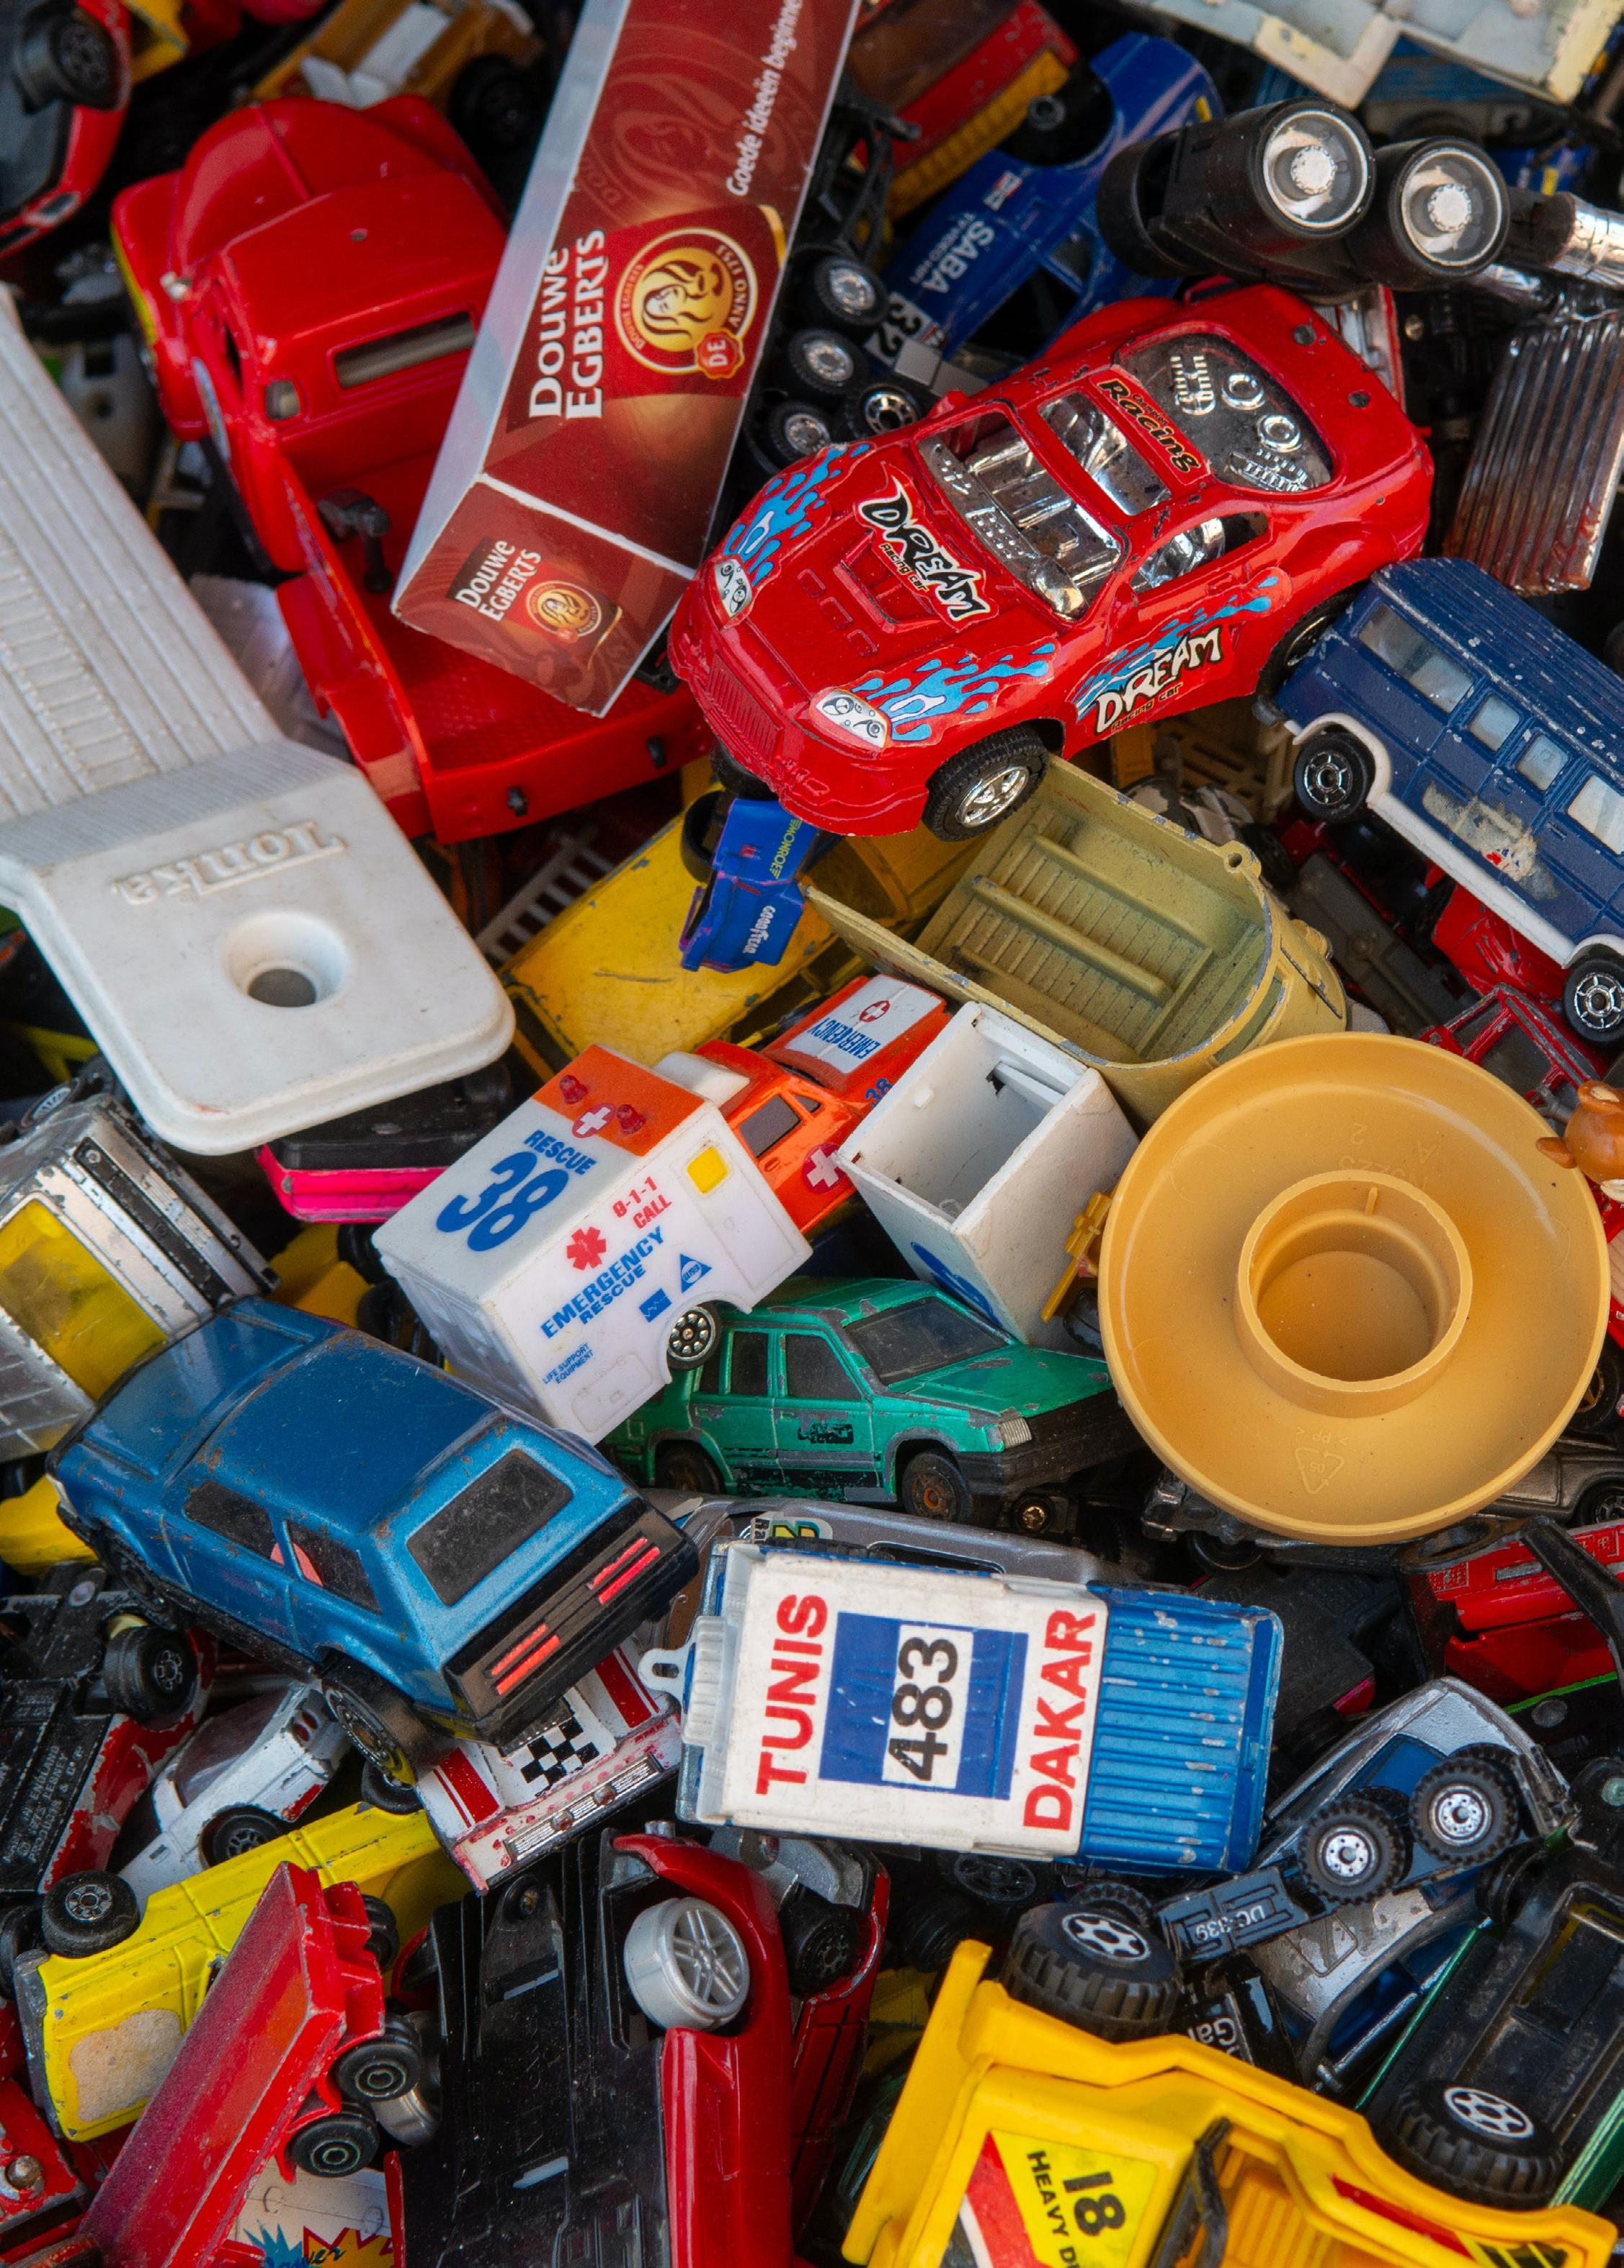
A significant subset of planetary pollution is caused by plastic waste. Be it water bottles, bags, packaging, toys, clothes, or construction—plastic is everywhere. It has made its way into the soil, rainwater and even into the human body. As most plastic used today is non-biodegradable, it accumulates in landfills as consumption steadily increases. In 2019, we produced 450 million tons of plastic globally.31 An estimated 9% of that was recycled, while the rest was dumped or incinerated. With so much plastic in the world, it has actually been considered as one of the geological markers of the Anthropocene era.32
What is plastic made of at a chemical level? Once again, we find that carbon is at the centre stage. The process of plastic production starts with crude oil. Extracted crude oil is a blend of different hydrocarbons which are then separated through the process of fractional distillation. One of the distilled components is naphtha, a family of volatile hydrocarbons. Naphtha is purified under high temperatures to obtain lighter hydrocarbons like ethylene, propylene and butane. These smaller molecules are then made to polymerize, or form chains, to create granules or powders which are the basis for plastics. After this, factories heat, mould and solidify the plastic into objects for use.33 This process is then repeated, again and again, to cater to linear economies of scale and profit-driven planned obsolescence.
31 Ritchie, Samborska, and Roser, 2023.
32 Zalasiewicz et al., 2016.
33 Krosofsky, 2021.
In this grid, search for the answers to the prompts and explore the myriad ways plastic influences our life and culture.
PFOA, a known carcinogen, was used in this coating that makes cooking easier.
Tiny pieces of plastic made reflective by coating with aluminium; found in cosmetics and party supplies.
Which type of plastic is used in packaging mineral water?
A synthetic fibre with exceptional elasticity used to make summer sports attire; an anagram of the word ‘expands’.
The resin identification code (RIC) found on PVC pipes.
The Great _______ Garbage Patch is the largest accumulation of plastic in the open ocean.
A synthetic fibre with incredible tensile strength—10 times stronger than steel, used primarily in personal protection equipments.
This word in Latin means ‘I assembled’, originally made of wooden blocks that could be assembled to create structures.
Most modern plastics are derivatives of ___________.
Most aircraft windows are made of this.
Plastic particles that are smaller than 5mm in size.
Name of the first plastic, invented in 1907.
A type of plasticizer, primarily used to soften PVC.
Plastic man of India who patented the use of plastics in road construction.

1. Different types of plastics can be identified using their resin identification code (RIC)— little triangles with different numbers in them. Look for different objects around you made of different types of plastics by looking at their RIC.
2. What are some unexpected instances where you found plastic being used as a material?
ALLOTROPES
Different forms of the same element with different arrangements of atoms. For example, diamond and graphite are allotropes of carbon.
ANTHROPOCENE
BELL CURVE
BITUMEN
CARBON NANOTUBES
CARBON SINKS
CARBONATION
CHEMICAL BONDS
The current geological age in which human activity has become the dominant influence on climate and the environment.
A graph showing a common pattern of data distribution shaped like a bell. Most values cluster around the middle, with fewer values at the low and high ends. For example, test scores in a large class often form a bell curve.
A thick, black, sticky material made from petroleum, used mainly for roads and roofing.
Extremely tiny tubes made of carbon atoms, known for being very strong and good at carrying electricity.
Natural systems, such as forests, oceans, and soil, that absorb and store carbon dioxide from the atmosphere.
The process of dissolving carbon dioxide gas in a liquid. Soft drinks are carbonated beverages.
The forces that hold atoms together to form molecules and other substances. For example, water forms when hydrogen and oxygen atoms bond together.
CONDUCTOR
FOSSIL FUELS
GREENHOUSE EFFECT
A material that allows heat or electricity to pass through it easily. Metals such as copper are good conductors of electricity.
Fuels such as coal, oil, and natural gas that formed from ancient plants and animals over millions of years.
The process by which gases in Earth’s atmosphere trap the Sun’s heat and warm the planet.
SEQUESTER
To capture and store a substance, especially carbon, so it stays out of the environment. Forests help sequester carbon dioxide.
A tube of small length and width, often in the form of a mesh. It is made of metal or plastic. When vessels in the body, such as the bile duct or artery, are blocked, stents are placed inside to keep those vessels free for movement.
A small electronic device that controls the flow of electricity in electronic devices such as computers and smartphones.
The number of bonds an atom can form by losing, gaining, or sharing electrons. For example, oxygen usually has a valency of 2.
1. Science and Industry Museum. 2021. “Graphene: A New Way of Thinking about Materials,” November 25, 2021.
2. Gerstner, Ed. 2010. “Nobel Prize 2010: Andre Geim & Konstantin Novoselov.” Nature Physics, 2010.
3. Wassei, Jonathan K., and Richard B. Kaner. 2010. “Graphene, a Promising Transparent Conductor.” Materials Today 13 (3): 52–59.
4. Nguyen, Bich Ha, and Van Hieu Nguyen. 2016. “Promising Applications of Graphene and Graphene-Based Nanostructures.” Advances in Natural Sciences: Nanoscience and Nanotechnology 7 (2): 023002.
5. Rogers, Adam. 2017. “Art Fight! The Pinkest Pink Versus the Blackest Black.” WIRED, 2017.
6. Hazen, Robert M. 2019. “Why Carbon?” Scientific American Blog Network. 2019.
7. Pauling, Linus. 1948. “The Modern Theory of Valency.” Journal of the Chemical Society.
8. Wang, Yuanyuan, Rui B.Chang, and Emily R.Liman. 2019. “TRPA1 Is a Component of the Nociceptive Response to CO2 | Journal of Neuroscience.” Journal of Neuroscience 30 (39): 12958–63.
9. Baguley, Richard, and Colin McDonald. 2015. “Appliance Science: The Compressed Chemistry of Carbonation.” CNET, 2015.
10. Gangopadhyay, Uttara. 2023. “Heritage In My Beverage India’s Iconic Sodas.” Outlook Traveller. May 17, 2023.
11. Luque-Lora Rogelio. 2023. “What Is Conservation? “The Struggle over Boundaries and Definitions.” Current Conservation (blog). March 15, 2023.
12. Brown, Barbara N. 2002. “The First Photograph.” November 2002.
13. King, Sandy, John Lockhart, et al. 2018. “A brief history of carbon printing.” AlternativePhotography. 2018.
14. Fabbri, Malin. 2021. “The History of Anthotypes.” AlternativePhotography. 2021.
15. PubChem. 2004. “Curcumin.” National Library of Medicine. 2004.
16. Sharma, Pawankumar, and Bibhu Dash. 2022. “The Digital Carbon Footprint: Threat to an Environmentally Sustainable Future” 14 (July): 19–29.
17. Bawden, Tom. 2016. “How Liking Something on Facebook Can Damage the Planet.” The Independent, January 23, 2016, sec. Climate.
18. CEIC. 2023. “Electricity Consumption: Utilities: Karnataka | Economic Indicators.” Ceicdata.Com. 2023.
19. Griffiths, Sarah. 2020. “Why Your Internet Habits Are Not as Clean as You Think.” Accessed January 11, 2024.
20. Obringer, Renee, Benjamin Rachunok, Debora Maia-Silva, and Kaveh Madani. 2021. “The Overlooked Environmental Footprint of Increasing Internet Use.” Resources, Conservation and Recycling 167 (April): 105389.
21. Worldfavour. n.d. “The Growing Carbon Footprint of Digitalization and How to Control It.” Accessed January 11, 2024.
22. Google Sustainability. 2023. “Sustainable Innovation & Technology.”
23. Kemp, John, and John Kemp. 2023. “China and India Struggle to Curb Fossil Fuels.” Reuters, October 19, 2023, sec. Commodities.
24. McMillen, Stuart. 2015. “Peak Oil Comic about Fossil Fuel Depletion.” 2015.
25. United Nations. n.d. “From Stockholm to Kyoto: A Brief History of Climate Change.” Accessed November 10, 2023.
26. Arnold, Lois. 1984. “Four Lives in Science: Women’s Education in the Nineteenth Century.” New York: Schocken Books.
27. Foote, Eunice. 1856. “Circumstances Affecting the Heat of Sun’s Rays.” American Journal of Art and Science 22: 382-383.
28. Hickman, Caroline, Elizabeth Marks, Panu Pihkala, and Lise van Susteren. 2021. “Climate Anxiety in Children and Young People and Their Beliefs about Government Responses to Climate Change: A Global Survey.” The Lancet Planetary Health 5 (12): e863–73.
29. Terry, Walter. 1942. Invitation to Dance. A. S. Barnes.
30. Aldis, Diane, Genevieve Muench, and Amy Fasteneau. 2018. “The Elements of Dance.” The Elements of Dance. 2018.
31. Ritchie, Hannah, Veronika Samborska, and Max Roser. 2023. “Plastic Pollution.” Our World in Data, November.
32. Zalasiewicz, Jan, Colin N. Waters, Juliana A. Ivar do Sul, Patricia L. Corcoran, Anthony D. Barnosky, Alejandro Cearreta, Matt Edgeworth, et al. 2016.
“The Geological Cycle of Plastics and Their Use as a Stratigraphic Indicator of the Anthropocene.” Anthropocene 13 (March): 4–17.
33. Krosofsky, Andrew. 2021. “The Plastic Making Process Is Harmful to the Environment — Here’s Why.” Green Matters. August 12, 2021.
PAGE 04
PAGE 08
PAGE 14
PAGE 18
PAGE 26
PAGE 32 PAGE 38
PAGE 44
Into the Nanoverse
Photo: AbsolutVision on Pixabay
Element Embroidery
Photo: Merve Sehirli Nasir on Unsplash
Let’s Get Fizzy
Photo: Rathaphon Nanthapreecha on Pexels
Turn Over a New Leaf
Photo: Fatih Turan on Pexels
Cucurmin Clicks
Photo: Anastasia Pavlova on Pexels
Dear (Digital) Diary,
Photo: Wex Cockx, created as a part of Visualizing AI project for Google DeepMind
Fuel for Thought
Photo: 陈敏 同学 (Chén min tóngxué) on Pexels
A Foote note in Climate History
Photo: Markus Distelrath on Pexels
Poem: Kleon, Austin. 2023. ‘I Made You Some Poems’. Substack newsletter. Austin Kleon. May 2.
PAGE 50
PAGE 54
WORDSEARCH ANSWERS
Choreographing Carbon
Photo: Cottonbro studio on Pexels
Life in Plastic: Is it Fantastic?
Photo: Jan van der Wolf on Pexels

Psst, use this space to play dots and boxes!