Linden Road Academy and Hearing Impaired Base Governor Dashboard What it is
LA Tameside DFE 3572014 Produced April 2016 Version 1
Key Stage
2015
1
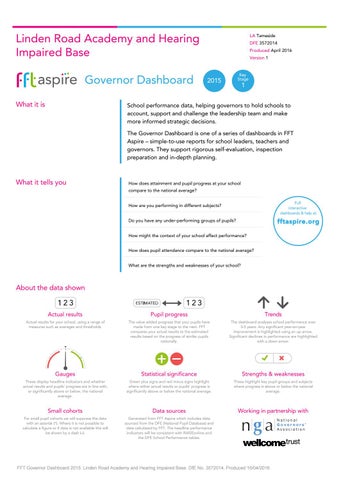
School performance data, helping governors to hold schools to account, support and challenge the leadership team and make more informed strategic decisions. The Governor Dashboard is one of a series of dashboards in FFT Aspire – simple-to-use reports for school leaders, teachers and governors. They support rigorous self-evaluation, inspection preparation and in-depth planning.
What it tells you
How does attainment and pupil progress at your school compare to the national average? Full interactive dashboards & help at
How are you performing in different subjects? Do you have any under-performing groups of pupils?
fftaspire.org
How might the context of your school affect performance? How does pupil attendance compare to the national average? What are the strengths and weaknesses of your school?
About the data shown
Actual results
Pupil progress
Trends
Actual results for your school, using a range of measures such as averages and thresholds.
The value added progress that your pupils have made from one key stage to the next. FFT compares your actual results to the estimated results based on the progress of similar pupils nationally.
The dashboard analyses school performance over 3-5 years. Any significant year-on-year improvement is highlighted using an up arrow. Significant declines in performance are highlighted with a down arrow.
Gauges
Statistical significance
Strengths & weaknesses
These display headline indicators and whether actual results and pupils’ progress are in line with, or significantly above or below, the national average.
Green plus signs and red minus signs highlight where either actual results or pupils’ progress is significantly above or below the national average.
These highlight key pupil groups and subjects where progress is above or below the national average.
Small cohorts
Data sources
Working in partnership with
For small pupil cohorts we will suppress the data with an asterisk (*). Where it is not possible to calculate a figure or if data is not available this will be shown by a dash (–).
Generated from FFT Aspire which includes data sourced from the DFE (National Pupil Database) and data calculated by FFT. The headline performance indicators will be consistent with RAISEonline and the DFE School Performance tables.
FFT Governor Dashboard 2015: Linden Road Academy and Hearing Impaired Base. DfE No. 3572014. Produced 16/04/2016