Total Total
1.9% 1.9%
Construction Construction
0.8% 0.8%
Manufacturing Manufacturing
0.2% 0.2%
Information Information
2.2% 2.2%
Financial Activities Activities Financial Other Services Services Other
1.7% 1.7% -2.8% -2.8%
Government Government
3.0% 3.0%
Education/Health Services Services Education/Health
8.4% 8.4%
Leisure/Hospitality Services Services Leisure/Hospitality
September 2025
2.4% 2.4%
Natural Resources Resources Natural
0.0% 0.0%
DASHBOARD
Professional/Business Services Services Professional/Business
0.6% 0.6%
Trade/Transportation/Utilities Trade/Transportation/Utilities
12% 12% 10% 10% 8% 8% 6% 6% 4% 4% 2% 2% 0% 0% -2% -2% -4% -4% -6% -6% -8% -8% -10% -10% -12% -12% -14% -14%
-1.0% -1.0%
1.9% The Road to Prosperity Dashboard1.9% tracks Utah’s economic outlook. 0.8% 0.8% The Dashboard, which is updated monthly, provides essential insights, tracks timely and leading measures, and shares salient indicators.
THREE ESSENTIAL 2012 2014INSIGHTS: 2016 2018 2012 2014 2016 2018
1 10% 10%
US US
2
2020 2020 Utah Utah
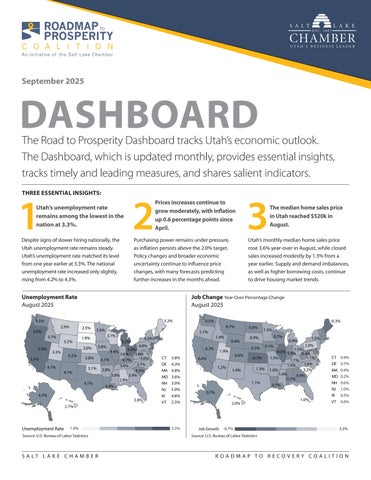
Utah’s unemployment rate remains among the lowest in the nation at 3.3%.
5% 5%
Despite signs of slower hiring nationally, the Utah 0% unemployment rate remains steady. 0% Utah’s unemployment rate matched its level from -5% one year earlier at 3.3%. The national -5% unemployment rate increased only slightly, rising from 4.2% to 4.3%. -10% -10%
2022 2022
2024 2024
Prices increases continue to grow moderately, with inflation up 0.6 percentage points since April.
Purchasing power remains under pressure, as inflation persists above the 2.0% target. Policy changes and broader economic uncertainty continue to influence price changes, with many forecasts predicting further increases in the months ahead.
Unemployment Rate August 2025 3.2% 3.2%
5.0% 5.0%
3.7% 3.7%
5.3% 5.3%
3.2% 3.2% 4.2% 4.2%
5.5% 5.5% 4.1% 4.1%
2.5% 2.5%
4.1% 4.1%
3.6% 3.6%
1.9% 1.9%
3.8% 3.8%
4.7% 4.7%
Unemployment Rate Rate Unemployment
4.0% 4.0%
5.2% 5.2%
3.8% 3.8% 2.7% 2.7%
1.9% 1.9%
Source: U.S. Bureau of Labor Statistics
S A LT L A K E C H A M B E R
0.5% 0.5% 1.1% 1.1%
3.1% 3.1%
4.0% 4.0% 5.0% 5.0% 4.4% 4.4% 3.6% 3.8% 3.8% 3.6% 3.8% 3.6% 3.8% 3.6% 4.1% 4.7% 4.1% 4.7% 3.7% 3.7% 3.6% 3.6% 3.1% 3.8% 3.1% 3.8% 4.3% 4.3% 3.9% 3.4% 3.9% 3.4% 2.9% 2.9% 4.1% 4.1% 4.4% 4.4%
3.0% 3.0%
3.3% 3.3%
Utah’s monthly median home sales price rose 3.6% year-over in August, while closed sales increased modestly by 1.3% from a year earlier. Supply and demand imbalances, as well as higher borrowing costs, continue to drive housing market trends.
Job Change Year-Over Percentage Change August 2025
4.5% 4.5% 2.9% 2.9%
3
The median home sales price in Utah reached $520k in August.
-0.3% -0.3% 0.7% 0.7% 1.4% 1.4%
0.3% 0.3% 3.8% CT 3.8% CT DE 4.3% 4.3% DE 4.8% MA 4.8% MA 3.6% MD 3.6% MD 3.0% NH 3.0% NH 5.0% NJ 5.0% NJ 4.6% RI 4.6% RI 2.5% VT 2.5% VT
5.5% 5.5%
0.4% 0.4%
0.9% 0.9% 0.5% 0.5%
1.9% 1.9%
0.4% 0.4%
0.4% 0.4% 1.2% 1.2%
0.6% 0.6%
1.4% 1.4%
1.3% 1.3% 0.7% 0.7% 0.1% 0.1%
0.9% 0.9%
1.5% 1.5% 2.0% 2.0%
1.5% 1.5% -0.2% 0.6% -0.2% 0.6% 0.4% 0.4% 1.1% -0.7% 1.3% 1.1% -0.7% 1.3% 1.1% 1.1% 1.6% 1.6% 1.0% 1.0% 1.3% 1.6% 1.3% 3.2% 1.6% 3.2% 1.4% 1.4% 0.6% 0.6% 0.7% 0.7% 1.1% 1.1% 0.7% 0.7%
0.7% 0.7% 2.0% 2.0%
-0.7% JobGrowth Growth -0.7% Job
1.0% 1.0%
CT 0.9% 0.9% CT DE 0.7% 0.7% DE MA 0.4% 0.4% MA MD 0.2% 0.2% MD NH 0.6% 0.6% NH NJ 1.0% 1.0% NJ RI 0.5% 0.5% RI VT 0.6% 0.6% VT
3.2% 3.2%
Source: U.S. Bureau of Labor Statistics
ROADMAP TO RECOVERY COALITION