Total Total
1.9% 1.9%
Construction Construction
0.8% 0.8%
Manufacturing Manufacturing
0.2% 0.2%
Information Information
2.2% 2.2%
Financial Activities Activities Financial Other Services Services Other
1.7% 1.7% -2.8% -2.8%
Government Government
3.0% 3.0%
Education/Health Services Services Education/Health
8.4% 8.4%
Leisure/Hospitality Services Services Leisure/Hospitality
November 2025
2.4% 2.4%
Natural Resources Resources Natural
0.0% 0.0%
DASHBOARD
Professional/Business Services Services Professional/Business
0.6% 0.6%
Trade/Transportation/Utilities Trade/Transportation/Utilities
12% 12% 10% 10% 8% 8% 6% 6% 4% 4% 2% 2% 0% 0% -2% -2% -4% -4% -6% -6% -8% -8% -10% -10% -12% -12% -14% -14%
-1.0% -1.0%
1.9% The Road to Prosperity Dashboard1.9% tracks Utah’s economic outlook. 0.9% 0.9% The Dashboard, which is updated monthly, provides essential insights, tracks timely and leading measures, and shares salient indicators.
THREE ESSENTIAL 2012 2014INSIGHTS: 2016 2018 2012 2014 2016 2018
1 10% 10%
U.S. U.S.
2020 2020 Utah Utah
With the federal government shutdown ending in November, data visibility resumes.
5% 5%
Data releases from federal statistical agencies resumed, though some delays continue for 0% 0% certain indicators, including those related to labor -5% markets and employment. -5%
2 2022 2022
2024 2024
Utah’s Zions Bank Consumer Sentiment increases while U.S. consumer sentiment dips in November.
While Utah consumer sentiment rose 3.4% to a value of 75.8, the gap between Utah and the U.S. continues to widen as the U.S. index fell by 4.9%, to its lowest level since June 2022.
-10% -10%
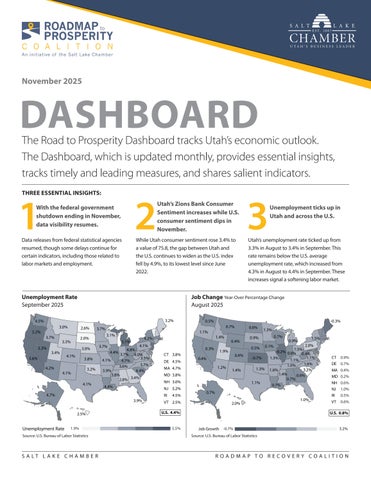
Unemployment Rate September 2025
5.2% 5.2%
3.2% 3.2%
3.7% 3.7%
5.3% 5.3%
4.1% 4.1%
5.6% 5.6%
3.7% 3.7%
3.8% 3.8% 3.2% 3.2%
4.1% 4.1%
4.1% 4.1%
4.2% 4.2%
5.1% 5.1%
4.1% 4.1% 4.8% 4.8% 4.4% 3.7% 4.4% 4.0% 3.7% 4.0% 3.5% 3.5% 4.1% 4.7% 4.1% 4.7% 3.7% 3.7% 3.6% 3.6% 3.9% 4.4% 3.9% 4.4% 3.8% 3.8% 3.4% 3.4% 2.8% 2.8%
3.7% 3.7%
4.4% 4.4%
4.7% 4.7% 3.9% 3.9% 2.5% 2.5%
Unemployment Rate Rate Unemployment
1.9% 1.9%
Source: U.S. Bureau of Labor Statistics
S A LT L A K E C H A M B E R
0.5% 0.5% 1.1% 1.1%
3.1% 3.1%
2.0% 2.0% 3.0% 3.0%
3.4% 3.4%
4.2% 4.2%
2.6% 2.6%
3.3% 3.3%
Utah’s unemployment rate ticked up from 3.3% in August to 3.4% in September. This rate remains below the U.S. average unemployment rate, which increased from 4.3% in August to 4.4% in September. These increases signal a softening labor market.
Job Change Year-Over Percentage Change August 2025
4.5% 4.5% 3.0% 3.0%
3
Unemployment ticks up in Utah and across the U.S.
-0.3% -0.3% 0.7% 0.7% 1.4% 1.4%
0.3% 0.3% CT 3.8% 3.8% CT DE 4.5% 4.5% DE
RI 4.5% 4.5% RI VT 2.5% 2.5% VT
0.4% 0.4%
0.4% 0.4% 1.2% 1.2%
0.9% 0.9% 0.5% 0.5%
1.9% 1.9%
MA 4.7% 4.7% MA MD 3.8% 3.8% MD NH 3.0% 3.0% NH NJ 5.2% 5.2% NJ
0.4% 0.4%
0.6% 0.6%
1.4% 1.4%
0.7% 0.7% 0.1% 0.1%
0.9% 0.9%
1.5% 1.5% 2.0% 2.0%
1.5% 1.5% -0.2% 0.6% -0.2% 0.6% 0.4% 0.4% 1.1% -0.7% 1.3% 1.1% -0.7% 1.3% 1.1% 1.1% 1.6% 1.6% 1.0% 1.0% 1.3% 1.6% 1.3% 3.2% 1.6% 3.2% 1.4% 1.4% 0.6% 0.6% 0.7% 0.7% 1.1% 1.1% 0.7% 0.7%
0.7% 0.7% 2.0% 2.0%
U.S. 4.4% 4.4% U.S. 5.5% 5.5%
1.3% 1.3%
1.0% 1.0%
CT 0.9% 0.9% CT DE 0.7% 0.7% DE MA 0.4% 0.4% MA MD 0.2% 0.2% MD NH 0.6% 0.6% NH NJ 1.0% 1.0% NJ RI 0.5% 0.5% RI VT 0.6% 0.6% VT U.S. 0.8% 0.8% U.S.
-0.7% JobGrowth Growth -0.7% Job
3.2% 3.2%
Source: U.S. Bureau of Labor Statistics
ROADMAP TO RECOVERY COALITION