Total Total
2.5% 2.5%
Construction Construction
5.6% 5.6%
Manufacturing Manufacturing
2.1% 2.1%
Information Information
0.7% 0.7%
Financial Activities Activities Financial
2.4% 2.4%
Other Services Services Other
-2.6% -2.6%
Government Government
3.4% 3.4%
Education/Health Services Services Education/Health
June 2025
7.5% 7.5%
Leisure/Hospitality Services Services Leisure/Hospitality
1.8% 1.8%
Natural Resources Resources Natural
3.5% 3.5%
DASHBOARD
Professional/Business Services Services Professional/Business
1.0% 1.0%
Trade/Transportation/Utilities Trade/Transportation/Utilities
12% 12% 10% 10% 8% 8% 6% 6% 4% 4% 2% 2% 0% 0% -2% -2% -4% -4% -6% -6% -8% -8% -10% -10% -12% -12% THREE -14% ESSENTIAL INSIGHTS: -14% 2012 2014 2016 2018 2020 2012 2014 2016 2018 2020 US Utah Consumer confidence rebounds, US Utah
-1.0% -1.0%
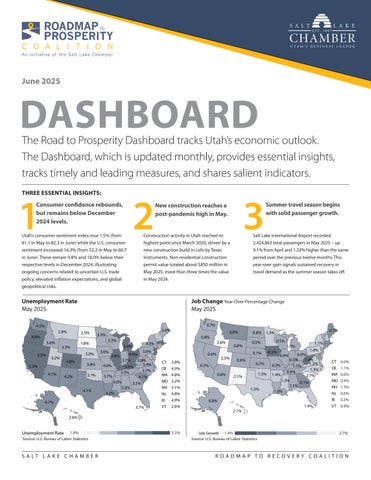
2.5% The Road to Prosperity Dashboard2.5% tracks Utah’s economic outlook. 1.1% The Dashboard, which is updated1.1% monthly, provides essential insights, tracks timely and leading measures, and shares salient indicators.
1 10% 10%
but remains below December 2024 levels.
Utah’s 5% consumer sentiment index rose 1.5% (from 5% 81.1 in May to 82.3 in June) while the U.S. consumer sentiment increased 16.3% (from 52.2 in May to 60.7 0% 0% in June). These remain 9.8% and 18.0% below their respective levels in December 2024, illustrating -5% -5% ongoing concerns related to uncertain U.S. trade policy, elevated inflation expectations, and global -10% -10% geopolitical risks.
2 2022 2022
Job Change Year-Over Percentage Change May 2025
4.5% 4.5% 4.8% 4.8% 3.6% 3.6% 5.5% 5.5%
1.8% 1.8%
4.8% 4.8%
5.3% 5.3%
4.2% 4.2%
3.8% 3.8% 3.1% 3.1% 4.1% 4.1%
4.7% 4.7%
0.7% 0.7%
3.4% 3.4%
3.3% 3.3%
3.0% 3.0%
3.2% 3.2%
4.1% 4.1%
2.5% 2.5%
3.3% 3.3%
Summer travel season begins with solid passenger growth.
Salt Lake International Airport recorded 2,424,843 total passengers in May 2025 – up 9.1% from April and 1.33% higher than the same period over the previous twelve months. This year-over gain signals sustained recovery in travel demand as the summer season takes off.
Construction activity in Utah reached its highest point since March 2020, driven by a new construction build in Lehi by Texas Instruments. Non-residential construction permit value totaled about $850 million in May 2025, more than three times the value in May 2024.
Unemployment Rate May 2025
2.8% 2.8%
3
2024 2024
New construction reaches a post-pandemic high in May.
0.8% 0.8%
3.3% 3.3%
4.0% 4.0%
5.4% 5.4%
3.9% 3.9% 4.9% 4.9% 3.7% 3.8% 3.8% 3.7% 3.4% 3.4% 4.0% 4.0% 5.0% 5.0% 3.7% 3.7% 3.5% 3.5% 3.7% 3.7% 4.1% 4.1% 4.0% 4.0% 3.5% 3.5% 3.3% 3.3% 4.5% 4.5%
3.6% 3.6%
2.6% 2.6%
0.6% 0.6%
4.8% 4.8%
3.7% 3.7%
0.0% 0.0%
3.8% CT 3.8% CT DE 4.0% 4.0% DE 4.8% MA 4.8% MA 3.2% MD 3.2% MD 3.1% NH 3.1% NH 4.8% NJ 4.8% NJ 4.9% RI 4.9% RI 2.6% VT 2.6% VT
2.5% 2.5%
0.5% 0.5% 0.6% 0.6%
0.8% 0.8%
0.5% 0.5%
0.5% 0.5% 0.7% 0.7%
0.6% 0.6%
-0.1% -0.1%
0.8% 1.3% 1.3% 0.8%
-0.5% -0.5%
0.7% 0.7% 1.3% 1.3%
2.1% 2.1%
1.5% 1.5% 0.8% 0.8% 2.1% 2.1%
1.0% 1.0%
1.1% 1.1% 1.4% 1.4%
0.9% 0.9% 0.5% -1.4% -1.4% 0.5% 1.2% 1.2% 0.3% 0.3% 1.1% 1.1% 1.3% 1.3% 0.6% 0.6% 1.4% 1.4% 2.7% 2.7% 1.3% 1.3% 0.1% 0.1% 1.1% 1.1% 1.0% 1.0% 0.4% 0.4%
1.4% 1.4%
CT 0.0% 0.0% CT DE 1.1% 1.1% DE MA 0.0% 0.0% MA MD 0.9% 0.9% MD NH 1.3% 1.3% NH NJ 0.6% 0.6% NJ RI 0.5% 0.5% RI VT 0.9% 0.9% VT
2.8% 2.8%
Unemployment Rate Rate Unemployment
1.8% 1.8% Source: U.S. Bureau of Labor Statistics
S A LT L A K E C H A M B E R
5.5% 5.5%
-1.4% JobGrowth Growth -1.4% Job Source: U.S. Bureau of Labor Statistics
2.7% 2.7%
ROADMAP TO RECOVERY COALITION