Total Total
1.2% 1.2%
Construction Construction
2.1% 2.1%
Manufacturing Manufacturing
-0.3% -0.3%
Information Information
6.3% 6.3%
Financial Activities Activities Financial
2.9% 2.9%
Other Services Services Other
-2.4% -2.4%
Government Government
1.8% 1.8%
Education/Health Services Services Education/Health
2.9% 2.9%
Leisure/Hospitality Services Services Leisure/Hospitality
January 2026
0.9% 0.9%
Natural Resources Resources Natural
-3.4% -3.4%
DASHBOARD Professional/Business Services Services Professional/Business
Trade/Transportation/Utilities Trade/Transportation/Utilities
12% 12% 10% 10% 8% 8% 6% 6% 4% 4% 2% 2% 0% 0% -2% -2% -4% -4% -6% -6% -8% -8% -10% -10% -12% -12% THREE ESSENTIAL INSIGHTS: -14% -14% 2000 2004 2008 2012 2000 2004 2008 2012
2.2% 2.2% -1.2% -1.2%
1.2% The Road to Prosperity Dashboard1.2% tracks Utah’s economic outlook. The Dashboard, which is updated0.3% monthly, provides essential insights, 0.3% tracks timely and leading measures, and shares salient indicators.
1
U.S. U.S.
2016 2016
Utah Utah
Growth remains strong in key service-oriented industries.
Utah’s information industry posted a 6.3% year-over increase in jobs as of December 2025. Financial services and education and health services each grew 2.9%.
2 2020 2020
Less severe winter slowdown in residential construction value than in past years.
Utah’s residential construction value dipped in November, following seasonal declines, but rose in December. Endof-2025 construction values appear elevated compared to late 2024.
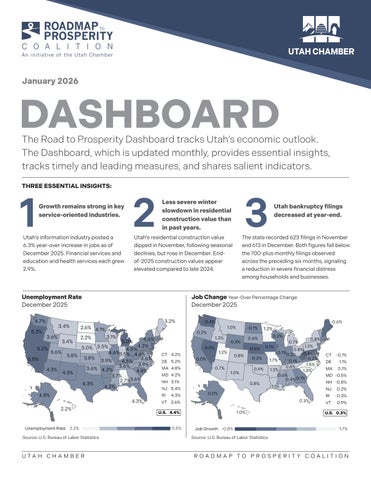
Unemployment Rate December 2025 4.7% 4.7% 5.2% 5.2%
3.4% 3.4% 3.6% 3.6%
3.2% 3.2%
4.3% 4.3% 2.2% 2.2%
UnemploymentRate Rate 2.2% 2.2% Unemployment
The state recorded 623 filings in November and 613 in December. Both figures fall below the 700-plus monthly filings observed across the preceding six months, signaling a reduction in severe financial distress among households and businesses.
-0.4% -0.4%
-0.6% -0.6% 1.0% 1.0%
0.2% 0.2%
3.1% 3.1%
4.6% 4.6% 3.4% 5.0% 3.4% 5.0% 4.2% 4.2% 3.5% 3.5% 3.0% 3.0% 5.2% 5.2% 4.5% 4.5% 3.6% 4.6%3.5% 3.6% 4.6% 3.5% 4.6% 4.6% 3.8% 3.8% 3.8% 3.6% 3.8% 5.5% 5.5% 3.9% 3.9% 4.5% 3.6% 4.5% 3.9% 3.9% 3.6% 3.6% 3.6% 4.2% 3.6% 4.3% 4.2% 4.3% 4.8% 4.8% 4.3% 4.3% 3.7% 3.7% 3.6% 2.7%3.6% 2.7% 4.3% 4.3% 4.2% 4.2% 4.8% 4.8%
Utah bankruptcy filings decreased at year-end.
Job Change Year-Over Percentage Change December 2025
2.6% 4.1% 2.6% 4.1% 2.2% 2.2%
3
2024 2024
1.2% 1.2% 0.0% 0.0% CT 4.2% 4.2% CT DE 5.2% 5.2% DE MA 4.8% 4.8% MA MD 4.2% 4.2% MD NH 3.1% 3.1% NH NJ 5.4% 5.4% NJ RI 4.3% 4.3% RI VT 2.6% 2.6% VT
-0.3% -0.3% 0.8% 0.8%
0.0% 0.0%
1.0% 1.0%
0.2% 0.2%
0.6% 0.6%
0.1% 0.1%
-0.2% -0.2% 0.9% 0.9% 0.8% 0.8%
0.7% 0.7%
0.8% 0.8% 1.2% 1.2%
0.8% 0.8% -0.1%0.2% -0.4% -0.1% 0.2% -0.4% -0.2% -0.2% 1.7% 1.7% 0.1% 0.1% 1.5% 1.5% 0.8% 0.8% 1.2% 1.2% 1.3% 1.3% 0.6% 0.6% 0.1% 0.4%0.1% 0.4% 1.1% 1.1%
0.0% 0.0% 0.3% 0.3% 1.0% 1.0%
U.S. 4.4% 4.4% U.S. 5.5% 5.5%
1.2% 1.2%
-0.6% -0.6%
1.2% 1.2%
0.7% 0.7%
-0.1% -0.1%
JobGrowth Growth -0.8% -0.8% Job
CT -0.1% -0.1% CT DE 1.1% DE 1.1% MA 0.1% 0.1% MA MD -0.5% -0.5% MD NH -0.8% -0.8% NH NJ 0.2% 0.2% NJ RI -0.3% -0.3% RI VT VT
0.9% 0.9%
U.S. 0.3% 0.3% U.S. 1.7% 1.7%
Source: U.S. Bureau of Labor Statistics
Source: U.S. Bureau of Labor Statistics
U TA H C H A M B E R
ROADMAP TO PROSPERITY COALITION