Total Total
0.6% 0.6%
Construction Construction
-0.1% -0.1%
Manufacturing Manufacturing
0.1% 0.1%
Information Information
-5.0% -5.0%
Financial Activities Activities Financial
2.4% 2.4%
Other Services Services Other
-1.9% -1.9%
Government Government
-0.4% -0.4%
Education/Health Services Services Education/Health
March 2026
2.2% 2.2%
Leisure/Hospitality Services Services Leisure/Hospitality
-0.5% -0.5%
Natural Resources Resources Natural
-5.3% -5.3%
DASHBOARD Professional/Business Services Services Professional/Business
3.9% 3.9%
Trade/Transportation/Utilities Trade/Transportation/Utilities
12% 12% 10% 10% 8% 8% 6% 6% 4% 4% 2% 2% 0% 0% -2% -2% -4% -4% -6% -6% -8% -8% -10% -10% THREE ESSENTIAL INSIGHTS: -12% -12% -14% -14% 2000 2004 2008 2012 2000 2004 2008 2012
2016 2016
U.S. U.S. Employment growth
Utah Utah
-0.5% -0.5%
The Road to Prosperity Dashboard tracks Utah’s economic outlook. 0.6% 0.6% 12% The Dashboard, which is updated0.2% monthly, provides 10% essential insights, 0.2% 8% 6% tracks timely and leading measures, and shares salient indicators.
1
weakens.
While Utah job growth (0.6%) slightly exceeded U.S. job growth (0.2%) over the previous 12 months, these rates remain below historical averages.
2 2020 2020
2024 2024
U.S. headline inflation sees a sharp increase and exceeds 2025 levels.
The conflict with Iran and geopolitical tensions drive up energy prices, a core component of the Consumer Price Index.
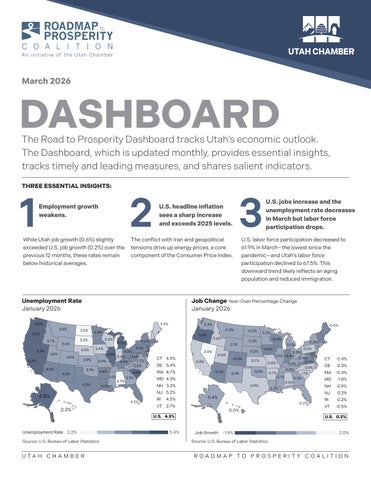
Unemployment Rate January 2026
3.7% 3.7% 5.3% 5.3%
3.8% 3.8%
5.4% 5.4%
3.6% 3.6%
2.6% 2.6%
Utah
3.9% 3.9%
4.5% 4.5%
3.9% 3.9%
4.5% 4.5%
-1.0% -1.0% 3.3% 3.3%
2.2% 2.2%
4.6% 4.6%
5.0% 5.0%
4.3% 4.3% 4.9% 4.9% 3.4% 4.6% 4.6% 3.4% 3.7% 3.7% 3.9% 3.9% 4.3% 4.3% 4.4% 4.4%
3.5% 3.5%
3.8% 3.8%
4.9% 4.9% 3.6% 3.6% 3.5% 3.5% 2.7% 2.7% 4.3% 4.3%
4.8% 4.8% 4.5% 4.5%
2.2% 2.2%
-0.2% -0.2%
0.6% 0.6% 0.1% 0.1%
4.3% 4.3%
3.4% 3.4%
4.3% 4.3%
-0.5% -0.5%
-0.2% -0.2%
4.4% 4.4%
3.0% 3.0% 3.9% 3.9%
U.S.
U.S. labor force participation decreased to 61.9% in March—the lowest since the pandemic—and Utah’s labor force participation declined to 67.5%. This downward trend likely reflects an aging population and reduced immigration.
0.3% 0.3%
3.3% 3.3%
5.2% 5.2%
3
U.S. jobs increase and the unemployment rate decreases in March but labor force 2000 participation 2004 2008 drops. 2012 2016 2020
Job Change Year-Over Percentage Change January 2026
5.0% 5.0% 3.6% 3.6%
4% 2% 0% -2% -4% -6% -8% -10% -12% -14%
2.0% 2.0%
CT 4.5% 4.5% CT DE 5.4% 5.4% DE MA 4.7% 4.7% MA MD 4.3% 4.3% MD NH 3.2% 3.2% NH NJ 5.2% 5.2% NJ RI 4.5% 4.5% RI VT 2.7% 2.7% VT
0.6% 0.6%
0.8% 0.8% -0.6% -0.6%
-0.1% -0.1%
-0.6% -0.6%
0.2% 0.2% 0.0% 0.0% 5.0%
-0.3% -0.3%
0.5% 0.5% 0.0% 0.0%
-0.9% -0.9%
0.3% 0.3% 0.6% 0.6%
0.3% 0.3% 0.1% -0.4% -0.4% 0.1% 0.4% 0.4% CT 0.4% 0.4% 3.6% CT 2.6% -0.7% 0.7% 0.7% -0.7% 4.4% 0.8% 0.8% 0.3% 5.2% 0.3% DE 0.3% 0.3% DE 0.9% 3.3% 0.0% 2.2% 0.9% 0.0% 4.6% 0.0%3.7%0.7% 0.0% MA 5.0% -0.4% MA -0.4% 1.1% 0.7% 3.6% 1.1% 0.1% 0.1% 4.3% 0.3% 0.3% 3.4% MD -1.8% MD -1.8% 3.0% 5.3% 4.3% 0.5% 0.5% 3.8% 4.9% 0.9% 0.9% NH3.4% -0.9% 4.6% NH -0.9% 0.2% 3.9% 0.2% 3.9% 3.7% 5.4% 3.9% 4.3%
NJ NJ
0.4% 0.4%
4.5% 4.5%
0.0% 0.0%
3.9% -0.2% -0.2% 4.3%
U.S. 4.3% 4.3% U.S.
RI 4.4% RI VT 3.6% VT
0.2% 0.2% 3.8% 0.2% 0.2%
3.5%
4.9%
-0.5% -0.5% 3.5%
2.7%
4.3% U.S. U.S. 0.2% 0.2%
4.8% UnemploymentRate Rate 2.2% 2.2% Unemployment
5.4% 5.4%
4.5% 2.0% 2.0%
JobGrowth Growth -1.8% -1.8% Job
2.2%
Source: U.S. Bureau of Labor Statistics
Source: U.S. Bureau of Labor Statistics
U TA H C H A M B E R
ROADMAP TO PROSPERITY COALITION Unemployment Rate 2.2%
U.