Portfolio
Rutvik Deshpande
MIT SMarchS Application 2025 Selected Works (2019-2024)
Rutvik Deshpande
MIT SMarchS Application 2025 Selected Works (2019-2024)
01, Saurabh Apartments, Sanewadi, Aundh, Pune, MH, India rutvik.deshpande@outlook.com (91) 899-942-1600
Education
National Institute of Technology, Raipur, India
Bachelor of Architecture
Work Experience
MIT Urban Risk Lab, Cambridge, MA, USA
Research Intern
Digital Blue Foam, Singapore
Machine Learning Engineer
S.N. Pingle Consultants, Pune, India
Architectural Design Intern 08/1912/23-07/24 09/20-09/23
Awards/Honors
Young CAADRIA Award
CAADRIA ‘23
Second Runners-up, “Supercomputing Net-zero Structures”
High-Performance Computing Innovation Challenge (NSCC)
Workshops Taught
Synthetic Machine Creation for Net-Zero Structural Design
DigitalFUTURES ‘22
XD Urban Prototyping with Digital Blue Foam
DigitalFUTURES ‘21
Personalized Generative Design
CAADRIA ‘21
Talks
Data Driven Sustainable Building Design
AI in AEC Conference ‘22
Machine Learning for Better Architectural Design
International Building Design Competition (IBDC) ‘21, Singapore
Publications
Generative Pre-Trained Transformers for 15-Minute City Design DigitalFUTURES ‘22
Synthetic Machine Learning for Real-time Architectural Daylighting Prediction DigitalFUTURES ‘21
Synthetic Structural Generation for Early-Stage Carbon Evaluation CAADRIA ‘21
Realtime Urban Insights for Bottom-up 15-minute City Design DigitalFUTURES ‘21
DBF Urban Insights: Realtime 15-Minute City Neighbourhood Analysis System CAADRIA ‘21
Skills
Frontend
Backend
Programming
Graphics Mapping
3D Modelling
: HTML, CSS, THREE.JS, TensoflowJS, Angular
: NodeJS, Google Cloud Platform
: R, Python, Javascript
: Adobe CS, Figma, P5.JS
: Qgis, Mapbox, Leaflet, deckGL
: Rhino3D, Grasshopper, Revit, Blender, SketchUp
Credentials
LEED Green Associate
Green Business Certification Inc. (GBCI)
In an era where the intersection of technology and sustainable design is becoming increasingly vital, this design portfolio reflects a commitment to innovating urban systems for future cities. Through extensive work with software systems and applications, the projects harness urban datasets to create intelligent solutions that enhance the human experience within built environments. The focus is on leveraging data to inform design decisions, ensuring that sustainability is not merely an afterthought but a fundamental aspect of the architectural process. By integrating advanced technologies with traditional design principles, this portfolio aims to contribute to the development of resilient urban spaces that prioritize both ecological integrity and human well-being.
The portfolio showcases a variety of projects that exemplify how software applications can serve as powerful tools in the realm of sustainable design. Each project illustrates a dedication to utilizing data-driven insights to optimize building performance, enhance community engagement, and foster innovative solutions for complex urban challenges. As cities continue to evolve, the thoughtful integration of technology will play a crucial role in shaping their future. The goal is to empower designers and stakeholders alike by providing them with the tools they need to make informed decisions that align with sustainable practices, ultimately contributing to the creation of smarter, more livable urban environments.


Urban Intelligence
Predictive Modeling for Design
Resilient Shores
Tsunami-Safe Communities
15 Minute City Design
Urban Design Framework
Urban Narratives
Semantics for City Design
Net Zero Scape
Building Sustainability Together

Team Lead Supervisor: Sayjel Vijay Patel & Camiel Weijenberg, Digital Blue Foam
Date of Project: 2021-22
The building industry is known for its complex and lengthy design processes, often hindered by its status as one of the least digitized sectors. The project employs advanced machine learning models, including neural networks and Generative Adversarial Networks (GANs), to predict building geometry, program, and performance metrics such as daylight access and computational fluid dynamics (CFD). Utilizing diverse data sources like OpenStreetMap (OSM) for urban form analysis and synthetic building performance data generated through visual programming tools, the project facilitates rapid design iterations. This approach allows designers and architects to swiftly assess multiple design scenarios, focusing more on the concept and ideation phases rather than getting bogged down in technical details. The predictive modeling not only streamlines the design process but also ensures that critical performance factors are considered early on.


The progression—from data to wisdom empowers more efficient and sustainable informed design decisions
Can we create a prediction system for buildings based on location data?
We developed a system that leverages a deep learning model called, Conditional Generative Adversarial Networks (cGANs) to generate building footprints, with training image data sourced from the OpenStreetMap. Input images include key building features and configurations, such as site outline, neighboring buildings, and street network around in black and white color. Initial results were refined by categorizing urban image data into groups based on geometry, location, program type, and city, allowing for improved model accuracy. This systematic approach optimized the cGAN model’s performance, enhancing its ability to produce realistic, data-driven building footprints.
Spatial features like building geometry, proximity to neighbors, and street layouts were key inputs for predicting building footprints. Shapely and pySAL were used for feature engineering, enabling precise geometric manipulation and geospatial analysis to create urban-specific attributes. The data was organized into a GeoDataFrame using GeoPandas, facilitating visualization and integration with a deep learning model.
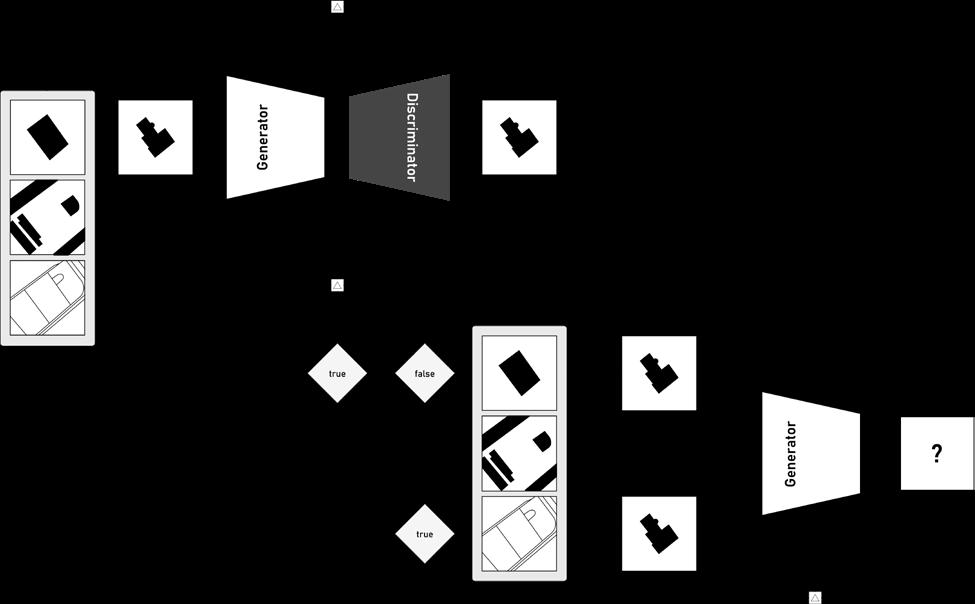
The input for training the model was the images site, neighboring buildings, street network, created using Matplotlib, a python data visualization module. After analysis of initial results, the data was filtered and segregated into various categories based on similarities like, geometry, address, programs, and cities, for better performance along with optimizing the cGAN model.
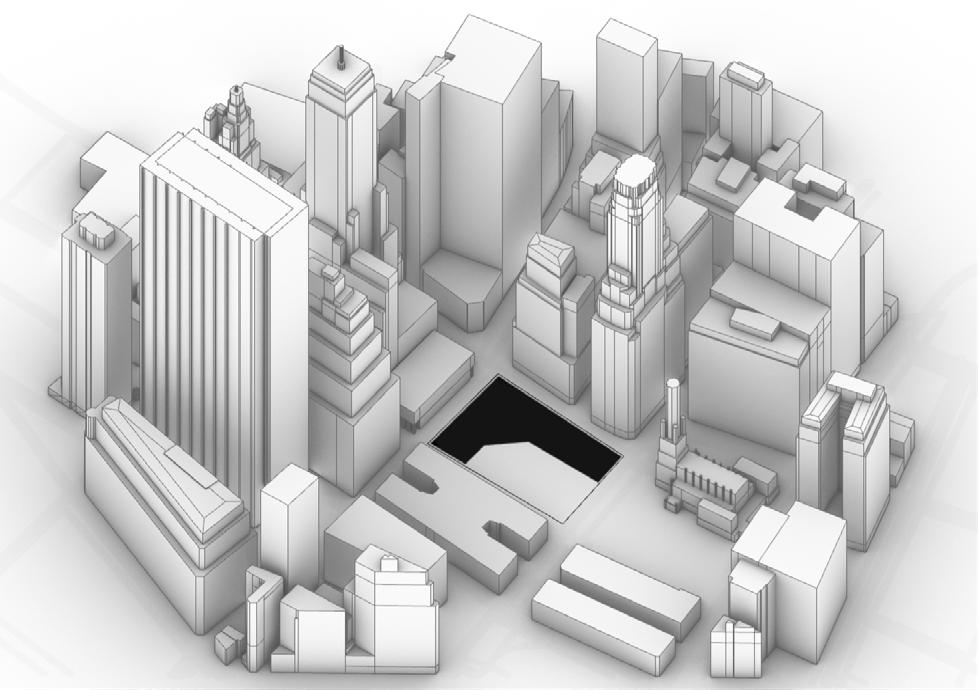
Results: Predicted Footprints in New York City
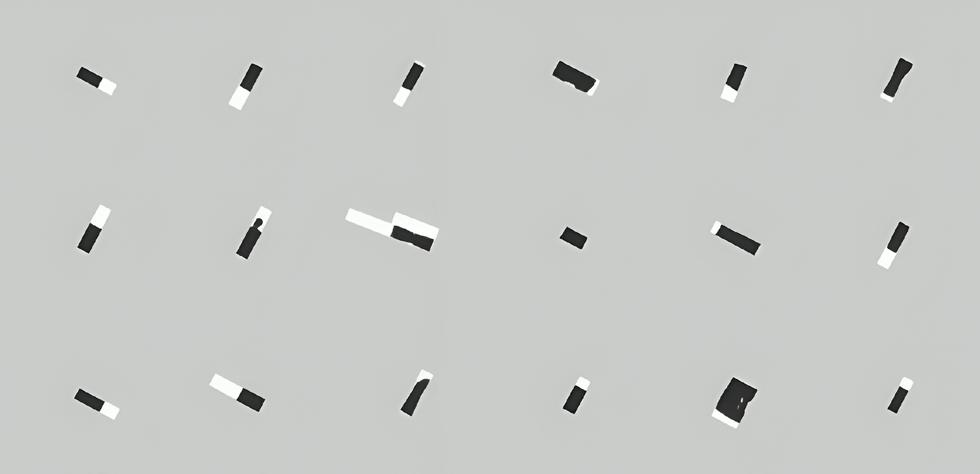
The above figure shows the results for predicted building footprints for narrow-shaped small sites in East Village, NY

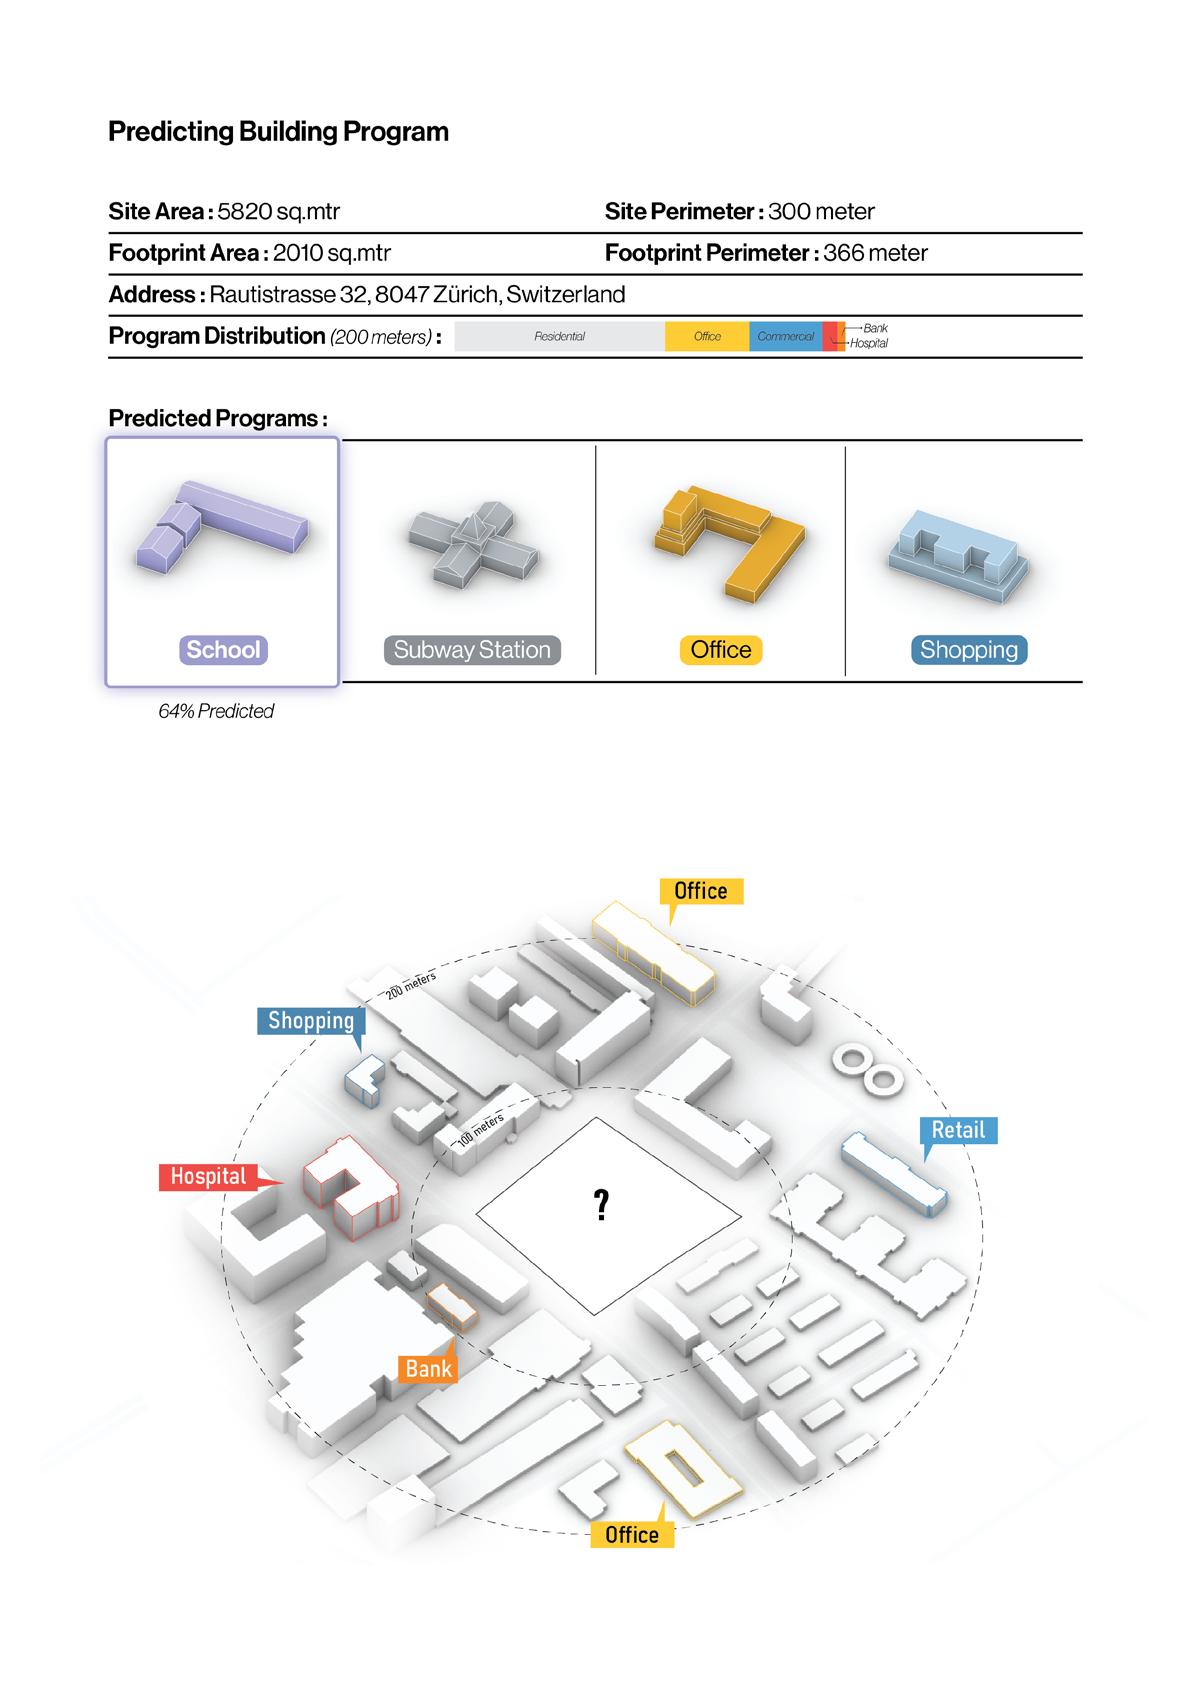
A client’s brief forms the foundation of every building design, outlining requirements, constraints, and goals like floor areas, tenant types, and building typology. Leveraging Machine Learning (ML) and OpenStreetMaps (OSM), we extracted structured urban data and used a Random Forest Classifier to classify and predict building attributes based on location. This approach bridges the gap between client briefs and urban analytics, enabling precise, data-driven design decisions that align with the urban context and project goals.
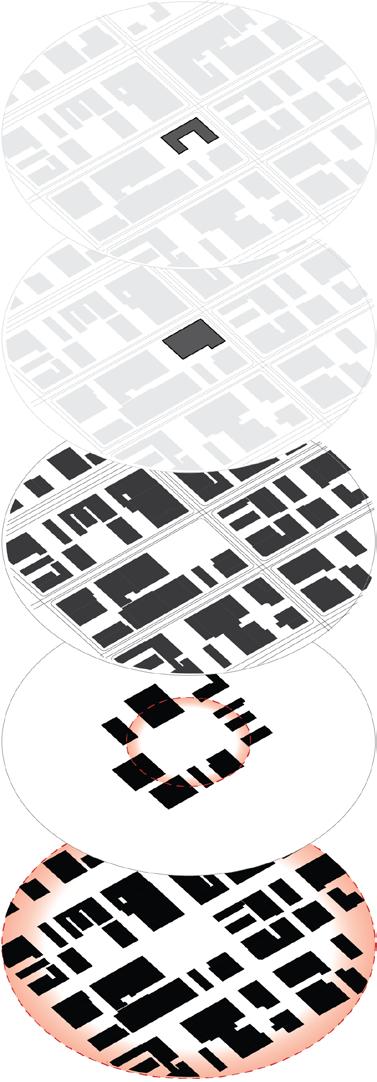
The footprint area and perimeter by client brief providing critical dimensions and potential design capacity
The site’s area and perimeter provide critical spatial limits, defining the potential layout, density, and land utilization.
The address would contain, postal code, street name, neighborhood region obtained from OSM data, providing contextual insights
Information related to neighboring buildings such as program distribution and density in 100 meters radius
Information related to immediate urban environment such as program distribution and building density in 2x00 meters radius

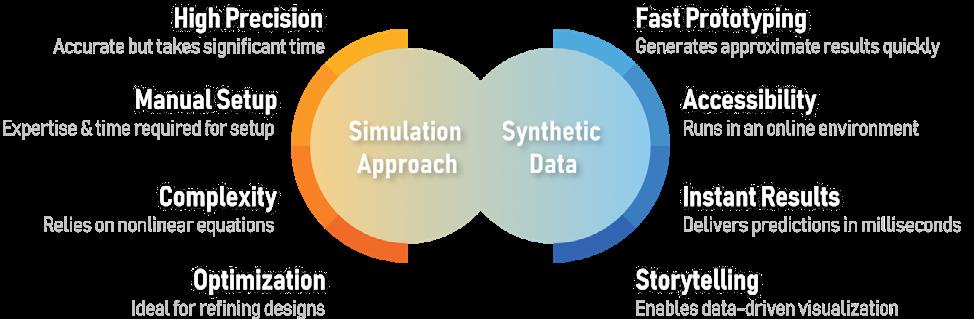
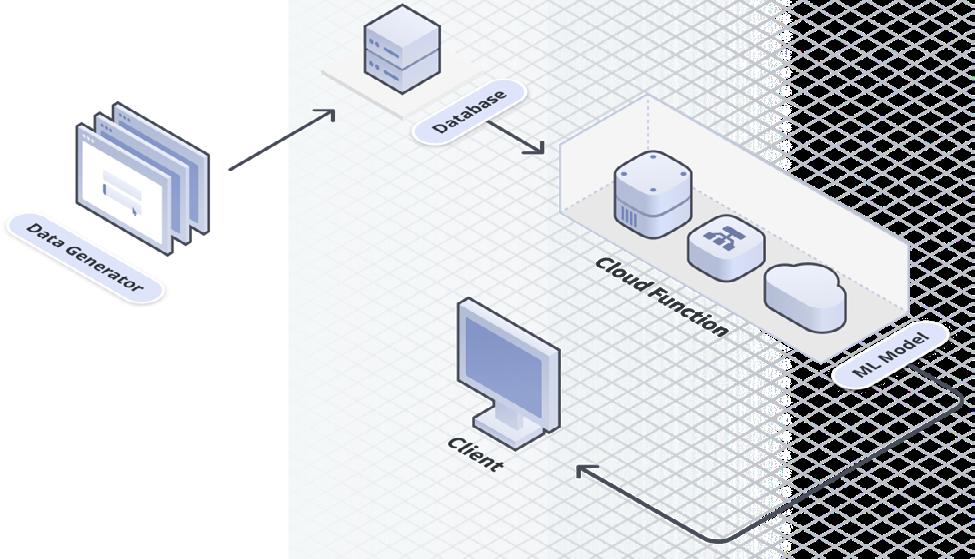
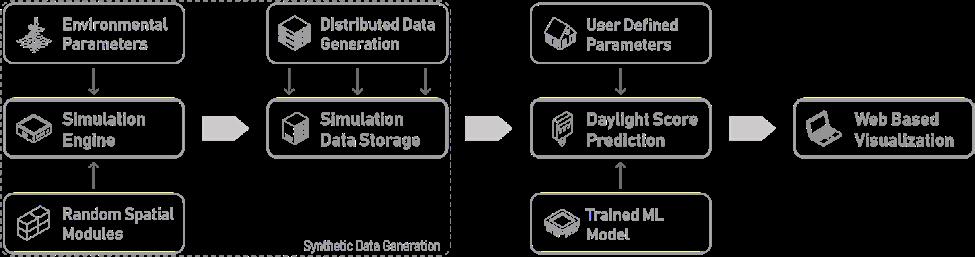
The proposed Synthetic Data approach takes a data-driven path, using synthetic simulation data to train machine learning models for quick predictions. While less precise, they offer fast insights that help shape early design concepts, supporting rapid decision-making and an exploratory, storytelling-driven process. The trained models are deployed on cloud platforms, and made available to the users in a web based tool. It’s particularly effective for visualizing potential outcomes and iterating on concepts before detailed simulation is needed.
Building designers traditionally rely on complex simulation tools like Rhino-Grasshopper with Ladybug or SketchUp extensions to calculate daylight metrics such as Daylight Autonomy (DA) and Spatial Daylight Autonomy (sDA), a process that is time-consuming and requires expertise.
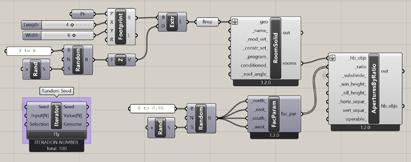
To address this, we developed a Synthetic Machine Learning framework that uses a parametric model to generate synthetic data, trains a machine learning model on that data, and provides a web-based application for smooth user interaction. This system enables faster and more accessible daylight predictions, eliminating the need for manual setup and making daylight analysis tools usable by non-experts. It is particularly effective for early-stage design decisions where speed and accessibility are more critical than precise accuracy.
Automated Room Generation
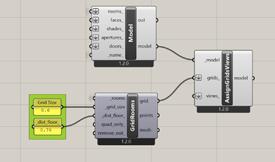
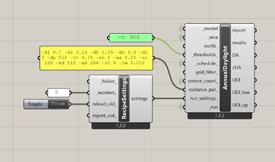
Analysis Grid Setup Daylight Calculations
The data generation script involved 3 steps, room geometry creation, analysis grid setup and daylight calculations, the speed for daylight autonomy calculations was reduced by optimizing radiance parameters and usage of Accelerad for GPU based calculations. This script was run on multiple machines for faster data generation.
Synthetic data was generated using a parametric Rhino3D model and Grasshopper’s LadyBug plugin to automate daylight simulations across various spatial configurations, optimized with GPU acceleration and distributed computing. Artificial Neural Networks (ANN) were deployed on Google Cloud for accurate predictions, enabling API-based integration with an online design platform for seamless and accessible implementation.
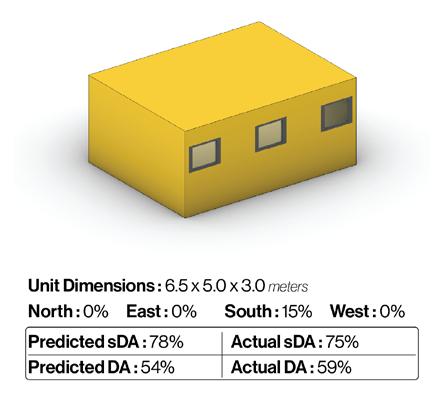
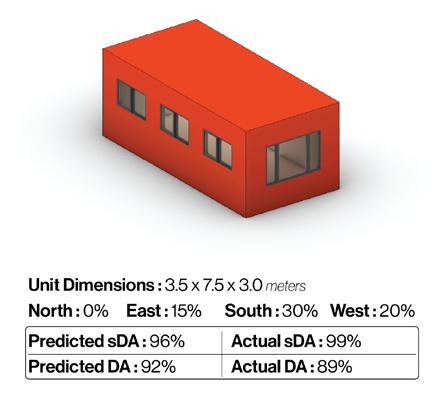
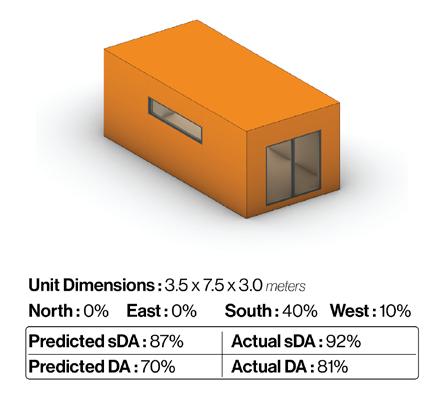
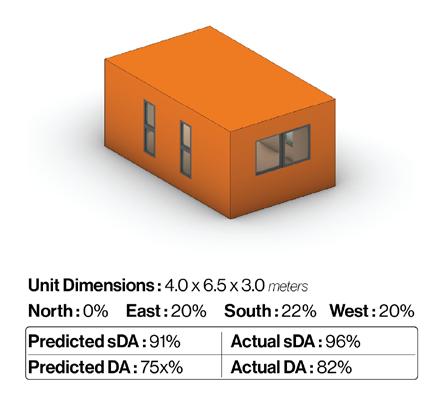
The figure above compares predicted and actual daylight autonomy (DA) and spatial daylight autonomy (sDA) for four units with different configurations, specific to the location of Singapore. Rather than using a colored heatmap, which can be challenging to interpret, we opted to render each unit based on its predicted average daylight autonomy.
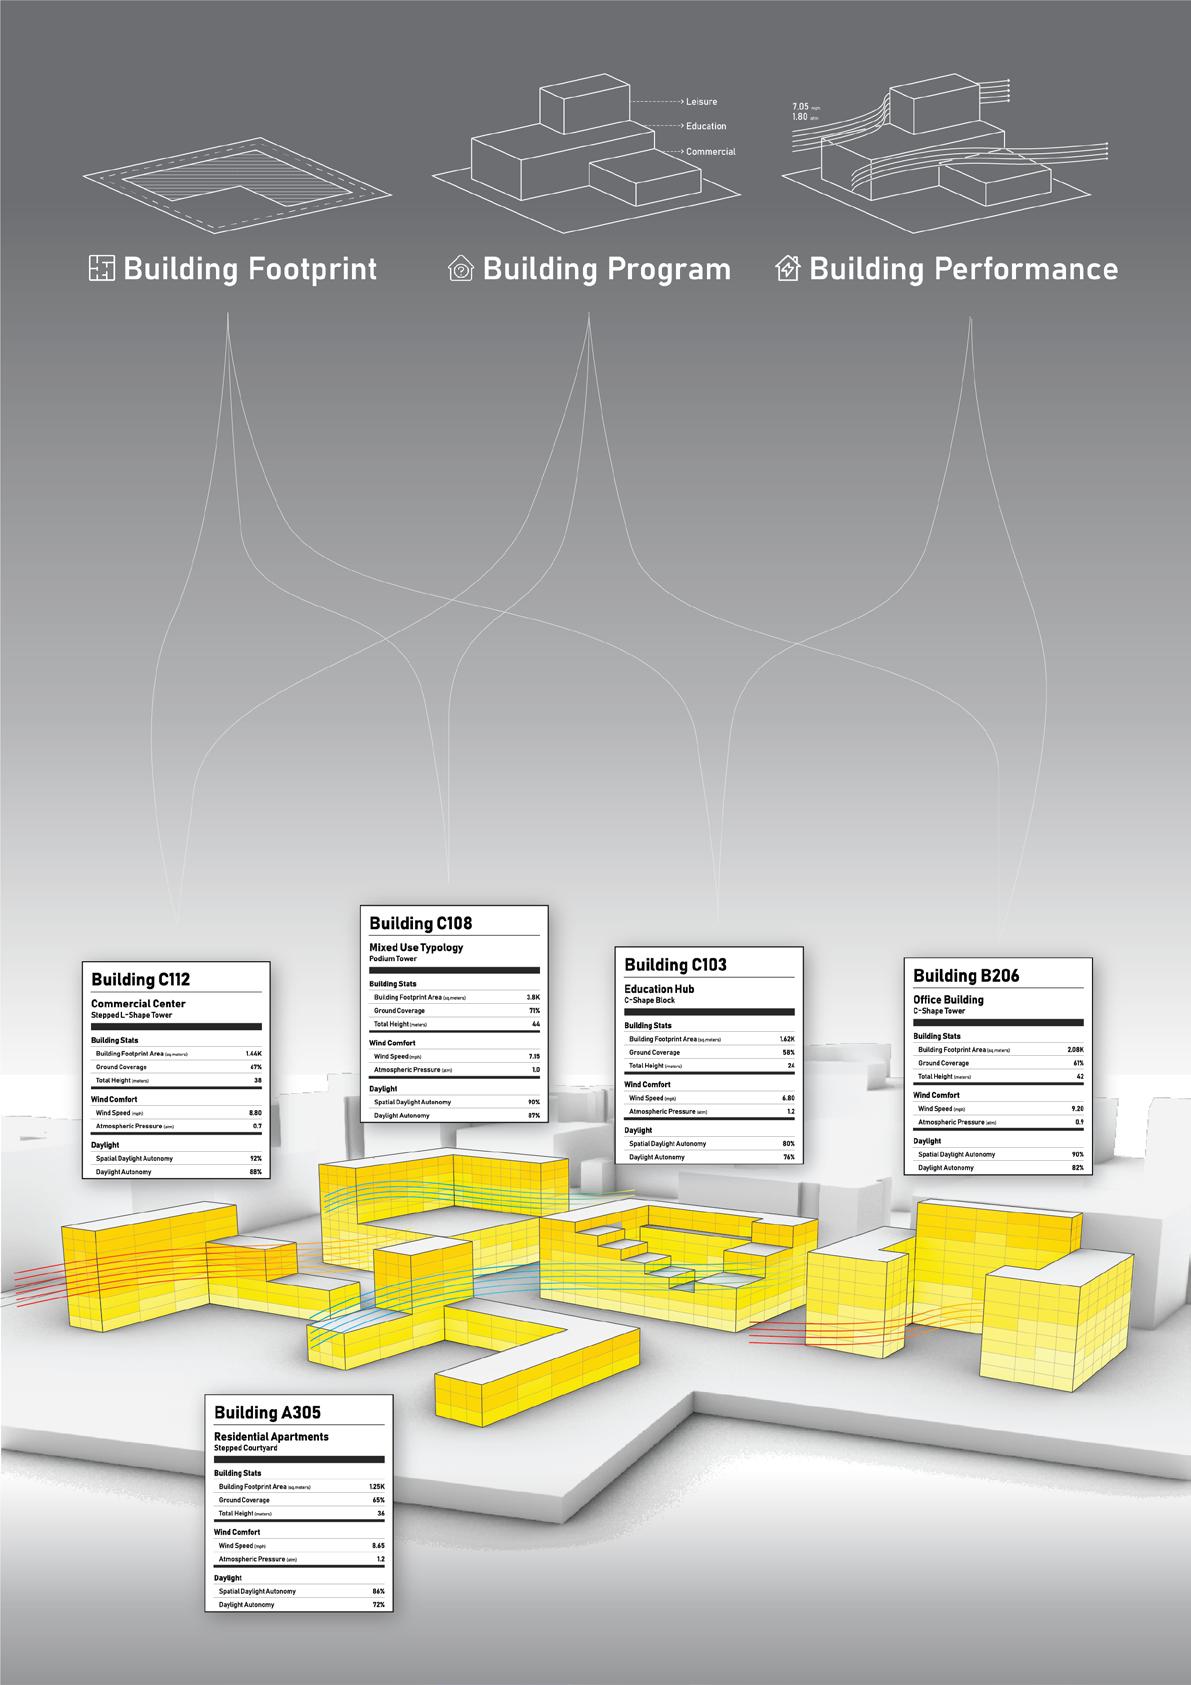
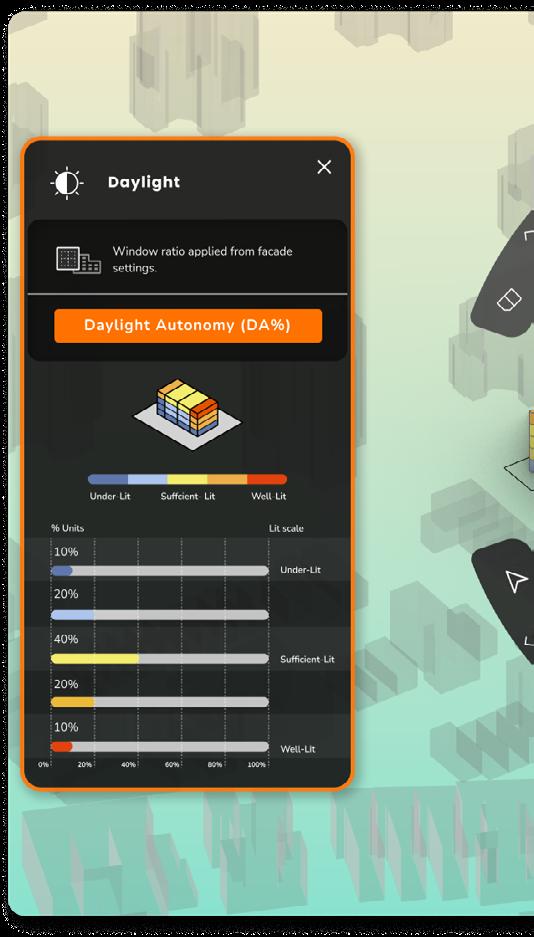
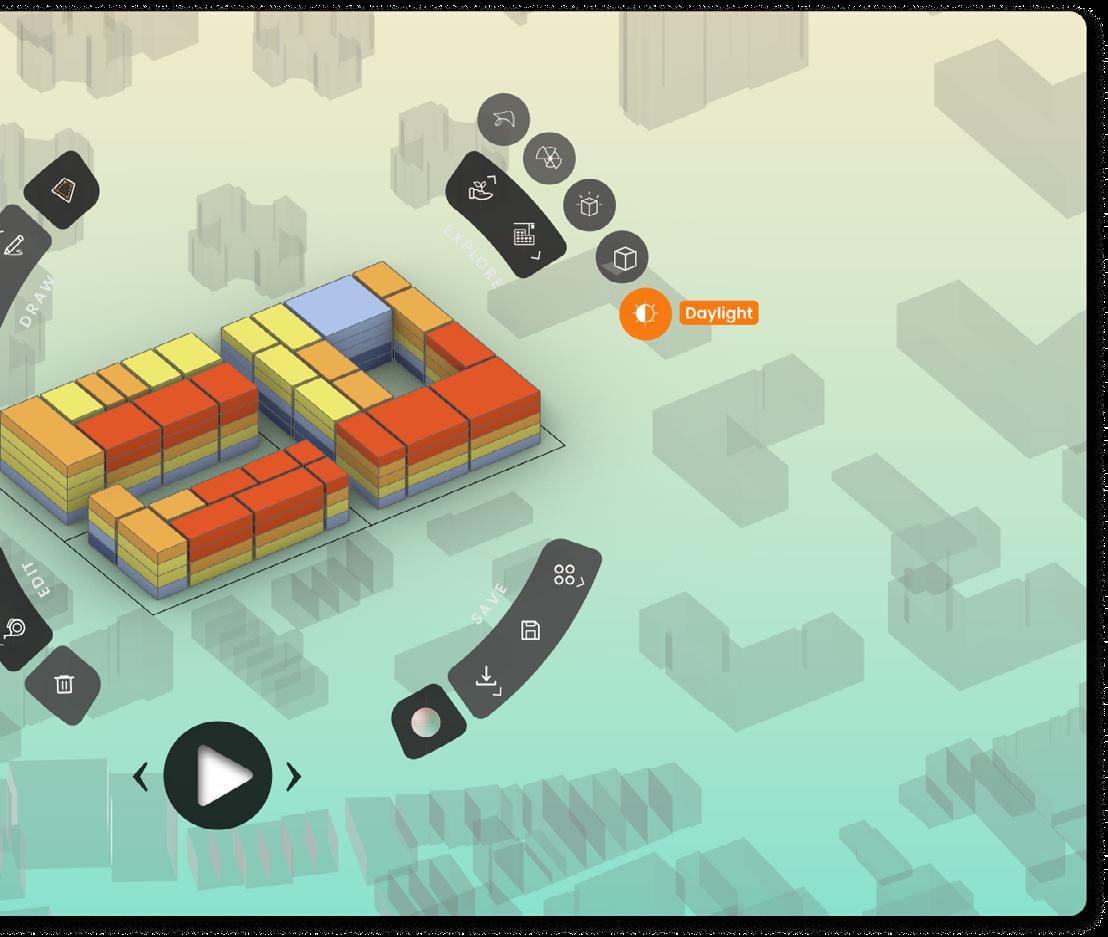
We developed a system for designers to analyze daylight performance directly on 3D building models. Using color-coded facades, it visualizes energy efficiency, daylight autonomy (DA), and spatial daylight autonomy (sDA) based on window-to-wall ratios (WWR). The platform enables easy comparison of design options, helping users make informed decisions to enhance daylight efficiency.
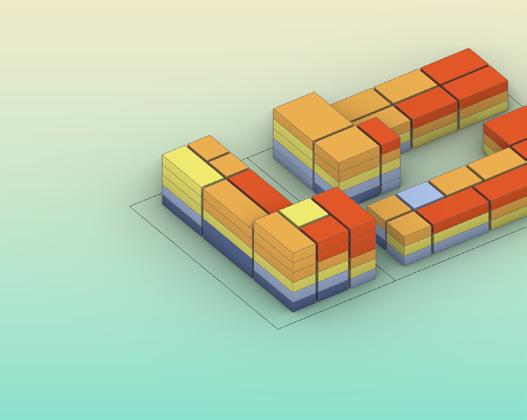
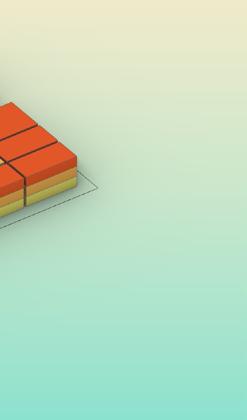
Each building unit is color-coded based on its average daylight autonomy, ranging from underlit to sufficient-lit to well-lit
The units are rendered in a 3D model, allowing users to visually identify daylight performance across the structure
Graphical Daylight Distribution
A bar chart displays the percentage of units in each daylight category, providing a detailed breakdown of underlit, sufficient-lit, and well-lit areas
Integrating this daylight analysis interface with a generative design process enables designers to explore multiple design iterations rapidly. By providing instant daylight performance feedback for each option, the system streamlines early-stage decision-making, allowing architects to focus on conceptual ideation and creativity
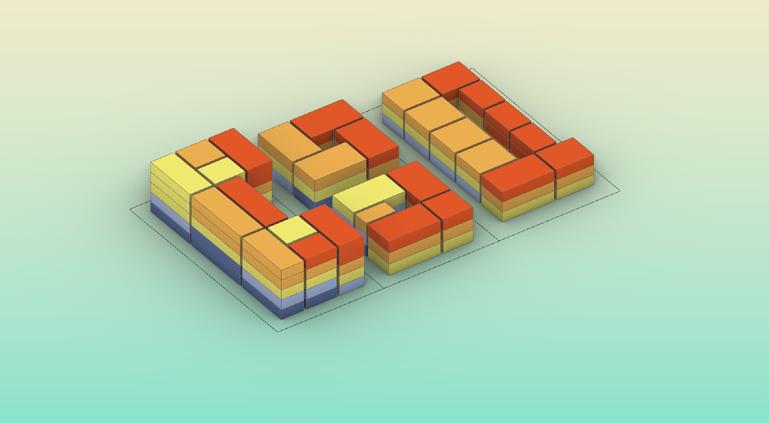
Generation Setup
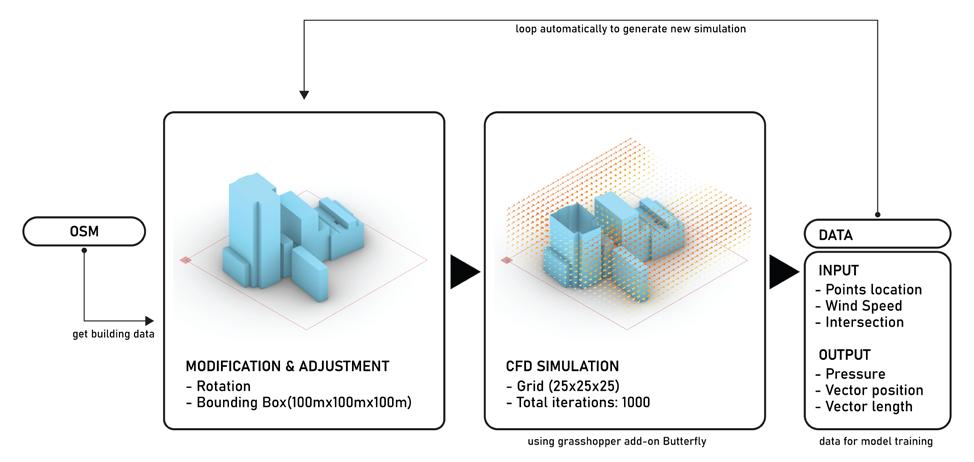
The data generation setup used a parametric Rhino3D model with Elk plugin to retrieve 3D building data from OpenStreetMap.org, defined by two main parameters for simulation. The model for simulation was defined by the two main parameters:
[1] Module area, the 100m x100m x100m module was specified as the maximum area to be analyzed [2] The module rotation which will be used later to generate multiple data related to the wind direction for the module.
Generation Process
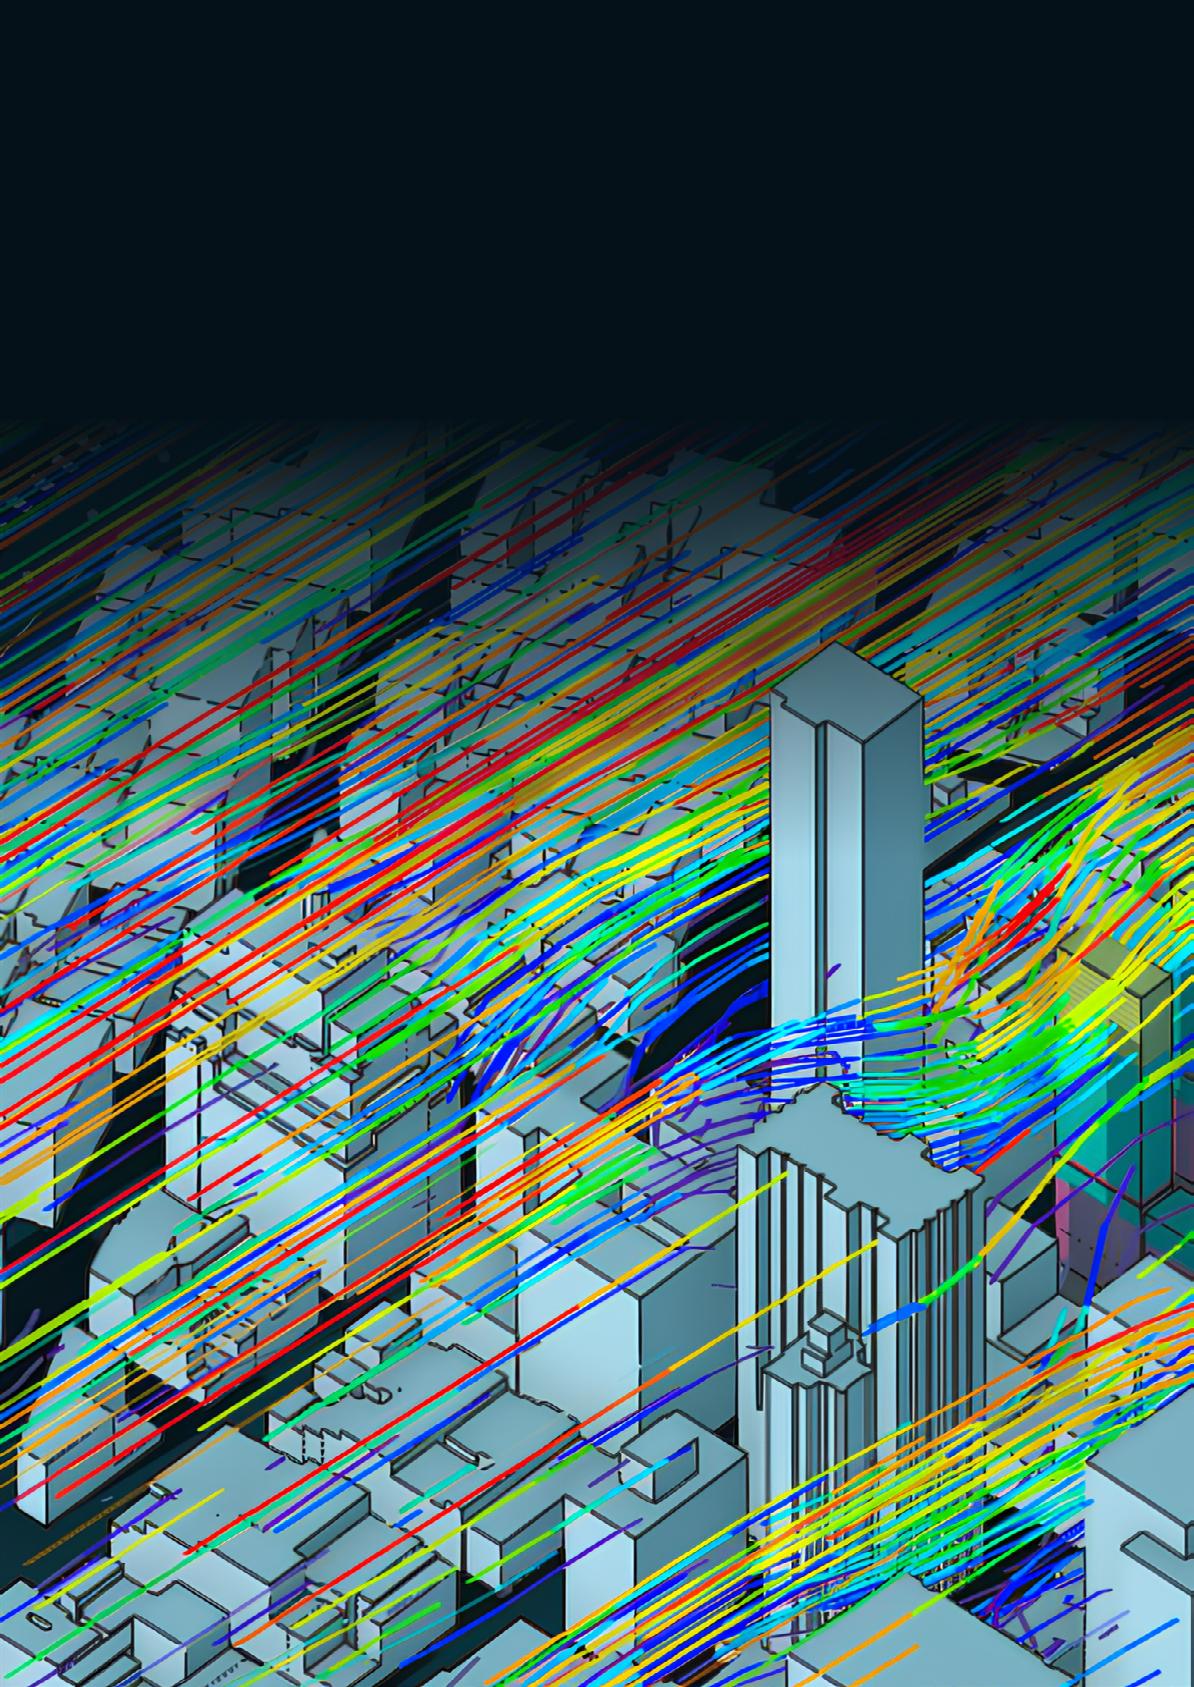
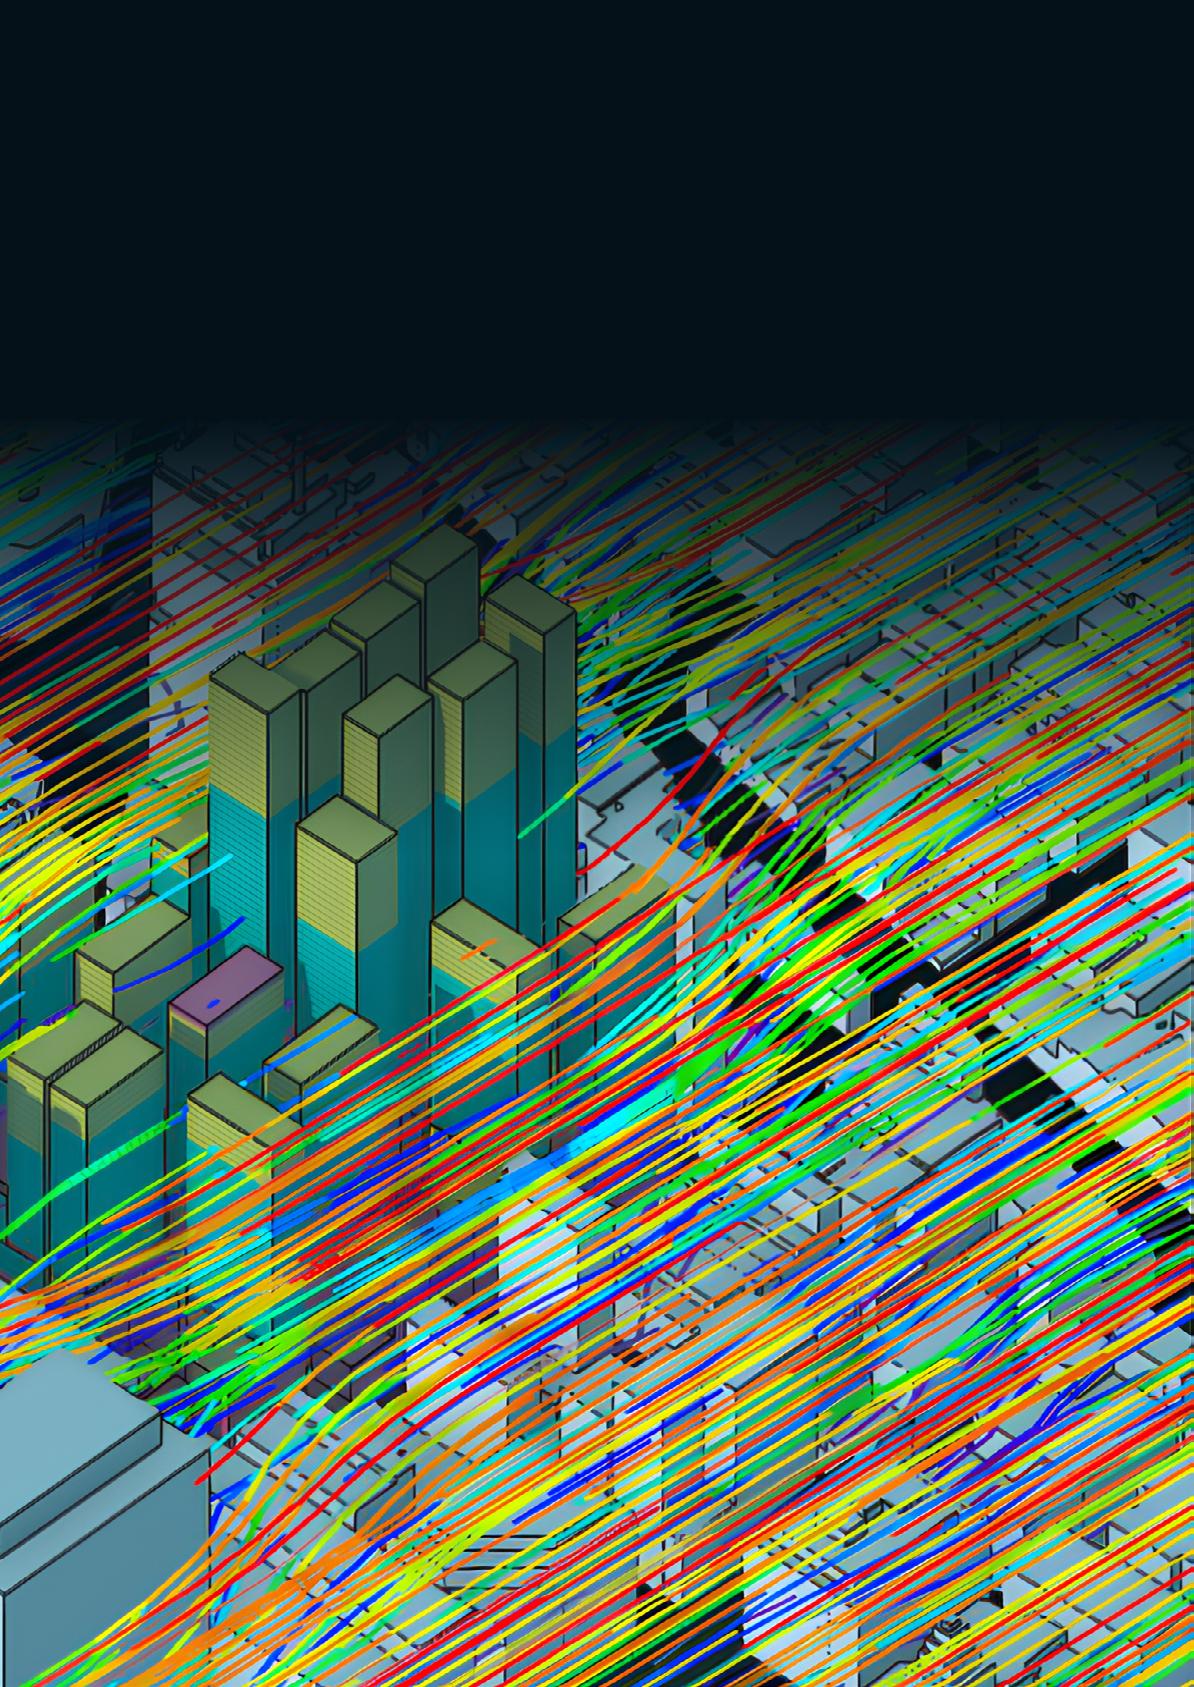
[1]The Butterfly add-on, integrating OpenFOAM®, was employed for computational fluid dynamics (CFD) simulations. [2]To optimize computational efficiency, a 4-meter grid was applied, creating 15,625 probes, and the max iteration count was capped at 1,000 for simulations.
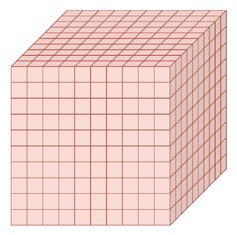
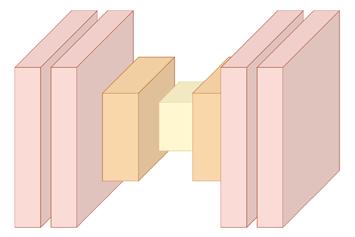

For this project, a 3D Convolutional Neural Network (CNN) was used, which applies filters across three dimensions to extract features from the data. The input for the training was a 4D dataset, which included a 3D grid of size 100x100x100 meters representing spatial dimensions, with each point marked by the presence or absence of a building (0 or 1). In addition, the model used two other feature variables, ’windspeed’ and ’intersection’. The output of the model was a 3D grid that provided ’pressure’ and ’vector lengths’ as the predicted results.
User Interface: Visualizing Fluid Dynamics
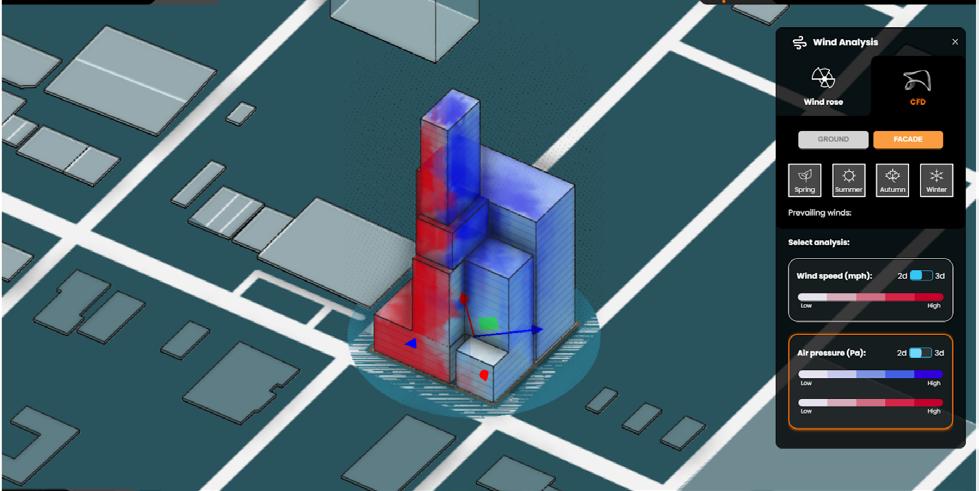
User Interface showcasing spatial distribution of pressure differences across various facades
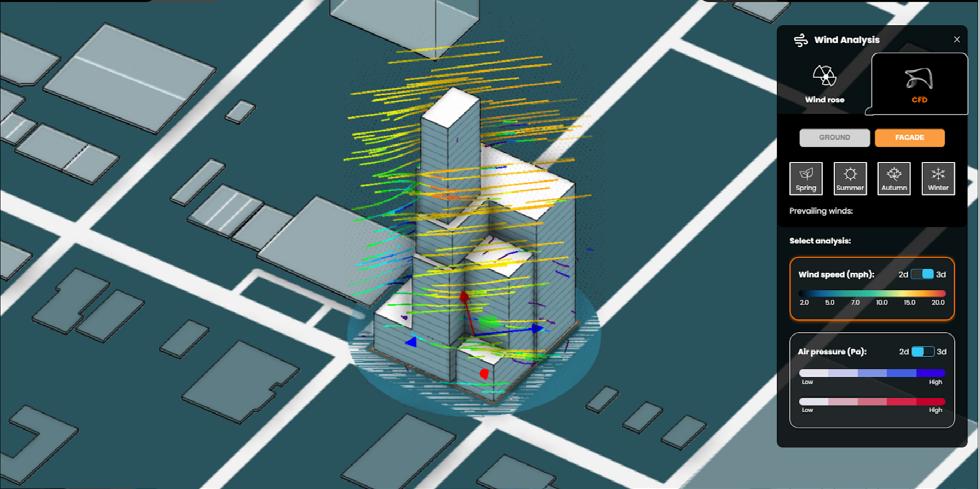
User interface for visualizing realtime visualization of airflow patterns around structures

Individual Contributor
Supervisor: Larisa Ovalles, MIT Urban Risk Lab
Date of Project: 2024
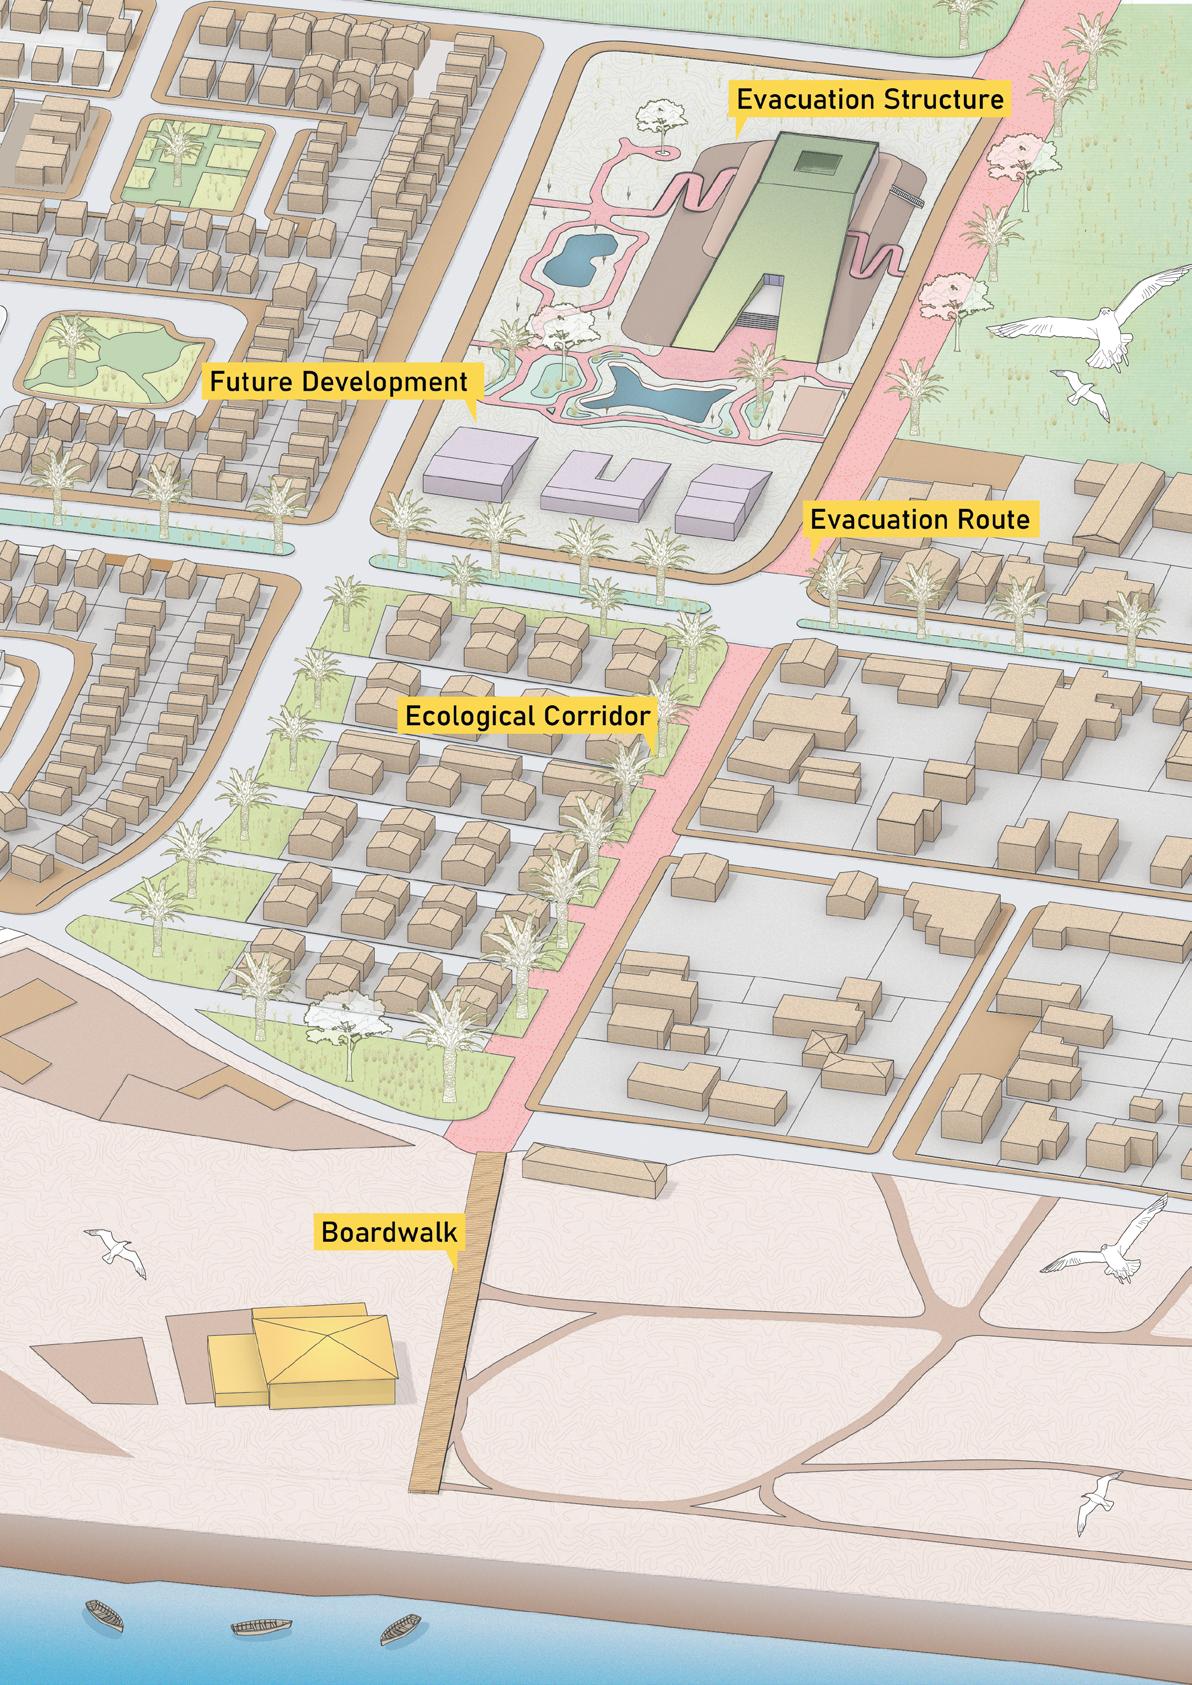
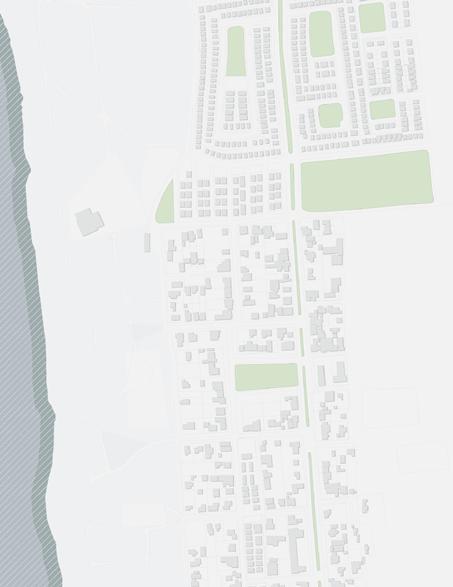
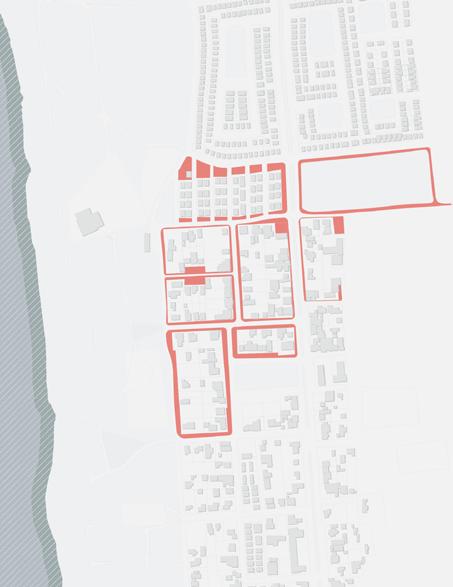
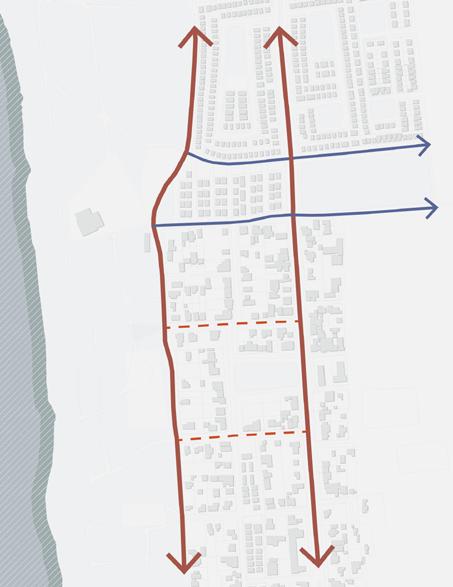
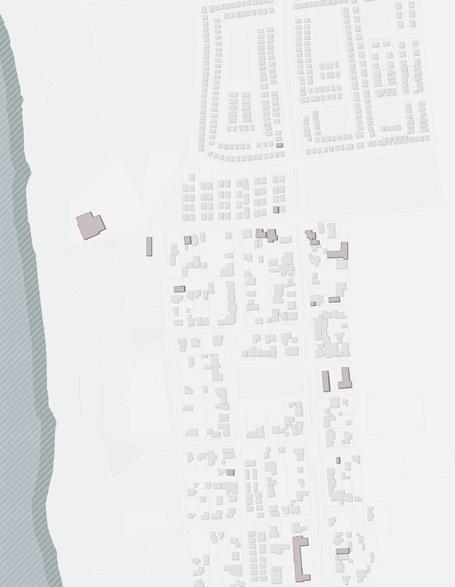
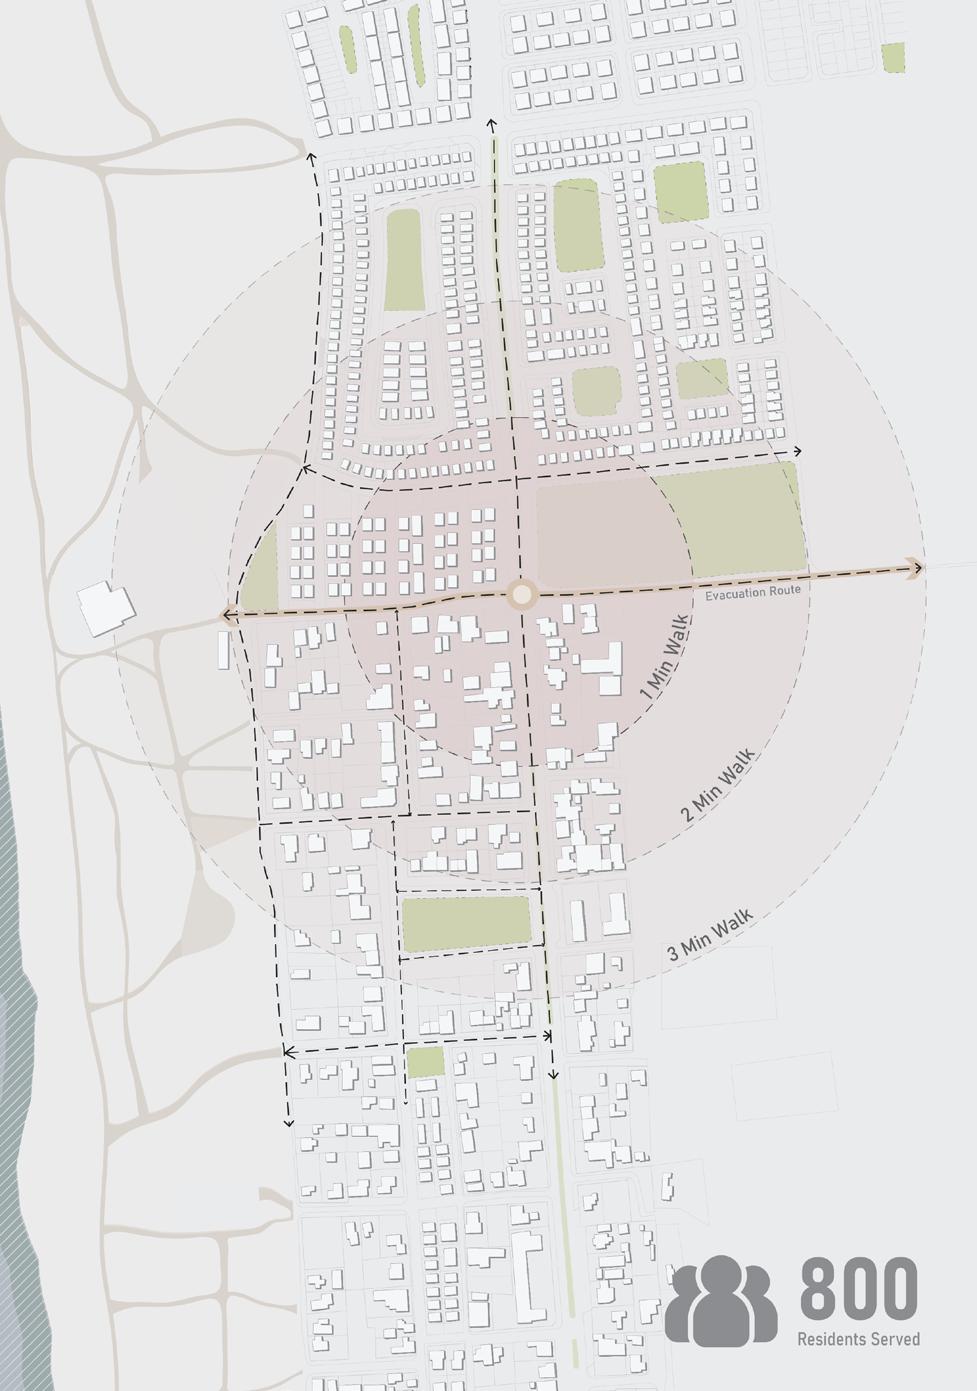
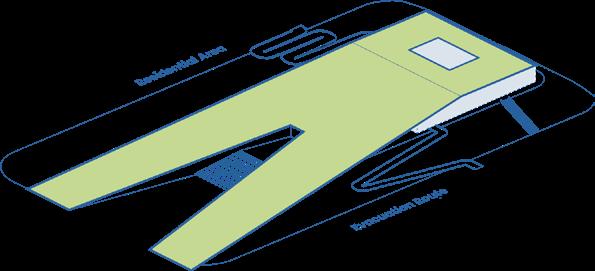
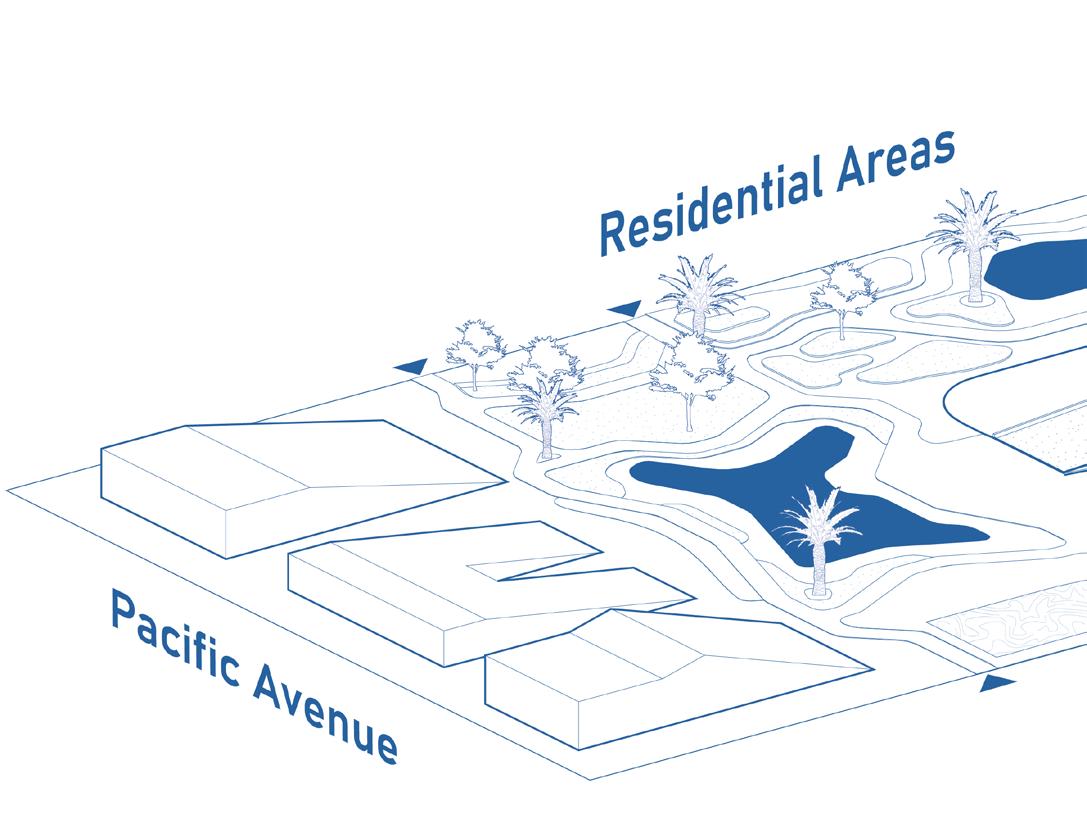
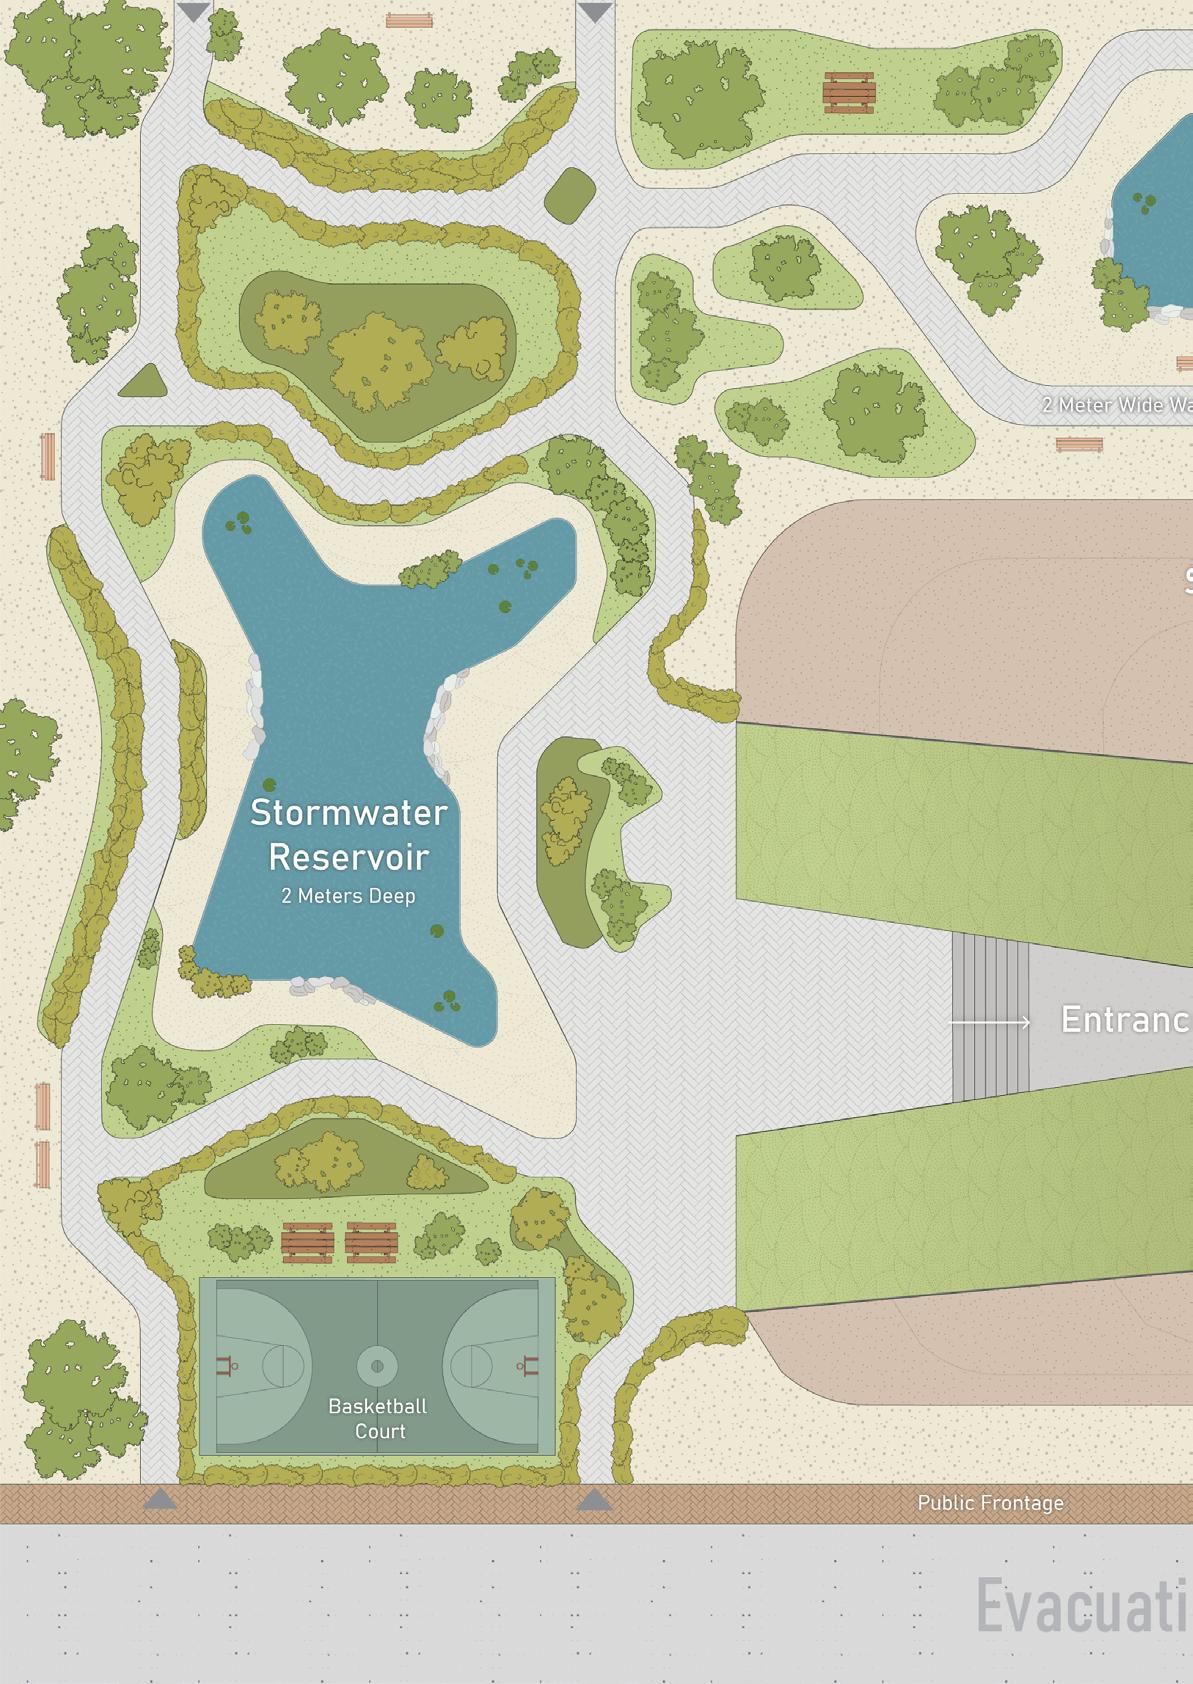
This project envisions a tsunami-resilient neighborhood in Caleta San Pedro, Chile, emphasizing sustainability and safety. The urban design strategy for 2030 aims to create a replicable model featuring an ecological corridor at the intersection of North-South and East-West axes. This corridor will include culinary hotspots like the popular Centro Gastronómico, alongside green infrastructure and serving as a vital evacuation route. The evacuation shelter is strategically located at this intersection, making it accessible to most residents within a 3-5 minute walk. This integration of amenities and safety measures reflects a comprehensive urban planning approach that prioritizes community engagement and disaster resilience. By fostering connectivity through the green corridor, the design promotes social interaction while enhancing the area’s ecological health. It serves as a model for future developments in tsunami-prone regions, balancing safety with quality of life.

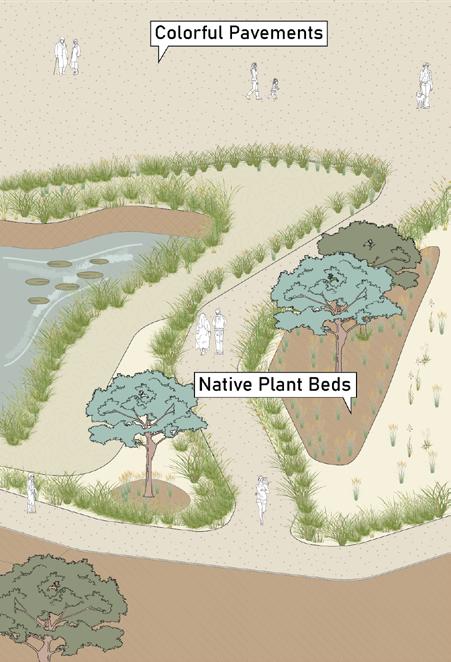
Green Spaces Public Frontages

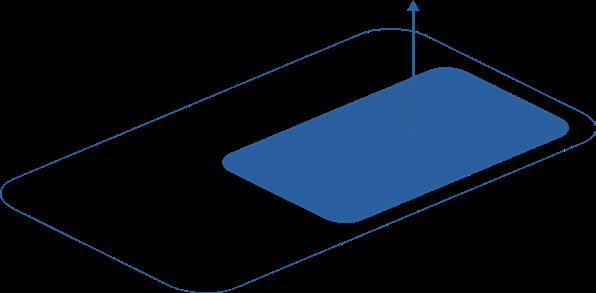
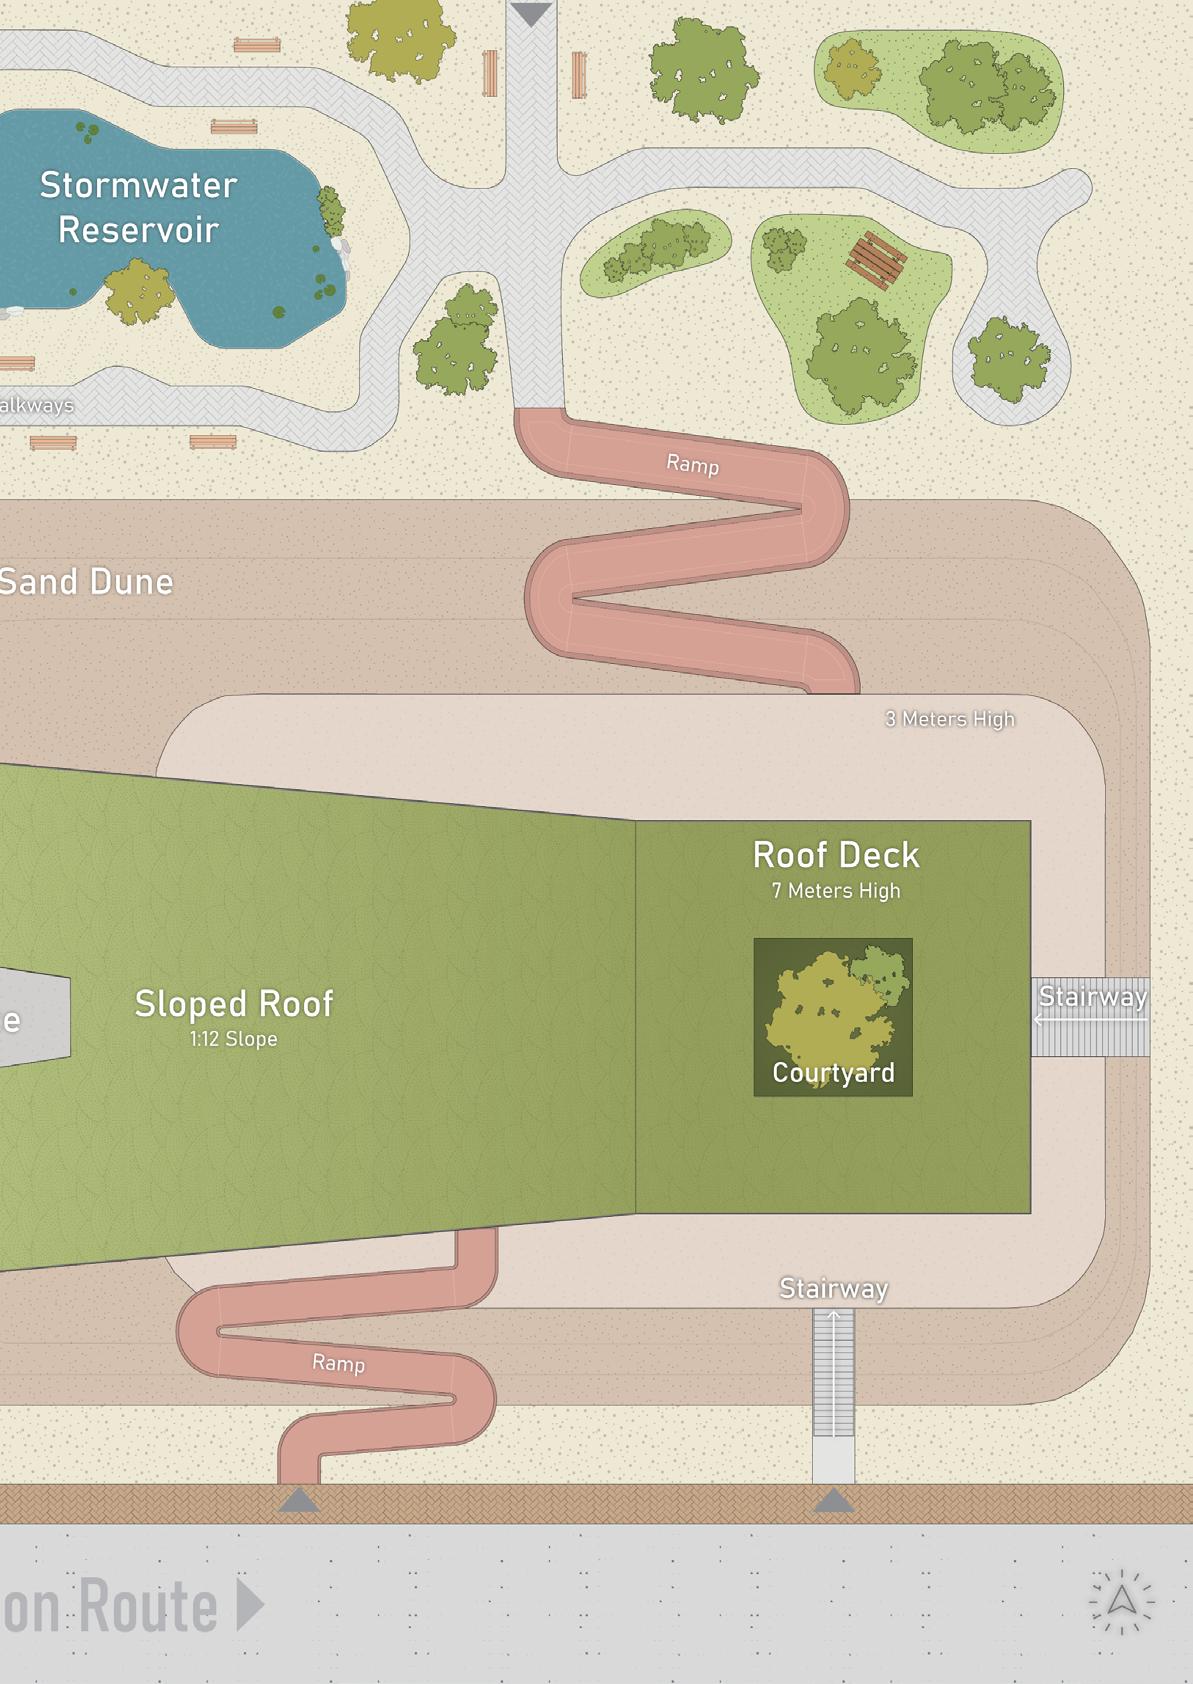
A small part of land was raised to facilitate vertical evacuation and create a natural hill-like appearance
The artificial sand mound created has the maximum height of 3 meters and covers only small portion of the site.
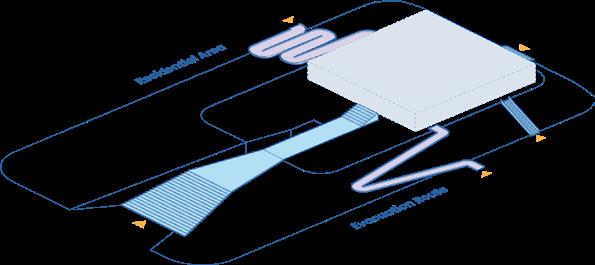
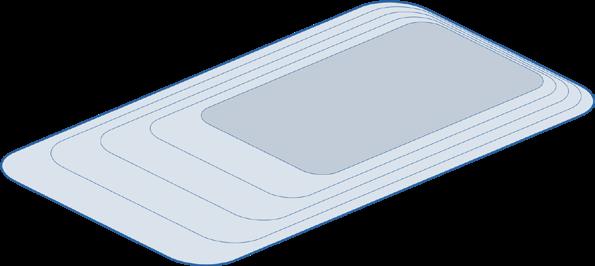
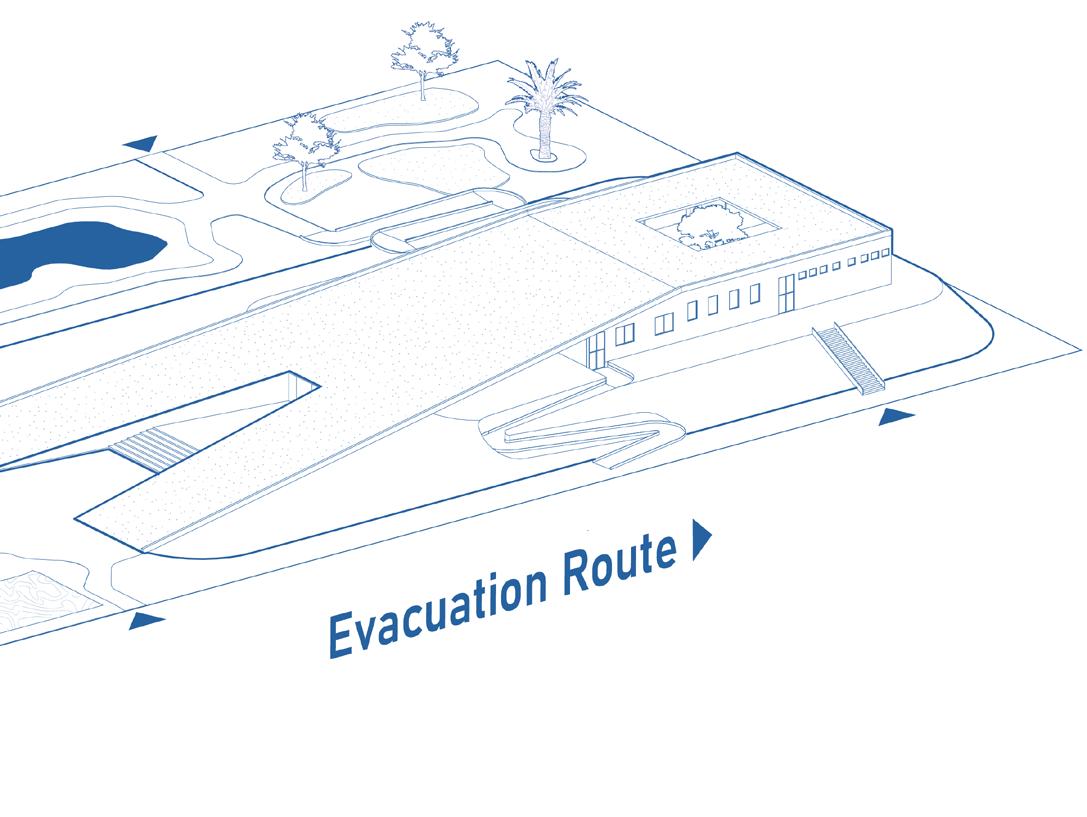
Multiple access points, including ramps and stairs, are provided prioritizing the accessibility of evacuees
The long site is utilized to create a gradually sloping, walkable roof on top of the evacuation structure with a safe height of 7 meters.

Space is reserved for community programs like schools and hospitals, which also serve as vertical barriers to reduce the impact of tsunami waves. This dual-purpose approach ensures safety while fostering community development. These spaces are strategically positioned to protect the inland areas from potential wave surges.

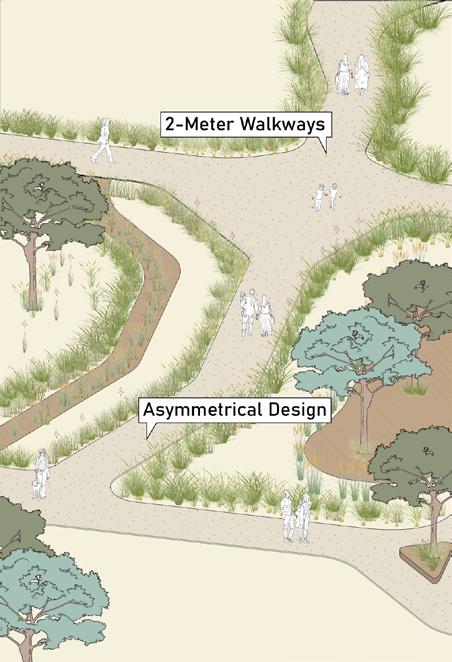
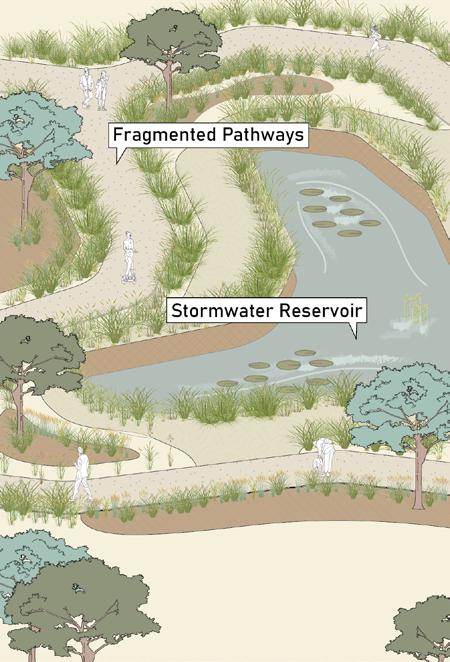
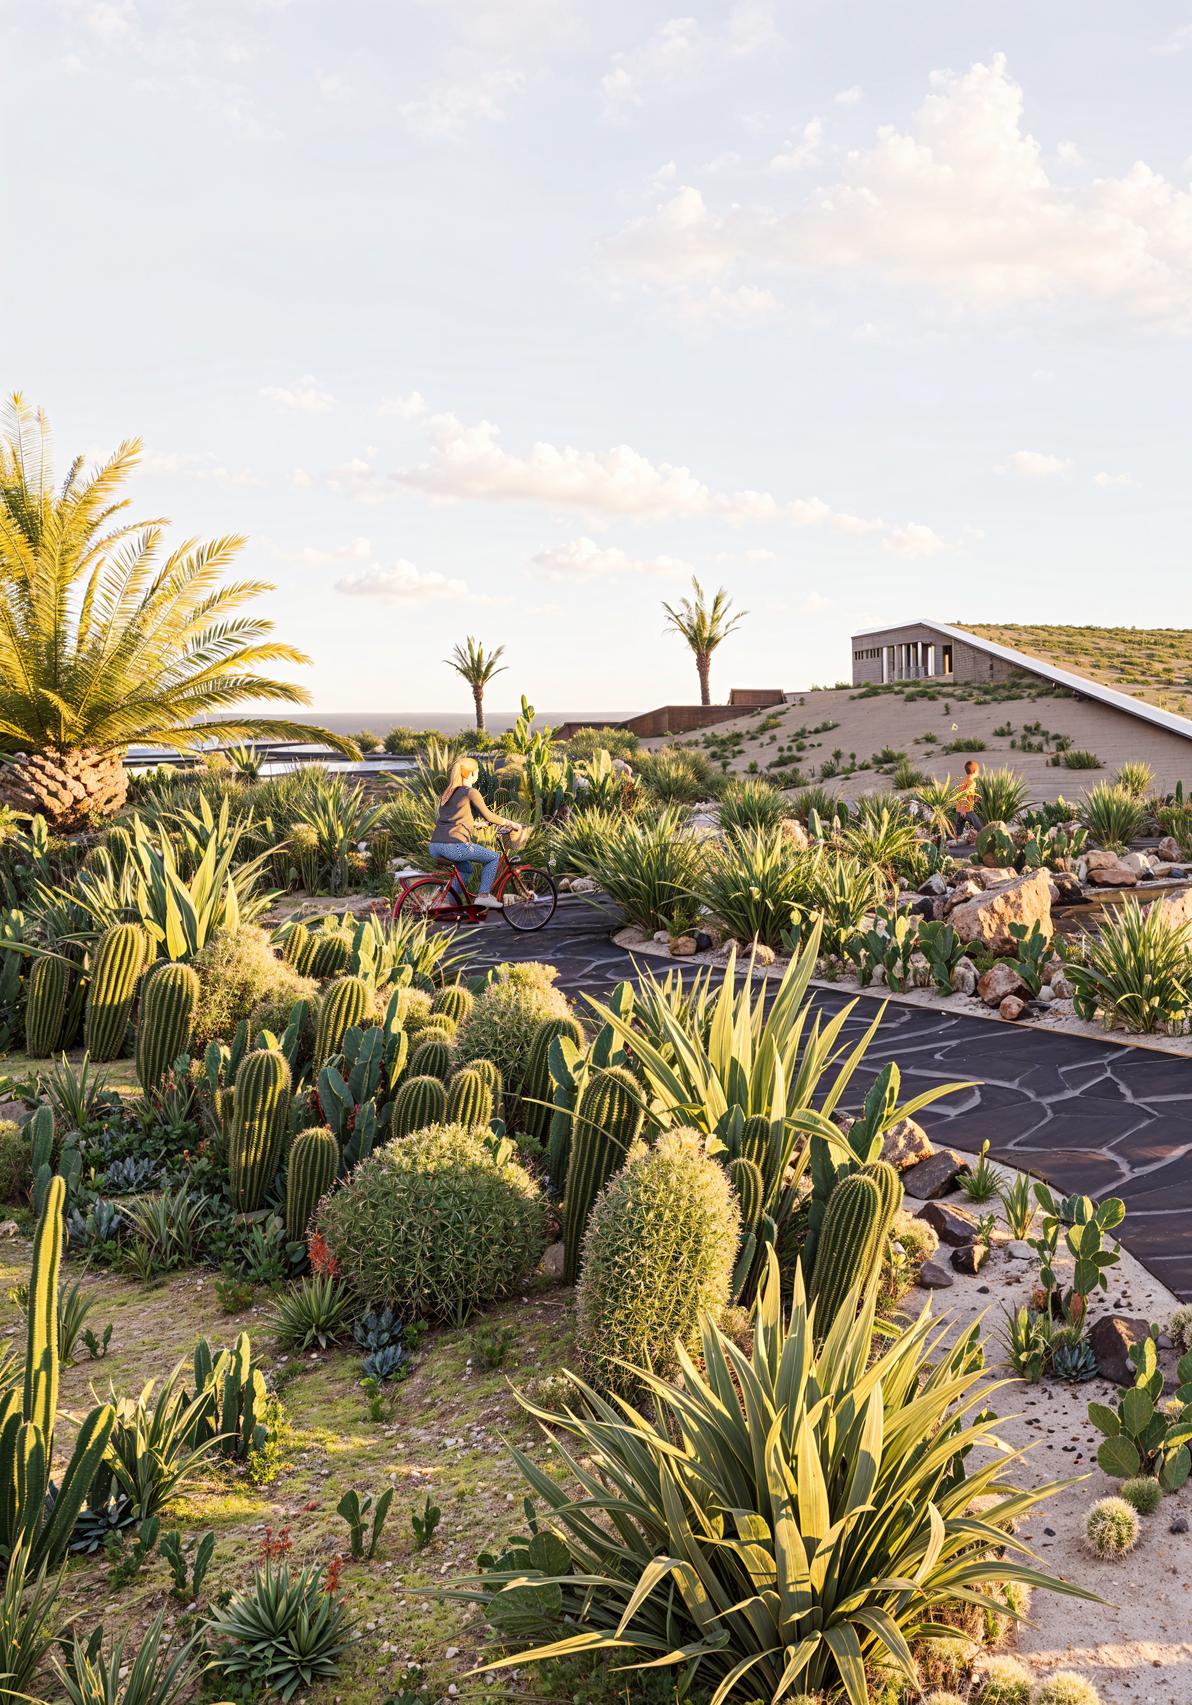
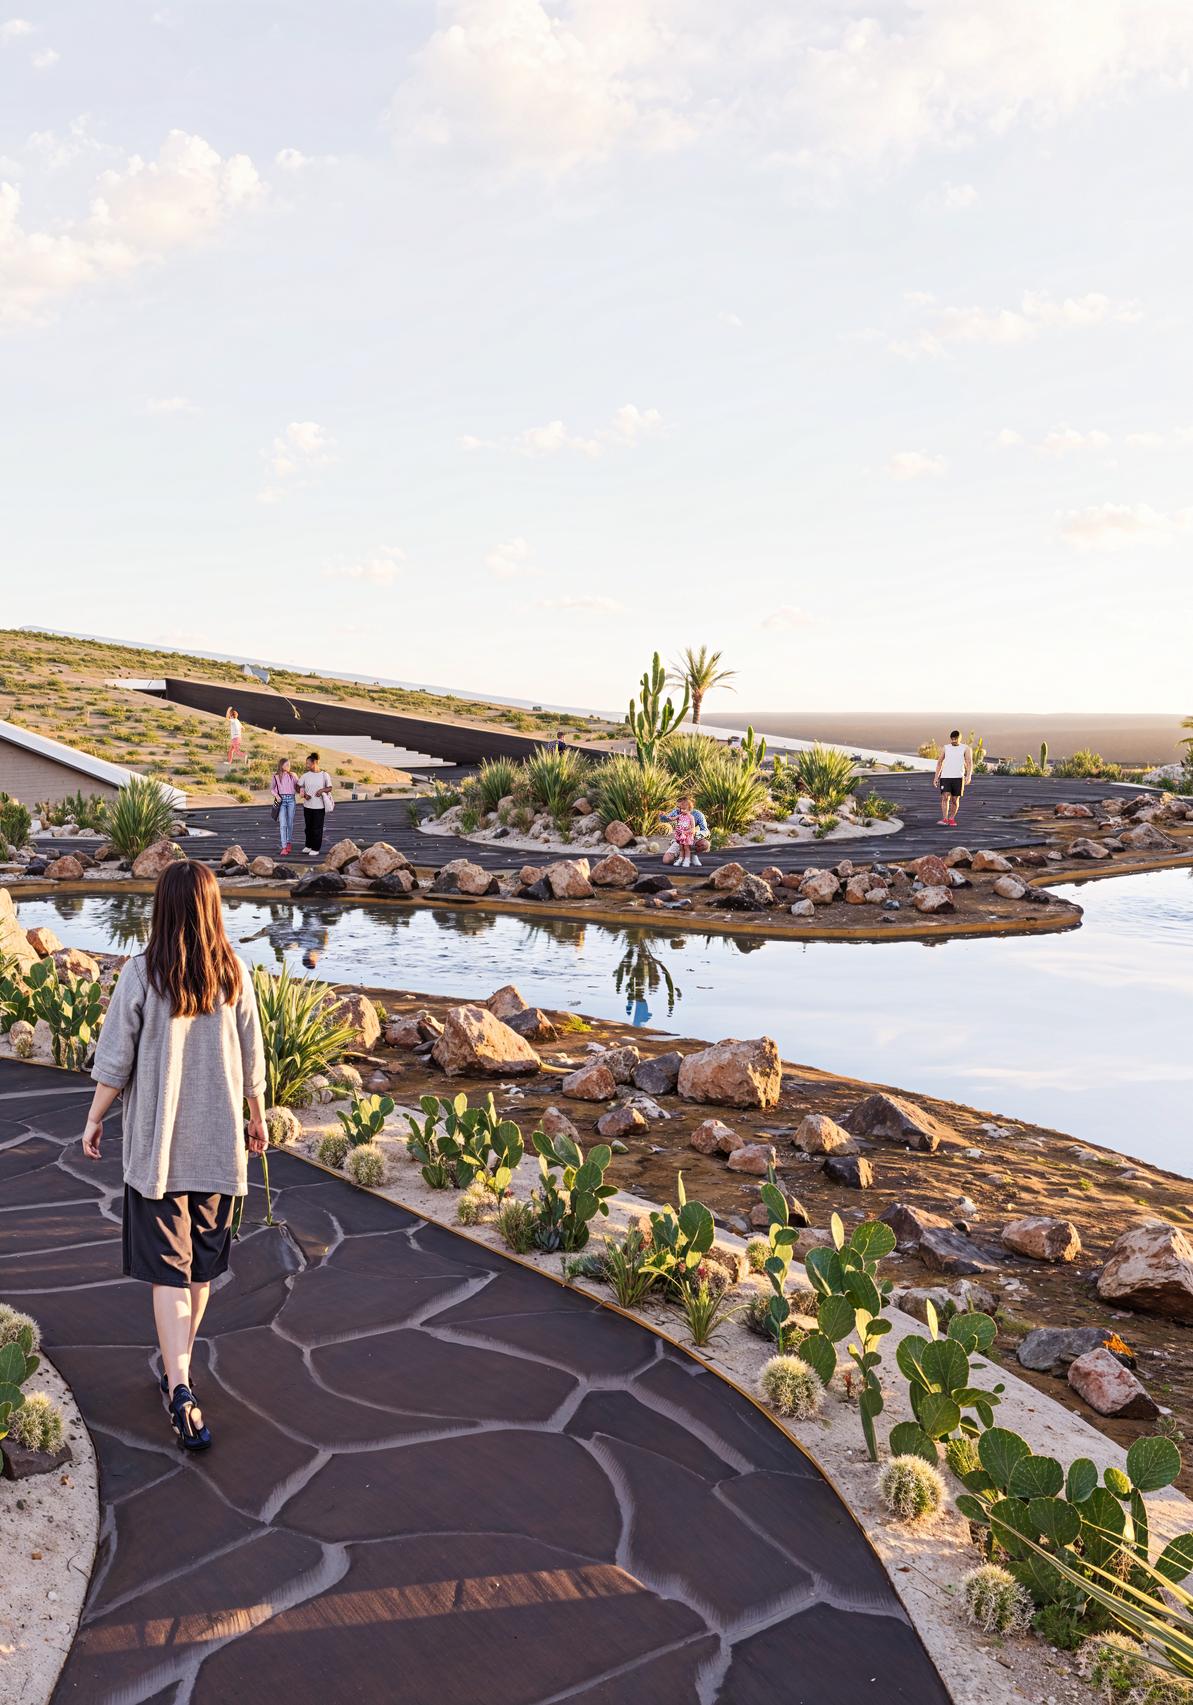
Inspired by Roberto Burle Marx’s modernist principles, the landscape incorporates asymmetrical and fragmented designs for visual dynamism. The open spaces draw on abstract art forms, creating engaging and artful environments. Plantings and material choices enhance ecological balance while adding to the aesthetic appeal.


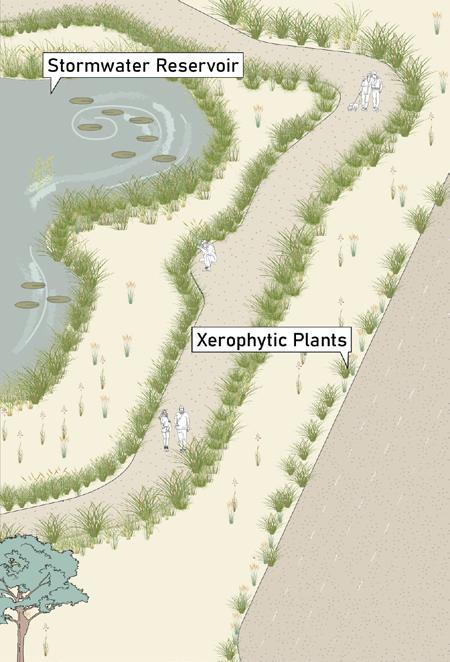
Natural Tsunami Stormwater Reservoir
Designed to absorb residual tsunami waves, the reservoir features organic, curvilinear shapes to mimic natural forms. This approach enhances both functionality and aesthetic appeal by creating a lyrical, flowing design. Its integration with the landscape also aids in managing stormwater runoff during heavy rainfall

Versatile Multi-Use Evacuation Shelter
The 3-meter-high covered shelter atop a sand mound doubles as a fish market on regular days and includes kitchen and storage spaces for emergencies. It has a walkable, gently sloped roof that leads to a safe height of 7 meters, ensuring accessibility and safety during evacuations.


Team Member
Collaborator: Digital Blue Foam
Date of Project: 2022-23
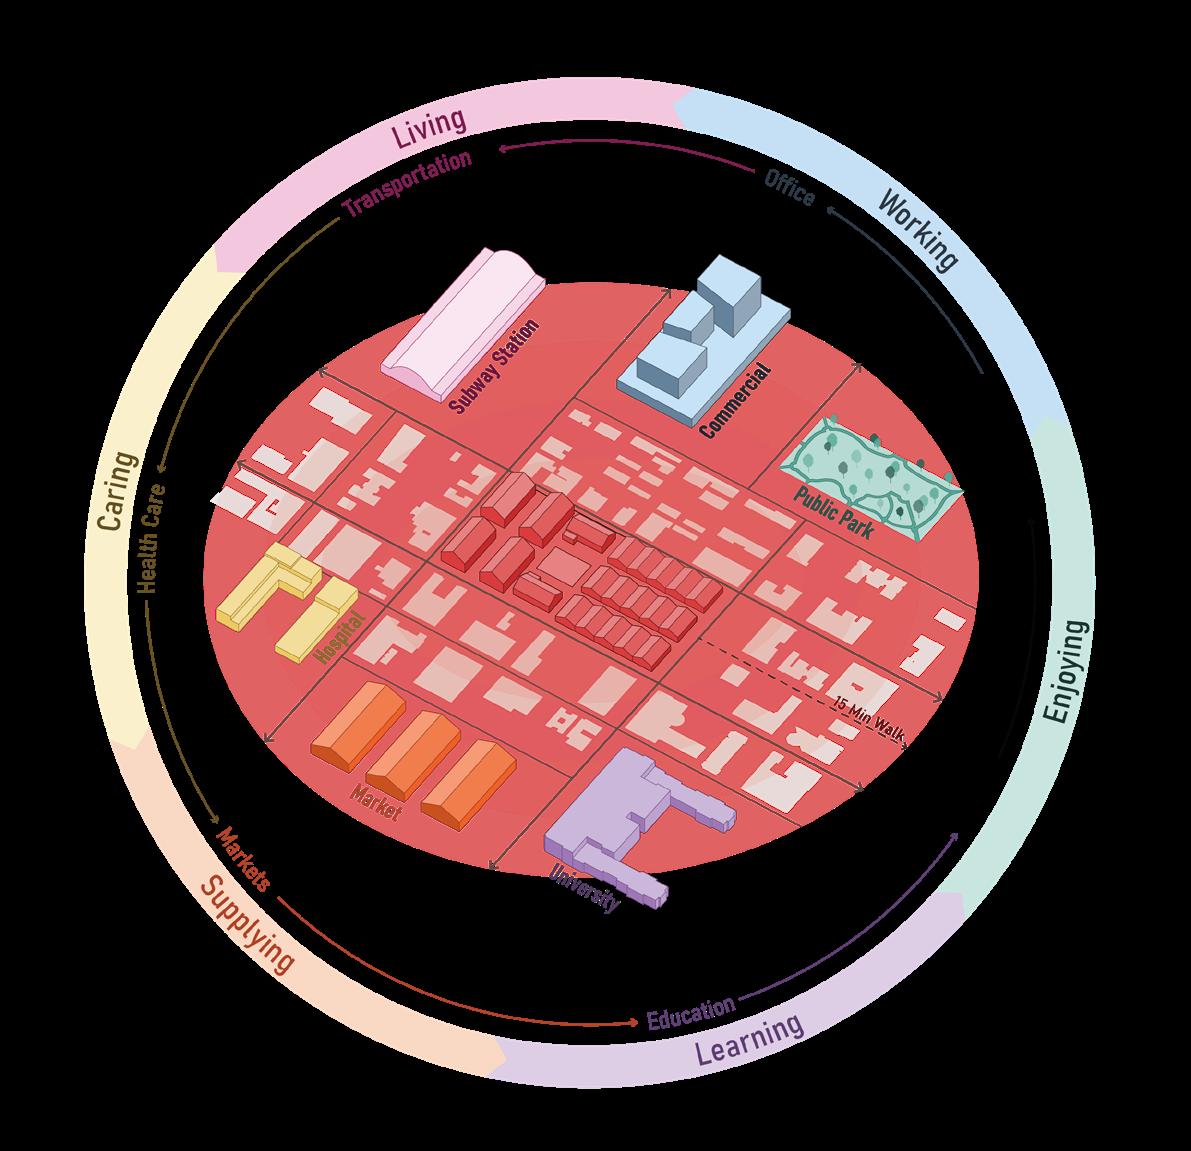
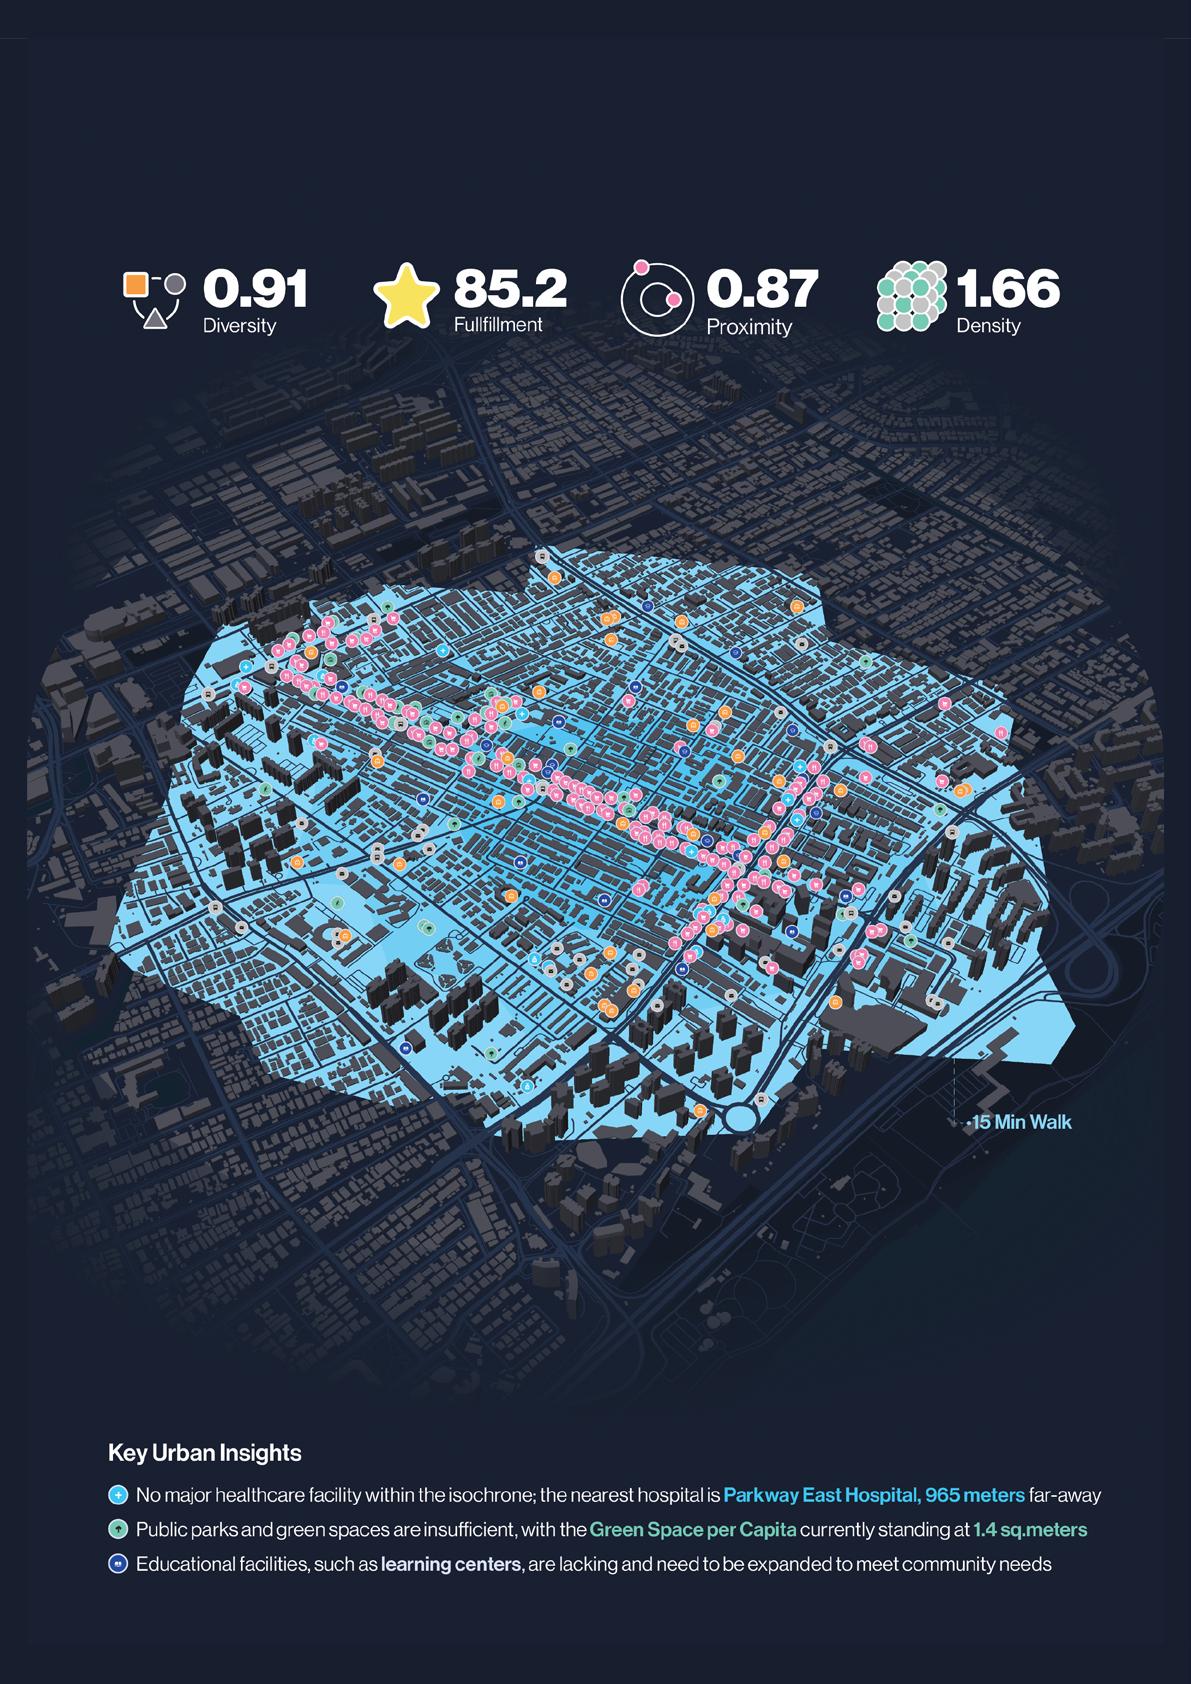
The “15-minute city” concept is driving a paradigm shift in neighborhood design sensibilities by emphasizing accessibility and sustainability. This methodology focuses on developing a set of indexes that qualify neighborhoods based on the design principles established by urbanist Carlos Moreno. These indexes score localities using contextual data from various regions worldwide, enabling a comprehensive evaluation of neighborhood quality. To effectively develop this quality score, it is crucial to consider both temporal and spatial dimensions, which is achieved through isochrone analysis. This analysis defines the search area for urban features, allowing for a precise understanding of how well amenities and services are distributed within a 15-minute reach. A user-friendly web application has been created to facilitate real-time feedback on neighborhood design, enabling refinements at both the building and tenancy levels.
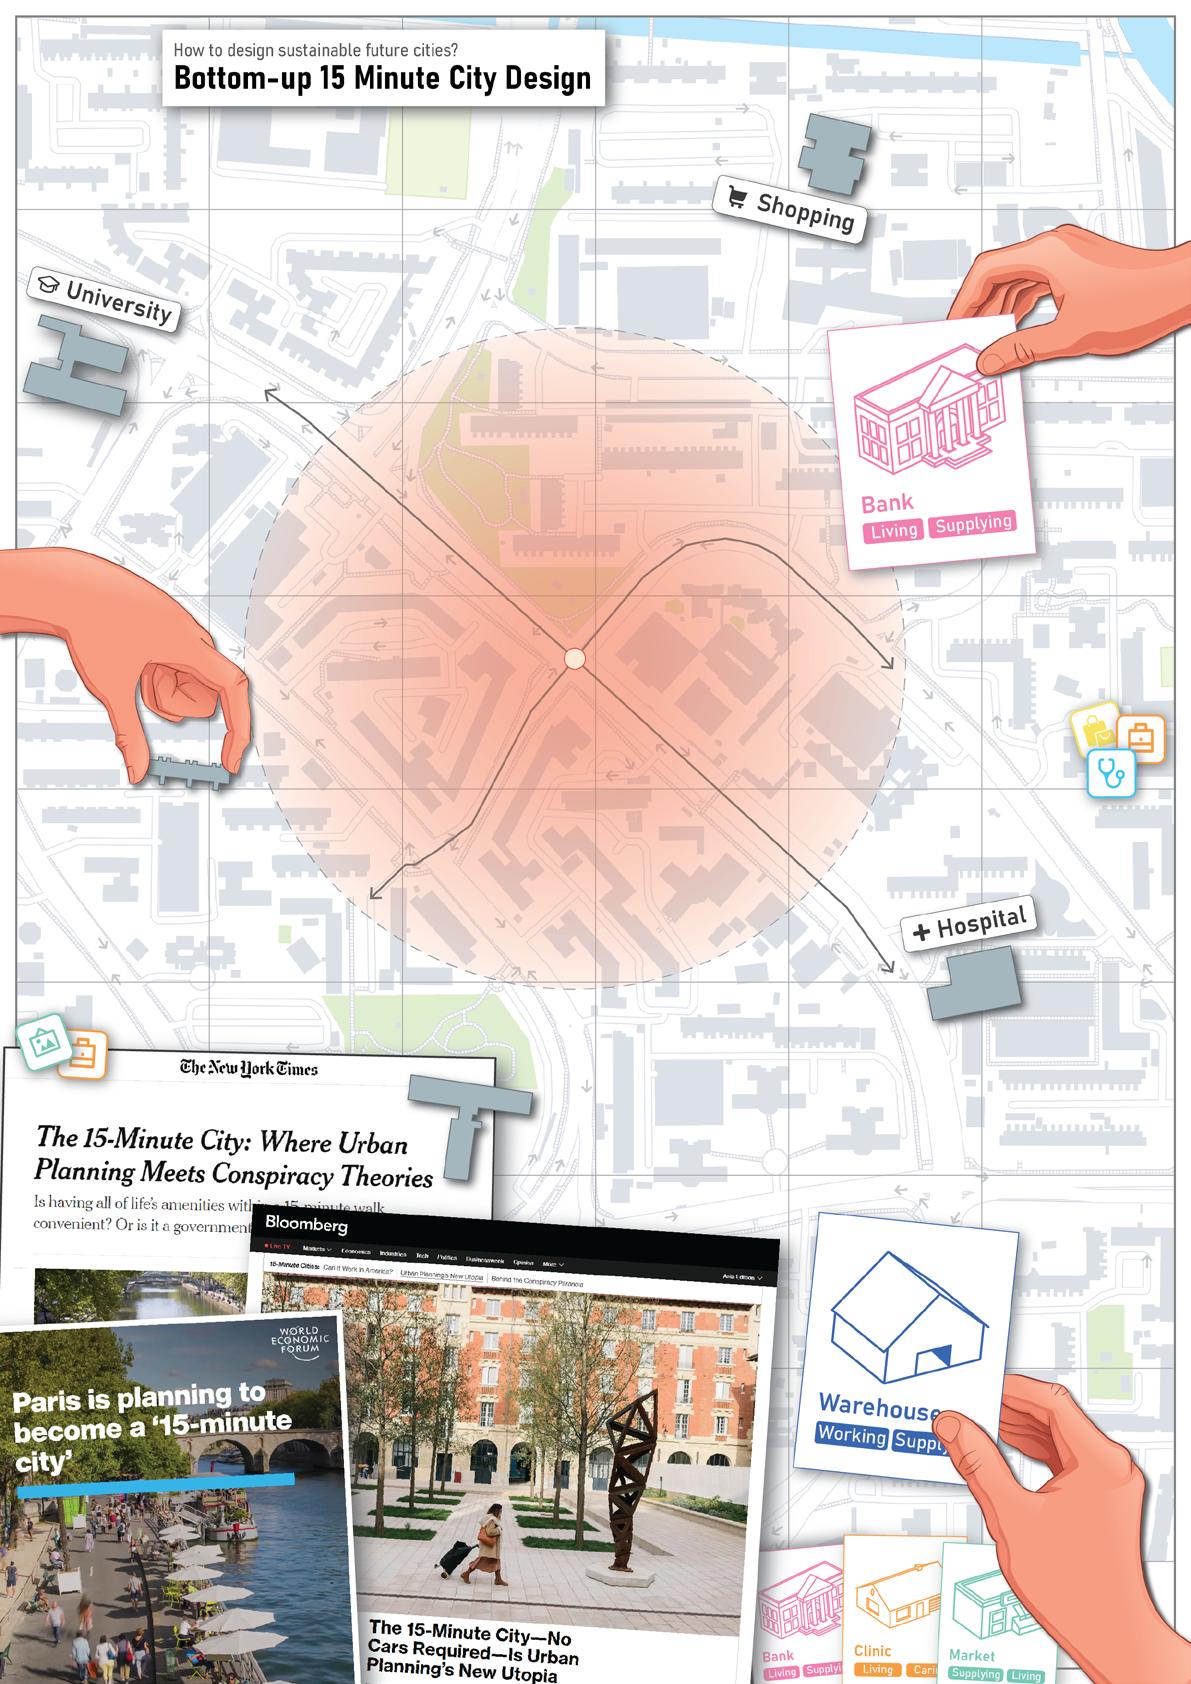
The ”15-Minute City” is driving a paradigm shift in how people conceive neighbourhood design sensibilities. The concept of the 15-Minute City, developed by Carlos Moreno, envisions urban spaces where residents can access essential services within a 15-minute walk or bike ride. The concept emphasizes decentralizing cities into smaller, self-sufficient neighborhoods to reduce reliance on cars, promote active transportation, and enhance the quality of life.
Highlighting the importance of local governance and community participation in decision-making to ensure equitable access to resources for all residents. By promoting shorter commutes and reducing traffic congestion, this model aims to significantly cut carbon emissions and improve public health. It presents a blueprint for urban resilience in the face of challenges like climate change and social inequality.
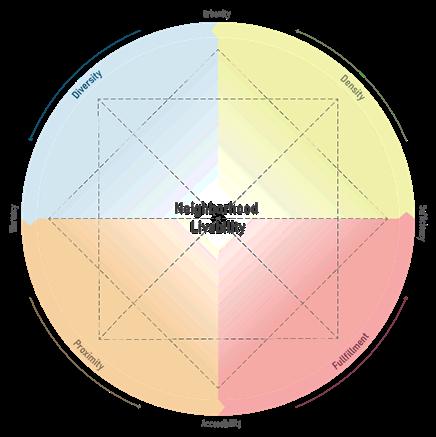
This diagram shows how the 15-Minute City can be evaluated by examining the interplay between Fulfillment, Diversity, Density, and Proximity. These factors work together to assess how well a neighborhood serves its residents, ensuring that essential services are easily accessible, balanced in availability, and meet the community’s needs efficiently within a short walkable distance.
The DBF neighbourhood scoring system we developed was based on geolocation and contextual data, it calculates varies neighborhood scores to evaluate the spatial quality of the urban environment. The evaluation is presented through valuable urban insight visualized in a user friendly interactive online platform.
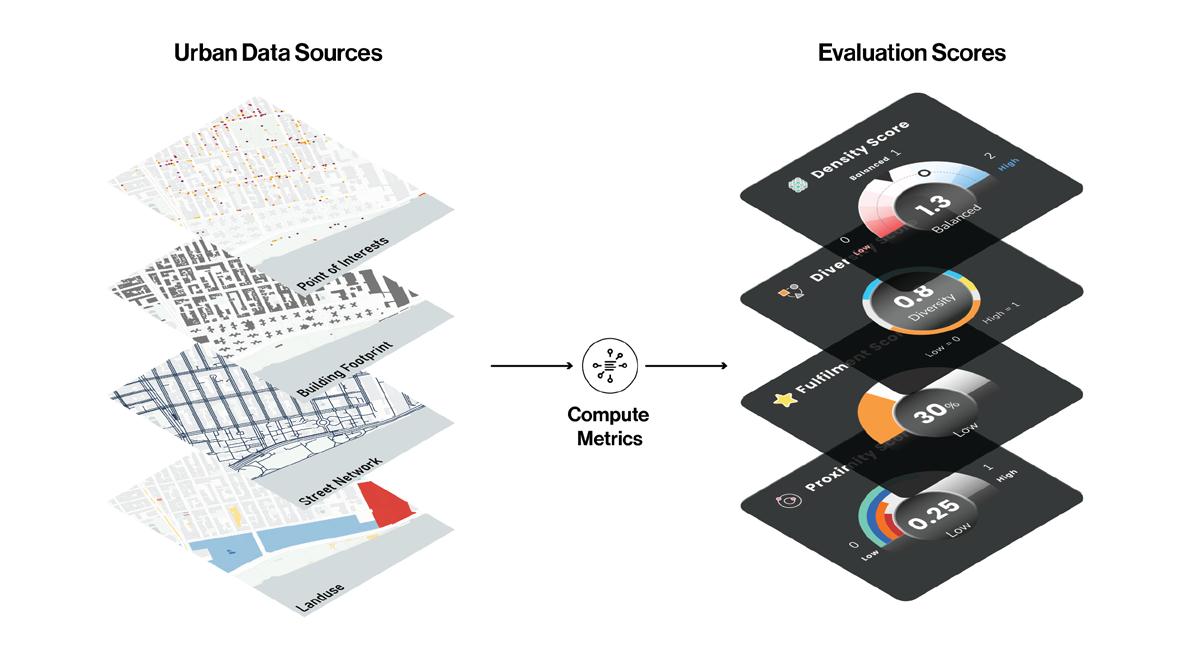
The system retrieves amenities data for categories like transit stations, hospitals, shopping malls, and schools from HERE API, using either a predefined isochrone or a 25km search radius. This data could also be augmented from other sources, such as official local government datasets, or by the user if the open source data available within the study area is insufficient or does not accurately reflect the reality on the site
The system analyzes location-specific urban data to calculate key neighborhood metrics, like proximity, density, diversity, and fulfillment scores. Using statistical and geospatial clustering, it generates visualizations and insights to assess spatial quality and propose data-driven interventions. Users can refine neighborhood designs interactively, leveraging these insights to enhance urban planning outcomes.
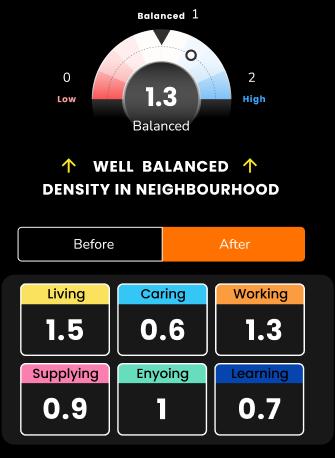

The density score represents how balanced a neighbourhood is by comparing the number of amenities that are available relative to the required amount imposed by the needs of the population
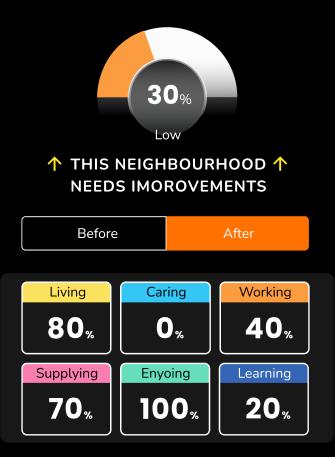

The fulfilment score is a value that represents the percentage of the population’s needs in terms of amenities fulfilled by urban amenities found within the 15-minute walking isochrone area shed.
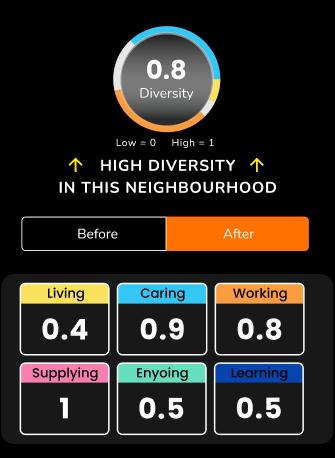


Diversity is conceptualised in terms of people and physical space to create mixed neighbourhoods. In the tool we consider urban diversity, measuring the distribution of various amenities.
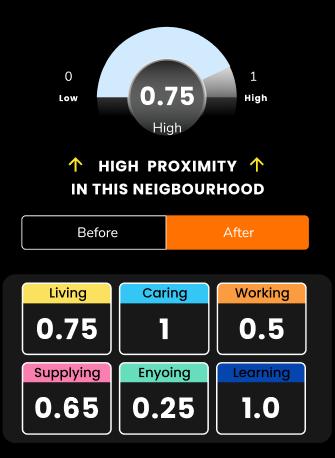


The proximity dimension focuses on ensuring residents can access urban services quickly, without spending time on travelling. The proximity score ranges between 0 and 1.
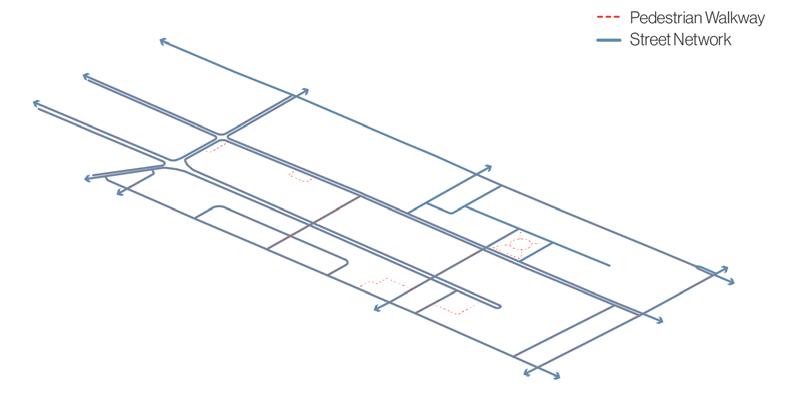
Street networks redesigned into an efficient grid layout, incorporating pedestrian-friendly walkways to enhance connectivity and mobility
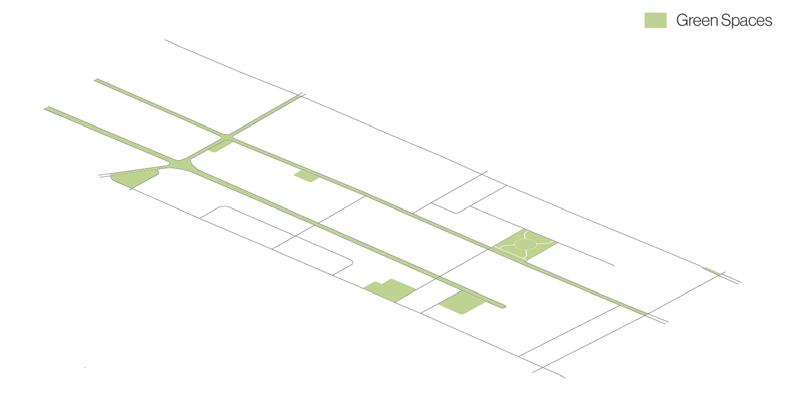
Unutilized land transformed into green spaces and public parks, fostering community engagement and promoting healthier lifestyles
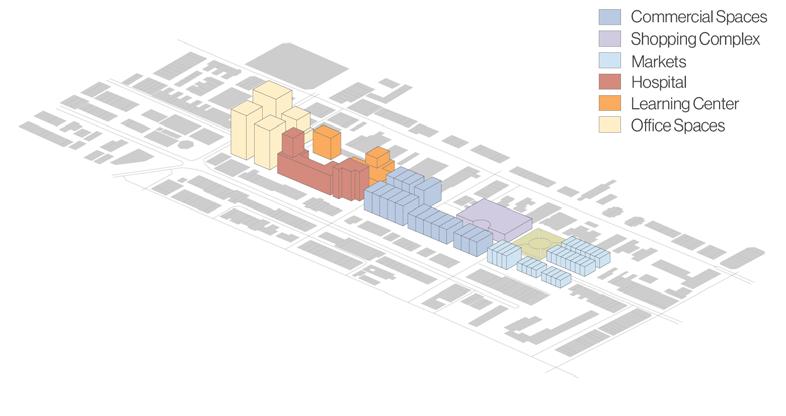
The Joo Chiat Rd restructured with distinct building use zones and optimized vertical density to support diverse urban activities

Team Lead Supervisor: Sayjel Vijay Patel, Digital Blue Foam
Date of Project: 2023
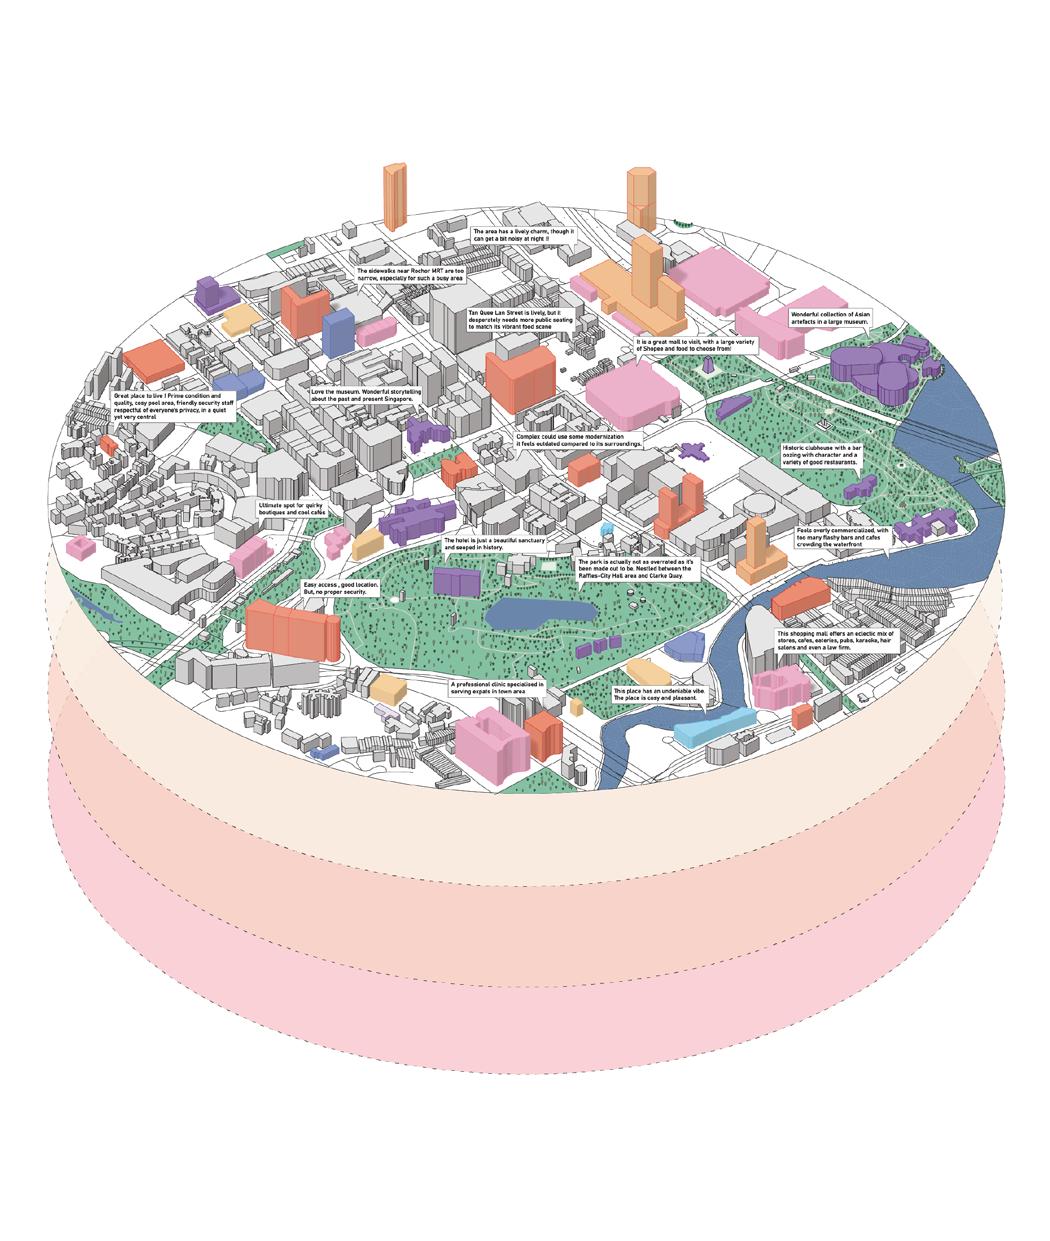
As cities worldwide embrace the ”15-Minute City” concept to address challenges like the rapid urbanisation and climate change, effective implementation remains hindered by the difficulty of linking location-specific requirements with viable design solutions. To tackle this issue, a novel urban concept generation tool was developed, utilizing a pre-trained language model (PLM) fine-tuned with structured examples based on 15-Minute City principles. This innovative tool maps relevant concepts to specific locations, automatically generating neighborhood design ideas in natural language. By leveraging data from the C40 Cities database, the approach not only generates tailored solutions but also validates them against various metrics. The research highlights recent advancements in artificial intelligence (AI) as a means to enhance urban design processes. This integration of AI into urban planning promises to revolutionize how cities can be designed for better accessibility and sustainability.

By combining data from crowd sourced mapping platforms, social media, and review sites, insights on walkability, safety, and urban diversity can be extracted to inform urban design. These qualitative layers provide valuable feedback for city planners to enhance functionality and the sense of place in specific locations.

Leveraging large language models and location-specific datasets, a ”design concept generation” tool was developed to propose solutions aligned with the 15-Minute City framework. This tool integrates AI-driven neighborhood design recommendations with designers’ creativity and data driven urban planning.

Assisted by language models, qualitative and quantitative data were integrated to assess urban areas, focusing on 15 Minute City metrics like fulfillment, density, diversity, and proximity. This approach provides actionable insights, enabling a more inclusive, context-aware perspective in urban planning.

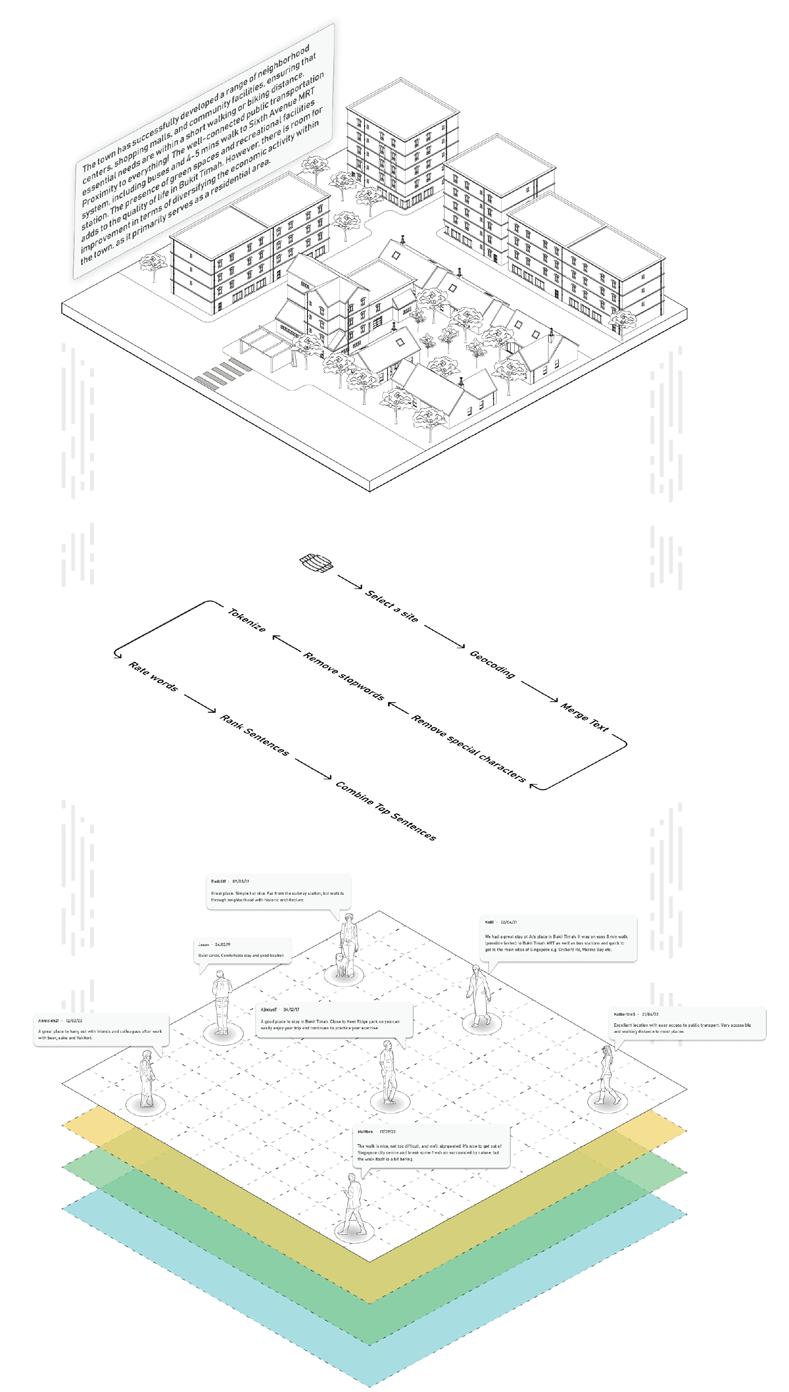
User-defined Neighborhood Description
Natural Language Processing
Geolocated
User Reviews
Social Media
Property Listing
Places Guide

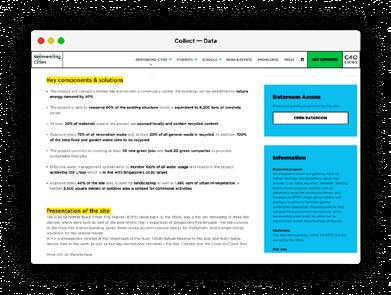
The dataset was sourced from winning entries of the ”Reinventing Cities” competition conducted by C40 Cities, which focused on sustainable urban design solutions. These entries were evaluated by multidisciplinary teams of experts.
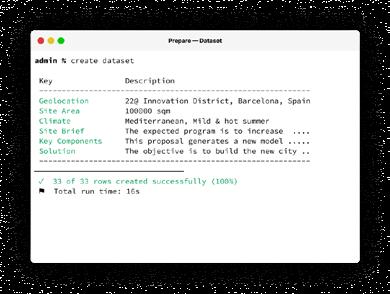
The textual data was reformulated into input-output pairs by combining attributes such as site location, climatic conditions, plot area, and expected programs for consistency. This structured dataset was customized and formatted into JSONL files for fine-tuning the model.
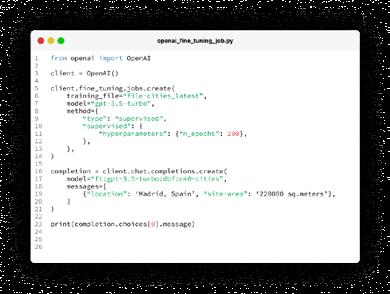
The large language model GPT-3 model by OpenAI, was fine-tuned using the curated dataset in JSONL format, enabling it to better understand urban planning contexts and constraints for generating tailored neighborhood design solutions.
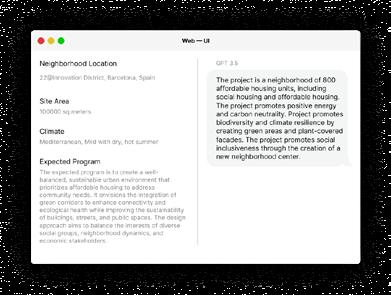
Intuitive web-based interface was created, allowing users to input site parameters and receive innovative and feasible neighborhood design recommendations addressing urban challenges such as social inclusion, green space, and high-quality urban design.

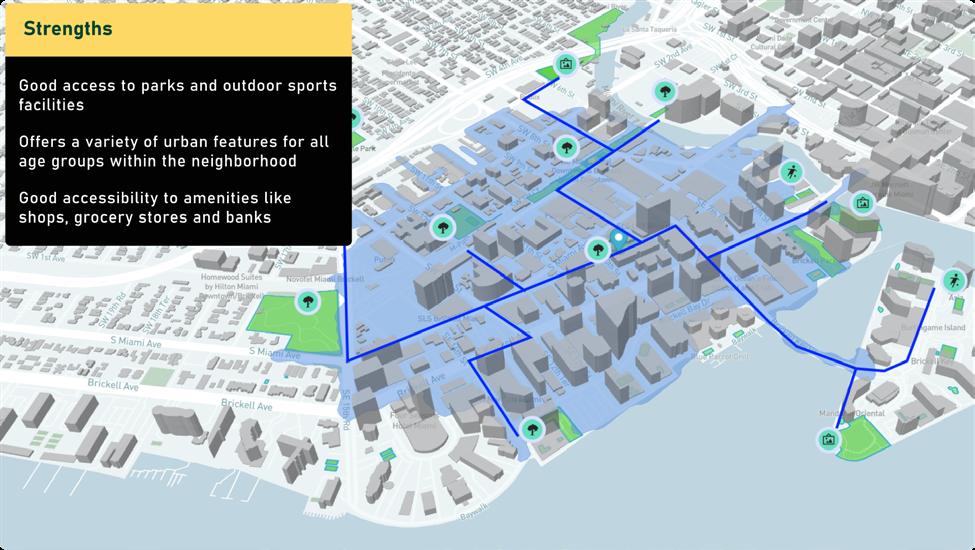
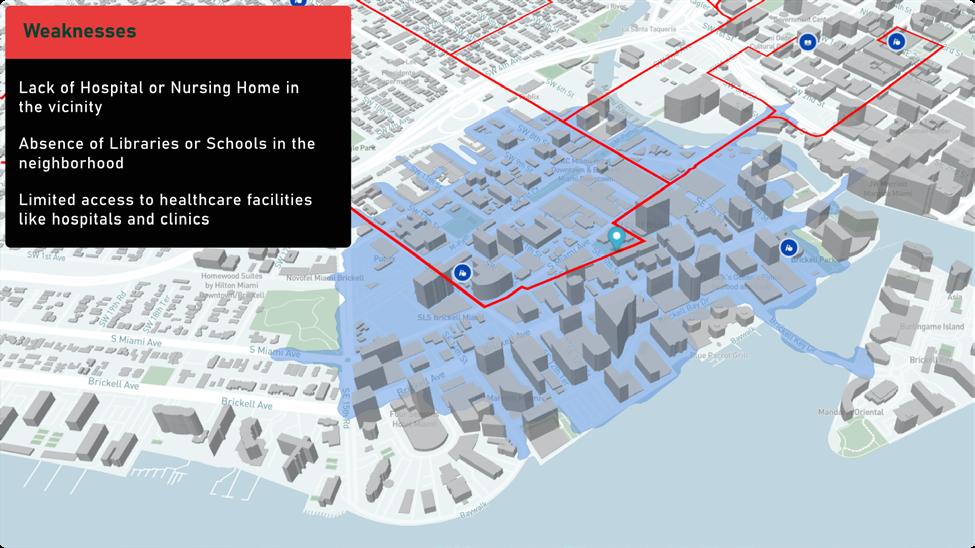
Using large language models, actionable insights were derived by combining spatial metrics with qualitative evaluations. This approach integrates proprietary data into a storytelling framework, allowing urban planners to visualize neighborhood strengths, weaknesses, opportunities, and threats directly on a map for informed decision-making.
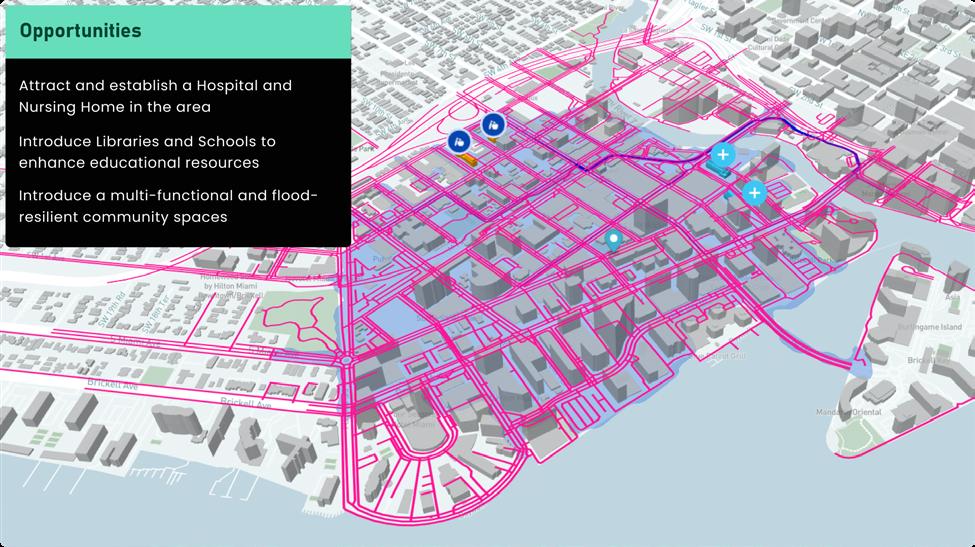
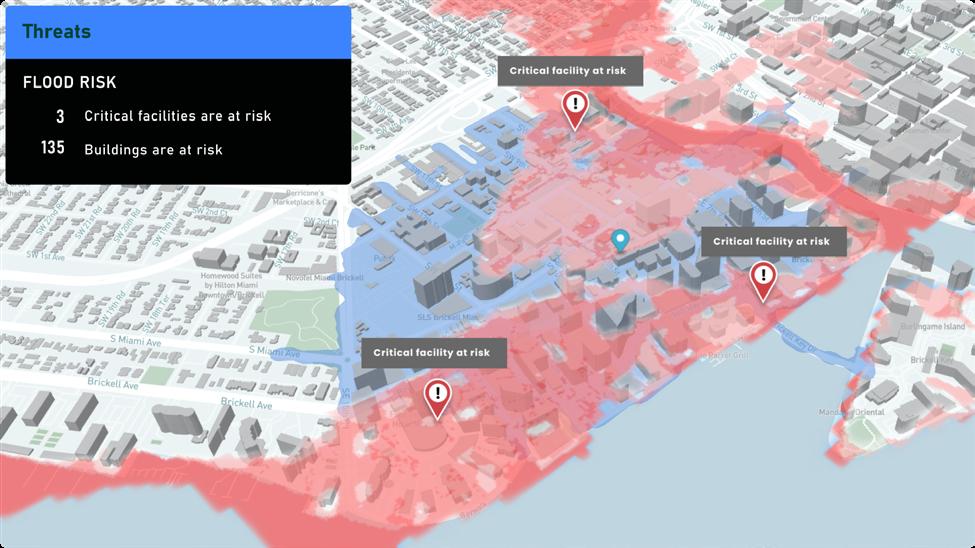
By linking spatial data to textual insights, urban evaluations gain a spatial dimension, enabling users to quickly identify areas requiring intervention. This method highlights missing amenities and assesses travel distances within a 15-minute isochrone, empowering planners to prioritize and introduce essential facilities strategically.

Collaborators: Cesar Cheng
Date of Project: 2022
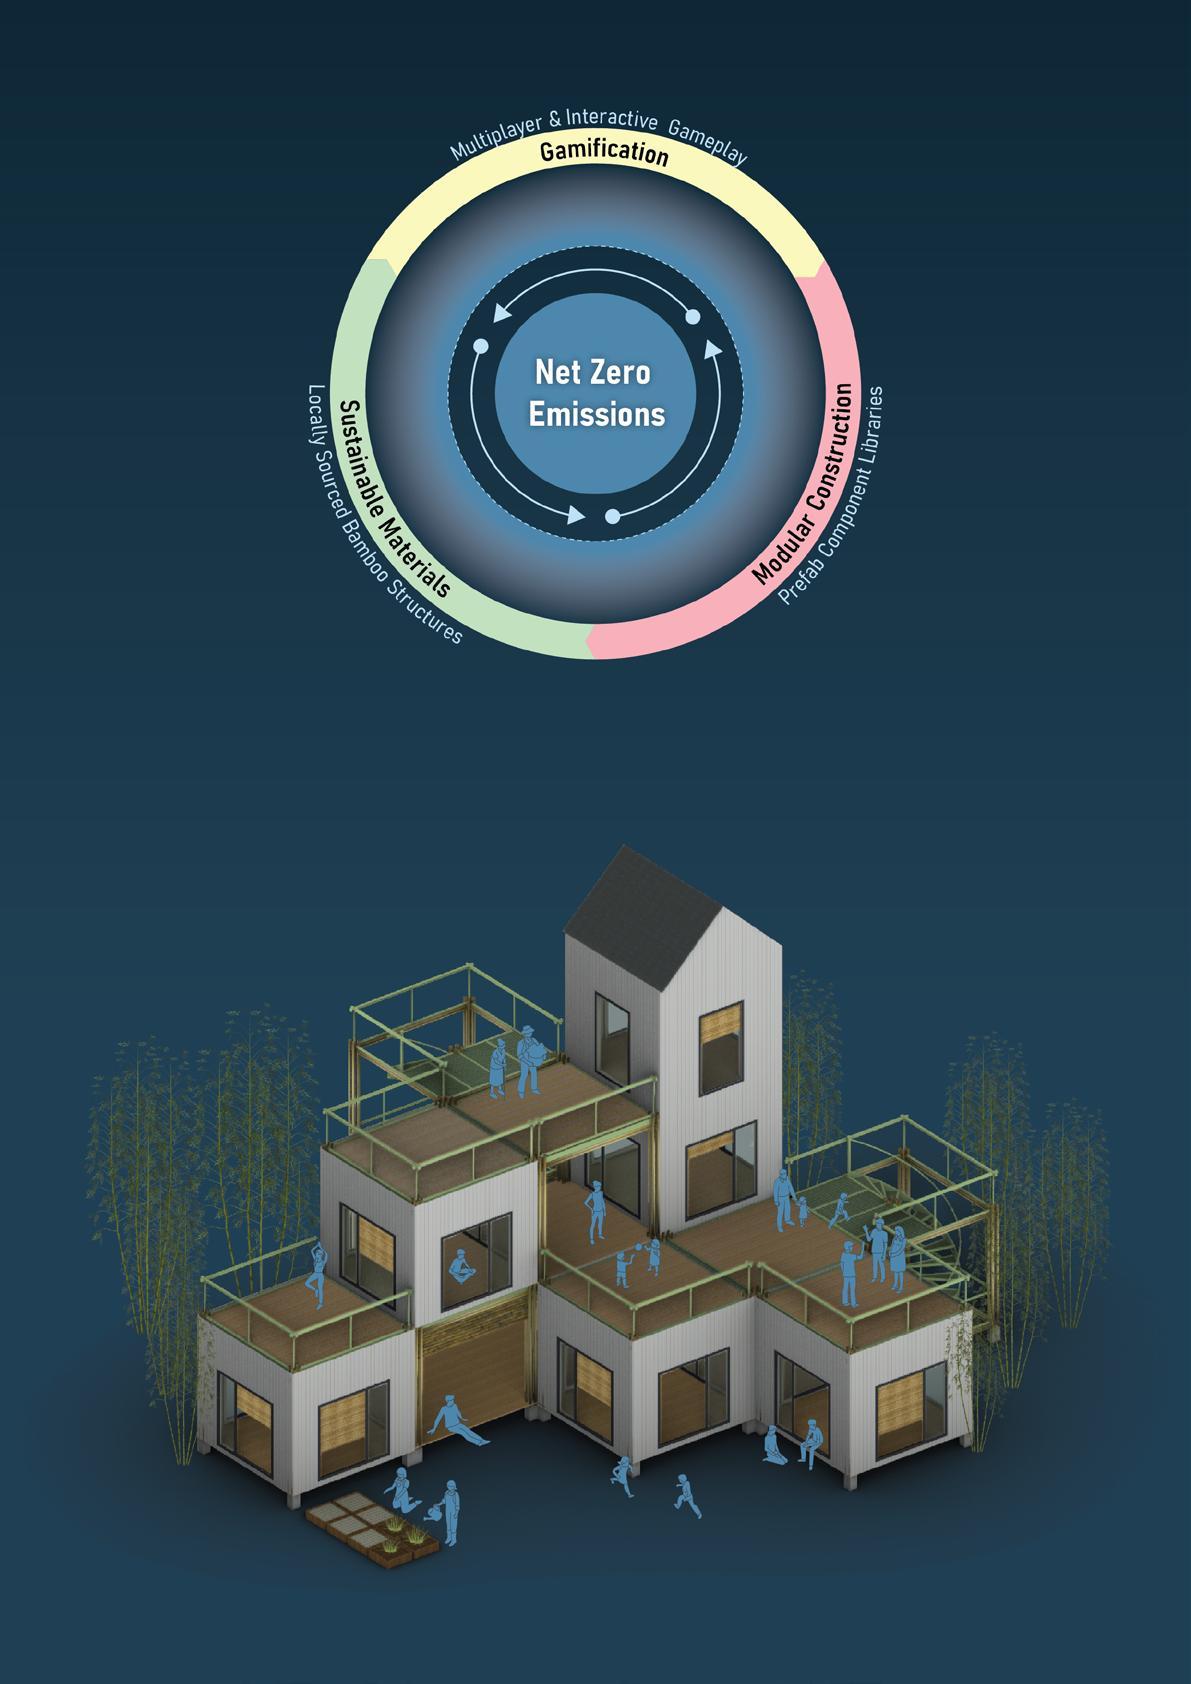
The growing demand for housing, coupled with the urgent need to reduce carbon emissions, poses a significant challenge to sustainable development. Traditional construction methods often result in high embodied carbon and resource inefficiency, further exacerbating environmental concerns. Addressing these pressing issues, an innovative web-based application was developed during a self-learning initiative at Digital Blue Foam to promote sustainable housing development through a user-friendly, gamified interface. The platform enables users to explore the principles of prefab modular construction and embodied carbon reduction by designing virtual housing layouts in real time. By offering a collaborative environment, Net-Zero Scape encourages users to think critically about minimizing environmental impact while addressing the growing need for housing. The application integrates sustainability into an interactive experience, making complex concepts like carbon accounting accessible and actionable for users of all skill levels. Through engaging design and real-world principles, it bridges the gap between sustainability education and practical application.

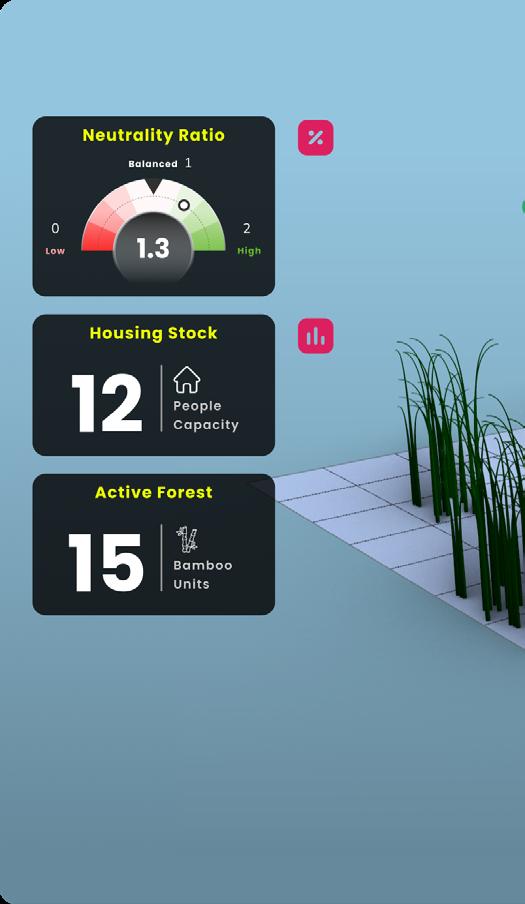
The Neutrality Ratio visualizes the balance between bamboo forest coverage and housing units. Players strive to maintain a healthy ratio, with higher values indicating a sustainable balance between construction and green spaces.

Building Stock: This score represents the housing capacity of the current design, reflecting the number of people it can accommodate based on the constructed modules.
Active Forest: This indicates the number of active bamboo units in the landscape, crucial for maintaining ecological balance and replenishing resources

These are customizable, prefabricated modules used for building sustainable housing and preserving green spaces. Modules like rooms and roofs add housing capacity, while connectors enhance design flexibility. Bamboo modules help regenerate the environment, enabling players to balance development with sustainability.
The application leverages voxel-based modular design, allowing players to build flexible, scalable structures within the 3D environment. These units provide a versatile framework for experimenting with density, spatial arrangements, and sustainable development strategies. Each module is designed to integrate seamlessly, offering creative freedom while maintaining a structured approach to design.
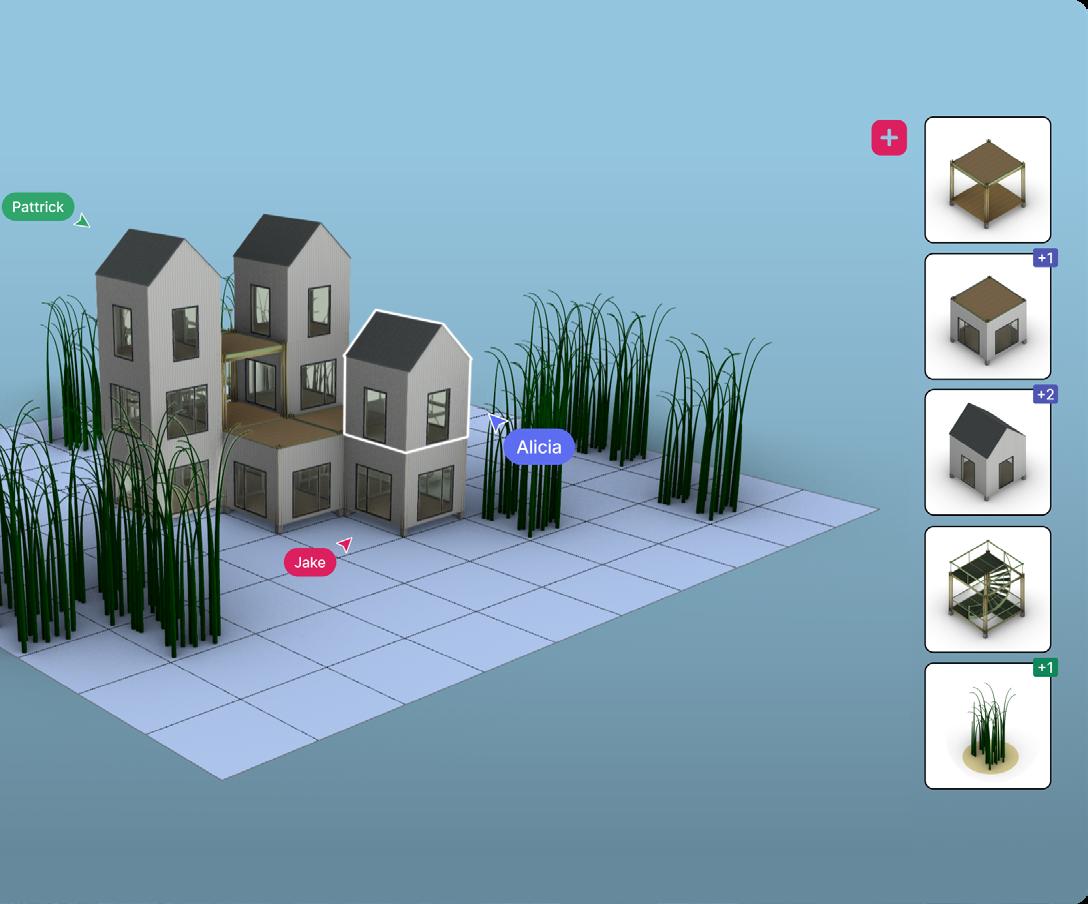
Net-Zero Scape enables players to work together seamlessly in real time, fostering collective decisionmaking and shared accountability. Using Socket. io, the platform ensures smooth communication and synchronized actions among players in the shared virtual environment. This feature enhances teamwork by encouraging participants to negotiate, strategize, and coordinate their actions effectively.
Players can monitor the impact of their actions through the Neutrality Ratio Score, which measures the balance between forest cells and building units. As the game progresses, players must carefully balance increasing density, constructing housing units, and replenishing forest cells to maintain sustainability. The interconnected nature of decisions ensures that every player’s actions influence the overall health of the landscape.