April 2026
April 2026
This report presents and analyses the most recent economic and building datasets available as of April 2026.
&
RPM is at the forefront of the property industry, setting new standards in market intelligence, expertise, and creativity. With a proven track record spanning three decades, our unsurpassed market knowledge and data-driven insights have ensured our partners achieve excellent outcomes, and our clients, exceptional returns.
Our services include:
Project Sales & Marketing
Research Data & Insights
Land Transactions & Advisory
Respected development partner
Research partner of the UDIA
40,000+ lot yield on current projects
$10B+ land transactions
100+ team of property experts
55+ active projects across Queensland, New South Wales and Victoria
RPM’s Research, Data & Insights division provides in-depth analysis on current local and overseas economic and property market conditions. The team consists of economists, property experts, and GIS analysts that provide real-time market intelligence, and analytical and strategic advice.
Our knowledge and expertise are an invaluable resource for RPM’s developer clients, empowering them to make intelligent, informed, and strategic decisions when evaluating residential developments and investment opportunities.
Our data and analysis help clients maximise their marketing efforts and achieve sales targets on their estates. Each month we collect extensive data on approximately 350 estates in Victoria, 180 estates in Queensland and 180 in New South Wales, providing our clients with a comprehensive understanding of the market dynamics. This also underpins the core strategic decision-making of our own business.
We profile every lot including lot size, price, orientation, sqm rate and title status, monitoring through to final sale.
Volume of lots sold
Dollar per sqm rates
Stock release levels
Volume of stock returned to market
Your dedicated research team:

Michael Staedler General Manager Research, Data & Insights

Distribution of lots of a particular size
Distribution of price points
Activity levels by market, product & developer
Stock level fluctuations
Simon Brinkman Research Manager - QLD Research, Data & Insights

Australia’s appetite for homeownership has not softened. The current environment has shifted where and how people buy, not whether they intend to.
Population growth continues to outpace housing delivery across Queensland. In the capital, established property listings are at some of the lowest levels on record, which is continuing to drive pricing pressure and demand for new housing.
The state added 97,347 new residents in the year to September 2025, growing at 1.8% against a national average of 1.6% and taking Queensland’s population to 5.69 million. Overseas migration contributed 57,068 of those arrivals, interstate migration 19,092, and natural increase 21,187. Migration-led households are more likely to be entering the market for the first time. That cohort aligns with the house and land product that defines the greenfield sector.
Growth is concentrating in the outer corridors. Ripley added 3,131 residents (up 15%), Chambers Flat Logan Reserve 1,812 (up 12%), Greenbank North Maclean 1,576 (up 14%), Boronia Heights Park Ridge 1,430 (up 6%). These are among the fastest growing communities in the state, absorbing a disproportionate share of new household formations each year. The strong growth in these corridors also highlights the importance of prioritising infrastructure delivery in the greenfields.
The established market continues to tighten. In March 2026, supply tightened further to just 2,662 rental vacancies and 13,832 listings for sale against prior averages of 9,371 and 30,237 respectively. Both are near record lows. This shortfall is redirecting demand into the greenfield sector at a level above what population growth alone would generate.
Australia’s appetite for homeownership has not softened. Interest rates and affordability challenges have shifted where and how people buy, not whether they intend to.
The greenfield sector still offers a relative price advantage. A typical house and land package (based on the median land price and average build price) sits at around $1.01 million against an established median of $1.16 million, despite land values rising 26% annually to $503,200 and the average build price now also over half a million dollars. The margin is narrowing and will keep doing so but it continues to drive purchasing decisions.
Moreton Bay, Logan, and Ipswich now account for 71% of SEQ land sales. Ripley Valley, Waraba, Flagstone, and Yarrabilba PDAs are carrying the weight of demand and will remain central to how the region accommodates its next phase of growth.

Queensland & New South
rate rise of 2026, driven by renewed inflationary pressures.

Daniel Gradwell Associate Director of Property ANZ
First home buyers are more active than they have been. The 5% deposit scheme is supporting that pretty directly, and the numbers are striking.
How do you see the current geopolitical uncertainty impacting the property market?
There are probably three ways it has an impact; some direct, some longer term. The first is upward pressure on inflation through rising petrol prices, which puts the RBA in a challenging position on monetary policy. Australia already had elevated inflation before recent global events, and this doesn’t help. It makes further rate hikes increasingly likely, and we’ve already seen that even the expectation of higher rates is enough to see markets like Sydney and Melbourne roll over a bit.
The second is the hit to general confidence.
The ANZ Roy Morgan Consumer Confidence is bouncing around the lowest levels in roughly 50 years. People are clearly sensitive to petrol prices, and when you couple that with higher interest rates, it gives people reason to pause, whether that’s delaying a renovation, a purchase, or a move. That’s not good news for property at the margin.
The third is what it means for construction costs. It’s essentially impossible to put specific numbers around it, but it’s clearly not good news. Construction costs have been a real challenge for years already, and this only makes that story more challenging, particularly for SEQ, where costs were already running higher than most of the rest of the country.
What are ANZ’s current house price forecasts across the capital cities?
Brisbane and Gold Coast combined have seen double-digit growth for three consecutive years. The headline for this year is that we expect that to slow, but slowing still means around 9% for 2026. That’s still massive out performance against the rest of the country. It reflects that the fundamentals remain strong, but prices simply can’t keep growing exponentially.
Brisbane, Gold Coast and Perth will continue to see the strongest growth nationally. The contrast is Sydney and Melbourne, where we expect prices to drop around 2 or 3%. Not a significant drop, but some downward pressure. Melbourne prices actually started softening before interest rates rose, when commentary shifted away from rate cuts toward hikes. They’ve essentially gone back to around September 2025 levels. Not dramatic, but a clear contrast to what’s still happening in SEQ and Perth.
With SEQ median land prices now exceeding $500,000, how are lenders assessing risk in Greenfield projects where price points are pushing affordability limits?
The key metric we look at is the share of income needed to service the average mortgage, and across SEQ that still looks okay; which reflects that even with extraordinary price growth, the starting point was very affordable. That’s a meaningful distinction from somewhere like Adelaide, where affordability (in terms of share of income needed to service a loan) has deteriorated sharply, and we have a lot more concern.
For individual projects, we look at who the end purchasers are and whether affordability constraints will create headwinds at settlement. We also look at the track record of the developer and builder. Have they delivered this type of product before? Do they have access to the trades they need? We lean heavily into those non-financial factors in this environment.
Are you seeing increased participation from first home buyers in the Greenfield market, given current incentives?
Yes, first home buyers are more active than they’ve been. The 5% deposit scheme is supporting that pretty directly, and the numbers are striking. Over the six months the scheme has been operating, the lower quartile of the Brisbane and Gold Coast housing market is up around 14%, compared to roughly 8% for the top quartile. That gap speaks directly to where first home buyers are operating, making sure they stay under the price cap.
The pattern keeps repeating though. It’s great for first home buyers who take advantage of it at that point in time, but it adds more fuel to the fire and makes it harder for the next wave coming through in three to five years. It’s a demand-side policy without a supply-side solution attached to it.
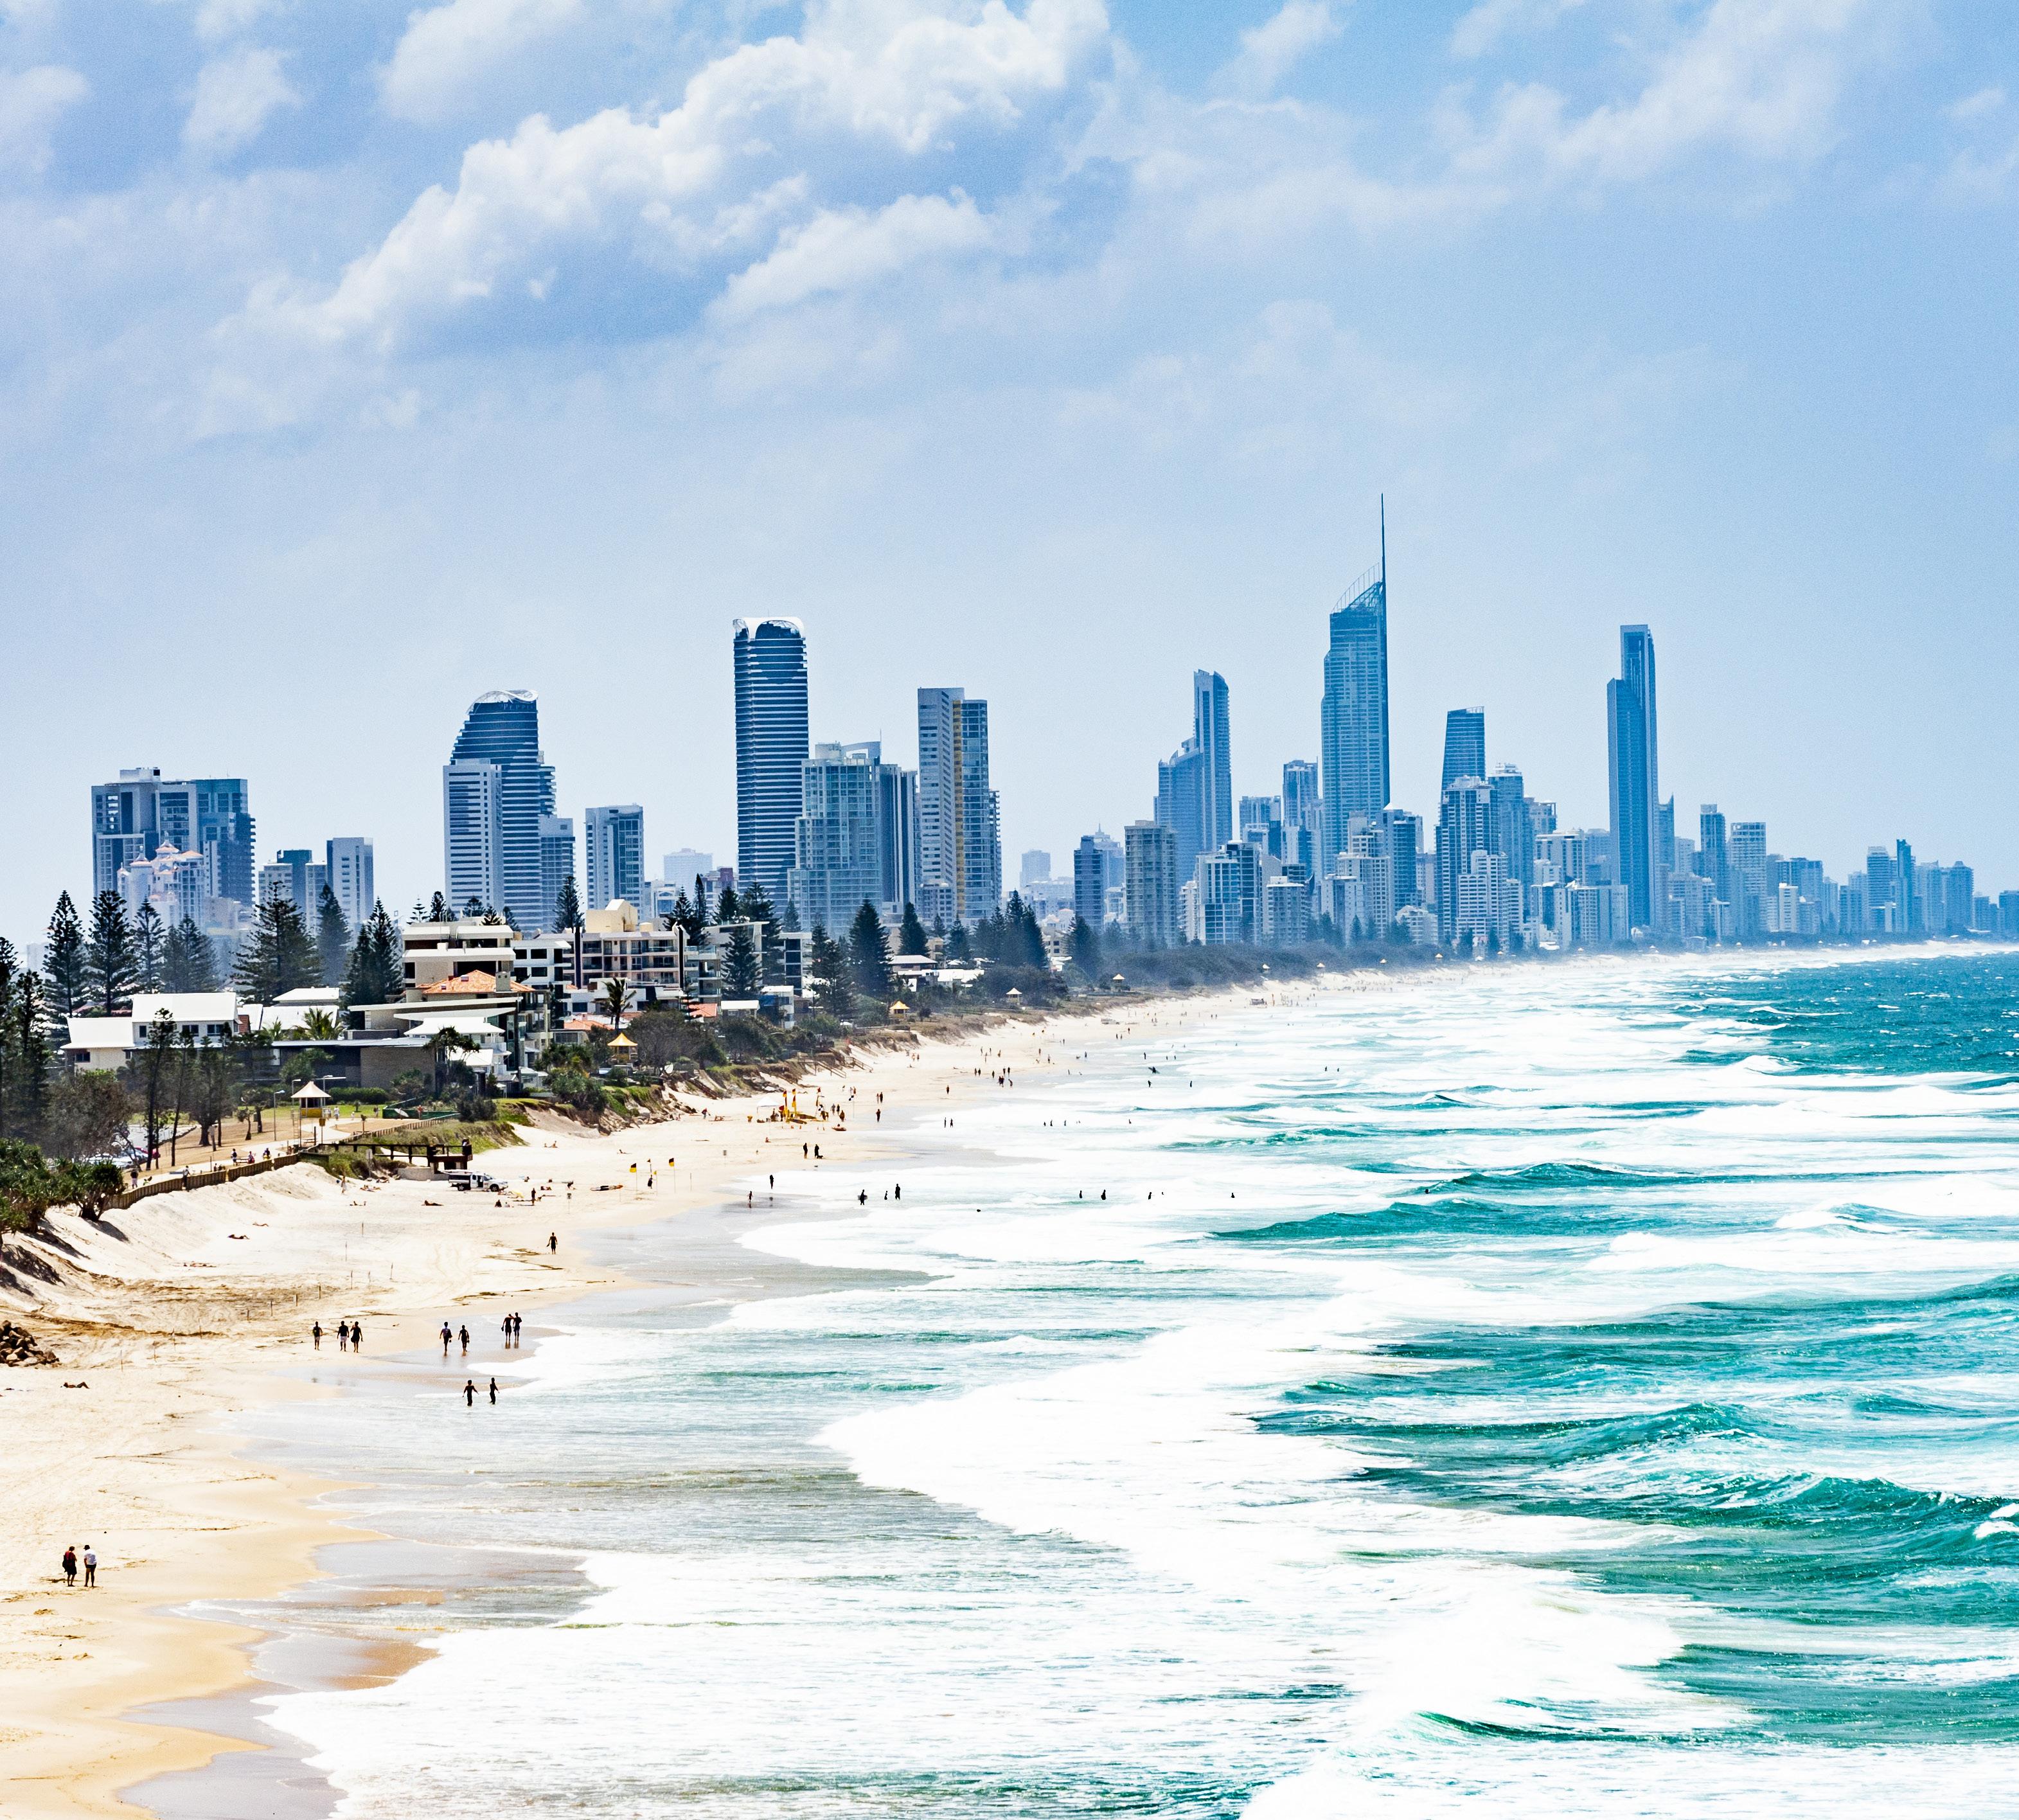
Population Change - Year to Sep 2025 +97,347 (+1.8%)
Queensland’s population continues to grow well above the national average, driven primarily by overseas migration.
In the year to September 2025, the state added 97,347 new residents, an annual increase of 1.8%, compared to the national average of 1.6%. bringing the total population to 5.69 million.
Net overseas migration was the key driver, contributing 57,068 new residents, while net interstate migration contributed a further 19,092 people. Natural increase accounted for the remaining 21,187 people.
The majority of Greater Brisbane’s population growth is occurring in greenfield corridors, reinforcing its importance as the primary housing solution for the region’s expanding population.
The fastest growing areas over the past year are almost exclusively located in outer growth corridors.
Ripley led with 3,131 new residents (up 15%), followed by Chambers Flat–Logan Reserve (+1,812, up 12%), Greenbank–North Maclean (+1,576, up 14%), and Boronia Heights–Park Ridge (+1,430, up 6%).
These areas are absorbing the bulk of Queensland’s new household formation, driven by a higher rate of delivery and typically larger household sizes. The strong growth in these corridors highlights the importance of prioritising infrastructure delivery in the greenfields.
Annual population growth was significantly higher in greenfield outer suburbs in FY25, compared to FY17 when growth was concentrated in inner-city regions.
Population Growth 2016-2017 Population Growth 2024-2025
Purchase Price Capacity - $120,000 Household income
Aug 2025 to Mar 2026
-$37,000 (-5%)
March brought the second interest rate rise this year, lifting the cash rate to 4.1% and the Standard Variable Rate (SVR) up to 6%, matching levels last seen in February 2025.
Buyers enjoyed some reprieve through 2025 as multiple cuts took effect, but elevated inflation exacerbated by the Middle East conflict point to further rises through 2026.
The two increases this year have cut borrowing capacity by around -$37,000 (-5%), for the average household earning $120,000.
Greater Brisbane’s housing market continues to show strong growth. Median house prices reached $1.16 million in Q1 2026, up 16.2% annually, though prices eased 1.6% over the quarter.
Demand for detached houses remain strong, supported by limited established stock on market and strong population growth.
Units also saw significant price growth over the year with median prices reaching $840,500; an annual gain of 20.1%. This reflects a shift among both buyers and investors toward medium density products as affordability becomes more stretched.
Land values recorded the fastest growth of the three segments, reaching $503,200 in Q1 2026, up 26% over the year. Sustained undersupply across the region continues to drive land price growth, reinforced by the strength of the established market.
Source: Pricefinder, RPM Research, Data & Insights and Terralytics
SEQ’s greenfield market continues to offer strong relative value against established housing, despite rising land and construction costs.
Since March 2022, Greater Brisbane’s median land price has increased 86% to $503,200, and build costs have risen 37% to $507,374, This takes a typical house and land package to around $1.01 million. Despite the rapid growth, this package price is still below the established median house price of $1.16 million.
This pricing gap remains a key demand driver for the land market. Buyers still see greenfield housing as a more affordable pathway to homeownership and for a newer home.
Tight conditions in the established market continue to drive demand for the greenfield sector. Rental vacancies and sale listings continue to hover around their lowest levels on record, increasing competition for buyers and driving price growth.
In the rental market, vacancies have fallen from an average of 9,371 between 2016-2020 to 3,575 in 2021-2026, while average sale listings have declined from 30,237 to 18,232. In March 2026, supply tightened further to just 2,662 rental vacancies and 13,832 listings for sale.
Greater Brisbane Rental Vacancies and Sale Listings
Rental Vacancies Properties For Sale
Buyer activity across SEQ has shifted significantly over the past decade, as affordability constraints and land supply have reshaped the market.
Moreton Bay, Logan, and Ipswich accounted for 71% of all SEQ land sales, driven by the relative affordability and stronger supply across PDAs including Waraba, Ripley Valley, Flagstone and Yarrabilba.
At the other end, Gold Coast, Brisbane Council, and Sunshine Coast are losing share as land availability tightens and prices move beyond reach for many buyers. The Gold Coast accounted for 20% of sales in 2016 and just 4% in the past year.
Source: RPM
SEQ’s rapid land price growth has shifted its relative value compared to Melbourne and Sydney.
Taking a 375sqm as a benchmark, SEQ’s median price now sits at $492K, the same price Sydney commanded in March 2021. This shows that despite the rapid growth, there is still relative value compared to Sydney’s current median of $757K.
Melbourne’s median price, of $393K, now sits where SEQ was in June 2025, making it the most affordable capital city land market on the east coast.
SEQ land sales recovered more quickly than other states post-pandemic, but have been recently been restricted by a lack of land supply rather than demand.
Key greenfield regions are now breaking below the 400sqm mark in light of recent price increases.
Significant growth has been seen across all major SEQ greenfield markets in the last year, with all medians now surpassing $400,000.
$1,200,000
$1,000,000
$800,000
$600,000
$400,000
$200,000
SEQ’s median square metre rate grew 30% over the last 12 months.

James Matley Sales Director Transactions & Advisory james@rpmgrp.com.au
Different sites require different processes, different timelines, and different conditions of sale.
The capital pool transacting on SEQ greenfield sites today is materially different to what it was 18 months ago. Understanding who is bidding has become as important as understanding what a site is worth.
Across RPM’s on and off market campaigns over the past 12 months, five distinct buyer cohorts are appearing at the table, each with different underwriting logic, capital horizons, and preferred deal structures.
Private capital syndicates have been the standout cohort. Typically, experienced operators backed by high net worth, family office, or private equity capital, they have been responsible for a disproportionate share of sites transacted over the past 12-18 months. Their edge is threefold:
they move faster than institutions through diligence, they accept complexity that larger groups will not underwrite, and their revenue assumptions reflect genuine conviction in the SEQ supply demand thesis. On several recent RPM campaigns they have outbid larger, better resourced groups on sites in the 200 to 500+ lot bracket through cleaner terms, shorter conditions, and surety of execution. Campaigns that fail to engage this cohort directly are leaving value on the table.
Listed and institutional developers remain the most disciplined end of the market, underwriting to published hurdle rates and typically requiring scale of at least 500 lots to justify diligence spend. They are most active in the established Logan, Ipswich, and Moreton Bay corridors where production efficiency can be leveraged across multiple stages. Slower to commit, but rarely re-trading once they do.
Family offices and longer dated private capital have become a meaningful presence on englobo and land uplift opportunities. Their ability to hold for extended periods allows them to underwrite sites that time constrained cohorts cannot, particularly in PDAs with longer term horizons but clear underlying value.
Over the past six months there has been a notable expansion in Australian family office mandates targeting SEQ residential land, driven by the view that the structural supply shortage is unlikely to resolve inside their investment horizon.
Offshore capital has accelerated. While most cross border volume still targets commercial assets, the flow through into residential via joint ventures with established local operators is real and growing. Singaporean and Japanese groups are leading enquiries, and Queensland is capturing a growing share of national offshore activity.
Mid tier local private developers remain the backbone of the SEQ market but are more selective than they were. Many have spent the past 12-18 months working through legacy stock and are now re entering acquisitions. They continue to dominate the DA, value add, and land uplift tier, where planning expertise, contractor relationships, and local landowner awareness create value that larger or less locally experienced cohorts cannot easily replicate.
The practical takeaway is that a one size fits all process is leaving value on the table. The strongest outcomes come from campaigns calibrated to the buyer cohorts most likely to transact on that specific site. Different sites require different processes, different timelines, and different conditions of sale.
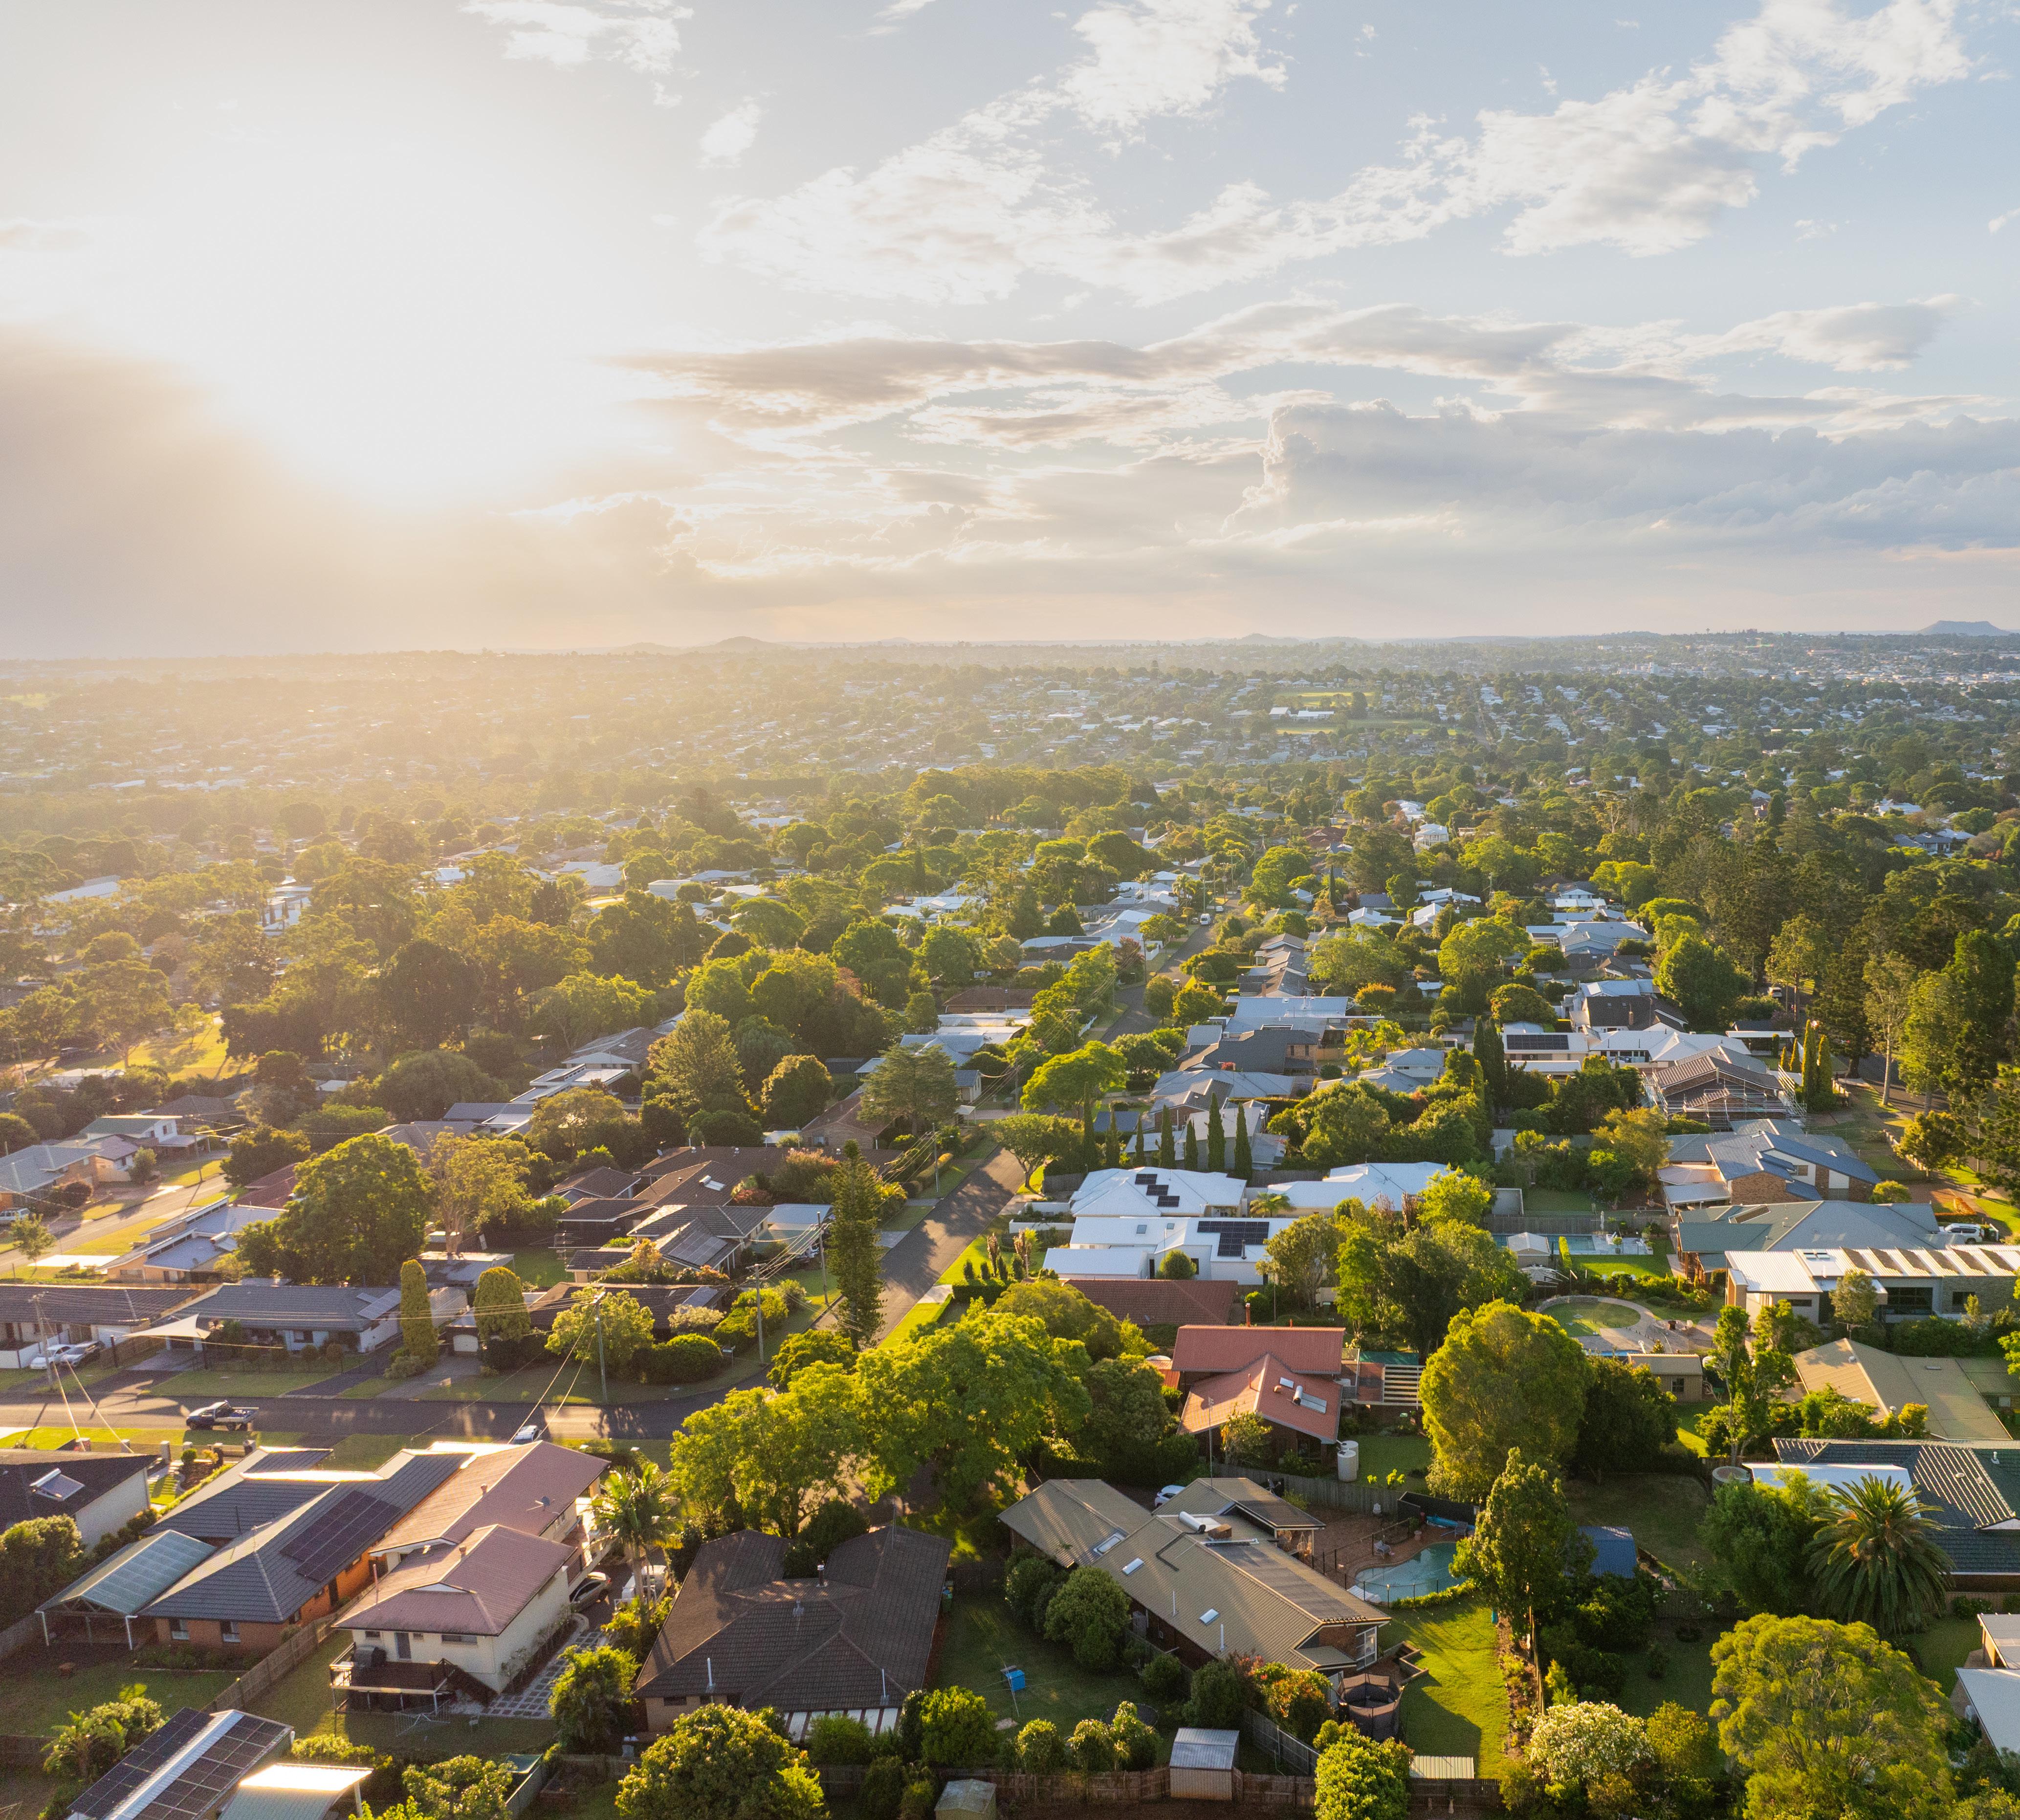
Across SEQ’s greenfield market, demand remains well supported but the interest rate environment and cost of living challenges are starting to cut into what buyers can afford.
Two rate rises in 2026 have lifted the cash rate to 4.1% and the standard variable rate to 6%, reversing much of the borrowing capacity regained through 2025. For a household on a $120,000 income, that is roughly $37,000 less than at the start of the year. We are now seeing buyers shifting to smaller lots, pushing further out, or taking longer to commit. Inflation risks tied to global conflicts suggest rates are more likely to move up than down in the near term.
However, the underlying drivers remain. Population growth continues to run above the national average, with migration-led demand feeding directly into the greenfield buyer pool. First home buyer schemes are providing a partial buffer at the entry point, keeping the cohort active. The established market remains constrained, with rental vacancies and listings well below long term norms. This combination will keep greenfield demand from retreating in any meaningful way.
For interstate buyers and investors, SEQ retains a compelling relative value position against Sydney.
Looking ahead, there remains a few challenges. Construction costs are not expected to drop, keeping feasibility tight and limiting the volume of new supply that can be brought to market. And as borrowing capacity remains compressed, projects that priced aggressively through the stronger part of the cycle may face some relative softening demand and extended sale periods while the market adjusts.
The outer greenfield corridors, where affordability and growth intersect most directly remain best positioned through the remainder of the year and 2027. Project performance will be determined by factors including pricing alignment to current borrowing capacity and depth of local demand.
For more information, please visit: www.rpmgrp.com.au
Project Sales & Marketing
Peter Neale
Managing Director
Queensland & New South Wales petern@rpmgrp.com.au
Research, Data & Insights

Michael Staedler
General Manager
Research, Data & Insights m.staedler@rpmgrp.com.au
Transactions & Advisory

James Matley
Sales Director Queensland
Transactions & Advisory james@rpmgrp.com.au

Clinton Trezise
Managing Director
Queensland & New South Wales clinton@rpmgrp.com.au

Jasmin McDougall
Project Marketing Manager
Queensland & New South Wales jasmin@rpmgrp.com.au

Natalia Martinez
Project Marketing Coordinator
Queensland & New South Wales natalia@rpmgrp.com.au

Andrew Raponi
Senior Research Manager
Research, Data & Insights a.raponi@rpmgrp.com.au
Simon Brinkman
Research Manager
Queensland & New South Wales simon@rpmgrp.com.au

Megha Saha
Research Analyst
Queensland & New South Wales megha@rpmgrp.com.au

Tim Hyland
National Strategy Manager
Transactions & Advisory tim@rpmgrp.com.au

Phillip Nguyen
Transactions Associate
Transactions & Advisory phil@rpmgrp.com.au

Edward Rostron
Transactions Associate
Transactions & Advisory edwardr@rpmgrp.com.au
For detailed insights or custom reporting, contact the team at: contactus@rpmgrp.com.au