National Economic Report
This report presents and analyses the most recent economic and building datasets available as of 8th April 2026.
Economic Update and Insights 07

This report provides a comprehensive assessment of Australia’s economic and property market conditions at a national level, using a structured set of leading indicators that collectively capture the direction of growth, inflation, household behaviour, labour market performance, credit conditions and residential supply. Rather than relying on any single metric, the analysis brings together a broad dataset spanning macroeconomic activity, monetary policy, consumer behaviour, lending dynamics and housing delivery. This approach allows for a more complete understanding of how the economy is functioning in real time, and more importantly, where it is likely to move next.
The indicators have been structured to tell a clear, sequential story:
• Economic foundation (GDP, CPI, wages) - sets the macro backdrop.
• Policy transmission (cash rate, mortgage rates)
- impacts borrowing capacity.
• Household response (spending, savings)
- drives demand.
• Labour market conditions - underpins income and confidence.
• Population growth - determines underlying housing demand.
• Credit flows - measures active market participation.
• Supply pipeline - determines the market’s ability to respond.
Together, these components provide a forwardlooking view of the Australian economy and residential market, highlighting not just where conditions stand today, but where imbalances, risks and opportunities are emerging.
Importantly, while this report is national in scope, it also considers variations across states and territories. Differences in economic performance, population growth, housing supply and affordability continue to drive divergent market conditions, reinforcing that national trends often mask meaningful regional dynamics.
The purpose of this report is to translate these indicators into clear, actionable insights for market participants. By analysing how each component interacts with the others, the report provides a grounded view on:
• The sustainability of current economic growth
• The trajectory of interest rates and inflation
• The strength and composition of housing demand
• The capacity of the development pipeline to respond
• The key risks and opportunities emerging into 2026
Ultimately, this report is designed to move beyond data description and instead provide a joined-up view of the market, helping inform decision-making across development, investment and policy.
For more information, please visit: www.rpmgrp.com.au
Our Research Consultancy Services create bespoke reports crafted to your specifications, translating rich data into in-depth analysis. For a bespoke report, email the team at: contactus@rpmgrp.com.au
Disclaimer: As of publication, the economic outlook continues to evolve rapidly. Although reasonable care has been taken in the preparation of this information, RPM Real Estate Group Pty Ltd take no responsibility for the accuracy of the information contained herein. It is recommended that all the information be verified if it is to be used for commercial purposes.

Michael Staedler General Manager Research, Data & Insights m.staedler@rpmgrp.com.au
Australia’s economy and housing market experienced a period of stabilisation and modest recovery through 2025, supported by population growth, resilient labour market conditions and a strong rebound in lending activity.
However, this recovery is now losing momentum, with conditions shifting as inflationary pressures begin to re-emerge. Global supply disruptions and escalating geopolitical tensions are placing renewed upward pressure on energy, materials and construction costs, creating a more uncertain environment as we move through 2026.
While inflation had shown early signs of easing, the outlook has become more complex. The risk of persistently higher inflation is increasing, which may keep interest rates elevated for longer along with leading to further tightening. This continues to constrain borrowing capacity and weigh on household demand.
The residential market remains highly fragmented. Perth, Brisbane and Adelaide continue to outperform, while Sydney and Melbourne have stabilised under affordability constraints. Land values are showing the strongest growth, reinforcing ongoing supply-side limitations.
Lending activity has improved materially, with both owner-occupiers and investors returning to the market. However, demand remains defensive, concentrated in established housing and more affordable product.
Supply-side conditions improved through 2025, with approvals and commencements lifting, particularly across medium-density housing. Despite this, delivery remains constrained, with completions largely flat and detached housing.
• Momentum expected to slow after improvement through 2025.
• Inflation likely to rise again, driven by global supply disruptions, with interest rates likely to remain higher for longer.
• Housing demand remains resilient but affordability-constrained.
• Continued shift toward established housing and smaller product.
• Supply recovery is uncertain and fragile.
• Construction costs and feasibility remain key constraints.
• Higher-density delivery carries the greatest risk.
• A portion of forecast supply is unlikely to materialise.
• Completions to remain constrained, particularly for detached housing.
• Supply-demand imbalance likely to persist into 2026.
• Global uncertainty (war, supply chains, costs) is the key downside risk.
• Risks are skewed to slower activity rather than acceleration.
Economic conditions improved through much of 2025, however, momentum is now becoming more uneven as inflationary pressures begin to re-emerge, driven by renewed supply-side constraints and escalating global uncertainty.
While headline inflation had shown signs of easing, recent trends suggest this may be short-lived, with risks skewed to the upside. Ongoing geopolitical tensions and supply chain disruptions are beginning to place upward pressure on key inputs such as energy, materials and transport, which is expected to flow through to both construction costs and broader consumer prices.
Interest rates remain restrictive, with the potential for further tightening if inflation proves more persistent. This continues to constrain borrowing capacity and weigh on household demand.
Households remain under pressure:
• Real wages are only marginally improving.
• Consumer sentiment remains below neutral.
• Spending is increasingly concentrated in essential categories.
• Discretionary consumption remains subdued.
The labour market is showing early signs of softening, with unemployment edging higher and employment growth becoming more volatile. While still resilient, the trend points to gradual cooling rather than continued strength.
Population growth continues to support underlying housing demand, although it is moderating from recent peaks and becoming more reliant on overseas migration.
Housing conditions improved through 2025 but are now stabilising:
• Growth led by Perth, Brisbane and Adelaide.
• Sydney and Melbourne under performed.
• Land outperforming, reflecting supply constraints.
Lending has rebounded, though demand remains defensive:
• Broad growth across owner-occupiers and investors.
• Investor lending accelerating.
• Demand skewed to established housing (~73%).
• Shift toward affordability-driven product.
Supply has improved but remains constrained:
• Approvals and commencements lifted.
• Townhomes driving growth.
• Higher-density remains volatile and feasibility challenged.
Cost pressures are rising again, driven by:
• Global supply disruptions.
• Material cost escalation.
• Labour shortages. Completions reinforce the imbalance:
• Flat year-on-year.
• Detached housing declining.
• Uplift limited to higher-density projects.
Overall, momentum is softening, with rising inflation and global uncertainty likely to slow activity and reinforce supply constraints into 2026.
This section outlines Australia’s current macroeconomic environment, focusing on growth, inflation, interest rates and labour market conditions. It also considers external influences, including geopolitical tensions and cost pressures, to frame the outlook for economic activity heading into 2026.
• Quarterly growth strengthened to 0.79% in Q4 2025.
• Rolling annual growth improved to 1.97%, up from 1.00% a year earlier.
• Growth is being supported by population and labour market resilience, despite ongoing cost and rate pressures.
• Momentum is building, but still below long-term averages.
• Economic conditions remain constrained, with policy settings continuing to weigh on growth.
• State economic growth remains subdued and uneven across Australia.
• In 2024/25, all states recorded modest growth, generally between 1.0% and 2.2%, reflecting a broad slowdown from the stronger post-COVID rebound period.
• QLD is outperforming (+2.23%), supported by strong population growth and investment.
• VIC and NSW are lagging, reflecting softer economic conditions across the south-east.
• WA remains stable, underpinned by its resource-driven economy.
• Economic activity is concentrated, with NSW (31%) and VIC (23%) accounting for over half of national output.
• State divergence is widening, driven by differences in population growth, industry mix and housing conditions.
• Domestic demand remains positive across all states, with growth recorded in Q4 2025.
• Momentum has eased from the previous quarter, indicating a broader slowdown.
• SA led growth (+1.21%), while QLD lagged (+0.10%).
• VIC and NSW remain steady, broadly in line with recent trends.
• WA is tracking below its recent average, reflecting softer conditions.
• Overall, demand is slowing but remains resilient under higher rates and cost pressures.
• The cash rate has increased to 4.10% (Mar-26), reversing earlier easing and reinforcing a tightening bias.
• Recent movements suggest further rate increases remain a near-term risk, particularly with persistent inflation and external pressures.
• Variable rates have lifted back to ~6.55%, maintaining pressure on household cash flow.
• Fixed rates have edged higher again, now sitting between roughly 5.7% and 6.5%, signalling expectations of sustained higher rates.
• Borrowing capacity remains constrained, limiting housing demand and market activity.
• Overall, policy settings remain firmly restrictive, with continued pressure on both households and the broader economy.
Source: Australian Bureau of Statistics, RPM Research, Data & Insights
• Annual inflation eased slightly to 3.7% (Feb-26), down from ~3.8% late 2025.
• Monthly momentum has softened, with CPI flat (0.0%) in February 2026 following modest gains in January.
• Inflation remains above target, indicating persistent underlying price pressures.
• Perth (4.9%) and Brisbane (3.7%) are leading inflation, while Melbourne (3.3%) remains relatively lower.
• Volatility remains evident across the past 12 months.
• External pressures, including energy and fuel costs, continue to pose upside risk.
Source:
• Wage growth remains solid at 3.44% annually, but still slightly below inflation (3.63%).
• Quarterly wage growth slowed to 0.69% in Q4, down from 1.34% in Q3, signalling easing momentum.
• Real wages remain marginally negative, with limited improvement in purchasing power. Perth continues to lead wage growth (4.11%), while Brisbane records the highest inflation (5.07%).
• Inflation remains uneven across cities, reinforcing differing cost-of-living pressures.
• Overall, income growth is stabilising, but households remain under pressure.
• National new dwelling prices rose 3.75% annually, with modest monthly growth of 0.15%.
• Price growth remains positive, reflecting ongoing cost pressures across construction.
• Perth (6.10%) and Hobart (9.20%) are leading growth, indicating stronger supply constraints.
• Melbourne recorded a slight monthly decline (-0.10%), suggesting softer conditions.
• Most markets are recording steady, moderate growth, rather than sharp increases.
• Overall, new dwelling prices continue to rise, reinforcing ongoing cost challenges for delivery and affordability.
Source: Australian Bureau of Statistics, RPM Research, Data & Insights
• National rents increased 3.77% annually, with monthly growth of 0.37%.
• Rental growth remains elevated, reflecting ongoing supply constraints.
• Perth (5.80%) and Brisbane (4.90%) are leading growth, driven by strong demand.
• Darwin also recorded strong monthly growth (0.90%), highlighting continued volatility.
• Sydney and Melbourne remain more moderate (3.10%), indicating stabilisation in larger markets.
• Overall, rental markets remain tight, continuing to place pressure on household budgets.
Source: Australian Bureau of Statistics, RPM Research, Data & Insights
• Spending growth remains modest overall (+0.43%), indicating a still-constrained consumer environment.
• Discretionary categories are leading growth, particularly:
• Furnishings & household equipment (+2.15%)
• Hospitality (cafés, restaurants) (+1.39%)
• Clothing & footwear (+1.32%)
• Services-related spending remains resilient, with health and transport services continuing to expand.
• Essential spending is subdued (+0.28%), reflecting ongoing cost-of-living pressure on households.
• Housing-related costs remain stable but not accelerating (rent +0.40%).
• Sharp declines in utilities and tobacco (electricity/gas -9.45%, tobacco -11.33%) highlight volatility and potential price-driven adjustments.
• Large-ticket discretionary items are weakening, with vehicle purchases down materially (-4.58%).
Rent & Other Dwelling Services
Operation of Vehicles Essential Consumption
Discretionary Consumption Communications
Purchase of Vehicles
Electricity, Gas & Other Fuel
Cigarettes & Tobacco
Source: Australian Bureau of Statistics, RPM Research, Data & Insights
• Growth remains subdued across both categories, with Q4 2025 showing modest increases:
• Essential spending is more stable, tracking close to its long-term average (0.49%), reflecting non-negotiable household costs.
• Discretionary spending remains weaker and more volatile, with growth below historical norms (3-year avg: 0.31%).
• Post-COVID volatility has normalised, with both categories reverting to low, steady growth patterns.
• Households remain cautious, with limited upside in discretionary spending despite some recent improvement.
Essential - Dec 2025
+0.2% Discretionary - Dec 2025
+0.4%
Source: Australian Bureau of Statistics, RPM Research, Data & Insights
• Household spending declined -6.4% in February, following the sharp -11.3% fall in January, confirming a continued contraction in early 2026.
• While the pace of decline moderated from January, the persistence of negative monthly outcomes signals a clear loss of momentum. However, annual growth remains positive at +4.6%, indicating that consumption is slowing rather than collapsing.
• The February result highlights broad-based weakness across all states:
• NSW (-6.8%), QLD (-6.7%), SA (-6.6%), ACT (-6.6%).
• VIC (-6.2%) and WA (-5.9%) recorded relatively smaller declines.
• Goods spending remains the primary driver of weakness, declining -8.4% in February, following the significant -19.6% fall in January.
• The step-down from January suggests the initial post-Christmas correction has passed, however demand remains soft. Annual growth of +3.0% reflects ongoing normalisation in goods consumption.
• Services spending showed increased weakness in February, declining -4.3%, compared to a relatively stable -0.3% in January.
• Despite the monthly decline, annual growth remains strong at +6.3%, reinforcing that services continue to underpin overall consumption.
Source: Australian Bureau of Statistics, RPM Research, Data & Insights
• Discretionary spending remains under the most pressure, declining -8.7% in February, following -13.6% in January.
• While the rate of decline eased from January, discretionary spending continues to be highly sensitive to cost-of-living pressures. Annual growth remains positive at +4.6%, though momentum is clearly deteriorating.
• Non-discretionary spending declined more moderately in February, falling -2.1%, improving from -6.8% in January.
• The moderation in February reinforces the relative stability of essential spending. Annual growth remains steady at +4.6%, continuing to underpin overall consumption.
Source: Australian Bureau of Statistics, RPM Research,
• Savings ratio increased to 6.9% in Dec-25, continuing the recovery from cycle lows in 2023.
• Now above the pre-COVID average (5.5%), indicating a rebuild in household buffers.
• Follows a sharp decline through 2022–2023 (low ~1.9%), when cost-of-living pressures peaked.
• Stabilisation evident through 2024, with savings returning to more normalised levels.
• Recent uplift in 2025 suggests cautious consumer behaviour, with households prioritising savings.
• Remains well below COVID-era peaks (20%+), highlighting a return to more typical conditions.
Source: Australian Bureau of Statistics, RPM Research,
• Sentiment remains below neutral (100) at 91.6 in Mar-26, indicating continued consumer pessimism.
• Improved from recent lows, but still well below long-term averages.
• Volatility evident through 2025, with a spike in Nov-25 (103.8) followed by a sharp pullback.
• Recent months show softening momentum, with declines in Jan–Feb before a modest rebound in March.
• Reflects ongoing cost-of-living pressures and interest rate sensitivity.
• Material decline from 2021 peaks (110–120 range) highlights shift in household confidence.
Source: Westpac-Melbourne Institute Consumer Sentiment Index
• Business confidence remains modestly positive at 3.3 in Feb-26, but well below long-term averages.
• Significant decline from 2021–2022 peaks (20+), reflecting tighter economic conditions.
• Volatility persists through 2024–2025, with confidence moving in and out of neutral territory.
• Recent momentum has softened, with a pullback from late-2025 highs (Dec-25: 6.7).
• Periods of negative sentiment in 2024–2025 highlight uncertainty across businesses.
• Indicates cautious business outlook, particularly in response to interest rates and cost pressures.
Source: National Australia
• Unemployment remains relatively low but volatile, sitting at 4.7% in Feb-26, up from 4.2% in Jan-26.
• Gradual softening trend through 2024–2025, with unemployment moving from around 3.5–3.7% to the mid-4% range.
• Employment growth remains uneven, with large swings between full-time and part-time roles.
• Recent data shows mixed signals, with strong full-time gains in Jan-26 (+37k) offset by declines in Feb-26 (-19.8k).
• Shift toward part-time employment persists, reflecting softer labour demand and business caution.
• Despite volatility, the labour market remains resilient by historical standards.
Source: Australian Bureau of Statistics, RPM
• National unemployment increased to 4.3%, slightly above the 12-month average (4.2%).
• National employment growth remains positive (+0.33% m/m; +1.83% y/y).
• Annual growth strongest in SA (+3.23%) and VIC (+2.21%).
• National participation stable at 66.8%, broadly in line with the 12-month average.
• Overall, labour supply remains stable, despite softer employment conditions.
• Population growth remains elevated but moderating, with 2025 tracking around 110,000–140,000, down from the 2023 peak (170,000–190,000).
• Net overseas migration (NOM) remains the key driver, contributing 70–80% of growth (Sep-25: 87,821).
• Natural increase continues to soften, now typically 23,000–34,000 per quarter.
• Growth through 2024–2025 reflects normalisation from peak levels, but remains above pre-COVID averages.
Source: Australian Bureau of Statistics, RPM Research, Data &
• National growth remains solid (+111,090/+0.40% q/q; +1.55% y/y), reinforcing ongoing population expansion.
• WA (+0.57% q/q) is the standout growth state, followed by VIC (+0.43%) and QLD (+0.40%).
• Overseas migration remains the dominant growth driver (87,821 nationally).
• Strong quarterly rebound (+75.1%), led by NSW (+13,351) and VIC (+11,063).
• Natural increase continues to soften nationally (-27.4% q/q).
• Declines evident across most states, particularly VIC (-40.1%) and SA (-74.9%).
•
•
• National population growth remains steady (1.2% p.a.), reaching 28.6 million by 2027–28.
• Growth profile reflects a moderation from recent migration-driven peaks, but remains above long-term averages.
• Population growth remains migration-led, with net overseas migration (225k–262k p.a.) consistently accounting for the majority of growth.
• Natural increase is materially lower (100k–115k p.a.), contributing roughly one-third of total growth.
• Net overseas migration declines from 262k to roughly 226k, signalling a controlled slowdown rather than a sharp correction.
• Despite easing, migration remains structurally elevated vs pre-COVID levels.
• Continues to be the key lever driving housing demand and population growth.
• WA (1.6% p.a.) is the fastest growing state, underpinned by migration and economic momentum.
• VIC and QLD (both 1.4% p.a.) remain key growth engines, driving both volume and rate of growth.
• ACT (1.3% p.a.) continues to perform strongly on a smaller base.
• NSW (1.0% p.a.) shows stable but slower growth, reflecting net interstate outflows.
• NT (1.0% p.a.) also sits in this bracket, though with more volatility.
• NSW and VIC remain the largest contributors in absolute terms, adding the most population despite slower growth rates.
• QLD and WA continue to gain share, reflecting interstate migration and affordability-driven demand shifts.
This section outlines Australia’s residential market and lending environment, focusing on dwelling price movements, borrowing activity, and buyer composition. It also considers supply-side dynamics, including approvals, commencements and completions, to frame the outlook for housing demand and delivery heading into 2026.
• Total housing finance commitments increased 11% q/q and 14% y/y, reaching 158,121 loans.
• NSW (+19% y/y) and VIC (+18% y/y) drove the strongest growth among major states.
• TAS (+27% y/y) and NT (+13% y/y) recorded strong increases from smaller bases.
• Total volumes remain well above the 3-year average (128,597), reinforcing the recovery in lending activity.
• On a market share basis, NSW and VIC each account for 28%, followed by QLD (22%) and WA (11%).
• These four states represent around 89% of national lending activity, underscoring their dominance in housing demand.
Source: Australian Bureau of Statistics, RPM Research, Data & Insights
• First home buyer lending increased 16% q/q and 10% y/y, reaching 34,013 loans nationally in Dec-25.
• NSW (+22% q/q; +20% y/y) recorded the strongest growth among major states, with ACT (+27% y/y) and TAS (+18% y/y) also rising strongly off smaller bases.
• Volumes remain above the 3-year average (28,973), indicating improving entry-level demand.
• In terms of market share, VIC dominates (33%), followed by NSW (25%) and QLD (19%), with WA (12%) the next largest contributor.
• The FHB segment remains highly concentrated across VIC, NSW and QLD (~77%).
Source: Australian Bureau of Statistics, RPM Research, Data & Insights
• Non-first home buyer lending rose 10% q/q and 6% y/y, to 60,760 loans in Dec-25.
• Growth was led by NSW and VIC (+12% q/q), with ACT also increasing (+13% q/q).
• SA (-1% y/y) was the only state to record an annual decline.
• Volumes remain above the 3-year average (51,954), reflecting stable upgrader demand.
• From a market share perspective, VIC (28%) and NSW (27%) lead nationally, followed by QLD (22%).
• This distribution broadly reflects population scale and established housing depth.
Source: Australian Bureau of Statistics, RPM Research, Data & Insights
• Investor lending increased 8% q/q and 24% y/y, reaching 63,348 loans nationally.
• VIC (+38% y/y) and NSW (+28% y/y) drove the strongest annual growth among major states.
• TAS (+66% y/y) and NT (+20% y/y) recorded strong gains off smaller bases.
• Investor volumes are well above the 3-year average (47,670), confirming a clear reacceleration.
• In terms of market share, NSW leads (31%), followed by VIC (25%) and QLD (22%).
• WA (11%) sits slightly below its overall lending share, highlighting a more owner-occupier weighted market.
• Investor activity remains heavily concentrated in the eastern seaboard.
Source: Australian Bureau of Statistics, RPM Research, Data & Insights
Total Owner Occupier Lending:
• 109,468 loans nationally (+11.9% q/q; +8.4% y/y).
• Growth led by NSW (+14.9% q/q; +14.3% y/y) and VIC (+12.7% q/q).
• Largest markets: VIC (31,116), NSW (28,891) and QLD (23,983).
Owner-occupier lending has strengthened materially, with volumes now above the 3-year average (+4.6%), signalling a broad-based recovery in demand.
Overall, demand remains heavily skewed toward established housing, with emerging strength in land and renovation activity highlighting affordability-driven behaviour.
Established dwellings dominate (73% of lending), while:
• Construction and new builds remain below trend.
• Land and renovations are gaining momentum.
Construction of a Dwelling Newly Erected Dwelling Established Dwelling Residential Land Alteration & Additions Total Average Value
Source:
• Construction activity is rebounding, but remains below trend (-2.1% vs 3yr), indicating ongoing supply-side constraints.
• 9,750 loans nationally (+14.0% q/q; +8.5% y/y).
• VIC (2,666) and WA (2,229) remain the largest construction markets.
• New dwelling demand remains subdued (-3.1% vs 3yr), highlighting weakness in turnkey/ new build delivery.
• 5,205 loans nationally (+9.1% q/q; +2.9% y/y).
• Growth led by WA (+31.2% q/q; +23.0% y/y) and VIC (+13.5% q/q).
Source: Australian Bureau of Statistics, RPM Research, Data & Insights
• Owner-occupier demand remains heavily skewed toward established housing, driven by immediate availability and limited new supply.
• 79,818 loans nationally (+12.1% q/q; +7.7% y/y) — dominant segment (~73% of OO lending).
• Strong growth in NSW (+16.1% q/q; +13.8% y/y) and ACT (+19.8% q/q; 17.5% y/y).
• Land demand is accelerating, supported by affordability-driven buyers and growth corridor activity.
• 6,159 loans nationally (+11.7% q/q; +13.2% y/y).
• Strong growth in NSW (+26.1% y/y) and WA (+27.3% y/y).
Source: Australian Bureau of Statistics, RPM Research, Data & Insights
National average loan: $637,422 (+6.3% q/q; +9.6% y/y).
• Loan values remain elevated nationally, with strongest growth in more affordable states ( QLD, SA, WA ).
• The spread highlights a clear affordability hierarchy across product types.
• Strongest growth in QLD (+14.7%), SA (+13.9%), WA (+12.0%).
• NSW ($756k) remains the highest nationally, followed by QLD ($619k) and VIC ($606k).
Construction of a Dwelling
Newly Erected Dwelling Established Dwelling
Residential Land Alteration & Additions Total Average Value
$500,000
$450,000
$400,000
$350,000
$300,000
$250,000
$200,000
$150,000
$100,000
$50,000
$0
Source: Australian Bureau of Statistics, RPM Research, Data & Insights
• Construction lending is growing strongly, reflecting ongoing build cost inflation and demand for new housing supply.
• National average loan: $686,708 (+2.1% q/q; +10.7% y/y).
• Strong annual growth across major states: QLD (+12.6%), WA (+12.6%), SA (+13.2%), NSW (+11.0%).
• Newly built product is losing some momentum, with softer growth relative to construction and established markets.
• National average loan: $696,330 (+0.9% q/q; +3.2% y/y).
• QLD ($754k) and NSW ($769k) remain the highest major markets. Source: Australian Bureau of
• Established housing is attracting the largest loans and strongest growth, highlighting ongoing competition for limited existing supply.
• National average loan: $744,915 (+6.9% q/q; +11.0% y/y) — highest across all major segments.
• Strong growth in WA (+17.3%), QLD (+16.2%), SA (+13.9%).
• Land is the key affordability lever, with strong growth highlighting continued demand for entry-level product.
• National average loan: $431,093 (+5.1% q/q; +13.5% y/y).
• Strong growth in QLD (+21.7%), SA (+18.4%), WA (+18.2%).
Source: Australian Bureau of Statistics, RPM Research, Data & Insights
• Renovation lending is growing strongly, suggesting households are upgrading in place rather than transacting.
• National average loan: $237,242 (+4.5% q/q; +15.0% y/y) — smallest loan size segment.
• Strong growth in WA (+20.1%), VIC (+19.8%), QLD (+14.9%).
• Borrowing is shifting toward established housing and land, with loan sizes rising fastest in more affordable states, highlighting persistent supply constraints and affordability pressures.
Source: Australian Bureau of Statistics, RPM Research,
Owner-occupier demand has rebounded strongly, with broad-based growth indicating improving confidence and borrowing capacity.
• 69,777 loans nationally (+19.0% q/q; +18.8% y/y), well above the 3-year average (+12.4%).
• Strong growth across all major states, led by NSW (+22.1% y/y) and QLD (+20.5% y/y).
Investor lending is accelerating rapidly, outpacing owner-occupiers and signalling a clear shift toward investor-led market activity.
• 45,402 loans nationally (+13.3% q/q; +31.9% y/y) — fastest growing segment.
• Strong growth in VIC (+40.8% y/y), QLD (+31.8% y/y) and NSW (+29.1% y/y).
• Largest markets: NSW (17,210), QLD (9,952) and VIC (9,718).
• Short-term: Lending has tilted back toward owner occupiers.
• Long-term: Investor activity has strengthened, particularly in NSW, WA and NT , driving a more balanced national lending profile.
• Quarter-on-quarter (Dec-25 vs Sep-25) saw a broad uplift across most states, led by:
• NT (+5pp) and ACT (+4pp).
• Moderate increases across NSW (+2pp), SA (+2pp), QLD (+1pp), WA (+1pp).
• VIC remained stable (66%), while TAS declined (-2pp).
Source: Australian Bureau of Statistics, RPM Research, Data & Insights
• Business lending has surged to record levels, led by strong investment in plant and equipment, with vehicle lending remaining elevated but stabilising.
• All lending categories have trended upward since 2023, marking a clear recovery phase post tightening cycle.
• Plant & equipment dominates lending composition, while vehicles show higher volatility but strong recent growth.
• The sharp lift in Dec-25 suggests a strong end-of-year surge in business activity.
Total Lending (All Business Lending)
• $3,915.5bn in Dec-25, up from $3,460.6bn in Sep-25 and $3,441.5bn in Dec-24.
• Represents a strong quarterly rebound (+13%) and continued upward trend since 2023.
• Lending has reached a new cyclical high, well above pre-COVID levels (~$2,300–2,800bn range).
Jan-2024 Feb-2024 Mar-2024 Apr-2024 May-2024 Jun-2024 Jul-2024 Aug-2024 Sep-2024 Oct-2024 Nov-2024 Dec-2024 Jan-2025 Feb-2025 Mar-2025 Apr-2025 May-2025 Jun-2025 Jul-2025 Aug-2025 Sep-2025 Oct-2025 Nov-2025 Dec-2025
Source: Australian Bureau of Statistics, RPM Research, Data & Insights



Total Aprovals 50,625
Detached Houses
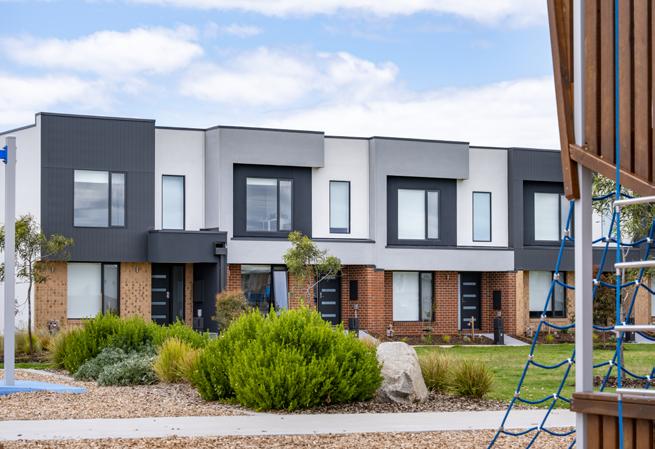
Townhomes
• Market remains above 2023 trough levels (37k–43k) but below COVID peak (62k in Jun-21).
• Moderate recovery continues, but overall activity remains structurally constrained vs peak levels.
• Continues to represent the largest share of total activity (~58%).
• Volumes broadly stable over the past 12–18 months.
• Detached housing remains the core market, but growth is relatively modest.
• Strongest growth across low-density formats.
• Now accounts for ~17% of total approvals.
• Key growth segment, reflecting the shift toward medium density and affordabiliy driven product.
• Highly volatile, with a sharp quarterly decline following a Sep-25 spike (1,548).
• Remains a small component of total supply (~2%).
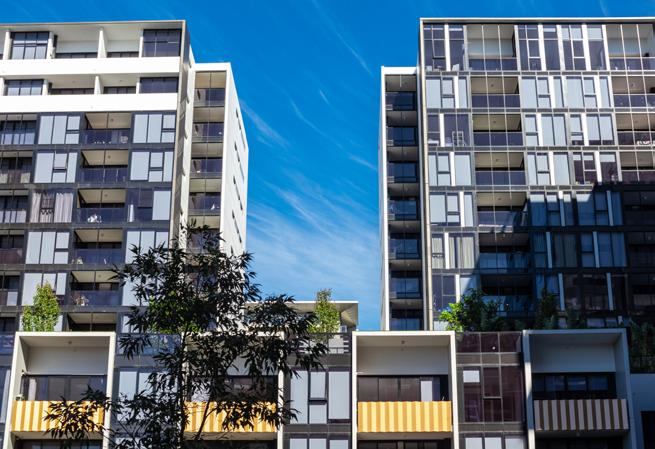
• ~23% of total approvals.
• Volumes have stabilised after a prolonged decline (2022–2023).
• High-density approvals are stabilising, but recovery remains gradual and below historical highs.
Detached Home Approvals by State
• Detached demand remains resilient, led by WA and NSW, while VIC continues to lag.
Townhome Approvals by State
• Townhomes are expanding across all major states, with SA and WA leading the shift toward medium density.
Source: Australian Bureau of Statistics, RPM Research, Data & Insights
Apartment Approvals (1-3 Storeys) by State
Apartment Approvals (4+ Storeys) by State
• Low-rise apartment activity is improving annually, but remains highly volatile and project-driven.
• High-density recovery is uneven, with WA and QLD driving growth, while VIC remains materially constrained.
Source: Australian Bureau of Statistics, RPM Research, Data & Insights


Commencements 51,195
Commencements 30,600
Dwelling Commencements 20,595
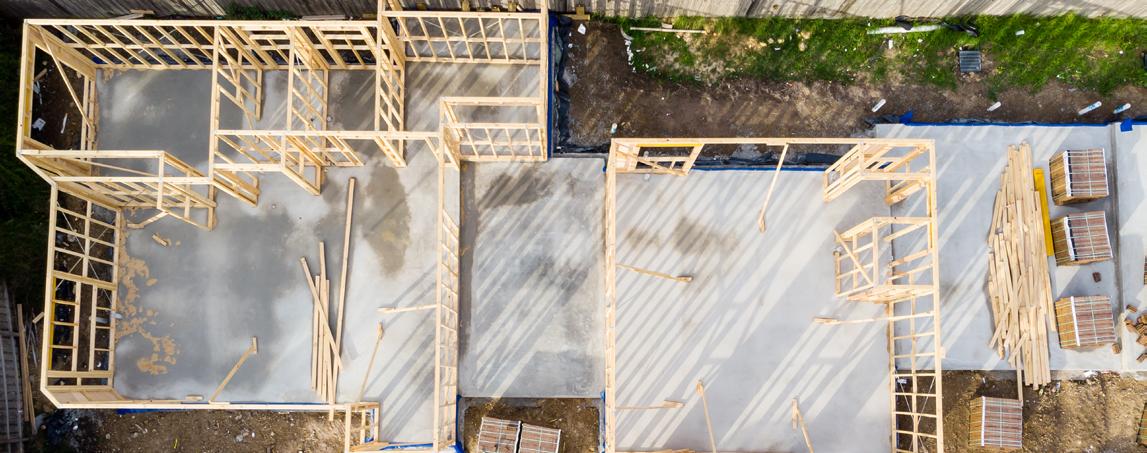
• Dwelling commencements are rebounding nationally (+11.5% y/y), driven by a recovery in medium and high-density construction, particularly in QLD and SA .
• This positive end to 2025 is likely to be short lived construction costs will likely spike on the back of the supply disruptions in the middle east.
• Detached construction is stabilising, but growth remains modest and uneven across states.
• Despite recent uplift, activity remains slightly below the 3-year average (-0.8%).
• This uplift is partly driven by a low base, particularly through 2022–2023 where approvals and commencements were suppressed.
• Activity remains highly sensitive to construction costs, feasibility and funding conditions.
• The recovery is fragile and unlikely to sustain at current growth rates, given current market risk and impact to construction inputs.
• Total commencements forecast to increase +16.7% nationally.
• Growth is skewed toward other dwellings driving the uplift.
• The outlook is highly sensitive to global conditions, including geopolitical tensions, supply chain disruption and construction cost volatility, which may delay or defer project delivery.
Source: Australian Bureau of Statistics, Housing Industry Association, RPM Research, Data & Insights
Detached House Commencement Forecast Other Dwellings (Townhomes & Apartments) Forecast
• Moderate growth (+9.3%), led by WA, QLD and SA, while NSW and VIC remain flat
• Nevertheless, detached housing is exposed to input cost volatility (materials, trades) and interest rate sensitivity, with global factors potentially constraining builder margins and slowing delivery
• Strong forecast growth (+29.6%), driven by a rebound from a low base and increased medium/high-density supply
• This segment faces the greatest risk, with feasibility highly sensitive to: global construction cost pressures, financing conditions and capital availabilit, geopolitical uncertainty impacting materials and delivery timelines



Total Completions
45,329
28,050
+10.0% q/q; -0.1% y/y -1.3% q/q and -5.4% y/y
• The uplift is being driven by higher-density completions, while detached housing continues to trend weaker.
• Over the medium term, completions remain broadly flat (+0.2% vs 3-year average) — reinforcing persistent supply constraints.
• Most major states are contracting: NSW : -14.9% y/y, VIC : -0.3% y/y (flat), QLD : -1.9% y/y, WA : -7.7% y/y, only NT shows growth (+10.2% y/y), albeit from a small base .
• Detached housing delivery remains constrained and below historical levels (-4.9% vs 3-yr ave.
• Reflects lagged impact of higher construction costs, builder capacity constraints and weaker commencements through 2023–2024.
Dwellings (Medium/High Density)
17,279
q/q and +9.9% y/y
• Strongest growth in: NSW : +63.5% y/y, QLD : +12.1% y/y, TAS : +51.1% y/y. VIC and WA remain weaker (-24.0% y/y and -24.9% y/y respectively).
• The rebound is partly cyclical and coming off a low base.
• Despite recent growth, the segment is only +3.1% above its 3-year average, suggesting no structural uplift yet.
Michael Staedler General Manager Research, Data & Insights m.staedler@rpmgrp.com.au
The outlook for Australia’s economy and housing market is shifting from gradual recovery to increasing uncertainty.
While conditions improved through 2025, momentum is expected to moderate over 2026 as inflationary pressures re-emerge, driven by global supply disruptions and rising input costs. This is likely to keep interest rates higher for longer, continuing to constrain borrowing capacity and household demand.
Housing demand is expected to remain resilient but increasingly selective, supported by population growth and tight rental markets. However, affordability constraints will continue to shape behaviour, reinforcing demand for smaller, more efficient and more affordable products, as well as established housing.
On the supply side, forecasts point to a recovery in commencements, particularly across medium and high-density housing. However, this recovery is highly uncertain.
Rising construction costs, labour shortages and supply chain disruptions - exacerbated by global geopolitical tensions - are expected to place renewed pressure on feasibility and delivery timelines. These risks are most acute in higherdensity projects, where margins remain tight.
As a result, a portion of forecast supply is unlikely to be realised, particularly in the short to medium term.
Completions are expected to remain constrained, reflecting the lagged impact of weaker commencements and ongoing delivery challenges. Detached housing is likely to remain subdued, while higher-density delivery remains volatile.
Overall, while demand fundamentals remain strong, the supply response is likely to remain constrained, with downside risks increasing as global uncertainty intensifies.
For more information, please visit: www.rpmgrp.com.au
Our Research Consultancy Services create bespoke reports crafted to your specifications, translating rich data into in-depth analysis. For a bespoke report, email the team at: contactus@rpmgrp.com.au
Research, Data & Insights

Michael Staedler
General Manager
Research, Data & Insights m.staedler@rpmgrp.com.au

Andrew Raponi
Senior Research Manager
a.raponi@rpmgrp.com.au

Laurence Rao
Research Manager - VIC laurence@rpmgrp.com.au

Simon Brinkman
Research Manager - QLD simon@rpmgrp.com.au
Executive, Sales and Marketing Leadership



Paul McMahon
Chief Operating Officer paul@rpmgrp.com.au

Imogene Schaefer
General Manager
Marketing imogene@rpmgrp.com.au
Clinton Trezise
Managing Director
QLD clinton@rpmgrp.com.au


Luke Kelly
National Managing Director Built Form luke@rpmgrp.com.au
Michael Vilar
General Manager
Medium Density michaelv@rpmgrp.com.au
Peter Neale
Managing Director
QLD petern@rpmgrp.com.au



Rod Anderson
National Managing Director Communities rod@rpmgrp.com.au
Greg Rankin
General Manager
Communities gregr@rpmgrp.com.au
Tim Hyland
National Strategy Manager Transactions & Advisory tim@rpmgrp.com.au


Peter Grant
National Managing Director Business Development peter@rpmgrp.com.au
Johnathon Driessen
General Manager
Communities johnathon@rpmgrp.com.au
For detailed insights or custom reporting, contact the team at: contactus@rpmgrp.com.au